Simple Summary
Treating the PDAC (pancreatic ductal adenocarcinoma) zPDXs (zebrafish patient-derived xenografts) with chemotherapy regimens commonly used, we performed a co-clinical trial testing the predictiveness of the model. We found that zPDX may predict patient outcomes, classifying them into responders (R) and non-responders (NR), reporting a statistically significant higher cancer recurrence rate at 1 year after surgery in the NR group: 66.7 versus 14.3%. Our zPDX model seems to be a promising tool for the stratification of PDAC patients. This is a crucial starting point for future study involving more patients to obtain a method to really personalize the oncological treatment of PDAC patients.
Abstract
It is increasingly evident the necessity of new predictive tools for the treatment of pancreatic ductal adenocarcinoma in a personalized manner. We present a co-clinical trial testing the predictiveness of zPDX (zebrafish patient-derived xenograft) for assessing if patients could benefit from a therapeutic strategy (ClinicalTrials.gov: XenoZ, NCT03668418). zPDX are generated xenografting tumor tissues in zebrafish embryos. zPDX were exposed to chemotherapy regimens commonly used. We considered a zPDX a responder (R) when a decrease ≥50% in the relative tumor area was reported; otherwise, we considered them a non-responder (NR). Patients were classified as Responder if their own zPDX was classified as an R for the chemotherapy scheme she/he received an adjuvant treatment; otherwise, we considered them a Non-Responder. We compared the cancer recurrence rate at 1 year after surgery and the disease-free survival (DFS) of patients of both groups. We reported a statistically significant higher recurrence rate in the Non-Responder group: 66.7% vs. 14.3% (p = 0.036), anticipating relapse/no relapse within 1 year after surgery in 12/16 patients. The mean DFS was longer in the R-group than the NR-group, even if not statistically significant: 19.2 months vs. 12.7 months, (p = 0.123). The proposed strategy could potentially improve preclinical evaluation of treatment modalities and may enable prospective therapeutic selection in everyday clinical practice.
1. Introduction
Pancreatic ductal adenocarcinoma (PDAC) is a high-malignancy disease with rapid progression and poor prognosis. PDAC originates in the exocrine pancreas and it accounts for more than 90% of all pancreatic neoplasms [1]. In 2021, it is estimated that pancreatic cancer will be the third-leading cause of cancer death worldwide, with a 5-year overall survival rate lower than 5% and a median survival time of 7–11 months [2]. The incidence of PDAC has been steadily rising since 2004 in European countries, as well as in the U.S., and it is projected to nearly double the number of cases by 2030, becoming the second-most-common cause of cancer-related deaths [3]. The poor prognosis is due to the limited predictive biomarkers for early detection [4].
Neoadjuvant or adjuvant cytotoxic chemotherapy in association with PDAC resection represents the current standard of care, but the benefits in term of survival are often modest [5]. Overall, clinical studies have shown that many PDAC patients have chemorefractory disease, and a significant response to chemotherapy is exhibited just by a small subgroup [6].
In this scenario, the challenge is to discover and develop novel safe and more effective therapies, and, at the same time, the necessity of new predictive tools to test the clinical performance of therapies to improve survival and quality of life for patients is increasingly evident [7].
Nowadays, the promising PDAC preclinical models are the patient-derived organoids (PDO), such as an in vitro system wherein progenitor cells are cultured in 3 dimensions (3D) with the possibility of reconstituting niches more similar to PDAC [8,9] or in vivo patient-derived xenografts (PDXs) with zebrafish (zPDX, Danio rerio) or mouse (mPDX, Mus musculus) as recipients [10,11]. PDXs are developed by implanting patient tumor tissue or primary cells into the animal models, recapitulating and maintaining the main features of the original tumor, and they can be used in drug efficacy studies [12,13,14,15,16,17]. Numerous studies have highlighted the application of PDO and PDX in the emerging field of personalized cancer medicine, and it is commonly accepted that these clinically relevant preclinical models could be crucial in accurately predicting patient response in clinical trials [18,19]. However, the generation of mPDX requires a large amount of tissue, and they take months to establish [20], as well as the PDO that need long experimental time to reach a stable culture [21].
Therefore, in this study, we present the outcome of the first zebrafish larval co-clinical trial [22] conducted by our research group [10,23], adding a comparison of the tests performed on zPDXs with clinical data on responses to adjuvant chemotherapy, with the aim of addressing the question: “Will a specific patient benefit from a chemotherapy regimen?”. Compared to the well-consolidated procedure of isolated cancer-cell xenografts, we adopted an approach consisting of the xenotransplantation of pieces of the patient tumor tissue into zebrafish embryos, which have not yet developed an adaptive immune response (XenoZ, NCT03668418). Treating the PDAC zPDXs with chemotherapy regimens commonly used in clinics, we tested the predictiveness of the model for assessing patient profiles in terms of being a responder/non-responder to chemotherapy, which may have implications for making clinical decisions in everyday clinical practice.
2. Results
2.1. Clinical Data of PDAC Patients
From July 2018 to June 2020, a total of 31 patients with PDAC were enrolled (Table 1).

Table 1.
Characteristics of the PDAC patients enrolled (n = 31).
Of these, 18 (58.1%) were male. The mean age was 71.8 ± 8.2 years (range 44–85), and the mean BMI was 25.5 ± 4.4 (range 17.6–40.4). A pancreatoduodenectomy was performed in 23/31 (74.2%) patients, a distal splenopancreatectomy in 7/31 patients (22.6%) and a total splenopancreatectomy in 1/31 (3.2%) patients. An associated vascular resection was performed in 3/31 (9.7%) patients: a venous resection in two cases and a resection of the celiac trunk in one case. No intra-operative complications were reported, and, in all cases, it was possible to take a fragment of the tumor from the surgical specimen for xenotransplantation in zebrafish embryos. The histological examination confirmed the presence of a PDAC in all cases. A moderately differentiated adenocarcinoma (G2/3) was reported in 23/31 (74.2%) cases, while a poorly differentiated adenocarcinoma (G3/3) was reported in 8/31 (25.8%) cases. The mean diameter of the pancreatic neoplasia was 3.2 ± 1.0 cm (range 1.5–5.0). The mean number of harvested lymph nodes was 39.5 ± 16.6 (range 17–74), while the mean number of positive lymph nodes was 5.2 ± 4.7 (range 0–22). The presence of positive lymph nodes was documented in 29/31 (93.5%) patients: a N1 status was reported in 12/31 (38.7%) patients, while a N2 status was reported in 17/31 (54.8%) patients. The presence of perineural infiltration was reported in 24/31 (77.4%) patients, while angioinvasion was reported in 3/31 (9.7%) patients. Histological examination confirmed the presence of vascular infiltration in 2/3 cases of vascular resection.
2.2. Zebrafish Trial
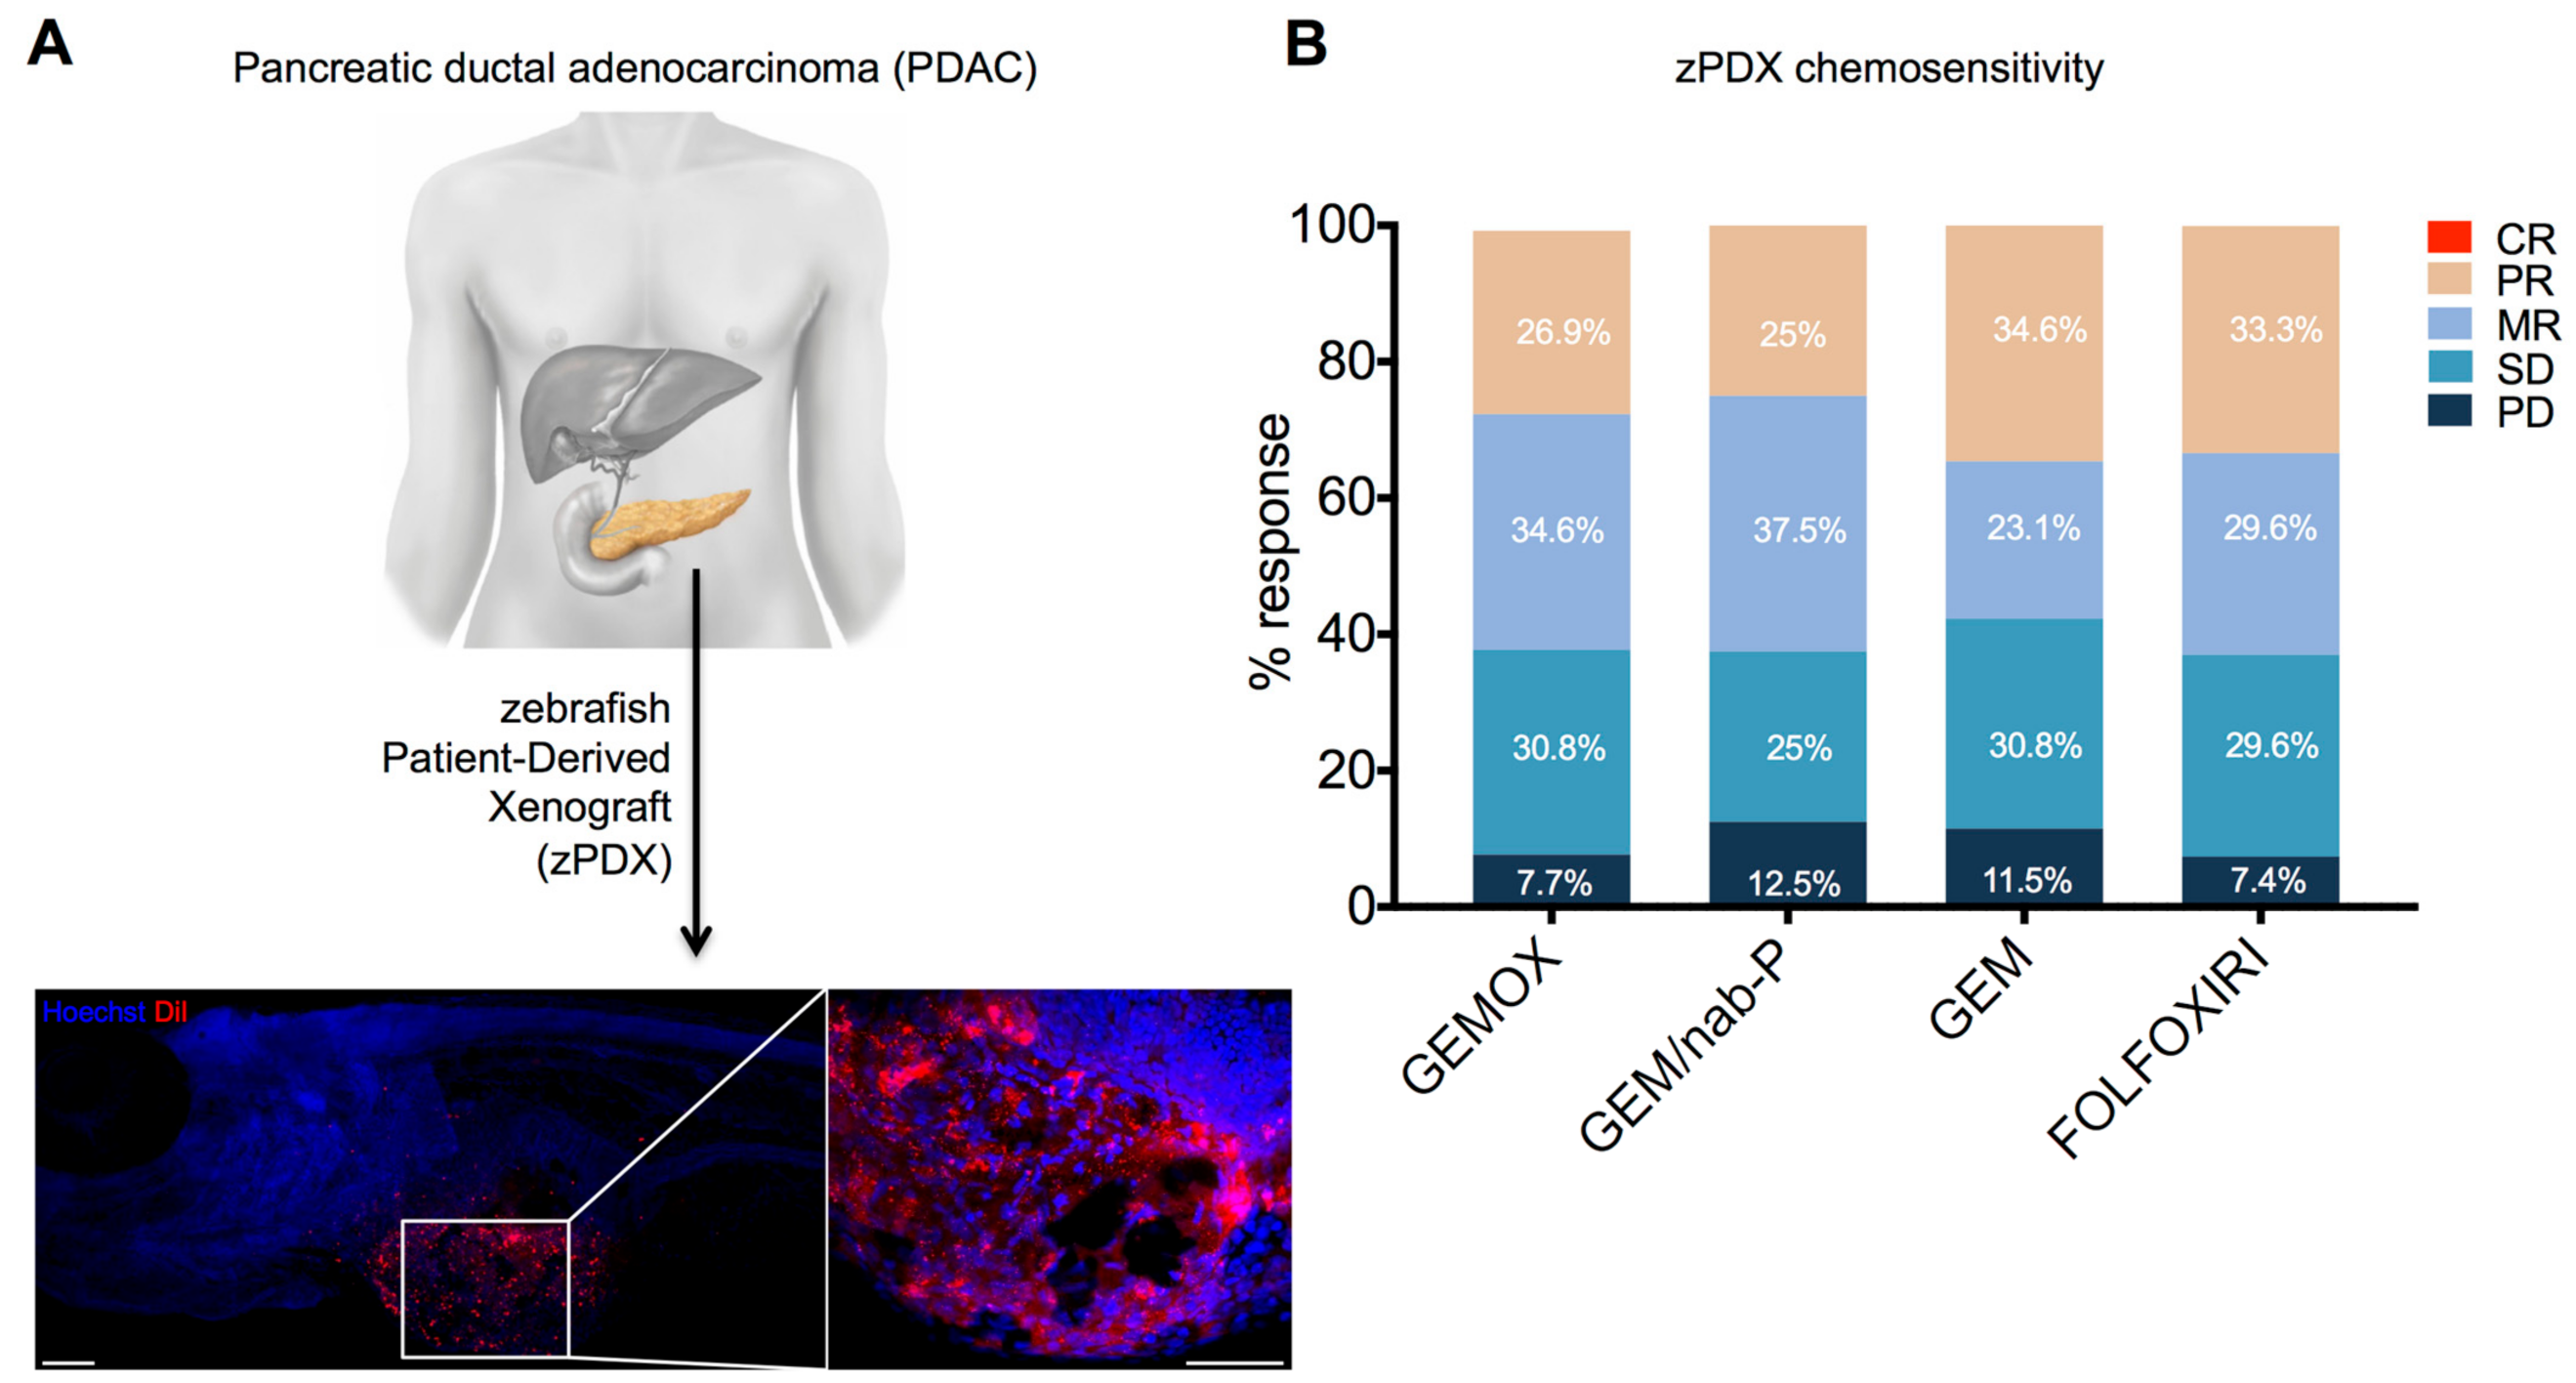
We obtained 31 human samples from PDAC primary tumors isolated from surgical resections and we successfully generated 27 zPDXs (efficiency of 87%) (Figure 1A).
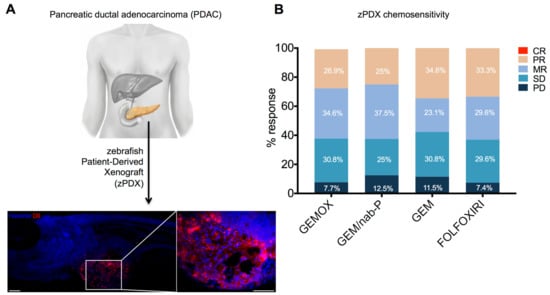
Figure 1.
Zebrafish patient-derived xenograft model and type of response to chemotherapy drugs. (A) zPDXs were established from the transplantation of fresh PDAC human tissue (DiI-labeled) into the perivitelline space of 2 dpf zebrafish embryos. zPDXs were then treated with GEMOX, GEM/nab-P, GEM and FOLFOXIRI for two days to detect their chemosensitivity profile. Representative image on the bottom (the right image is the magnification of the white-delimited area). Scale bars = 50 µm. (B) Percentage of progressive disease (PD), stable disease (SD), minor response (MR), partial response (PR) and complete response (CR). No statistically significant differences were detected by a Chi-square test. (n = 26, 24, 26, 27 zPDXs, respectively, for GEMOX, GEM/nab-P, GEM and FOLFOXIRI).
For the zPDXs of PDAC, we observed a progressive disease (PD) in 7.4%, 7.7%, 11.5% and 12.5% of cases, respectively, with FOLFOXIRI, GEMOX, GEM and GEM/nab-P. Furthermore, 25% and 29.5% of SD was observed, respectively, with GEM/nab-P and FOLFOXIRI, and 30.8% of SD both for GEMOX and GEM. MR was detected in 23.1%, 29.6%, 34.6% and 37.5%, respectively, with GEM, FOLFOXIRI, GEMOX and GEM/nab-P. Furthermore, 34.6% PR with GEM and 33.3% with FOLFOXIRI, 26.9% PR with GEMOX and 25% with GEM/nab-P were all observed. No CR was observed for any of the chemotherapy treatments (Figure 1B). No statistically difference was detected (p = 0.964).
2.3. Data Modelling
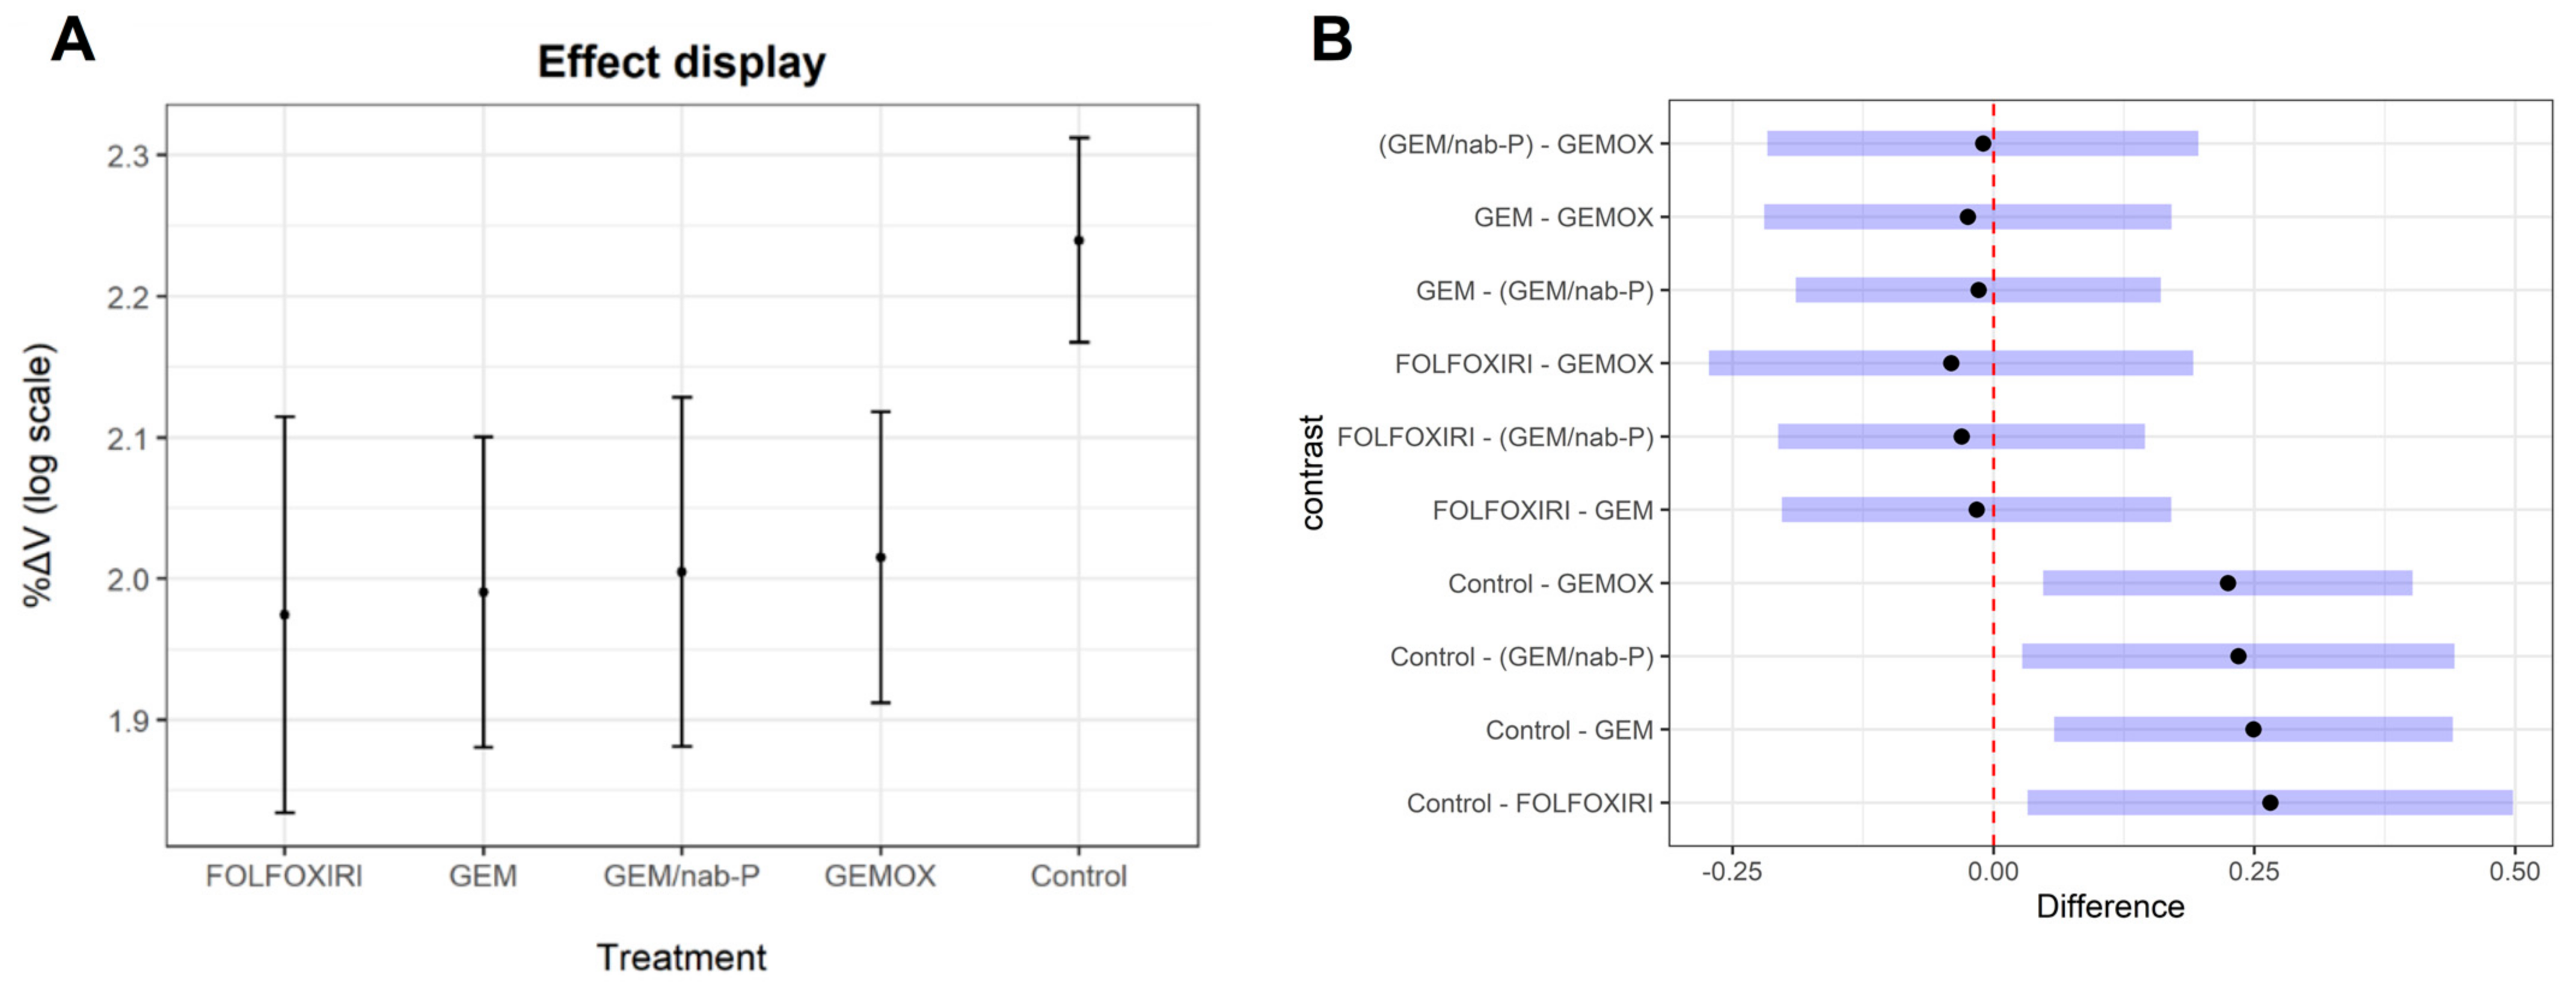
LMM showed that, compared to controls, all the treatments induced a significant reduction of tumor mass (Figure 2A, Table S1).
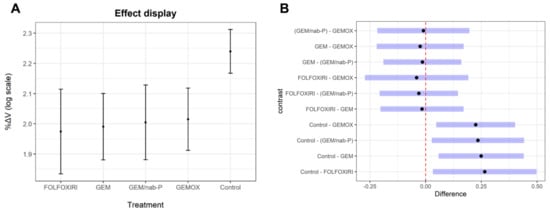
Figure 2.
Effects of chemotherapy drugs in the linear mixed effect model. (A) Effect displays. The treatments are displayed on the x-axis. Dots identify the fixed effect values of %ΔV estimated by LMM. The bars are the 95% CI of fixed values. (B) Post-hoc test results. Pairwise comparisons are on the y-axis, and the differences of marginal means between treatments are on the x-axis. Blue bars represent the 95% CI of means differences. The dashed line is a difference equal to zero between means.
The post hoc tests indicated that all the proposed treatments caused a regression of the tumor volume, but no results were significantly different from the others (Figure 2B).
Regarding the zPDX tumor behaviors with respect to population mean, we observed a significant reduction of tumor mass with FOLFOXIRI in 3 out of 20 zPDXs (15%) and in 4 out of 20 zPDXs (20%) both in GEM and GEM/nab-P, whereas GEMOX did not show any significant reduction of volume (Figure S1).
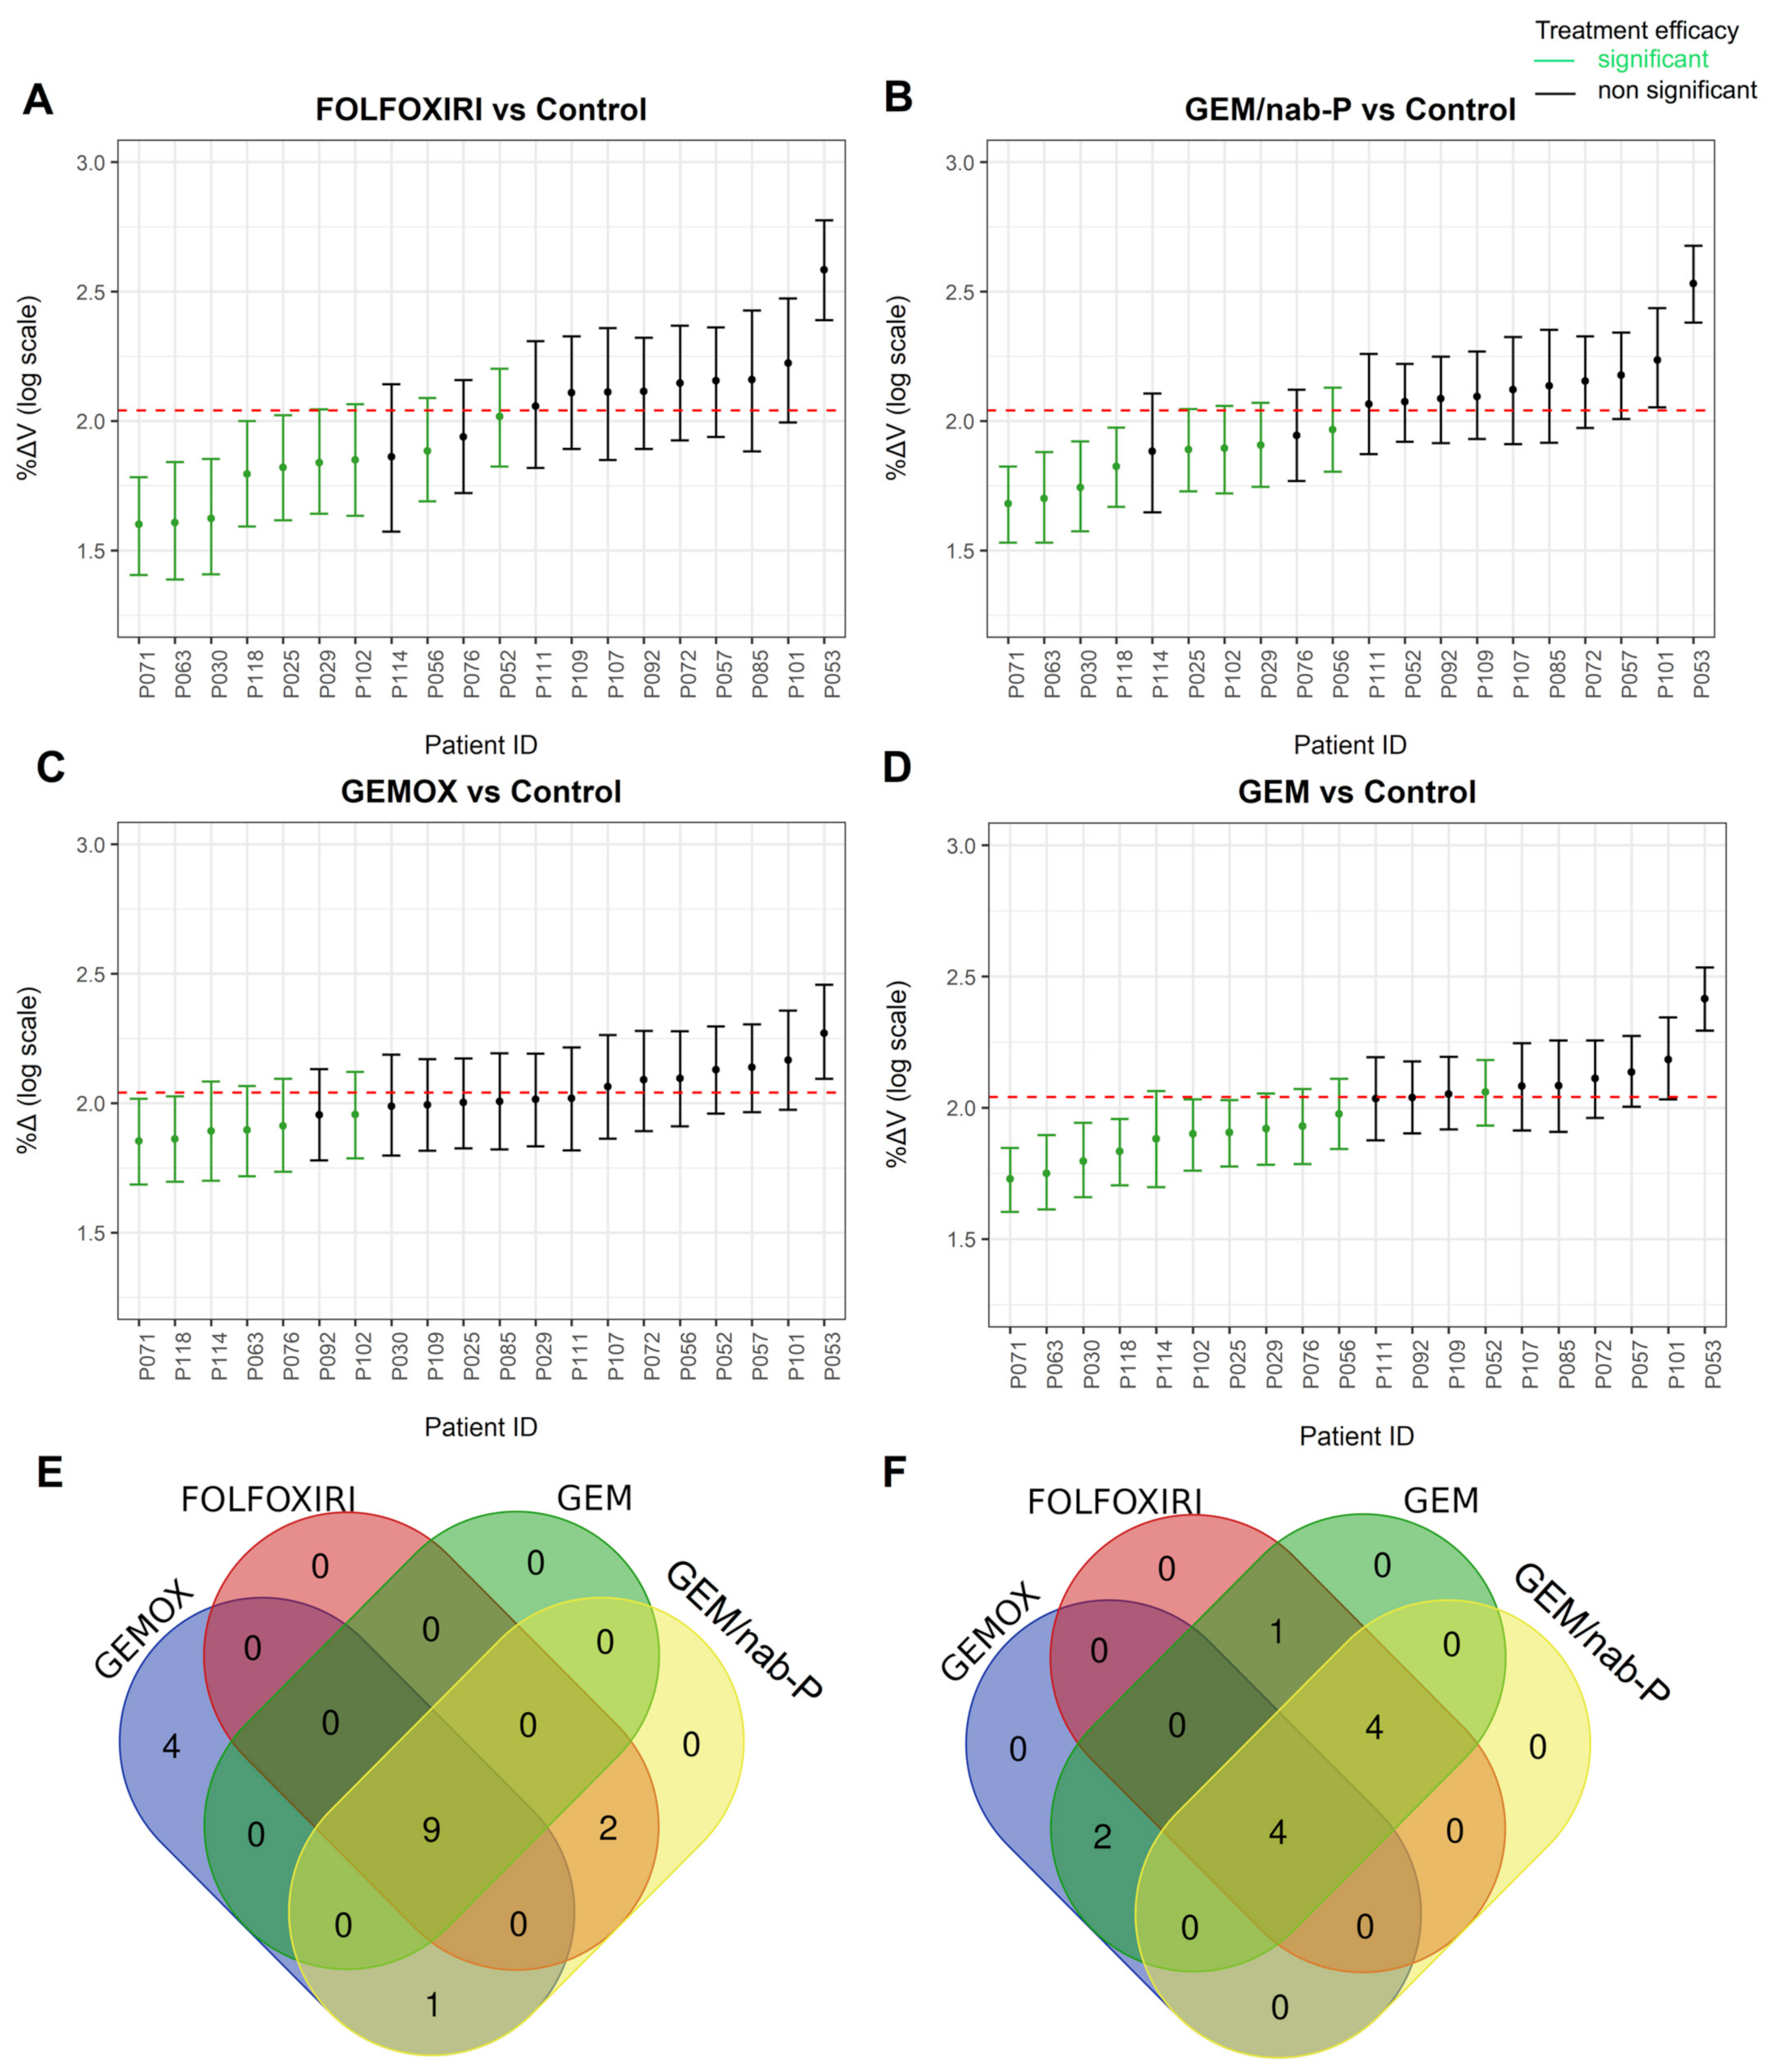
Analysis of predicted %ΔV and 95% CI showed that FOLFOXIRI was statistically significant efficient in 9/20 cases (45%) with respect to the control group, and in 5/20 cases (25%) with respect to 0 on the log scale (Figure 3A). GEM/nab-P treatment was statistically significant effective in 8/20 zPDXs (40%) with respect to controls, and in 4/20 zPDXs (20%) with respect to 0 on the log scale (Figure 3B). GEMOX was observed significantly efficient in reducing tumor volume with respect to the control group in 6/20 zPDXs (30%) and in 2/20 zPDXs (10%) with respect to 0 on the log scale (Figure 3C). zPDXs treated with GEM registered a significant reduction of tumor volume in 11/20 cases (55%) with respect to the control group, and in 6/20 cases (30%) with respect to 0 on the log scale (Figure 3D). Intersecting the zPDXs that responded non-significantly with the types of chemotherapy, it was possible to observe how zPDXs that did not respond significantly did so for all four schemes in 9/16 (56.3%) or for most of the schemes in 3/16 (18.8%) (Figure 3E). On the other hand, it was possible to observe how zPDXs that responded significantly did so for either all four schemes in 4/11 (36.4%) or for three schemes in 4/11 (36.4%) (Figure 3F). The predicted values for each zPDX are reported in Figure S2.
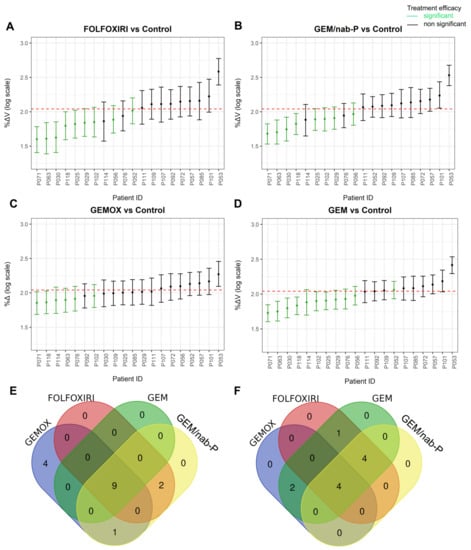
Figure 3.
Analysis of LMM predicted %ΔV and 95% CI for each chemotherapy scheme. Predicted values of %ΔV and 95% CI in (A) FOLFOXIRI, (B) GEM/nab-P, (C) GEMOX and (D) GEM. These values were obtained by adding the LMM fitted values of fixed effects to random values and to their simulated 95% CI. The dashed line is 0 on the log scale. The 95% CI above and intersecting the line identify zPDXs with a non-significant reduction of tumor volume. The 95% CI below and not intersecting the line are zPDXs with a significant reduction of tumor volume. Green bars are zPDXs in which tumor mass is significantly reduced compared to control. To determine the significant reduction of tumor volume with respect to control, we overlapped the 95% CI of treatments and control groups. Patient enrollment codes are reported (P = pancreas). (E) Intersection sets of zPDX classified as “non-significant” and (F) “significant” in Figure 3 (table data with the list of patient codes is provided as Table S1).
2.4. Comparison of zPDX Drug Treatment with Short-Term Patient Treatment Responses
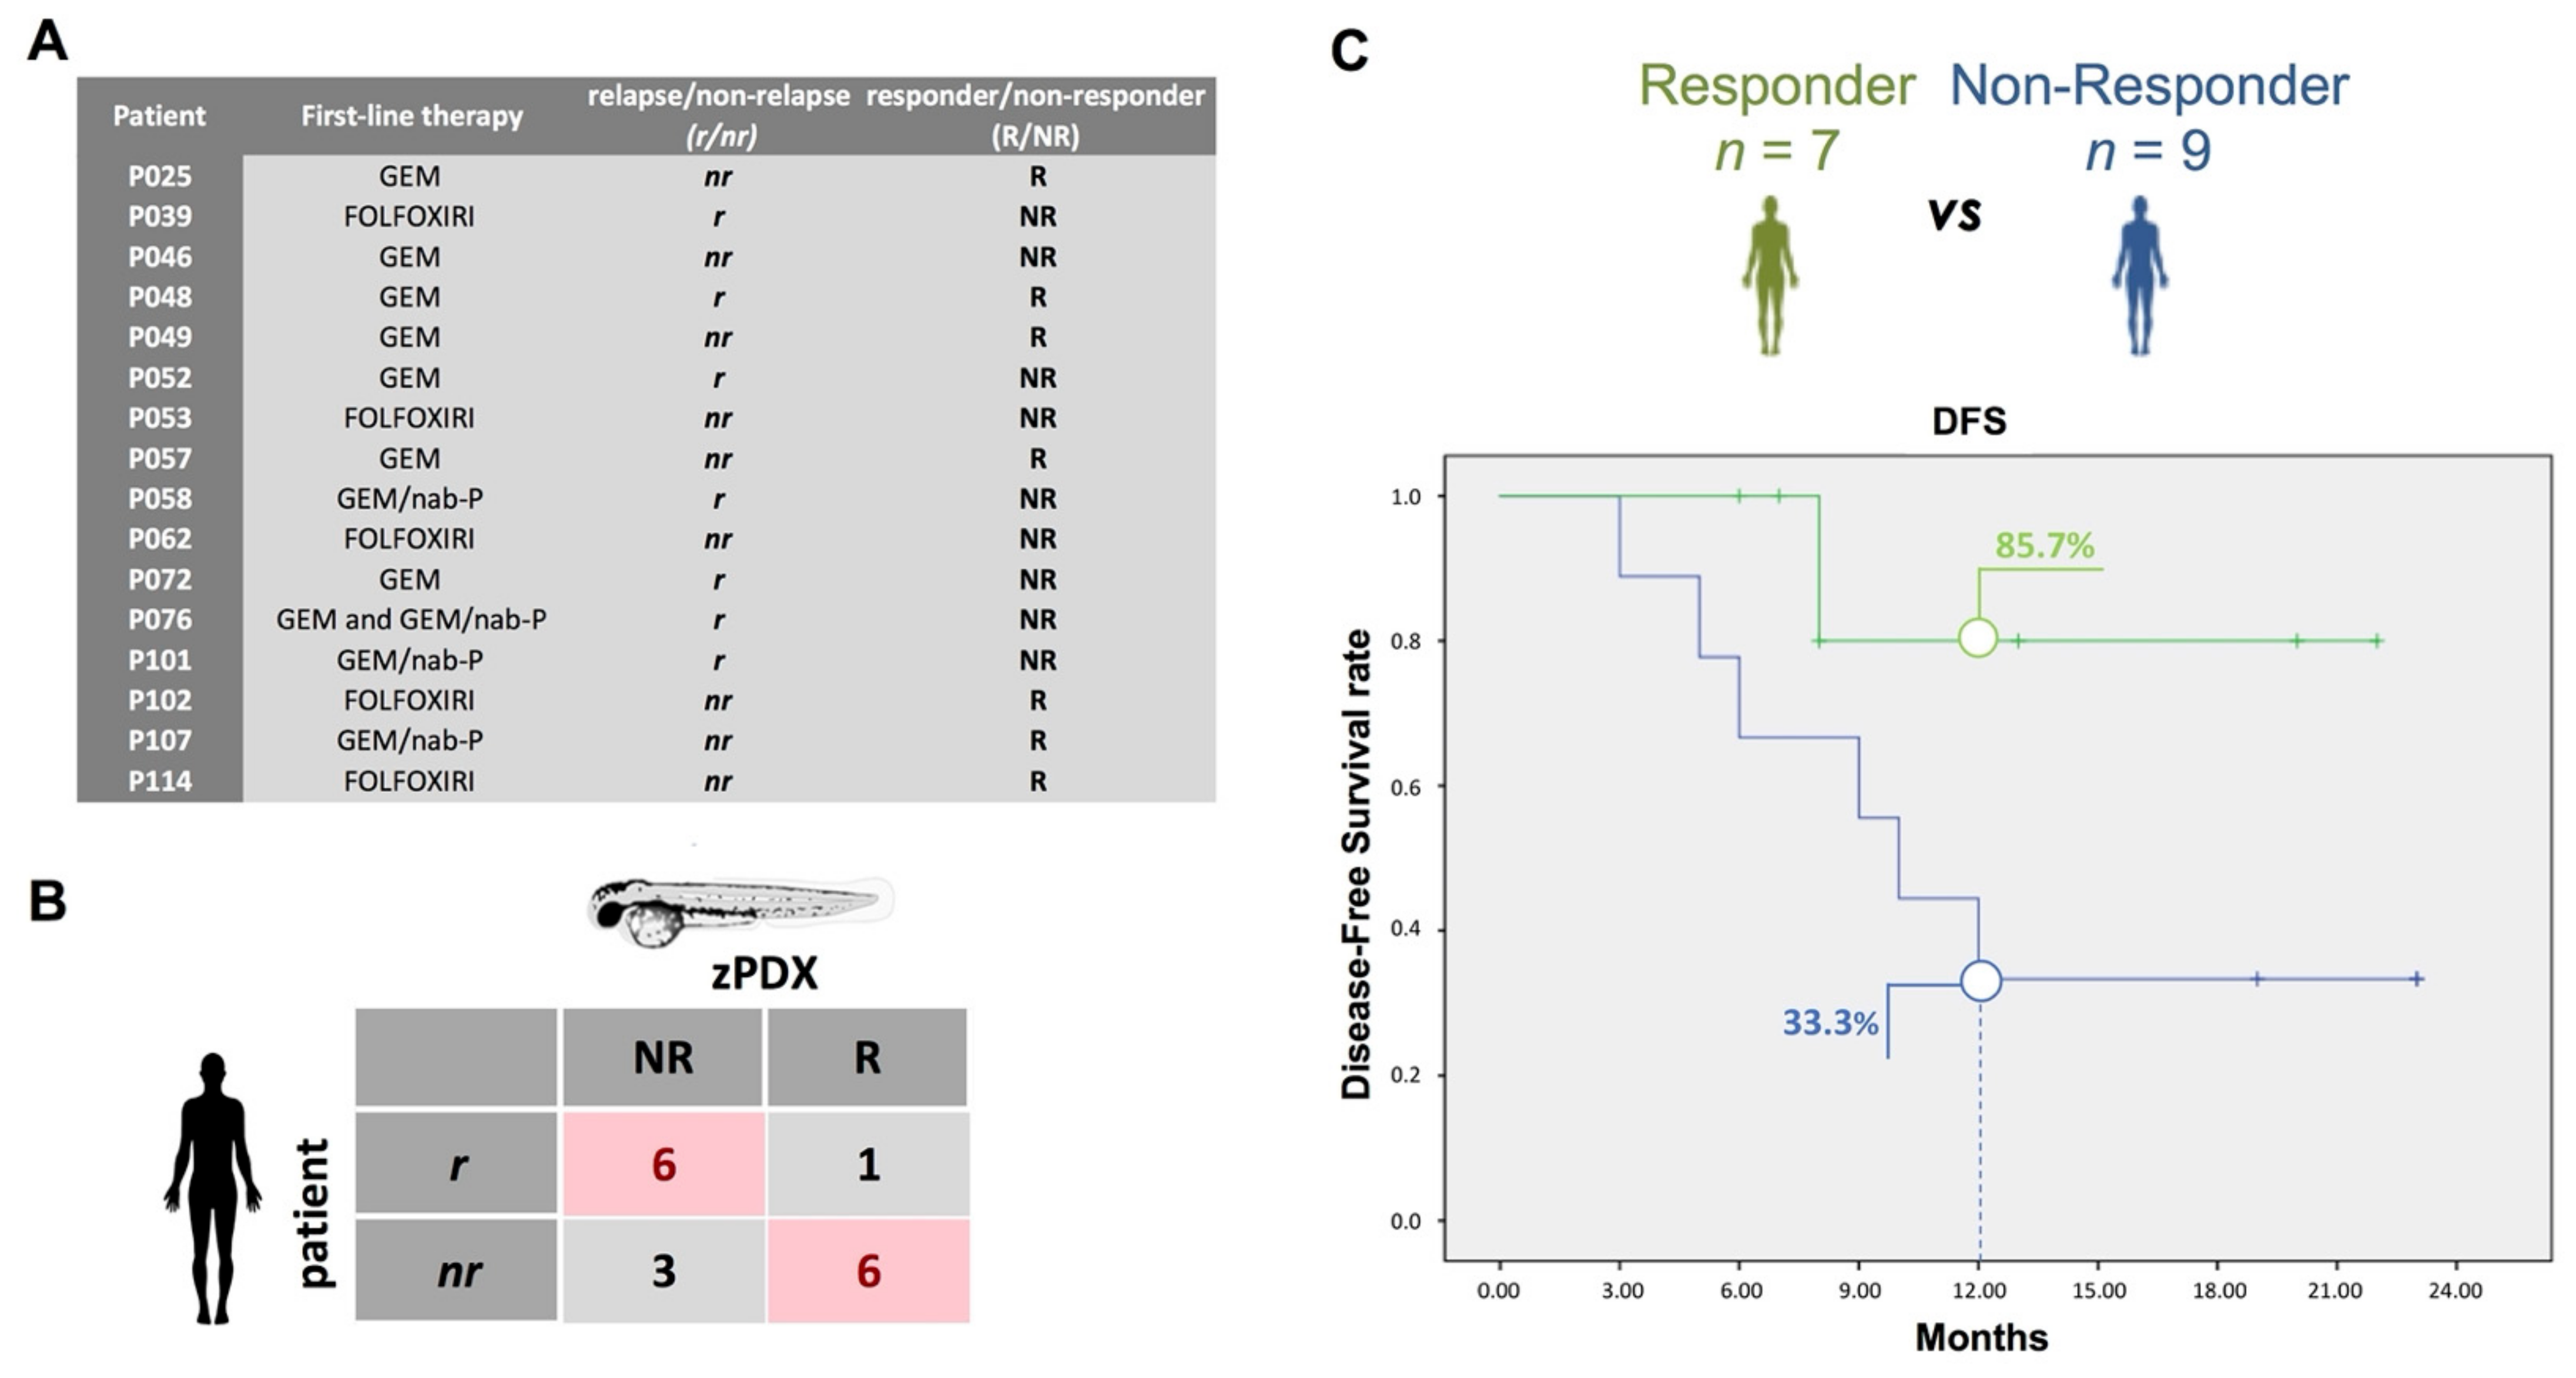
Of the 31 patients with PDAC enrolled, 7 patients did not receive adjuvant chemotherapy, either as a choice of the patients or due to poor recovery after surgery; 2 patients died after the surgical operation; 3 patients received an adjuvant chemotherapy scheme not tested in zPDX; in 2 cases, we reported a high mortality rate of the zPDX or tumor tissue that did not engraft in zebrafish embryos, and one patient dropped out of the co-clinical trial. For 16 cases, we had both oncological information obtained during follow-up, in term of relapse/non relapse (Figure 4A), and the zPDX chemosensitivity profile (Figure 4B).
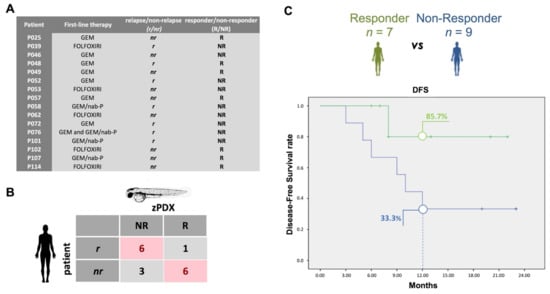
Figure 4.
Analysis of the follow-up data in comparison to the prediction of the zPDX. (A) Relapse/non-relapse (r/nr) information for 16 PDAC patients enrolled in Table 2 versus the respective responder/non-responder (R/NR) zPDXs. We considered relapse when the patient has the clinical evidence of recurrence within one year after surgery. The zPDX treatment response may predict an early relapse (r) or a better response to therapy (non-relapse, nr). Sixteen PDAC zPDX, corresponding to patients subjected to curative surgery and postoperative adjuvant treatment, were treated with GEM, GEM/nab-P, GEMOX and FOLFOXIRI for 2 days. The zPDX response to treatment was analyzed and quantified adapting the WHO criteria for tumor response. We considered responder (R) zPDX with a decrease ≥50% in the relative tumor area. (B) Confusion matrix highlights the number of no cancer relapse (nr) in patients with the own responder (R) zPDX and the number of cancer relapse (r) in patients with the own non-responder (NR) zPDX. (C) Disease-free survival difference in R group (green) and NR group (blue), p = 0.123 by log-rank test.
The median follow-up was 19.5 months (range 5–23 months). Seven of these patients (43.8%) had a cancer recurrence during the follow-up, and all of these recurrences occurred during the first year after surgery (Figure 4A) with a median disease-free survival (DFS) of 12 months.
Of the sixteen patients, we observed a responder zPDX with the same chemotherapy scheme used as adjuvant treatment in 7 (43.75%) cases (Responder-group, R). At one year after surgery, the patients of the R-group reported cancer recurrence in only 1/7 patient (14.3%), while the patients of the NR-group (NR) reported cancer recurrence in 6/9 cases (66.7%) (Figure 4C, p = 0.036 by a Chi-square test). No statistical differences were detected in the clinical data between the R-group and the NR-group (Table 2); also, no differences were found in terms of the type of adjuvant chemotherapy schemes and mean follow-up between the two groups.

Table 2.
Clinical and biological characteristics of PDAC patients eligible for the follow-up (n = 16).
The mean DFS was longer in the R-group with respect to the NR-group, even if not statistically significant: 19.2 months vs. 12.7 months, p = 0.123 by a log-rank test (Figure 4C). The relative risk of recurrence is estimated to be RR = 0.21.
3. Discussion
PDAC is a highly lethal malignancy with a 5-year survival rate of 5% [2]. To date, the only potentially curative option is surgery in combination with chemotherapy [24]. Nevertheless, early recurrence and disease progression after surgery are evident in a large proportion of patients [25,26]. Improvement of the chemotherapy treatment options was obtained with the introduction of combination therapies over single-agent gemcitabine. However, better oncological outcomes, such as increased overall survival reported with FOLFOXIRI and GEM/nab-P compared to only-gemcitabine, are associated with increased incidence of adverse events [27,28]. Since effective therapeutic strategies for patients with PDAC have been difficult to identify [29], proper patient selection could be crucial to identify who may take advantage from an aggressive chemotherapy approach [30]. With this intent, the concept of personalized medicine has emerged in recent years with the aim of tailoring medical treatment to the individual characteristics of each patient, and particularly, to the tumor biology of each patient [31]. Different patient-derived tumor models, both in vitro and in vivo, have been developed, each with its own peculiarities [32,33]. The use of zebrafish embryos has several advantages with also the possibility of overcoming some drawbacks of murine xenografts, such as the larger number of tumor cells needed (about 1 million), the long time required (from several weeks to months) to have a visible tumor implant, the need of immunosuppressed animals to avoid transplant rejection and the high difficulties of generating mouse xenotransplant models able to metastasize. Moreover, the aquatic environment of the zebrafish allows one to directly dissolve the drugs in the embryo water, avoiding the burden of administering the drug to each individual animal [34,35]. With this intent, our first step was to establish and validate the equivalent of a human dose for fish that was effective both for cancer cell lines and for tumor tissue xenotransplanted in zebrafish embryos [23]. The results were very promising despite the short drug exposure and the non-physiological temperature of both the zebrafish embryos (28 °C) and the tumor cells (37 °C), which do not affect the cell engraftment, in line with the evidence collected by the previous literature [36].
The strategy that we developed in our zPDX model has the distinct advantage of preserving the tumor-associated stroma and the microenvironmental factors, maintaining the original tumor architecture and the histological characteristics, as we reported in our previous article, in which, at histological examination, we observed the presence of both epithelial cells and stromal cells, with a percentage of epithelial cells (mean PDAC counterpart) out of the total surface area similar to that of the pancreatic tumor tissue [10].
On the other hand, the lack of enzymatic digestion, adopted to retain the extracellular matrix composition and the three-dimensional structure of cancer tissues, could implicate the limitation of tumor heterogeneity being less represented in a tissue fragment than in a cellular suspension. Indeed, small tissue pieces could present high differences between each other’s in terms of benign cell populations and tumor subclones. For that reason, we proposed to overcome this criticism by increasing the number of xenografted embryos. This could also tackle the problem of the lower survival rate of our zPDX model, ascribed to the invasiveness of the transplantation technique, which is more traumatic for embryos compared to the injection of a cell suspension with microcapillaries.
It is well known that the microenvironment and tumor heterogeneity influence the response to chemotherapy treatment. Specifically, in pancreatic cancer, the microenvironment consists mostly of cancer-associated fibroblasts, immune cells, the extracellular matrix and many other secondary elements [37] that create a dense stromal fibrosis with the consequence of generating a considerable obstacle to therapeutic intervention [38]. In this context, our zPDX, which maintains the human tumor’s microenvironment, makes treating PDAC more realistic because therapies target not only the cancer cells themselves but also the stroma [39,40].
Until now, very few studies have evaluated the possibility of xenotransplant patient-derived tumor cells taken from the surgical specimen directly in zebrafish embryos to create an avatar for oncological patients with the intent to predict the type of response to adjuvant chemotherapy for solid tumors. Moreover, all of them have the limitation of a small number of patients enrolled, and none of them involved patients with pancreatic cancer. Wu et al. [14] showed a retrospective correlation with one gastric tumor patient’s clinical outcome, while Fior et al. [41], in a retrospective study, observed that colorectal patient’s avatars were predictive of patient clinical outcome in 4 out 5 patients (80%). Our study is a prospective study involving 31 PDAC patients, of whom we successfully generated 27 zPDXs with an efficiency of 87%, which is currently in line with a success rate >80% of a different preclinical model, such as PDAC organoid establishment [8,42].
From 27 zPDXs, 16 were usable for the co-clinical trial to compare the zPDX chemosensitivity profile and the clinical response to adjuvant chemotherapy.
In our preliminary experience recently published, we reported very encouraging preliminary results [10]. First, we observed the possibility of directly xenotransplanting tissue taken from PDAC in zebrafish embryos, obtaining in all cases of the control group an increase of the relative tumor area (2 dpi/1 dpi). Moreover, comparing the results of zPDX tests with data on chemoefficacy published in literature, the model seemed to reflect the different efficacy of the various chemotherapy schemes used for the treatment of patients affected by PDAC [10].
To have another line of evidence, in the current study, we performed a stratification analysis of the zPDXs, classifying them as significant and non-significant, according to the LMM analysis plotted in Figure 3. Data point out that zPDXs had a strong tendency to share the same pattern of response to treatments (Figure 3F), suggesting that zPDX models could be a preclinical platform for the assessment of drug efficacy, identifying a group of patients that are more likely to benefit from treatment.
The further crucial step of this analysis was the association of experimental data with clinical data obtained during the follow-up of the enrolled patients who had undergone adjuvant chemotherapy. To do that, we performed a proof-of-concept analysis of the co-clinical study to test our zPDX model as a platform to study response to treatment.
For 16 patients enrolled in the co-clinical trial, we tested whether response to treatment in zPDX (responder—R) would predict a delay in relapse in the matching patients (non relapse—nr), or whether resistance to drug treatment in our zPDX model (non-responder—NR) would associate with an early tumor relapse (r). In this way we obtained two groups of patients, the responder-group and the non-responder-group, of whom the first one theoretically should be associated with better oncological outcomes. The two groups did not differ in term of both histological characteristics of the tumor and mean length of follow-up. Therefore, because all of them underwent complete surgical resection of PDAC, we evaluated the response to adjuvant chemotherapy using both the cancer recurrence rate and the DFS, in accordance with the methods used by oncologists to compare the efficacy of different chemotherapy schemes in patients who had previously undergone the complete surgical resection of the neoplasm [43,44,45]. Interestingly, we reported a statistically significant higher cancer recurrence rate in the non-responder-group with a cancer recurrence in 66.7% of cases in contrast to 14.3% of cases in the responder-group. Moreover, the mean DFS results were longer in the responder-group than the non-responder-group, being respectively 19.2 months vs. 12.7 months, even if it was not statistically significant, probably due to the small sample size (Table 2, Figure 4). Thus, we could anticipate relapse/no relapse within 1 year after surgery in 12 out of 16 patients.
These results were very encouraging. In fact, we observed that our zPDX model seems to identify PDAC patients who are more likely to respond to chemotherapeutics and who are associated with favorable survival odds. This is a crucial point for the personalized medicine of PDAC patients. In fact, many PDAC patients have chemo-refractory disease, and a smaller subset exhibits significant response to chemotherapy. To date, some PDAC mutations have been individuated, such as microsatellite instability, BRCA2 mutations and potentially targetable, uncommon KRASG12C mutations that influence the chemotherapy response [8]. However, there are a considerable number of patients without these genetic alterations that would benefit from alternative treatment strategies because they will probably not respond to the current chemotherapy. However, current therapeutic selection for both local and metastatic pancreatic cancer patients is often based on patient performance status and co-morbidities. Overall, this highlights the unmet clinical need to define subgroups of chemotherapy-responsive patients to guide treatment selection and to decide alternative treatment options for patients who are resistant to currently approved treatment regimens. Therefore, the chemo-sensitivity definition of the PDAC of each patient may enable more rapid treatment stratification of PDAC patients into those who may benefit from currently available chemotherapeutic interventions and those who should instead be considered for investigational agents.
4. Materials and Methods
4.1. Human Trial
The observational prospective co-clinical trial (ClinicalTrials.gov: XenoZ, NCT03668418, study started on June 1, 2018) was conducted at the University of Pisa (Pisa, Italy) in accordance with the guidelines of the European Network of Research Ethics Committees. The local ethics committee on clinical testing approved the study (prot. n. 70213). All the donors enrolled in the study provided signed informed consent. The main inclusion criteria were 18 years-of-age or older patients diagnosed with PDAC who had not previously been treated with chemotherapy. The exclusion criteria were significant co-morbid cardiovascular and respiratory disease, history of prior cancer or prior treatment with any chemotherapy regimen, pregnant or lactating females, life expectancy <12 weeks and patients requiring urgent/emergency interventions.
Human samples were obtained from primary tumors surgically resected. A pathologist analyzed the specimen, and a fragment of the tumor was taken for xenotransplantation in zebrafish embryos.
Preoperative data included diagnosis, age, gender, body mass index (BMI), value of tumor marker Ca 19.9 and neoadjuvant therapy. Operative data included type of surgical procedure, if an associated vascular resection was performed and if there were problems in taking a fragment of the tumor for the xenotransplantation. Histological data included: histological type of the tumor, grade of differentiation, tumor dimension, number of harvested lymph nodes, number of metastatic lymph nodes, presence of angioinvasion and perineural infiltration and the presence of vascular infiltration in the case of vascular resection. Patients were staged according to the T and N definitions proposed for the American Joint Committee on Cancer 8th edition [46]. The proposed T-stage definitions are the following: T1 ≤ 2 cm maximal diameter, 2 < T2 ≤ 4 cm maximal diameter, T3 > 4 cm maximal diameter, T4 = locally unresectable. Extra-pancreatic extension was not included in these T-stage definitions. Proposed N-stage definitions included the following: N0 = node negative, N1 = 1–3 nodes positive for metastatic disease, N2 ≥ 4 nodes positive for metastatic disease. The follow-up data included the administration or not of adjuvant chemotherapy and the type of the chemotherapy scheme, the cancer recurrence and the DFS. DFS was defined as the time from pancreatic surgical resection to cancer recurrence or death from any cause, whichever occurred first. After surgery, all the included patients underwent radiological assessment as per clinical practice. The patients were classified as relapse/no relapse (r/nr) if they relapsed or did not relapse.
4.2. Zebrafish Welfare Assurance and Husbandry
Zebrafish were handled in accordance with local animal welfare regulations (authorization n. 99/2012-A, 19 April 2012; authorization for zebrafish breeding for scientific purposes released by the “Comune di Pisa” DN-16/43, 19 January 2015) and the procedures were approved by Italian Ministry of Public Health, in conformity with the Directive 2010/63/EU. The zebrafish used in this study were kept at 37 °C in tanks housed on a custom-built, stand-alone, re-circulating system (Tecniplast, Varese, Italy). Zebrafish fertilized eggs were obtained by natural mating of AB wild-type fish at our facilities and the developing embryos were staged in an incubator at 28 °C, according to Kimmel et al. [47]. Before any procedure, embryos were anesthetized in 0.02% tricaine.
4.3. Human Material for Zebrafish Xenografts
Detailed procedures for tissue transplantation have been previously described by Usai et al. [23]. Briefly, bulk tumor tissue screened by the histopathologist (at the Division of Surgical Pathology, University of Pisa) was washed three times with RPMI supplemented with 100 U/mL penicillin, 100 µg/mL streptomycin and 2.5 µg/mL amphotericin; then, it was minced, firstly with a scalp blade (1–3 mm), and then using the McIlwain tissue chopper (Campden Instruments LTD, Loughborough, UK) to obtain pieces of about 0.3 mm × 0.3 mm × 0.3 mm. The pieces were stained with 10 µg/mL CM-Dil (Invitrogen, Carlsbad, CA, USA) in D-PBS and incubated for 30 min at 37 °C. Tissue pieces were then washed and centrifuged three times by D-PBS and resuspended in D-PBS supplemented with 10% FBS (Gibco, Waltham, MA, USA). Pieces of fluorescent-labeled tissue were manually transplanted into the perivitelline space of n = 90 AB wild-type recipient embryos 2 days post fertilization (dpf), which were lying in 1% agarose disks in multi-well plates. After transplantation, embryos were incubated for 2 h at 35 °C. The pool of embryos xenografted with the tissue derived from each patient will be hereinafter referred to as zPDXs.
4.4. Assessing Therapeutic Responses in Zebrafish Xenografts
Embryos, previously selected for the presence of tissue, were randomly and equally allocated among 5 groups (4 therapeutic options and 1 control group, n ≥ 10 of xenografted embryos/group) and imaged at 2, 24 and 48 h post injection. After each time point, fresh drugs were administered at the equivalent dose (ED = 5) validated in our previous study [23], and embryos were incubated at 35 °C. The chemotherapy schemes tested were gemcitabine (GEM), gemcitabine + oxaliplatin (GEMOX), gemcitabine + nab-paclitaxel (GEM/nab-P), and 5-fluorouracil + folinic acid + oxaliplatin + irinotecan (FOLFOXIRI) (Table 3). Control embryos were maintained in E3 supplemented with 100 U/mL penicillin and 100 µg/mL streptomycin.

Table 3.
Chemotherapy protocols used in the study to assess the therapeutic responses of PDAC zPDXs. The drugs in the combinations and their concentrations are reported.
The effects of chemotherapy on zPDXs were firstly assessed by adapting the WHO criteria based on bidimensional measurements [48] and classifying the outcomes into 5 groups comparing the response to chemotherapy to the relative stained area of the control group at 2 days post injection (dpi): Complete response (CR), partial response (PR), minor response (MR), stable disease (SD) and progression disease (PD) (Table 4).

Table 4.
Definition of criteria used to define the zPDX response (adapted from WHO standard criteria).
4.5. Co-Clinical Trial
Clinical data obtained during the follow-up were compared to data of the therapeutic response in zPDX. Patients who died during the hospital stay after surgical operation, who did not undergo adjuvant chemotherapy or who underwent chemotherapy schemes not tested in xenografted zebrafish embryo, were excluded from the analysis. Moreover, patients whose zebrafish avatar reported low engraftment were excluded from the analysis (n ≥ 3 embryos for each group). We considered zPDX a responder (R) when a decrease ≥ 50% in the relative tumor area was reported; otherwise, they were considered a non-responder (NR). We further classified patients according to the outcome of their zPDX: the patient was considered a Responder if her/his own zPDX was classified as a R for the chemotherapy scheme she/he received as adjuvant treatment; otherwise, she/he was classified as a non-responder. Our endpoint was to compare the recurrence rate at 1 year after surgery of the patients of the responder-group and non-responder group. The disease recurrence rate and the DFS of the two groups were compared using the log-rank test. The relative risk (RR) was calculated as the ratio of the probability of recurrence in the responder group to the probability of recurrence in the non-responder group.
4.6. Linear Mixed Effect Model Data Analyses
To maximize the prediction of tumor variation, we developed a method for modeling how it changes in three dimensions. Thus, we estimated the volume at 1 dpi and 2 dpi assuming that the tumor volume could be approximated as a sphere and considering area as a circular section of the mass.
We got volume variation as:
We used percent change in tumor volume (%ΔV) as a proxy to evaluate treatment efficacy on PDAC zPDXs.
Due to the hierarchical structure of data, we opted for a linear mixed effect model (LMM) [49]. All statistical analyses were performed using R software version 4.0.4. (https://www.r-project.org/, accessed on 15 February 2021).
Treatments (5 classes) were considered fixed effects, whereas zPDXs were the random effects (20 categories). Fixed effects indicated the mean effect of each treatment type on zebrafish embryo population. Random effects evaluated each zPDX response to proposed treatments with respect to the population mean.
The model also considered random components as intercept and slope [49]. The analysis of random slope allows us to examine zPDX-specific responses to treatments. The proposed model is the result of a selection process: as the first step we started with an LMM consisted of random components of the intercept, then, according to our purpose, we made an LMM comprising both random intercept and slope.
In our design, treatment was a nominal variable with five categories (four treatment options plus a control group used as a baseline). The LMM outcome variable was the %ΔV that showed a positively skewed distribution, so we decided to transform this variable to satisfy linear regression assumptions [50].
We added 110 to %ΔV, a constant value that allowed us to apply 10-base logarithm transformation. %ΔV was transformed as:
Using the fixed effect coefficients estimated through the LMM, a post hoc test was performed with the R package emmeans. We calculated marginal means for each dummy variable, their standard errors and 95% confidence intervals (95% CI). We computed pairwise comparisons of least square means with adjusted p-values by Tukey’s HSD method.
To evaluate if there was a statistically significant dissimilarity in zPDX response to treatments compared to the overall population, we simulated 95% CI of random effects for each treatment and contrasted them to the population mean, represented by fixed effect coefficients.
Additionally, to identify treatment efficacy with respect to the control group, for each zPDX, we contrasted 95% CI of predicted values in treatments and in the control group. To obtain predicted values, we added the fitted values of fixed effects to random values and to their simulated 95% CI. To assess the significant reduction of tumor volume with respect to control, we overlapped the 95% CI of treatments and control groups. Furthermore, we tested the significant tumor volume reduction with respect to 0 on the log scale using the 95% CI of predicted %ΔV. When the 95% CI of predicted %ΔV was less than 0 on the log scale, the tumor volume of the corresponding zPDX is significantly reduced.
5. Conclusions
In conclusion, our zPDX model seems to be a promising tool for the stratification of PDAC patients based on their theoretical response to current chemotherapy schemes. This is a crucial starting point for future study involving more patients to obtain a method to really personalize the oncological treatment of PDAC patients.
Supplementary Materials
The following are available online at https://www.mdpi.com/article/10.3390/cancers13164131/s1, Figure S1: Means ad 95% CI of random effect in GEMOX, GEM, FOLFOXIRI and GEM/nab-P, Figure S2: PDAC zPDX error bars with 95% CI of fitted values estimated through LMM. Red dashed line is 0 on the log scale, Table S1: Fixed effects coefficients, their Standard Error (SE) and p-value estimated by LMM; Estimation of the radius; R packages.
Author Contributions
Conceptualization, L.M. and V.R.; methodology, A.U., G.D.F., M.P. (Margherita Piccardi), P.C., L.E.P., C.V., E.V., N.F., M.P. (Matteo Palmeri), L.D., A.F., D.G., A.M., V.R. and L.M.; validation, A.U., G.D.F., M.P. (Margherita Piccardi), P.C., D.G., A.M., V.R. and L.M.; formal analysis, A.U., G.D.F., M.P. (Margherita Piccardi), P.C., D.G., A.M., V.R. and L.M.; investigation, A.U., G.D.F., M.P. (Margherita Piccardi), P.C., L.E.P. and N.F.; resources, G.D.F., L.E.P., C.V., E.V., N.F., M.P. (Matteo Palmeri), A.F. and L.M.; data curation A.U., G.D.F., C.V., E.V., M.P. (Matteo Palmeri), A.F., V.R. and L.M.; writing—original draft preparation, A.U., G.D.F., Margherita Piccardi, P.C., C.V., N.F. and M.P. (Matteo Palmeri); writing—review and editing, L.E.P., E.V., L.D., A.F., D.G., A.M., V.R. and L.M.; visualization, A.U. and G.D.F.; supervision, L.D., A.F., D.G., A.M., V.R. and L.M.; project administration, V.R. and L.M.; funding acquisition, E.V., L.M. and V.R. All authors have read and agreed to the published version of the manuscript. Please turn to the CRediT taxonomy for the term explanation.
Funding
This work was funded by the Fondazione Pisa (project 114/16).
Institutional Review Board Statement
The study was approved by the ethics committee of “Area Vasta Nord Ovest (CEAVNO)” (protocol number 70213).
Informed Consent Statement
Informed consent was obtained from all subjects involved in the study.
Data Availability Statement
Dataset and metadata generated and/or analyzed during the current study are available from the corresponding author on request.
Conflicts of Interest
The authors declare no conflict of interest.
References
- Kleeff, J.; Korc, M.; Apte, M.; La Vecchia, C.; Johnson, C.D.; Biankin, A.V.; Neale, R.E.; Tempero, M.; Tuveson, D.A.; Hruban, R.H.; et al. Pancreatic cancer. Nat. Rev. Dis. Primers 2016, 2, 16022. [Google Scholar] [CrossRef]
- Bengtsson, A.; Andersson, R.; Ansari, D. The actual 5-year survivors of pancreatic ductal adenocarcinoma based on real-world data. Sci. Rep. 2020, 10, 16425. [Google Scholar] [CrossRef]
- Rahib, L.; Smith, B.D.; Aizenberg, R.; Rosenzweig, A.B.; Fleshman, J.M.; Matrisian, L.M. Projecting cancer incidence and deaths to 2030: The unexpected burden of thyroid, liver, and pancreas cancers in the United States. Cancer Res. 2014, 74, 2913–2921. [Google Scholar] [CrossRef]
- Guler, G.D.; Ning, Y.; Ku, C.J.; Phillips, T.; McCarthy, E.; Ellison, C.K.; Bergamaschi, A.; Collin, F.; Lloyd, P.; Scott, A.; et al. Detection of early stage pancreatic cancer using 5-hydroxymethylcytosine signatures in circulating cell free DNA. Nat. Commun. 2020, 11, 5270. [Google Scholar] [CrossRef]
- Adamska, A.; Domenichini, A.; Falasca, M. Pancreatic Ductal Adenocarcinoma: Current and Evolving Therapies. Int. J. Mol. Sci. 2017, 18, 1338. [Google Scholar] [CrossRef] [PubMed]
- Chand, S.; O’Hayer, K.; Blanco, F.F.; Winter, J.M.; Brody, J.R. The Landscape of Pancreatic Cancer Therapeutic Resistance Mechanisms. Int. J. Biol. Sci. 2016, 12, 273–282. [Google Scholar] [CrossRef]
- Hidalgo, M.; Cascinu, S.; Kleeff, J.; Labianca, R.; Löhr, J.M.; Neoptolemos, J.; Real, F.X.; Van Laethem, J.L.; Heinemann, V. Addressing the challenges of pancreatic cancer: Future directions for improving outcomes. Pancreatology 2015, 15, 8–18. [Google Scholar] [CrossRef]
- Tiriac, H.; Belleau, P.; Engle, D.D.; Plenker, D.; Deschênes, A.; Somerville, T.D.D.; Froeling, F.E.M.; Burkhart, R.A.; Denroche, R.E.; Jang, G.H.; et al. Organoid Profiling Identifies Common Responders to Chemotherapy in Pancreatic Cancer. Cancer Discov. 2018, 8, 1112–1129. [Google Scholar] [CrossRef] [PubMed]
- Huang, L.; Holtzinger, A.; Jagan, I.; BeGora, M.; Lohse, I.; Ngai, N.; Nostro, C.; Wang, R.; Muthuswamy, L.B.; Crawford, H.C.; et al. Ductal pancreatic cancer modeling and drug screening using human pluripotent stem cell- and patient-derived tumor organoids. Nat. Med. 2015, 21, 1364–1371. [Google Scholar] [CrossRef]
- Di Franco, G.; Usai, A.; Funel, N.; Palmeri, M.; Montesanti, I.E.R.; Bianchini, M.; Gianardi, D.; Furbetta, N.; Guadagni, S.; Vasile, E.; et al. Use of zebrafish embryos as avatar of patients with pancreatic cancer: A new xenotransplantation model towards personalized medicine. World J. Gastroenterol. 2020, 26, 2792–2809. [Google Scholar] [CrossRef] [PubMed]
- Wang, L.; Chen, H.; Fei, F.; He, X.; Sun, S.; Lv, K.; Yu, B.; Long, J.; Wang, X. Patient-derived Heterogeneous Xenograft Model of Pancreatic Cancer Using Zebrafish Larvae as Hosts for Comparative Drug Assessment. J. Vis. Exp. 2019, 146, 31107449. [Google Scholar] [CrossRef] [PubMed]
- Jung, J.; Lee, C.H.; Seol, H.S.; Choi, Y.S.; Kim, E.; Lee, E.J.; Rhee, J.K.; Singh, S.R.; Jun, E.S.; Han, B.; et al. Generation and molecular characterization of pancreatic cancer patient-derived xenografts reveals their heterologous nature. Oncotarget 2016, 7, 62533–62546. [Google Scholar] [CrossRef]
- Li, S.; Shen, D.; Shao, J.; Crowder, R.; Liu, W.; Prat, A.; He, X.; Liu, S.; Hoog, J.; Lu, C.; et al. Endocrine-therapy-resistant ESR1 variants revealed by genomic characterization of breast-cancer-derived xenografts. Cell Rep. 2013, 4, 1116–1130. [Google Scholar] [CrossRef]
- Wu, J.Q.; Zhai, J.; Li, C.Y.; Tan, A.M.; Wei, P.; Shen, L.Z.; He, M.F. Patient-derived xenograft in zebrafish embryos: A new platform for translational research in gastric cancer. J. Exp. Clin. Cancer Res. 2017, 36, 160. [Google Scholar] [CrossRef] [PubMed]
- Chou, J.; Fitzgibbon, M.P.; Mortales, C.L.; Towlerton, A.M.; Upton, M.P.; Yeung, R.S.; McIntosh, M.W.; Warren, E.H. Phenotypic and transcriptional fidelity of patient-derived colon cancer xenografts in immune-deficient mice. PLoS ONE 2013, 8, e79874. [Google Scholar] [CrossRef]
- Guo, M.; Wei, H.; Hu, J.; Sun, S.; Long, J.; Wang, X. U0126 inhibits pancreatic cancer progression via the KRAS signaling pathway in a zebrafish xenotransplantation model. Oncol. Rep. 2015, 34, 699–706. [Google Scholar] [CrossRef] [PubMed]
- Xiao, J.; Glasgow, E.; Agarwal, S. Zebrafish Xenografts for Drug Discovery and Personalized Medicine. Trends Cancer 2020, 6, 569–579. [Google Scholar] [CrossRef]
- Tentler, J.J.; Tan, A.C.; Weekes, C.D.; Jimeno, A.; Leong, S.; Pitts, T.M.; Arcaroli, J.J.; Messersmith, W.A.; Eckhardt, S.G. Patient-derived tumour xenografts as models for oncology drug development. Nat. Rev. Clin. Oncol. 2012, 9, 338–350. [Google Scholar] [CrossRef]
- Hidalgo, M.; Amant, F.; Biankin, A.V.; Budinská, E.; Byrne, A.T.; Caldas, C.; Clarke, R.B.; de Jong, S.; Jonkers, J.; Mælandsmo, G.M.; et al. Patient-derived xenograft models: An emerging platform for translational cancer research. Cancer Discov. 2014, 4, 998–1013. [Google Scholar] [CrossRef]
- Goto, T. Patient-Derived Tumor Xenograft Models: Toward the Establishment of Precision Cancer Medicine. J. Pers. Med. 2020, 10, 64. [Google Scholar] [CrossRef]
- Huch, M.; Knoblich, J.A.; Lutolf, M.P.; Martinez-Arias, A. The hope and the hype of organoid research. Development 2017, 144, 938–941. [Google Scholar] [CrossRef]
- Fazio, M.; Ablain, J.; Chuan, Y.; Langenau, D.M.; Zon, L.I. Zebrafish patient avatars in cancer biology and precision cancer therapy. Nat. Rev. Cancer 2020, 20, 263–273. [Google Scholar] [CrossRef]
- Usai, A.; Di Franco, G.; Colucci, P.; Pollina, L.E.; Vasile, E.; Funel, N.; Palmeri, M.; Dente, L.; Falcone, A.; Morelli, L.; et al. A Model of a Zebrafish Avatar for Co-Clinical Trials. Cancers 2020, 12, 677. [Google Scholar] [CrossRef]
- Brunner, M.; Wu, Z.; Krautz, C.; Pilarsky, C.; Grützmann, R.; Weber, G.F. Current Clinical Strategies of Pancreatic Cancer Treatment and Open Molecular Questions. Int. J. Mol. Sci. 2019, 20, 4543. [Google Scholar] [CrossRef]
- Fischer, R.; Breidert, M.; Keck, T.; Makowiec, F.; Lohrmann, C.; Harder, J. Early recurrence of pancreatic cancer after resection and during adjuvant chemotherapy. Saudi J. Gastroenterol. 2012, 18, 118–121. [Google Scholar] [CrossRef]
- Matsumoto, I.; Murakami, Y.; Shinzeki, M.; Asari, S.; Goto, T.; Tani, M.; Motoi, F.; Uemura, K.; Sho, M.; Satoi, S.; et al. Proposed preoperative risk factors for early recurrence in patients with resectable pancreatic ductal adenocarcinoma after surgical resection: A multi-center retrospective study. Pancreatology 2015, 15, 674–680. [Google Scholar] [CrossRef]
- Von Hoff, D.D.; Ervin, T.; Arena, F.P.; Chiorean, E.G.; Infante, J.; Moore, M.; Seay, T.; Tjulandin, S.A.; Ma, W.W.; Saleh, M.N.; et al. Increased survival in pancreatic cancer with nab-paclitaxel plus gemcitabine. N. Engl. J. Med. 2013, 369, 1691–1703. [Google Scholar] [CrossRef] [PubMed]
- Conroy, T.; Desseigne, F.; Ychou, M.; Bouché, O.; Guimbaud, R.; Bécouarn, Y.; Adenis, A.; Raoul, J.L.; Gourgou-Bourgade, S.; de la Fouchardière, C.; et al. FOLFIRINOX versus gemcitabine for metastatic pancreatic cancer. N. Engl. J. Med. 2011, 364, 1817–1825. [Google Scholar] [CrossRef] [PubMed]
- Abbruzzese, J.L.; Hess, K.R. New option for the initial management of metastatic pancreatic cancer? J. Clin. Oncol. 2014, 32, 2405–2407. [Google Scholar] [CrossRef][Green Version]
- Verma, M. Personalized medicine and cancer. J. Pers. Med. 2012, 2, 1–14. [Google Scholar] [CrossRef] [PubMed]
- Krzyszczyk, P.; Acevedo, A.; Davidoff, E.J.; Timmins, L.M.; Marrero-Berrios, I.; Patel, M.; White, C.; Lowe, C.; Sherba, J.J.; Hartmanshenn, C.; et al. The growing role of precision and personalized medicine for cancer treatment. Technology 2018, 6, 79–100. [Google Scholar] [CrossRef] [PubMed]
- Costa, B.; Estrada, M.F.; Mendes, R.V.; Fior, R. Zebrafish Avatars towards Personalized Medicine-A Comparative Review between Avatar Models. Cells 2020, 9, 293. [Google Scholar] [CrossRef] [PubMed]
- Byrne, A.T.; Alférez, D.G.; Amant, F.; Annibali, D.; Arribas, J.; Biankin, A.V.; Bruna, A.; Budinská, E.; Caldas, C.; Chang, D.K.; et al. Interrogating open issues in cancer precision medicine with patient-derived xenografts. Nat. Rev. Cancer 2017, 17, 254–268. [Google Scholar] [CrossRef]
- Hason, M.; Bartůněk, P. Zebrafish Models of Cancer-New Insights on Modeling Human Cancer in a Non-Mammalian Vertebrate. Genes 2019, 10, 935. [Google Scholar] [CrossRef]
- Lieschke, G.J.; Currie, P.D. Animal models of human disease: Zebrafish swim into view. Nat. Rev. Genet. 2007, 8, 353–367. [Google Scholar] [CrossRef]
- Haldi, M.; Ton, C.; Seng, W.L.; McGrath, P. Human melanoma cells transplanted into zebrafish proliferate, migrate, produce melanin, form masses and stimulate angiogenesis in zebrafish. Angiogenesis 2006, 9, 139–151. [Google Scholar] [CrossRef] [PubMed]
- Dauer, P.; Nomura, A.; Saluja, A.; Banerjee, S. Microenvironment in determining chemo-resistance in pancreatic cancer: Neighborhood matters. Pancreatology 2017, 17, 7–12. [Google Scholar] [CrossRef]
- Neesse, A.; Michl, P.; Frese, K.K.; Feig, C.; Cook, N.; Jacobetz, M.A.; Lolkema, M.P.; Buchholz, M.; Olive, K.P.; Gress, T.M.; et al. Stromal biology and therapy in pancreatic cancer. Gut 2011, 60, 861–868. [Google Scholar] [CrossRef]
- Weniger, M.; Honselmann, K.C.; Liss, A.S. The Extracellular Matrix and Pancreatic Cancer: A Complex Relationship. Cancers 2018, 10, 316. [Google Scholar] [CrossRef] [PubMed]
- Stopa, K.B.; Kusiak, A.A.; Szopa, M.D.; Ferdek, P.E.; Jakubowska, M.A. Pancreatic Cancer and Its Microenvironment-Recent Advances and Current Controversies. Int. J. Mol. Sci. 2020, 21, 3218. [Google Scholar] [CrossRef]
- Fior, R.; Póvoa, V.; Mendes, R.V.; Carvalho, T.; Gomes, A.; Figueiredo, N.; Ferreira, M.G. Single-cell functional and chemosensitive profiling of combinatorial colorectal therapy in zebrafish xenografts. Proc. Natl. Acad. Sci. USA 2017, 114, E8234–E8243. [Google Scholar] [CrossRef] [PubMed]
- Georgakopoulos, N.; Prior, N.; Angres, B.; Mastrogiovanni, G.; Cagan, A.; Harrison, D.; Hindley, C.J.; Arnes-Benito, R.; Liau, S.S.; Curd, A.; et al. Long-term expansion, genomic stability and in vivo safety of adult human pancreas organoids. BMC Dev. Biol. 2020, 20, 4. [Google Scholar] [CrossRef]
- Weibel, P.; Pavic, M.; Lombriser, N.; Gutknecht, S.; Weber, M. Chemoradiotherapy after curative surgery for locally advanced pancreatic cancer: A 20-year single center experience. Surg. Oncol. 2021, 36, 36–41. [Google Scholar] [CrossRef] [PubMed]
- Turpin, A.; El Amrani, M.; Bachet, J.B.; Pietrasz, D.; Schwarz, L.; Hammel, P. Adjuvant Pancreatic Cancer Management: Towards New Perspectives in 2021. Cancers 2020, 12, 3866. [Google Scholar] [CrossRef] [PubMed]
- Lee, K.H.; Chie, E.K.; Im, S.A.; Kim, J.H.; Kwon, J.; Han, S.W.; Oh, D.Y.; Jang, J.Y.; Kim, J.S.; Kim, T.Y.; et al. Phase II Trial of Postoperative Adjuvant Gemcitabine and Cisplatin Chemotherapy Followed by Chemoradiotherapy with Gemcitabine in Patients with Resected Pancreatic Cancer. Cancer Res. Treat. 2020, 33421976. [Google Scholar] [CrossRef]
- Amin, M.B.; Greene, F.L.; Edge, S.B.; Compton, C.C.; Gershenwald, J.E.; Brookland, R.K.; Meyer, L.; Gress, D.M.; Byrd, D.R.; Winchester, D.P. The Eighth Edition AJCC Cancer Staging Manual: Continuing to build a bridge from a population-based to a more “personalized” approach to cancer staging. CA Cancer J. Clin. 2017, 67, 93–99. [Google Scholar] [CrossRef]
- Kimmel, C.B.; Ballard, W.W.; Kimmel, S.R.; Ullmann, B.; Schilling, T.F. Stages of embryonic development of the zebrafish. Dev. Dyn. 1995, 203, 253–310. [Google Scholar] [CrossRef]
- World Health Organization. WHO Handbook for Reporting Results of Cancer Treatment; World Health Organization: Geneva, Switzerland, 1979; p. 45. [Google Scholar]
- Zuur, A.; Ieno, E.N.; Walker, N.; Saveliev, A.A.; Smith, G.M. Mixed Effects Models and Extensions in Ecology with R, 1st ed.; Springer: New York, NY, USA, 2009. [Google Scholar]
- Fox, J. Applied Regression Analysis and Generalized Linear Models, 3rd ed.; SAGE: Los Angeles, CA, USA; London, UK, 2016; p. 791. [Google Scholar]
Publisher’s Note: MDPI stays neutral with regard to jurisdictional claims in published maps and institutional affiliations. |
© 2021 by the authors. Licensee MDPI, Basel, Switzerland. This article is an open access article distributed under the terms and conditions of the Creative Commons Attribution (CC BY) license (https://creativecommons.org/licenses/by/4.0/).

