Article

Urban Innovation Efficiency Improvement in the Guangdong–Hong Kong–Macao Greater Bay Area from the Perspective of Innovation Chains

1
Department of Economics, School of Business, Hunan University of Science and Technology (HNUST), Xiangtan 411201, China
2
Department of Economics & Statistics, School of Economics and Management, Xinyu University (XYU), Xinyu 338004, China
*
Author to whom correspondence should be addressed.
Land 2021, 10(11), 1164; https://doi.org/10.3390/land10111164
Submission received: 11 October 2021 / Revised: 28 October 2021 / Accepted: 29 October 2021 / Published: 30 October 2021
(This article belongs to the Special Issue Recent Progress in Urbanisation Dynamics Research)

Abstract

:
Against the background of globalization and informatization, innovation is the primary driving force for regional economic and social development. Urban agglomerations are the main body of regional participation in global competition, and promoting the construction of the Guangdong–Hong Kong–Macao Greater Bay Area is an important strategy for China’s regional economic development. Aimed at the differences in location advantages among cities in the Guangdong–Hong Kong–Macao Greater Bay Area, based on the theory of innovation chain, we developed a three-stage model of “knowledge innovation-scientific research innovation-product innovation”. A three-stage DEA model was used to measure the innovation efficiency of cities in the Greater Bay Area at different stages, and two progressive two-dimensional matrices are constructed to locate the innovation development of cities according to the efficiency value. The results show the following: ① The overall innovation efficiency of the Greater Bay Area urban agglomerations gradually decreased in the process from knowledge innovation and scientific research innovation to product innovation, and the innovation efficiency among cities was unbalanced. ② Shenzhen, Guangzhou, and Hong Kong all performed well in the whole innovation stage, while other cities in the Greater Bay Area showed weakness in innovation at different stages. Based on this, this paper puts forward relevant countermeasures and suggestions for promoting and optimizing collaborative innovation in the Greater Bay Area taking into account factor flow, industrial structure, and innovation network of urban agglomerations.

1. Introduction

China’s economy has moved from a stage of rapid growth to a new era of high-quality development, and innovation is a significant engine for high-quality regional development. Urban agglomerations are concentrated areas of economy, technology, workforce, information, and a leading area of national technological innovation. In recent years, China has attached great importance to the building of regional innovation centers, with key cities such as Beijing, Shanghai, Guangzhou and Shenzhen as the core, forming representative regional innovation urban agglomerations in the Beijing–Tianjin–Hebei Region, the Yangtze River Delta, the Pearl River Delta and the Guangdong–Hong Kong–Macao Greater Bay Area, highlighting these major cities’ function as innovative hubs and driving the sustainable development of local economy [1]. The Guangdong–Hong Kong–Macao Greater Bay Area (hereinafter GBA) is one of the most open and economically active regions in China and plays an important strategic role in China’s overall development and global economic development. The Outline Development Plan for the Guangdong–Hong Kong–Macao Greater Bay Area issued by China at the beginning of 2019 sets out the strategic positioning of the GBA to become an international innovation center with global influence. It stresses the need to deepen innovation cooperation in the GBA and build an open regional collaborative innovation community for integrated development [2].
As the innovation center in China, the GBA is a crucial spatial carrier leading regional innovation and high-quality development. Its innovation intensity determines the level of regional economic high-quality development. With significant connotations, urban innovation efficiency has become a typical index to evaluate regional innovation and high-quality development. Thus, at this stage, has the GBA collaborative innovation community achieved coordinated progress? How can the innovation efficiency of the GBA be improved? Therefore, we adopted the DEA model based on the perspective of the innovation value chain to study the innovation efficiency of cities in the GBA at the stages of knowledge innovation, scientific research innovation, and product innovation, and we propose paths for improving the innovation efficiency of each city to provide a reference for decision-making to accelerate the innovation-driven strategy of the GBA and build a world-class innovation bay area.
The structure of this paper is as follows: The first section is the introduction, which introduces the research background. The second section is the literature review, which summarizes the research results of previous scholars and has a systematic and comprehensive cognition of the issues discussed in this paper. The third section provides the theoretical mechanism, discusses the connotation of the innovation value chain and the two-dimensional innovation efficiency matrix. The fourth section introduces the empirical model and discusses the data source, variable selection and data processing. The fifth section introduces the result analysis. According to the efficiency value measured by the three-stage DEA model, the positioning of each city in the two-dimensional matrix of innovation efficiency is analyzed. The sixth section is the research summary and recommendations.

2. Literature Review

As for the research on innovation efficiency, innovation efficiency is an important index reflecting the relationship between innovation input-output and the operation level of the regional innovation system [3,4]. In the efficiency measurement method, the existing research adopts the Stochastic Frontier Analysis (hereinafter SFA) based on parameters and the Data Envelopment Analysis (hereinafter DEA) based on non-parameters [5,6,7,8,9]. In terms of regional innovation efficiency, earlier research mostly focused on the research of innovation efficiency and its influencing factors at the national level [10,11]. Some scholars take provincial samples as research units and use the SFA analysis method to measure regional innovation efficiency [12,13,14], while others use the DEA method to research inter-provincial innovation efficiency [15,16,17]. The influencing factors of innovation efficiency mainly include human capital, economic development level and spillover effect [18,19], as well as the degree of marketization [20] and openness to the outside world [21].
The mode of the innovation value chain is an incremental process of multi-subject phased participation and continuous evolution of functional nodes. Its essence is the generation, transfer and diffusion of knowledge [22]. The core idea of the innovation value chain lies in the openness of innovation elements, the synergy of the whole operation and the added value [23]. Based on this idea, the innovation value chain can reflect the linkage process of innovation resources in an urban agglomeration to realize the added value of innovation value through the chain’s activity structure. The interaction of different links in the innovation value chain affects the combination, flow and diffusion of innovation elements, and the coupling and synergistic development of each link contributes to the improvement of the overall innovation level and international competitiveness of urban agglomeration [24]. From the perspective of research, many scholars have also paid attention to the research on the phased efficiency of innovation, believing that the innovation process is divided into two stages: R&D of innovation results and application of innovation results [25,26], and analysis of the efficiency of the two stages, respectively. Based on the perspective of the innovation value chain, the innovation efficiency of knowledge innovation, R&D innovation and product innovation in China has been analyzed by using the three-stage DEA model and selecting the appropriate promotion path according to the advantages and disadvantages of the innovation efficiency in different regions at different stages [27].
For the research on the innovation efficiency of urban agglomerations, Zhao (2018) adopted the DEA method to study the innovation efficiency of cities in the GBA and compared the scale efficiency and technical efficiency [28]. Sheng et al. (2019) used the SFA method and spatial econometric model to study innovation efficiency and spatial spillover effect of urban agglomerations in Beijing–Tianjin–Hebei, the Yangtze River Delta and the Pearl River Delta in China [29]. Ye and Xu et al. (2021) conducted a comparative study on the innovation efficiency and influencing factors of the three major urban agglomerations in eastern China through the construction of an input-output index system [30,31]. The Bay Area economy, represented by the GBA, is an advanced form of regional economic development [32]. The collaborative innovation of urban agglomerations and their innovation efficiency play a driving role in developing a regional economy. Because of the spatial characteristics, collaborative innovation linkages and influencing factors of innovation efficiency within the GBA urban agglomeration, some Chinese scholars adopted a fixed-effect stochastic frontier model, the DEA–Malmquist index, the grey correlation analysis method, social network analysis and negative binomial regression model to conduct research and discussion [33,34,35]. Some scholars also studied the characteristics and influencing factors of innovation efficiency in the GBA from static and dynamic perspectives [36].
In the existing studies, many scholars have conducted in-depth analyses on the innovation efficiency of urban agglomerations from different perspectives and using different methods, which can provide important theoretical support for the development of this paper. At the same time, however, the current research findings still have the following shortcomings. Firstly, most of the literature uses provincial data to measure innovation efficiency, focusing on examining the mechanisms for improving innovation efficiency at the national level for the region as a whole. However, there is less literature that examines the optimization of innovation efficiency across cities in urban agglomerations. Secondly, the existing literature is relatively limited in its study of the innovation process in urban agglomerations and its efficiency at different stages. In fact, collaborative innovation between urban agglomerations occurs not only between different cities at the same stage of the value chain, but also at different innovation stages in the same city. Finally, most existing literature discusses the efficiency of scientific and technological innovation, while scientific and technological innovation is only a part of innovation activities, and the two cannot be generalized.
In the background of the new era, the study of innovation efficiency of urban agglomeration and its promotion path need to be further studied. The main marginal contribution and innovation of this paper mainly include the following aspects. First of all, from the perspective of the innovation value chain, a three-stage analysis framework of “knowledge innovation–scientific research innovation–product innovation” is constructed to clarify the main components and relations of each stage of innovation value chain. Secondly, the innovation efficiency of different stages of the GBA is measured by the broad innovation input–output index, and the improvement path of the innovation efficiency of each city is proposed, which provides decision-making reference for accelerating the innovation-driven strategy of the GBA and developing the world-class innovation Bay Area. Eventually, the research results of this paper will also provide development ideas and countermeasures for promoting the innovative development and sustainable development of urban agglomeration around the world.

3. Innovation Value Chain Theory and Innovation Path Setting

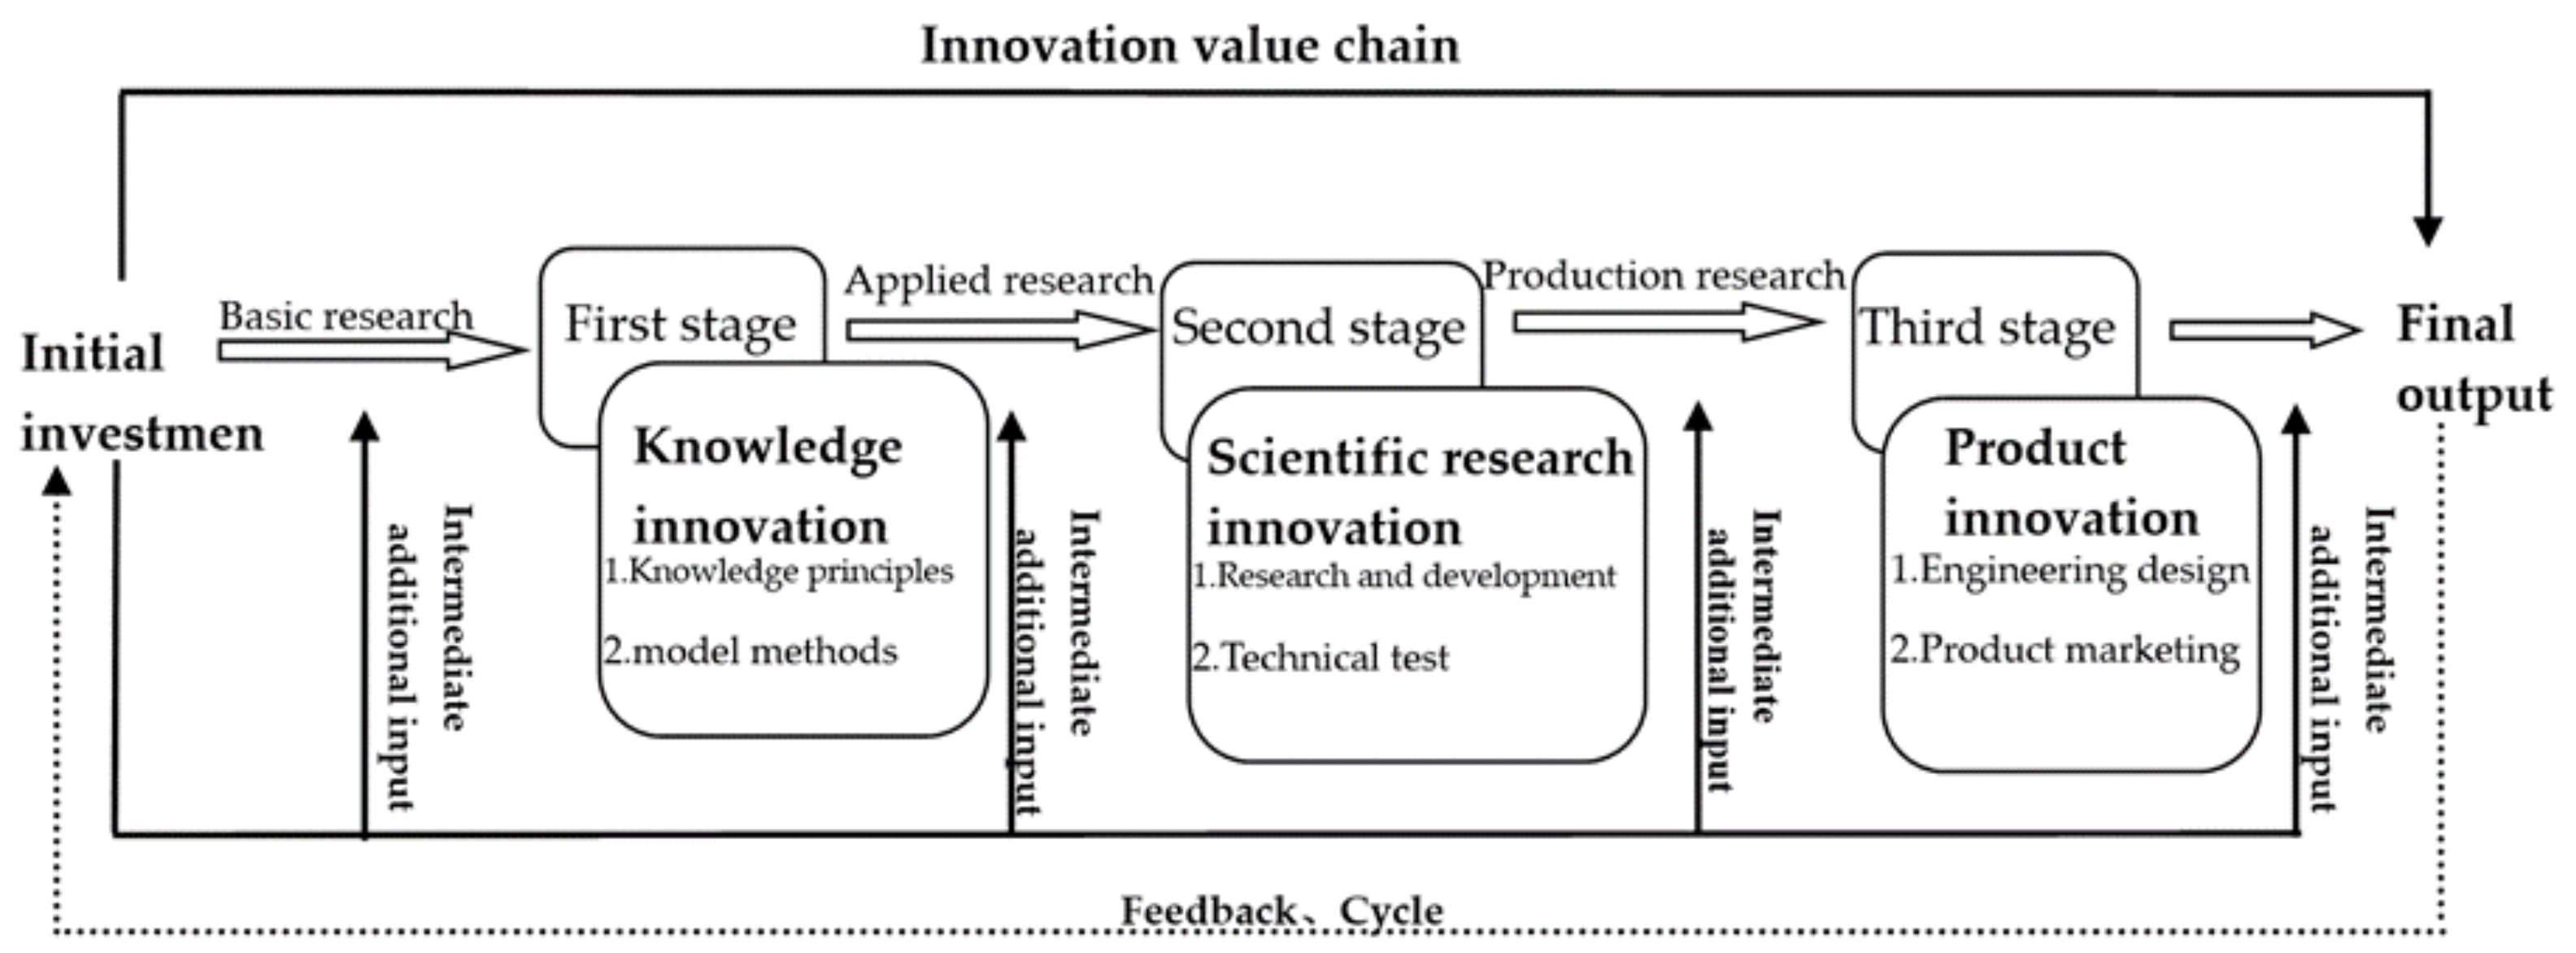
3.1. Innovation Process and Innovation Value Chain Theory

Previous research regards the innovation process as a “black box”. Innovation is an output process that is input by multiple factors and through multiple innovation activities. Scholars at home and abroad have carried out much work on the research of the innovation process, and they believe that innovation is a whole that is interlinked by several innovation activities. At the same time, innovation activities are composed of interrelated multi-links such as design, research and development, production, and sales.
The concept of the innovation value chain was proposed by Hansen and Birkinshaw (2007), who explained that the generation, transformation and dissemination of ideas in innovation are multistage and interrelated [37]. Roperd et al. believe that it is the process of knowledge acquisition, transformation and utilization [38]. From the perspective of globalization, Kramer (2011) determined the contents of the innovation value chain from value sharing [39]. Lee, J. (2012) extended the perspective of the innovation value chain to developing countries, and further analyzed and supplemented its application value [40]. According to the relevant literature, the innovation chain is market-oriented and based on the innovation needs of enterprises, and takes innovation theory as the core element [41]. The innovation value chain is a new theoretical edge concept that combines technology innovation theory with value chain theory [42].
Based on the decomposition of technological innovation links from the perspective of production, the innovation value chain is recognized as a typical three-stage structure, which is a chain structure pattern formed by multiple innovation subjects based on ordinary interests around the whole process of knowledge generation, research and development, large-scale production and commercialization. Technological innovation is a multi–stage and multi–factor value chain transfer process from the input of innovative elements to the output of innovative products, including three stages from the input of innovation to the condensation of innovative knowledge and then to the realization of innovative results. This concept has a similar meaning to the three stages of basic research, applied research and experimental development in the process of innovation in China’s statistics, which can match the research on regional economic reality and innovation efficiency well. The innovation process should include three closely linked stages: knowledge innovation, scientific research innovation and product innovation [27], which promote and link each other. The purpose of knowledge innovation and scientific research innovation is for product innovation, and knowledge innovation is the theoretical basis of scientific research innovation and product innovation. At the same time, they are independent of each other; each is a new stage of innovation, and the whole process is cyclic. Following this research idea and drawing on the model ideas of Yu et al. [27], we constructed the innovation value chain mechanism as shown in Figure 1. This paper analyzes and discusses the innovation efficiency of the Guangdong–Hong Kong–Macao Greater Bay Area from the three stages of knowledge innovation, scientific research innovation and product innovation in the innovation process, so as to further explore the status quo of the innovation and development of the GBA in detail.

3.2. The Theoretical Model of Innovation Path Setting

Cities in urban agglomerations show differences between the stages of efficiency of innovation and the three-phase contact operation mechanism of urban agglomeration of the innovation value chain. We constructed a two–dimensional innovation efficiency matrix of “knowledge–scientific research” innovation efficiency and “scientific research–product” innovation efficiency of the regional innovation urban agglomerations (as shown in the diagrams (a) and (b) in Figure 2) [27]. The average efficiency of cities at different stages can be divided into four efficiency combinations according to the value of the two efficiency dimensions. Different combination modes represent different efficiency states, thus providing a basic idea for the improvement of innovation efficiency in urban agglomeration. These four types of efficiency combination regions are, respectively, the combination of “one high and one low” represented by B and D, the combination of “double low” represented by C and the combination of “double high” represented by A. This division is convenient for cities in different quadrants when searching for appropriate theoretical reference paths to improve innovation efficiency according to their development conditions.
According to the diagrams (a) and (b) in Figure 2, this paper proposes the following three ways to improve the innovation efficiency: first, the breakthrough improvement path of unilateral supplement from B to A or D to A, which takes the link with low efficiency in one stage as the breakthrough point to improve the overall innovation efficiency on the premise of ensuring the high efficiency in the other stage. Second, C reaches the progressive path of improving the excellent and compensating the poor in region A through B or D; that is, the “double low” region can make up for the disadvantages while maintaining its own advantages step by step according to its situation, to achieve the double high goal. Thirdly, the breakthrough leapfrog promotion path from C to A, that is, the leapfrog of innovation efficiency, can be directly realized by simultaneously promoting the two stages.

4. Model Method and Variable Selection

4.1. Three-Stage DEA Model

In the measurement of innovation efficiency, most scholars focus on Data Envelopment Analysis (DEA) based on non-parametric techniques, which was proposed by Charnes, Coopor and Rhodes in 1978 [43]. The principle of this method is to determine the relatively effective production frontier by means of mathematical planning and statistical data by keeping the input or unchanged of Decision-Making Units (DMU), and projecting each DMU onto the production frontier of DEA. The relative effectiveness of DMU is evaluated by comparing its deviation from DEA frontier. The DEA method is an evaluation method based on the concept of relative efficiency using convex analysis and linear programming as tools, and using a data programming model to calculate the optimal input–output scheme of the comparison decision-making unit itself. The advantage of this model is that there is no need to consider the corresponding relationship between input and output, which can solve the linear corresponding relationship between input and output well, and there is no need to assign hypothetical weights to parameters and estimation indexes, which avoids the subjectivity of the research subject, and the measurement of relative efficiency value is more objective, real and reliable. Compared with the traditional efficiency evaluation model, DEA can better reflect the information and characteristics of the evaluation object when dealing with the efficiency evaluation of composite input and multi-type output system.
The classic DEA method has been optimized in the treatment of environmental factors, such as using the DEA-Tobit method. In the first stage, the method uses the classical DEA method to calculate the efficiency value of DMU, and then in the second stage, the efficiency value is taken as the dependent variable and environmental factors as the independent variable to establish a Tobit regression model to investigate the impact of environmental factors. This method can use regression technology to determine the intensity and direction of the impact of environmental factors on efficiency, but its effect is not to strip out environmental factors in the calculation of efficiency, so it does not change the efficiency value measured by the classical method. Due to random noise and environmental factors also having a certain degree of influence on the efficiency evaluation of decision-making units, Frided et al. (2002) [44] proposed a three-stage DEA method based on the classical DEA model that can separate environmental factors to make the calculated efficiency value more accurate. Among the cities in the GBA, there are differences in the level of economic development, the stage of industrial development and the development degree of science, technology and education, and the innovation environment facing each city is highly differentiated and unbalanced. Environmental factors should be taken into account in the innovation efficiency of different stages of innovation activities in different cities. Combined with the above characteristics, We adopted the three-stage DEA model to measure the efficiency of the GBA at each stage in the process of innovation value chain, and its theoretical model is as follows.

4.1.1. In the First Stage, the Initial Efficiency Is Evaluated by Using the Original Input–Output Data

The DEA model can choose different orientations according to the difference of analysis purpose and demand. The traditional DEA model has two forms: the CCR model and the BCC model. Among them, the CCR model assumes that DMU is in a fixed scale return situation, which is used to measure the total efficiency. The BCC model is used to measure pure technology and scale efficiency, assuming DMU is in a variable return to scale situation. In the applications discussed in existing literature, generally speaking, most three-stage DEA models will choose the input–-oriented BCC (variable return to scale) model so as to analyze comprehensive technical efficiency from two aspects of pure technical efficiency and scale efficiency. For any decision unit, the dual-form BCC model under input guidance can be expressed as:
m i n θ ε ( e ^ T S + e T S + ) s . t . j = 1 n X j λ j + S = θ X 0 j = 1 n Y j λ j S + = Y 0 λ j 0 , S , S + 0
The formula j = 1 , 2 , , n represents the decision unit, and X , Y are input and output vectors. The DEA model is essentially a linear programming problem.
If θ = 1 , S + = S - = 0 , then the decision-making unit DEA is valid;
If θ = 1 , S + 0 , or S - 0 , then the weak DEA of the decision-making unit is valid;
If θ < 1 , then the decision-making unit is not valid by DEA.
The efficiency value calculated by the BCC model is the comprehensive technical efficiency (TE), which can be divided into scale efficiency (SE) and pure technical efficiency (PTE), that is, TE = SE × PTE. In the first stage, two values should be calculated: ① the initial DEA efficiency value without filtering environmental factors is used for comparison and analysis in subsequent links; ② the relaxation variable of input is the dependent variable of the second stage.

4.1.2. In the Second Stage, Environmental Factors and Statistical Noise Were Eliminated by SFA-Like Regression

The relaxation variable calculated in the first stage was taken as the opportunity cost of the decision unit, and the influence of environmental factors and random errors was considered. The relaxation variable [ x X λ ] can reflect the initial inefficiency, composed of environmental factors, management inefficiency, and statistical noise. The SFA model was used to decompose the slack variables in the first stage into the above three effects. Then the input and output were corrected and readjusted, or only the input or output was adjusted. The following regression function similar to SFA is constructed based on input orientation.
S n i = f ( Z i ; β n ) + ν n i + μ n i ; i = 1 , 2 , , I ; n = 1 , 2 , , N
In the formula, S n i is the relaxation value of the input of item n of the decision unit i , Z i is the environment variable; β n is the coefficient of the environment variable; ν n i + μ n i is the mixed error term; ν n i represents random interference, and μ n i represents inefficiency of management. In the formula, ν ~ N ( 0 , σ v 2 ) is the random error term, representing the influence of random disturbance factors on input relaxation variables; μ refers to management inefficiency and represents the influence of management factors on input slack variables. It is assumed that it follows a normal distribution truncated at zero points, μ ~ N + ( 0 , σ μ 2 ) .

4.1.3. The Third Stage: DEA Efficiency Analysis of the Adjusted Input-Output Variables

The adjusted input-output variables are used to calculate the efficiency of each decision unit again. At this point, the efficiency has removed the influence of environmental factors and random factors, which is relatively authentic and accurate.

4.2. Indicator Selection and Data Source

From the perspective of the innovation value chain, input–output variables are not the same in different stages according to the different focuses of research in the three stages of innovation activities. In the knowledge innovation stage, since higher education personnel are the main contributors to the output of scientific and technical papers, this paper identifies the number of higher education personnel and the cost of higher education expenditure as input indicators. In terms of output indicators, referring to the practice of Yu (2014), this paper chooses the number of published scientific papers and the number of scientific monographs [27]. In the stage of scientific research innovation, the number of R&D personnel and R&D investment are firstly considered based on the previous research ideas of scholars [45]. Among them, it is the essence of regional innovation that R&D personnel carry out scientific and technological research, which reflects the regional ability to attract talents. The total amount and intensity of R&D expenditure represent the overall scientific and technological R&D capability of the region as well as the degree of investment in innovation activities. In addition to the two input indicators mentioned above, we argue that the input indicators at the research and innovation stage should also include the outputs at the knowledge innovation stage, the number of scientific and technical papers, and scientific and technical monographs. The output index of scientific research innovation stage is the number of patent applications and the number of patent grants [45]. Similarly, when determining the input indicators for the product innovation stage in this paper, in addition to considering the number of patents granted in the previous stage, the indicator of new product development expenditure should also be included. With reference to the relevant literature [27], the output indicators for this phase were selected as two of the industrial enterprises’ new product output and export value.
Combined with existing studies, the environmental variables selected in this paper include higher education investment level [46], government support level, economic development level, informatization level, fixed asset investment [47], scientific research foundation, industrial structure [48] and regional openness [49]. The level of investment in higher education is expressed by the proportion of higher education funding to GDP, the level of government support is expressed by the proportion of government funding in science and technology funding, and the level of economic development is expressed by the per capita GDP of the region. Informatization level refers to innovative information resources, mainly including the number of mobile phone users at the end of the year and the number of broadband Internet users, which can reflect the development level of regional information resources. Investment in fixed assets is a significant component of innovation material resources and the material basis for regional innovation activities. It reflects the degree of enrichment of innovation resources. The scientific research base is expressed as the number of enterprises with R&D activities in the region. The industrial structure is expressed by the ratio of the tertiary industry to the GDP of the region, and the proportion of the total import and export of the region to GDP is used to express the openness of the region. The specific input-output indicators and environmental variables of the three stages of innovation are shown in Table 1:
The index data are from China City Statistical Yearbook 2010–2020, Guangdong Statistical Yearbook and Guangdong Science and Technology Yearbook. For Hong Kong, the data are from Hong Kong Statistical Yearbook 2020, Statistics on Innovation Activities in Hong Kong 2019 and Statistics of Hong Kong Trade Development Council 2019, respectively, of the Census and Statistics Department of the Hong Kong Special Administrative Region. The data for Macau are derived from the Macao Statistical Yearbook 2020, Macao Economic Development Report for the fourth quarter of 2019, and the time-series database of The Macao Statistical Survey Bureau. The amount of Hong Kong dollars and Macau patacas in each indicator is converted into people’s value by the exchange rate of Hong Kong dollars and Macau patacas against RMB in the current year.

5. Empirical Results and Analysis

5.1. Efficiency Measurement Analysis of Innovation Chain Three-Stage DEA Model

According to the three stages of knowledge innovation, scientific research innovation and product innovation in the innovation value chain, the indicators are different. According to the analysis and research of Bruce [50] (1993), innovation output results have a certain lag. We assumed that innovation activities have a lag period of one year from input to output, that is, when the input index of year T is selected, the corresponding output index data should be selected in year T + 1. Therefore, when measuring the innovation efficiency of the GBA in this paper, the index data of the innovation input were selected from 2010 to 2018, and the variable data of innovation output were selected from 2011 to 2019. We followed the three-stage DEA analysis steps. In the first stage, DEAP2.1 software was used to make a preliminary efficiency calculation for input-output indicators. The results are shown in Table 2.
In the second stage, Frontier4.0 software was used to establish the SFA regression model with the input relaxation variables calculated in the first stage as the dependent variables and the environmental variables in each stage as the explanatory variables. The results are shown in Table 3. In the knowledge innovation stage, higher education investment level and the number of higher education personnel were positively correlated. However, there was a negative correlation with higher education expenses and description of higher education, and there is a certain redundancy of financial investment; similarly, the government support and knowledge innovation phase 2 class negatively correlated to the inputs, which is also due to the government and the phenomenon of the lack of output conversion on spending too much. Among the four kinds of input resources in the stage of scientific research innovation, the number of scientific papers published has no apparent correlation with other influencing factors except the level of economic development. Economic development was positively correlated with the publication of scientific papers and monographs but negatively correlated with R&D personnel and R&D expenditure. The informatization level and fixed asset investment was beneficial to the number of R&D personnel but hurt R&D expenditure. The research basis had a positive effect on the other three input factors except for the number of scientific papers published. In the stage of product innovation, industrial structure and regional openness had a negative correlation with the number of patents granted. In contrast, new product development funds had a positive correlation with industrial structure and a negative correlation with regional openness.
In the third stage, DEAP2.1 software was used to adjust the input variables according to the SFA regression results, and the adjusted data were substituted into the BCC model again for efficiency evaluation. The specific innovation efficiency measured by the adjusted three-stage DEA model is shown in Table 4.
According to the comparison between Table 2 and Table 4, after eliminating environmental factors and random interference, the average comprehensive efficiency of the GBA in the knowledge innovation stage increased from 0.757 to 0.852, in which the pure technical efficiency also increased while the scale efficiency decreased slightly. The mean value of comprehensive efficiency increased from 0.748 to 0.788 in the stage of scientific research innovation, and both the pure technical efficiency and scale efficiency increased to a certain extent. In the product innovation stage, the average comprehensive efficiency decreased from 0.582 to 0.542, but both the pure efficiency and scale efficiency increased slightly.
As can be seen from Table 4, compared with the latter two stages, the efficiency of the knowledge innovation stage was higher, with an average value of 0.852. Among them, the efficiency of knowledge innovation in Guangzhou, Shenzhen, and Hong Kong was more than 0.9, ranking in the first echelon of innovation. The efficiency values of Zhuhai, Foshan, Huizhou, Dongguan and Zhongshan were between 0.8 and 0.9, which belong to the second echelon. The efficiency value of Jiangmen, Zhaoqing and Macao was below 0.8, the third echelon. In the scientific research innovation stage, the average efficiency was 0.788, which was lower than that in the knowledge innovation stage. Guangzhou, Shenzhen, and Hong Kong had higher efficiency values, which were all higher than 0.9. Among them, the efficiency values of Shenzhen and Hong Kong reached the allocation effective level of 1. In the second tier, including Zhuhai, Foshan, Huizhou, Dongguan and Zhongshan, their efficiency values were between 0.6 and 0.9. The efficiency value of Jiangmen, Zhaoqing, and Macao was below 0.6, among which the efficiency value of Zhaoqing was the lowest, only 0.484. In the product innovation stage, its average efficiency was low on the whole, only 0.542, which is far lower than the previous two innovation stages. Among them, Hong Kong had the highest product innovation efficiency (0.967), followed by Shenzhen, Dongguan and Guangzhou (0.6 to 0.8). The product innovation efficiency value of Macao, Foshan, Huizhou, and Zhuhai was between 0.4 and 0.6, which belongs to the second tier. In the third stage of the innovation chain, the efficiency of Zhongshan, Jiangmen, and Zhaoqing was low, with a value below 0.4. Among them, Zhaoqing was the lowest, with only 0.232. Based on the calculated efficiency value, it can be preliminarily analyzed that the reason why Guangzhou, Shenzhen, and Hong Kong achieved efficient innovation lies in their strong foundation conditions and distinct advantages in innovation platforms [51]. Compared with the three leading innovation cities, the overall innovation efficiency of the other cities was average, and there was a certain gap with the first echelon, which indicates the imbalance of innovation capacity within the GBA.
By comparing the efficiency values of the three stages in the innovation process (as shown in Figure 3), it is not difficult to find that with the progress of innovation, the innovation efficiency becomes increasingly lower in the process from knowledge innovation to scientific research innovation and finally to product innovation. The innovation efficiency decreased from 0.852 in the knowledge innovation stage to 0.788 in the scientific research innovation stage and was only 0.542 in the product innovation stage. From the composition of the main bodies of innovation activities, the main bodies of innovation in the GBA are the government, enterprises, universities, research institutes and science and technology intermediaries. Knowledge innovation mainly relies on universities. There are many universities (162 in total) in the GBA [52], so the GBA has high efficiency in the stage of knowledge innovation. Scientific research innovation mainly relies on scientific research institutes and scientific research intermediaries, and the number of patent applications is mainly taken into account when testing the results in this stage. The overall efficiency of the scientific research innovation stage was lower than that of the first stage, indicating that the innovation efficiency of the transfer from knowledge innovation to scientific research innovation in the innovation process needs to be enhanced. The relatively low efficiency in the stage of product innovation reflects that the transformation of innovative product results is not ideal. The reason may be that the technical maturity of the scientific and technological achievements of some universities is low, and they lack accurate docking with the industry and market demand [53]. At the same time, the evaluation and pricing mechanism of scientific research results is not perfect; the steps are tedious, time–consuming, and lengthy, which affects the transformation time and leads to the low efficiency of overall product innovation in the GBA. At present, there is a lack of interaction and communication among innovation players in the GBA, and the coordination ability is weak. The synergistic effect between enterprises and other innovation players such as universities and research institutes has not been played. The knowledge spillover benefit and technology diffusion effect produced by innovation activities are non-significant [54]; the synergistic value-added effect of the value chain innovation between enterprises and the system innovation effect between enterprises and the government did not lead to an effective value [55].

5.2. The Positioning Analysis of the Two-Dimensional Matrix of Innovation Efficiency of Each City

Based on the empirical results in Table 4 and the previous research ideas, we put the innovation efficiency of each stage in a two-dimensional distribution map (using the mean value of innovation efficiency of each stage as the division standard). The details are shown in Figure 4 and Figure 5.
According to the analysis of the “knowledge–scientific research” innovation efficiency matrix (Figure 4), cities in the GBA are distributed in regions A and C, namely, intensive and efficient knowledge–scientific research innovation and extensive and inefficient knowledge–scientific research innovation. The cities in Zone A include eight cities: Guangzhou, Shenzhen, Hong Kong, Zhuhai, Foshan, Huizhou, Dongguan and Zhongshan. Higher education and basic scientific and technological innovation facilities in these cities are relatively developed, laying a talent base and material guarantee for knowledge innovation and scientific research innovation. The innovation-leading development cities represented by Guangzhou, Shenzhen and Hong Kong have a high level of economic development and a strong “siphon effect” to attract resources from surrounding cities. Therefore, a large number of innovative elements are gathered here and their innovation ability is relatively prominent. In recent years, Zhuhai has been gradually developing as an innovation growth pole [56], while Foshan and Dongguan, as extensions of the GBA’s “Guangzhou-Shenzhen-Hong Kong-Macao” innovation corridor, have also been steadily improving their innovation capabilities. By connecting with Shenzhen and Guangzhou, Huizhou and Zhongshan will further cluster in the innovation corridor and develop their innovative advantages.
Macao, Jiangmen and Zhaoqing are the two cities with low efficiency in knowledge innovation and scientific research innovation. Although these three cities are all located in region C, the causes of double inefficiency are different. Macao has a relatively high level of economic development. The low efficiency in the knowledge stage may be caused by excessive input of human and material resources in innovation and limited innovation output in this link. In contrast, the low efficiency in the scientific research stage reflects the lack of ability to integrate knowledge innovation into scientific research innovation. Jiangmen and Zhaoqing are cities with relatively low economic strength in the GBA, so their cities have limited innovation resources and lack the momentum of innovation development.
For the three cities with low efficiency of knowledge and scientific research innovation, the optimization path includes the C → A skipping of the development path, and the C → B → A and C → D → A progressive improvement path. The leap-forward development path requires a solid economic foundation and reserves of resource elements, and Macao is suitable for the leap-forward development path. The gradual promotion path is to give full play to the existing advantages and make up the disadvantages on this basis, that is, through the transition of B or D region, and finally towards A region. The low efficiency of Jiangmen and Zhaoqing in the stage of knowledge innovation is mainly due to the lack of input resources provided by the cities, which makes the improvement of efficiency in the stage of knowledge innovation difficult. Therefore, when choosing the path of improvement, the two cities should choose the C → D → A progressive innovation development path that first improves the efficiency of scientific research innovation while maintaining the level of knowledge innovation efficiency.
Let us look at the “scientific research–product” innovation efficiency matrix (Figure 5). In the process of linking scientific research and product innovation, cities in the GBA are distributed in regions A, B, and C, namely, intensive and efficient scientific research–product innovation, high scientific research innovation efficiency and low product innovation efficiency, and extensive and low-efficiency scientific research–product innovation. The cities in the double high efficiency A region, including Hong Kong, Guangzhou, Shenzhen and Dongguan, also performed well in the previous phase of knowledge innovation. Because they had a higher level of economic development of the city itself, the innovation efficiency of the transformation provided the economic foundation, which was also due to the development of the related policy funds, talents, and supporting environment brought by various advantages, making scientific research and product innovation efficiency higher; these areas also reflect the scientific research and innovation of the elements of the transition to product innovation conversion efficiency better.
The cities of high-efficiency scientific research innovation and low-efficiency product innovation are located in region B are Huizhou, Foshan, Zhuhai and Zhongshan. The “scientific research–product” innovation of these four cities also proves that regional scientific research innovation is not able to transform into product innovation. Therefore, cities in Region B should focus on enhancing the efficiency of product innovation while not ignoring the efficiency of scientific research innovation. Located in the geometric center of the GBA, Zhongshan plays a crucial role in “connecting the east with the west”. As a start-up resource city, Huizhou can connect with Shenzhen, learn from its research results and complete the transformation suitable for its development. Zhuhai can take advantage of its proximity to Macao to explore new paths of innovative development. Foshan should further upgrade its existing leading industries. At the same time, we should increase the investment in scientific research and cooperate with Guangzhou to complete the integration of traditional industries and emerging industries [57], develop complementary industrial systems, and increase cooperation with cities on the east coast. The four cities of Huizhou, Foshan, Zhuhai and Zhongshan should strengthen the efficiency of product innovation according to their regional development characteristics and strive to solve the problem of low efficiency of product innovation.
Macao, Jiangmen and Zhaoqing are the two cities with low efficiency in scientific research innovation and product innovation. The efficiency of these three cities in the stage of knowledge innovation is relatively lower than that of other cities. The fundamental reason is the imbalance of input and output of innovation factors, and the transformation of innovative product results is not ideal. These three cities need to strengthen scientific research innovation and product innovation. They can maximize their advantages with the help of functional division of urban agglomeration, and then focus on improving their weaknesses. At the same time, the advantage of the overall coordinated development of the GBA urban agglomerations can be utilized to make full use of the technology spillover effect, absorb the scientific research achievements of other regions and complete the industrialization transformation suitable for local development, to improve the product innovation efficiency of the region.

6. Conclusions and Recommendations for Countermeasures

6.1. Conclusions

Based on the three-stage innovation value chain model of “knowledge innovation–scientific research innovation–product innovation”, we constructed a generalized innovation input-output index system and use the three–stage DEA model that examines environmental factors to measure the innovation efficiency in each stage of innovation activities in the GBA from 2010 to 2018. The results show the following: ① On the whole, the innovation efficiency of the Greater Bay Area decreased with the advancement of innovation activities. The average innovation efficiency of knowledge innovation, scientific research innovation, and product innovation was 0.852, 0.788, and 0.542, respectively. ② From the perspective of different stages in the innovation process of each city, Shenzhen, Guangzhou, and Hong Kong all performed well in the whole stage of innovation, while other cities in the GBA had innovation shortcomings in different stages. Based on the above research results, we constructed the “knowledge–scientific research” innovation efficiency matrix and the “scientific research–product” innovation efficiency matrix using a two-dimensional matrix, and divided the innovation efficiency at each stage into four types. From the matrix analysis, the current state of innovation development in each city was located, and the path to improve its innovation efficiency was analyzed according to the characteristics of each city.

6.2. Recommendations for Countermeasures

Innovation is an important starting point and strategic path for promoting the development of the GBA. To promote the construction of a national innovation system and strengthen strategic scientific and technological forces, it is necessary to construct and perfect the new mechanism of regional collaborative innovation and improve the efficiency of regional innovation. The GBA is an important bridge linking the internal and external circulation of China’s economy, and will become a pioneer and demonstration area for China to build a new development pattern. In recent years, China has issued a series of policy documents on collaborative innovation around the construction of an international science and technology innovation center in the GBA and carried out a series of fruitful explorations of institutional mechanisms to promote the upgrading of cooperation models in collaborative innovation in the GBA [58]. However, due to the lack of resource transformation in the innovation process, the innovation efficiency gradually declines along with the innovation chain, and the imbalance of innovation development among cities in the GBA shows that there is still considerable room for improvement in collaborative innovation in the GBA. The mechanisms and systems of collaborative innovation in the GBA are not yet perfect, and the scientific collaborative innovation system has not been completely established. The existing government management system has not adapted to the coordinated governance of metropolitan groups. As an important territory to promote innovation in China, the GBA still needs to improve its collaborative innovation mechanism and establish a collaborative system among innovation bodies such as cities, enterprises and R&D institutions. In addition, the cooperation mechanism, communication mechanism and guarantee mechanism based on collaborative innovation in the Greater Bay Area need to be further deepened. Based on this, relevant countermeasures and suggestions for optimizing collaborative innovation in the GBA are put forward from the aspects of factor flow, industrial structure, innovation networks.

6.2.1. Promoting the Flow of Innovation Factors and Building a Circular and Smooth Bay Area

At present, the GBA has problems such as uneven distribution of innovation factors and uncoordinated ability to allocate resources. At the same time, administrative barriers caused by policy and economic factors have placed very significant constraints on the convenient and efficient flow of innovation resources within the GBA, which is not conducive to the formation of technology diffusion effects and hinders the development of collaborative regional innovation. The key to enhancing innovation effectiveness in the GBA city cluster lies in the free flow of innovation factors. Therefore, the Greater Bay Area should improve the phenomenon of excessive siphoning from the central cities, strengthen the diffusion effect of innovation technologies, and accelerate the introduction and market-based allocation of innovation factor resources. These improvements would attract more high-quality elements to the GBA, optimally fill in the missing links of the innovation chain in cities with low and medium levels of coordination, promote positive interaction among the links and enhance the level of chain coordination. At the same time, the mechanism channel for the flow of innovation factors will be unblocked, and the cities in the GBA will be promoted to jointly enhance the level of coupling and coordination of science and technology innovation, so as to achieve the construction goal of smooth circulation of innovation factors in the GBA.

6.2.2. Improving Innovative Cooperation Mechanisms to Build a Mutually Beneficial Bay Area

There is currently a lack of interaction and communication between innovation agents in the Greater Bay Area, and coordination is weak. Universities and research institutes with their enterprises and other innovation subjects are many but not strong, the interaction and coordination between the subjects is insufficient, and the sharing platform of science and technology innovation elements is relatively lacking. The existing mechanism does not play a synergistic role between enterprises and other innovation bodies such as universities and research institutes, thus resulting in problems such as low value-added effect of scientific and technological innovation results and low conversion rate. Therefore, creating a collaborative and mutually supportive partnership among multiple players and improving the innovation cooperation mechanism are the backbone of the GBA’s innovation-driven strategy. The GBA should further promote the interconnection of the city’s industrial, value and innovation chains, attach importance to the investment and accumulation of talent capital, and cultivate highly qualified talents with core competitiveness. Improving the institutional mechanisms of Guangdong, Hong Kong, and Macao in areas such as mutual recognition of talent qualifications, the use of science and technology funds and customs clearance facilitation would achieve the goal of building a mutually beneficial Bay Area.

6.2.3. Optimizing the Industrial Structure and Building a Bay Area with a Full Industrial Chain

In terms of industrial structure, the GBA has uneven development. Hong Kong and Macao have entered the post-industrialization stage, while the Pearl River Delta is between the post-industrialization stage and post-industrialization stage, and the non-Pearl River Delta region is still in the mid-industrialization stage. In the face of the lack of synergistic added value and technology diffusion effects in the industrial chain, the Greater Bay Area needs to optimize its industrial structure in order to strengthen innovation cooperation, achieve complementary advantages and create an “innovation ecosystem”. It is necessary to build the Guangzhou–Shenzhen–Hong Kong and Guangzhou-Shenzhen-Australia Science and Technology Corridors to a high level and to co-ordinate the use of quality science and technology innovation resources from Hong Kong and Macao to create a secure bay area for industrial chains. The development of high–tech industries; the integration of the existing advantageous industries of Hong Kong, Macao; and the leading innovation cities in the Pearl River Delta (Shenzhen, Guangzhou, etc.) form a collaborative division of labor patterns among the cities around the dual-chain integration model of innovation and industrial chains and create an innovation economic belt suitable for the development of the GBA. The optimization of the industrial structure of the GBA and the improvement of the construction of the whole industrial chain are important engines for the construction of a world-class innovation-leading Bay Area posture.

6.2.4. Establishing a Collaborative Innovation Network and Building a Synergistic Development Bay Area

The building of collaborative innovation networks in the Bay Area city clusters is a great boost to the overall flow of innovation resources in the region. Strengthening the construction of collaborative innovation networks in the GBA and neighboring cities and accelerating the construction of infrastructure networks with complementary functions to create a network system with an adequate flow of resource elements would make the spatial connection of the city cluster as a whole even closer. It is necessary to improve the mechanism for sharing innovation platform resources and open services, promote a market-based model for efficient sharing of science and technology innovation platform resources and industrial cooperation resources within the Greater Bay Area, and establish a unified project pool and talent pool. At the same time, the existing basic innovation resources of the GBA will be brought into full play, and global innovation resources will be introduced through the International Innovation Demonstration Zone to build a world-class innovative Bay Area, enhance the overall innovation strength of the region and raise the status of the Greater Bay Area in global innovation.

Author Contributions

Conceptualization, W.Y. and Y.H.; methodology, W.Y. and Y.H.; software, Y.H. and L.C.; formal analysis, Y.H. and L.C.; resources, W.Y. and Y.H.; data curation, Y.H. and L.C.; writing—original draft preparation, Y.H. and W.Y.; writing—review and editing, Y.H. and L.C.; supervision, Y.H. and W.Y.; project administration, Y.H. and W.Y.; funding acquisition, W.Y. All authors have read and agreed to the published version of the manuscript.

Funding

This work was supported by The National Social Science Fund of China [grant number 20BGL299].

Institutional Review Board Statement

Not applicable.

Informed Consent Statement

Not applicable.

Data Availability Statement

The data supporting the findings of the article is available in the China City Statistical Yearbook 2010–2020, Guangdong Statistical Yearbook and Guangdong Science and Technology Yearbook. For Hong Kong, the data are from Hong Kong Statistical Yearbook 2020, Statistics on Innovation Activities in Hong Kong 2019 and Statistics of Hong Kong Trade Development Council 2019, respectively, of the Census and Statistics Department of the Hong Kong Special Administrative Region. The data for Macau are derived from the Macao Statistical Yearbook 2020, Macao Economic Development Report for the fourth quarter of 2019, and the time-series database of The Macao Statistical Survey Bureau.

Acknowledgments

We would like to express our gratitude to all those who helped us during the writing of this article. Our deepest gratitude goes first and foremost to Lu Wang, who is from the Hunan University of Science and Technology in China, for his constant encouragement and guidance.

Conflicts of Interest

The authors declare no conflict of interest.

References

  1. Xu, Y.Q.; Zeng, G.; Wang, Q.Y. The evolution and optimization strategy of collaborative innovation network pattern in Yangtze River Delta urban agglomerations. Econ. Geography. 2018, 38, 133–140. [Google Scholar]
  2. CPC Central Committee, State Council. Outline of the Development Plan for the Guangdong–Hong Kong–Macao Greater Bay Area [EB/OL]. 18 February 2019. Available online: http://www.gov.cn/gongbao/content/2019/content_5370836.htm (accessed on 25 May 2021).
  3. Sharma, S.; Thomas, V.J. Inter-country R&D efficiency analysis: An application of data envelopment analysis. Scientometrics 2008, 76, 483–501. [Google Scholar]
  4. Fritsch, M.; Slavtchev, V. Determinants of the efficiency of regional innovation systems. Reg. Stud. 2011, 45, 905–918. [Google Scholar] [CrossRef]
  5. Batz, F.J.; Janssen, W.; Peters, K.J. Predicting technology adoption to improve research priority–Setting. Agric. Econ. 2003, 28, 151–164. [Google Scholar]
  6. Rametsteiner, E.; Hansen, E.; Niskanen, A. Introduction to the special issue on innovation and entrepreneurship in the forest sector. For. Policy Econ. 2006, 8, 669–673. [Google Scholar] [CrossRef]
  7. Comin, D.; Hobijn, B.; Rovito, E. A new approach to measuring technology with an application to the shape of the diffusion curves. Technol. Transf. 2008, 33, 187–207. [Google Scholar] [CrossRef]
  8. Ghebremichael, A.; Potter-Witter, K. Effects of tax incentives on long-run capital formation and total factor productivity growth in the Canadian sawmilling industry. For. Policy Econ. 2009, 11, 85–94. [Google Scholar] [CrossRef]
  9. Mardani, A.; Zavadskas, E.K.; Streimikiene, D.; Jusoh, A.; Khoshnoudi, M. A comprehensive review of data envelopment analysis (DEA) approach in energy efficiency. Renew. Sustain. Energy Rev. 2017, 70, 1298–1322. [Google Scholar] [CrossRef]
  10. Nasierowski, W.; Arcelus, F.J. On the efficiency of national innovation systems. Socio-Econ. Plan. Sci. 2003, 37, 215–234. [Google Scholar] [CrossRef]
  11. Guo, D.B.; Lei, J.X.; Zhang, J.F.; Peng, B. National Innovation System efficiency and its influencing factors: A two-step analysis based on DEA-Tobit. J. Tsinghua Univ. (Philos. Soc. Sci.) 2012, 27, 142–150. [Google Scholar]
  12. Shi, X.S.; Zhao, S.D.; Wu, F.X. Research on regional innovation efficiency and its spatial difference in China. J. Quant. Tech. Econo. 2009, 26, 45–55. [Google Scholar]
  13. Lan, Q.X.; Han, J.; Li, M.P. Innovation efficiency of Chinese manufacturing industry from 2003 to 2008–Based on SFA method. In Proceedings of the 2010 IEEE 17th International Conference on Industrial Engineering and Engineering Management, Xiamen, China, 29–31 October 2010; Volume 1, pp. 524–528. [Google Scholar]
  14. Wang, R.Q.; Peng, L.T.; Jiang, N. Regional innovation efficiency and its influencing factors based on SFA and Malmquist Method. Sci. Sci. Manag. S. T. 2010, 31, 121–128. [Google Scholar]
  15. Cullmann, A.; Schmidt-Ehmcke, J.; Zloczysti, P. Innovation, R&D Efficiency and the Impact of the Regulatory Environment: A Two-Stage Semi-Parametric DEA Approach. Discuss. Pap. DIW Berl. 2009, 8, 36–42. [Google Scholar]
  16. Sun, H.B.; Xiang, G. Innovation efficiency evaluation analysis of urban innovation system based on DEA. Sci. Technol. Prog. Countermeas. 2011, 28, 130–135. [Google Scholar]
  17. Guo, L.; Liu, Z.Y.; Zhou, Z.X. Research on regional technological innovation efficiency evaluation based on DEA cross efficiency model. Sci. Sci. Manag. Res. 2011, 32, 138–143. [Google Scholar]
  18. Maudos, J.; Pastor, J.M.; Serrano, L. Total factor productivity measurement and human capital in OECD countries. Econ. Lett. 1999, 63, 39–44. [Google Scholar] [CrossRef] [Green Version]
  19. Gui, H.B. Spatial econometric analysis of innovation efficiency and its influencing factors of high-tech industries in China. Econ. Geogr. 2014, 34, 100–107. [Google Scholar]
  20. Fang, J.W.; Chiu, Y.H. Research on Innovation Efficiency and Technology Gap in China Economic Development. Asia-Pac. J. Oper. Res. 2017, 34, 1750005. [Google Scholar] [CrossRef]
  21. Fan, H.; Zhou, D.Q. The evolution and influencing factors of scientific and technological innovation efficiency in Chinese provinces. Sci. Res. Manag. 2012, 33, 10–18. [Google Scholar]
  22. Sen, N. Innovation chain and CSIR. Curr. Sci. 2003, 85, 570–574. [Google Scholar]
  23. Dai, M.; Liang, Y.M.; Dai, Y. Research on innovation chain Deconstruction. Sci. Technol. Prog. Countermeas. 2009, 26, 157–160. [Google Scholar]
  24. Ge, P.F.; Han, Y.N.; Wu, X.X. The measurement and evaluation of the coupling coordination between innovation and economic development in China. J. Quant. Tech. Econ. 2020, 37, 101–117. [Google Scholar]
  25. Peng, R.Z.; Li, P. China’s industrial innovation: Process, efficiency and model: Based on the data of large and medium-sized industrial enterprises from 2001 to 2008. Ind. Econ. Res. 2011, 2, 1–8. [Google Scholar]
  26. Yu, Y.Z. Technology Innovation efficiency and its influencing factors: A two-stage analysis based on the perspective of the value chain. Econ. Sci. 2009, 4, 62–74. [Google Scholar]
  27. Yu, Y.Z.; Liu, D.Y. Research on the improvement path of regional innovation efficiency in China from the perspective of the innovation value chain. Sci. Res. Manag. 2014, 35, 27–37. [Google Scholar]
  28. Zhao, S. Analysis of Urban Innovation Efficiency in Guangdong-Hong Kong-Macao Greater Bay Area. Open J. Bus. Manag. 2018, 6, 539–550. [Google Scholar] [CrossRef] [Green Version]
  29. Sheng, Y.; Zhao, J.; Zhang, X.; Song, J.; Miao, Y. Innovation efficiency and spatial spillover in urban agglomerations: A case of the Beijing-Tianjin-Hebei, the Yangtze River Delta, and the Pearl River Delta. Growth Chang. 2019, 50, 1280–1310. [Google Scholar] [CrossRef]
  30. Ye, T.L.; Li, L.; Wang, X.Y. A comparative study on innovation efficiency and influencing factors of three urban agglomerations in eastern China. Sci. Technol. Prog. Countermeas. 2021, 27, 1–10. [Google Scholar]
  31. Xu, L. Evaluation of innovation efficiency in Yangtze River Delta urban agglomerations. Stat. Decis. 2021, 37, 84–87. [Google Scholar]
  32. Tan, H.; Xie, L. Guangdong-Hong Kong-Macao Greater Bay Area: Shaping the International Technology and Innovation Center. China Open. J. 2019, 2, 61–66. [Google Scholar]
  33. Chen, Y.; Lin, Z.H. Grey correlation analysis and innovation of coordination mechanism of inter-city industrial coordination in Guangdong-Hong Kong-Macao Greater Bay Area. J. Guangdong Univ. Financ. Econ. 2018, 33, 89–97. [Google Scholar]
  34. Tan, C.L.; Huang, L.J. Collaborative innovation links and influencing factors among cities in the Guangdong-Hong Kong-Macao Greater Bay Area. J. Beijing Univ. Technol. (Soc. Sci.) 2020, 20, 56–65. [Google Scholar]
  35. Han, Z.Z.; Zhu, F.Y.; Li, Z.Y. Research on innovation efficiency in the Guangdong-Hong Kong-Macao greater bay area. Stat. Decis. 2020, 36, 80–85. [Google Scholar]
  36. Zhang, P.; Li, L.X.; Zeng, Y.Q. Research on the efficiency evaluation of science and technology innovation in Guangdong-Hong Kong-Macao Greater Bay Area-based on DEA-Malmquist Index. J. Ind. Tech. Econ. 2021, 40, 12–17. [Google Scholar]
  37. Hansen, M.T.; Birkinshaw, J. The Innovation Value Chain. Harv. Bus. Rev. 2007, 85, 121–135. [Google Scholar]
  38. Roper, S.; Du, J.; Love, J.H. Modelling the innovation value chain. Res. Policy. 2008, 37, 961–977. [Google Scholar] [CrossRef] [Green Version]
  39. Porter, M.E.; Kramer, M.R. Creating Shared Value. Harv. Bus. Rev. 2011, 89, 62–77. [Google Scholar]
  40. Lee, J.; Gereffi, G.; Beauvais, J. Global value chains and agrifood standards: Challenges and possibilities for smallholders in developing countries. Proc. Natl. Acad. Sci. USA 2012, 109, 12326–12331. [Google Scholar] [CrossRef] [Green Version]
  41. Lin, M. Research on knowledge transfer, Innovation Chain and innovation policy. Beijing Econ. Sci. Press. 2018, 121–122. [Google Scholar]
  42. Wang, W.G.; Zhang, Z.Y.; Hou, J.L. Innovation value chain and its structure: A theoretical framework. Sci. Technol. Prog. Strategy 2019, 36, 36–43. [Google Scholar]
  43. Charnes, A.; Cooper, W.W.; Rhodes, E. Measuring the efficiency of decision-making units. Eur. J. Oper. Res. 1978, 2, 429–444. [Google Scholar] [CrossRef]
  44. Freid, H.O.; Lovell, C.A.K.; Schmidt, S.S.; Yaisawarng, S. Accounting for Environmental Effects and Statistical Noise in Data Envelopment Analysis. J. Product. Anal. 2002, 17, 157–174. [Google Scholar] [CrossRef]
  45. Bai, J.H.; Li, J. Government R&D funding and firm innovation: An empirical analysis from the perspective of efficiency. Financ. Res. 2011, 6, 181–193. [Google Scholar]
  46. Li, X.B. An empirical analysis of regional innovation capacity change in China: Based on the innovation system perspective. Manag. World 2007, 12, 18–30. [Google Scholar]
  47. Furman, J.L.; Porter, M.E.; Stern, S. The determinants of national innovative capacity. Res. Policy 2002, 31, 899–933. [Google Scholar] [CrossRef] [Green Version]
  48. Arrow, K. Economic Welfare and the Allocation of Resources for Invention. Nber Chapters 1972, 12, 609–626. [Google Scholar]
  49. Niu, Z.D.; Zhang, Q.X.; Wang, W. Empirical analysis of the impact of FDI on the independent innovation capability of China’s high-tech industry. Sci. Technol. Prog. Countermeas. 2011, 28, 51–55. [Google Scholar]
  50. Bruce, A.K. The influence of R&D expend it ureson new firm formation and economic growth. Small Bus. Econ. 1993, 13, 275–317. [Google Scholar]
  51. Zhang, Z. Blockchain + Guangdong-Hong Kong-Macao greater bay area collaborative innovation community construction analysis. Acad. Forum 2020, 43, 42–49. [Google Scholar]
  52. Ning, J.; Liu, Y.; Chen, Y. “Two-chain integration” and innovation system optimization in Guangdong-Hong Kong-Macao Greater Bay Area. Reg. Econ. Rev. 2021, 1, 97–104. [Google Scholar]
  53. Fan, X.; Liu, W. Regional innovation collaborative governance based on innovation chain: A case study of Guangdong-Hong Kong-Macao Greater Bay Area. Contemp. Econ. Manag. 2020, 42, 54–60. [Google Scholar]
  54. Tan, Y.H.; Cao, X.Y. Research on collaborative innovation of science and technology in the Guangdong-Hong Kong-Macao Greater Bay Area. J. Cent. China Norm. Univ. (Nat. Sci. Ed.) 2019, 53, 255–262. [Google Scholar]
  55. Wang, Y.; Yang, Y.; Liu, Y. Global vision and theoretical model of Guangdong-Hong Kong-Macao Greater Bay Area building international Science and Technology Innovation Center. Geogr. Res. 2020, 39, 1958–1971. [Google Scholar]
  56. Ye, Y.Y.; Wang, J.S.; Wu, K.M.; Tu, Z.W.; Wang, Y.; He, S.Y.; Liu, Z.Q. Strategic thinking on the construction of Guangdong-Hong Kong-Macao greater bay area as an international science and technology innovation center. Trop. Geogr. 2020, 40, 27–39. [Google Scholar]
  57. Ye, L.; Song, X.Z. Regional collaborative innovation system of Guangdong-Hong Kong-Macao greater bay area: Based on the perspective of planning outline. Exec. Forum 2019, 26, 87–94. [Google Scholar]
  58. Chen, X.Q.; Zhao, D.X.; Lian, X.S. Research on the development of collaborative innovation of science and Technology in Guangdong-Hong Kong-Macao Greater Bay Area: Based on the perspective of factor collaboration. Sci. Technol. Manag. Res. 2020, 40, 36–42. [Google Scholar]
Figure 1. The three-stage operation mechanism of the innovation value chain in urban agglomerations.
Land 10 01164 g001
Figure 2. (a) Matrix of “knowledge–research” efficiency values; (b) matrix of “scientific research–product” efficiency values.
Land 10 01164 g002
Figure 3. Comparison of innovation efficiency values in the three stages of innovation in the GBA.
Land 10 01164 g003
Figure 4. “Knowledge-scientific research” innovation efficiency matrix.
Land 10 01164 g004
Figure 5. “Scientific research–product” innovation efficiency matrix.
Land 10 01164 g005
Table 1. Three-stage input-output index system of innovation.
StageInput VariablesOutput VariableEnvironment Variable
(Non-Dimensional)
Knowledge innovationNumber of higher education personnel (per year)Number of scientific papers published (Piece)Level of investment in higher education
Higher Education Expenditure (100 million yuan)Number of scientific and technological monographs (pieces)Level of government support
Scientific research innovationNumber of R&D personnel (per year)Number of Patent Applications (Piece)Level of economic development
R&D Expenditure (100 million yuan)Level of informatization
Number of scientific papers published (Piece)Number of Patents Granted (Piece)Investment in fixed assets
Number of scientific and technological monographs (pieces)Scientific research base
Product innovationNumber of Patents Granted (Piece)The output value of new products of industrial enterprises (100 million yuan)The industrial structure
New product development expenses (100 million yuan)Export of new industrial products (100 million yuan)Regional openness
Table 2. Traditional DEA innovation efficiency value of GBA (average value of 2010 to 2018).
CityKnowledge InnovationScientific Research InnovationProduct Innovation
TEPTESE TEPETSE TEPSTSE
Guangzhou0.82410.824drs0.5250.5430.968irs0.3250.3430.948drs
Shenzhen0.6980.70.997irs0.94110.941drs0.82510.825drs
Zhuhai0.7440.7920.939irs0.6370.7810.815irs0.5780.730.792irs
Foshan0.7570.8380.903drs0.8580.8890.965irs0.4820.4920.979irs
Huizhou0.7410.7720.96irs0.7120.7750.919irs0.6770.7470.907irs
Dongguan0.7180.7290.985irs0.9160.9640.95irs0.6750.8360.808irs
Zhongshan0.7410.780.951irs111-0.3310.6350.52irs
Jiangmen0.8160.8390.973irs0.550.9210.598irs0.2980.8410.354irs
Zhaoqing0.7550.7560.998drs0.3670.8590.427irs0.4310.8510.507irs
Hong Kong0.6680.6750.991irs0.99910.999drs111-
Macao0.8610.9190.937irs0.7280.9250.788irs0.7820.9190.851irs
Mean0.7570.80.951-0.7480.8780.852-0.5820.7630.772-
Table 3. Results of stage 2 estimation based on SFA.
Number of Higher Education PersonnelExpenses for Higher EducationNumber of R&D PersonnelR&D ExpenditureNumber of Scientific Papers PublishedNumber of Scientific and Technological MonographsNumber of Patents GrantedNew Product Development Funds
Constant term−9.61 *
(0.67)
−5.32
(1.22)
10.17 **
(0.95)
−0.63
(1.04)
−7.95 *
(1.28)
−2.27
(0.33)
3.12 *
(0.26)
0.92 *
(0.77)
Level of investment in higher education6.97 *
(2.19)
−0.73 **
(1.01)
------
Level of government support−3.78 *
(4.25)
−0.42 *
(2.57)
------
Level of economic development--−1.21 *
(1.27)
−5.69 **
(3.25)
4.52 **
(6.78)
8.47 *
(0.17)
--
Level of informatization--1.33 ***
(5.62)
−0.83 *
(1.26)
−3.96
(0.86)
4.72 *
(0.22)
--
Investment in fixed assets--5.22 **
(0.67)
−0.39 *
(1.26)
−6.21
(5.94)
−0.87 *
(7.41)
--
Scientific research base--7.25 *
(0.19)
3.16 **
(4.66)
−5.44
(0.21)
1.99 *
(2.64)
--
The industrial structure------−8.21 *
(0.96)
10.21 *
(0.77)
Regional openness------−2.85
(1.36)
−0.63 **
(5.64)
sigma-squared0.000120.0000270.000090.000140.0000810.000110.0000750.00018
gamma0.7510.6990.8010.7740.7250.6230.8220.739
log likelihood20.31100.35.6242.3656.237.8610.9126.77
The data in the table are the correlation coefficient, and the data in brackets are the standard deviation. ***, **, and * mean significant at the level of 1%, 5%, and 10%, respectively.
Table 4. Three-stage DEA innovation efficiency of GBA after adjustment (average value from 2010 to 2018).
CityKnowledge InnovationScientific Research InnovationProduct Innovation
TEPTESE TEPETSE TEPSTSE
Guangzhou0.91610.916drs0.9610.96drs0.6390.6410.996drs
Shenzhen0.9830.9890.994drs111irs0.7150.8960.798drs
Zhuhai0.8820.9020.978irs0.89910.899irs0.430.6690.643irs
Foshan0.8880.8910.997drs0.8580.8890.965drs0.4970.4990.996drs
Huizhou0.8190.8280.989irs0.7780.7810.996irs0.5870.6250.939irs
Dongguan0.8870.9240.96irs0.7610.8550.89irs0.6750.8360.808irs
Zhongshan0.8690.9580.907irs0.76710.767irs0.3420.5430.63irs
Jiangmen0.7030.8350.842irs0.5580.8150.684irs0.320.5610.57ins
Zhaoqing0.6840.7180.952irs0.4840.8530.568irs0.2320.5940.391ins
Hong Kong0.9480.9510.996irs111-0.9670.9671-
Macao0.7890.8850.892irs0.5980.810.738irs0.5580.7230.773irs
Mean0.8520.8980.948-0.7880.9090.861-0.5420.6870.777-
Publisher’s Note: MDPI stays neutral with regard to jurisdictional claims in published maps and institutional affiliations.

