Abstract
Component fingerprints are a recognized method used worldwide to evaluate the quality of traditional Chinese medicines (TCMs). To foster the strengths and circumvent the weaknesses of the fingerprint technique in TCM, spectrum-effect relationships would complementarily clarify the nature of pharmacodynamic effects in the practice of TCM. The application of the spectrum-effect relationship method is crucial for understanding and interpreting TCM development, especially in the view of the trends towards TCM modernization and standardization. The basic requirement for using this method is in-depth knowledge of the active material basis and mechanisms of action. It is a novel and effective approach to study TCMs and great progress has been made, but to make it more accurate for TCM research purposes, more efforts are needed. In this review, the authors summarize the current knowledge about the spectrum-effect relationship method, including the fingerprint methods, pharmacodynamics studies and the methods of establishing relationships between the fingerprints and pharmacodynamics. Some speculation regarding future perspectives for spectrum-effect relationship approaches in TCM modernization and standardization are also proposed.
1. Introduction
Traditional Chinese medicines (TCMs) have been performing an increasingly important role in protecting health and controlling disease in China for thousands of years [1]. Based on their long history of clinical use and sound effects in the treatment of numerous diseases, especially chronic diseases, TCMs are widely accepted and used by billions of people around the world. Compared to chemical drugs TCMs have multi-target and multi-component characteristics when treating a disease. That means to say, the healing efficacy of a TCM depends on the combined action of multiple components because it usually contains a lot of ingredients. This can cause many difficulties to control the quality and in the search for the effective substance(s) of TCMs. Therefore, numerous researchers have devoted themselves to devising various means to solve these problems [2]. As a hotspot of TCM studies, spectrum-effect relationship method research has gradually drawn extensive attention and has been supposed to provide a way to clarify the active materials of TCMs and control TCM quality.
The term “spectrum-effect relationship” refers to linking the TCM fingerprint peaks with specific pharmacodynamic data to form a relationship, and then using this relationship to look for the effective materials in Chinese medicines and formulate control standards to reflect their internal quality. The spectrum-effect relationship method is developed based on the fingerprint technology. To overcome the shortcomings of fingerprints, it uses data processing technology to analyze the weight coefficients of components, monitoring efficacy despite changes of the peaks and their areas in the fingerprint [3]. This is where biochemistry, molecular biology, and cell biology are invaluable in establishing quantifiable and reproducible assays [4]. Thus, correlated peaks can help researchers further reveal the effective TCM material basis and control TCM quality. Being an interdisciplinary and cutting-edge science, the spectrum-effect relationship method is a technology integrating Chinese medicinal chemistry, analytical chemistry, the pharmacodynamics of TCMs and chemometrics, so it is considered a more accurate way to study TCM active materials.
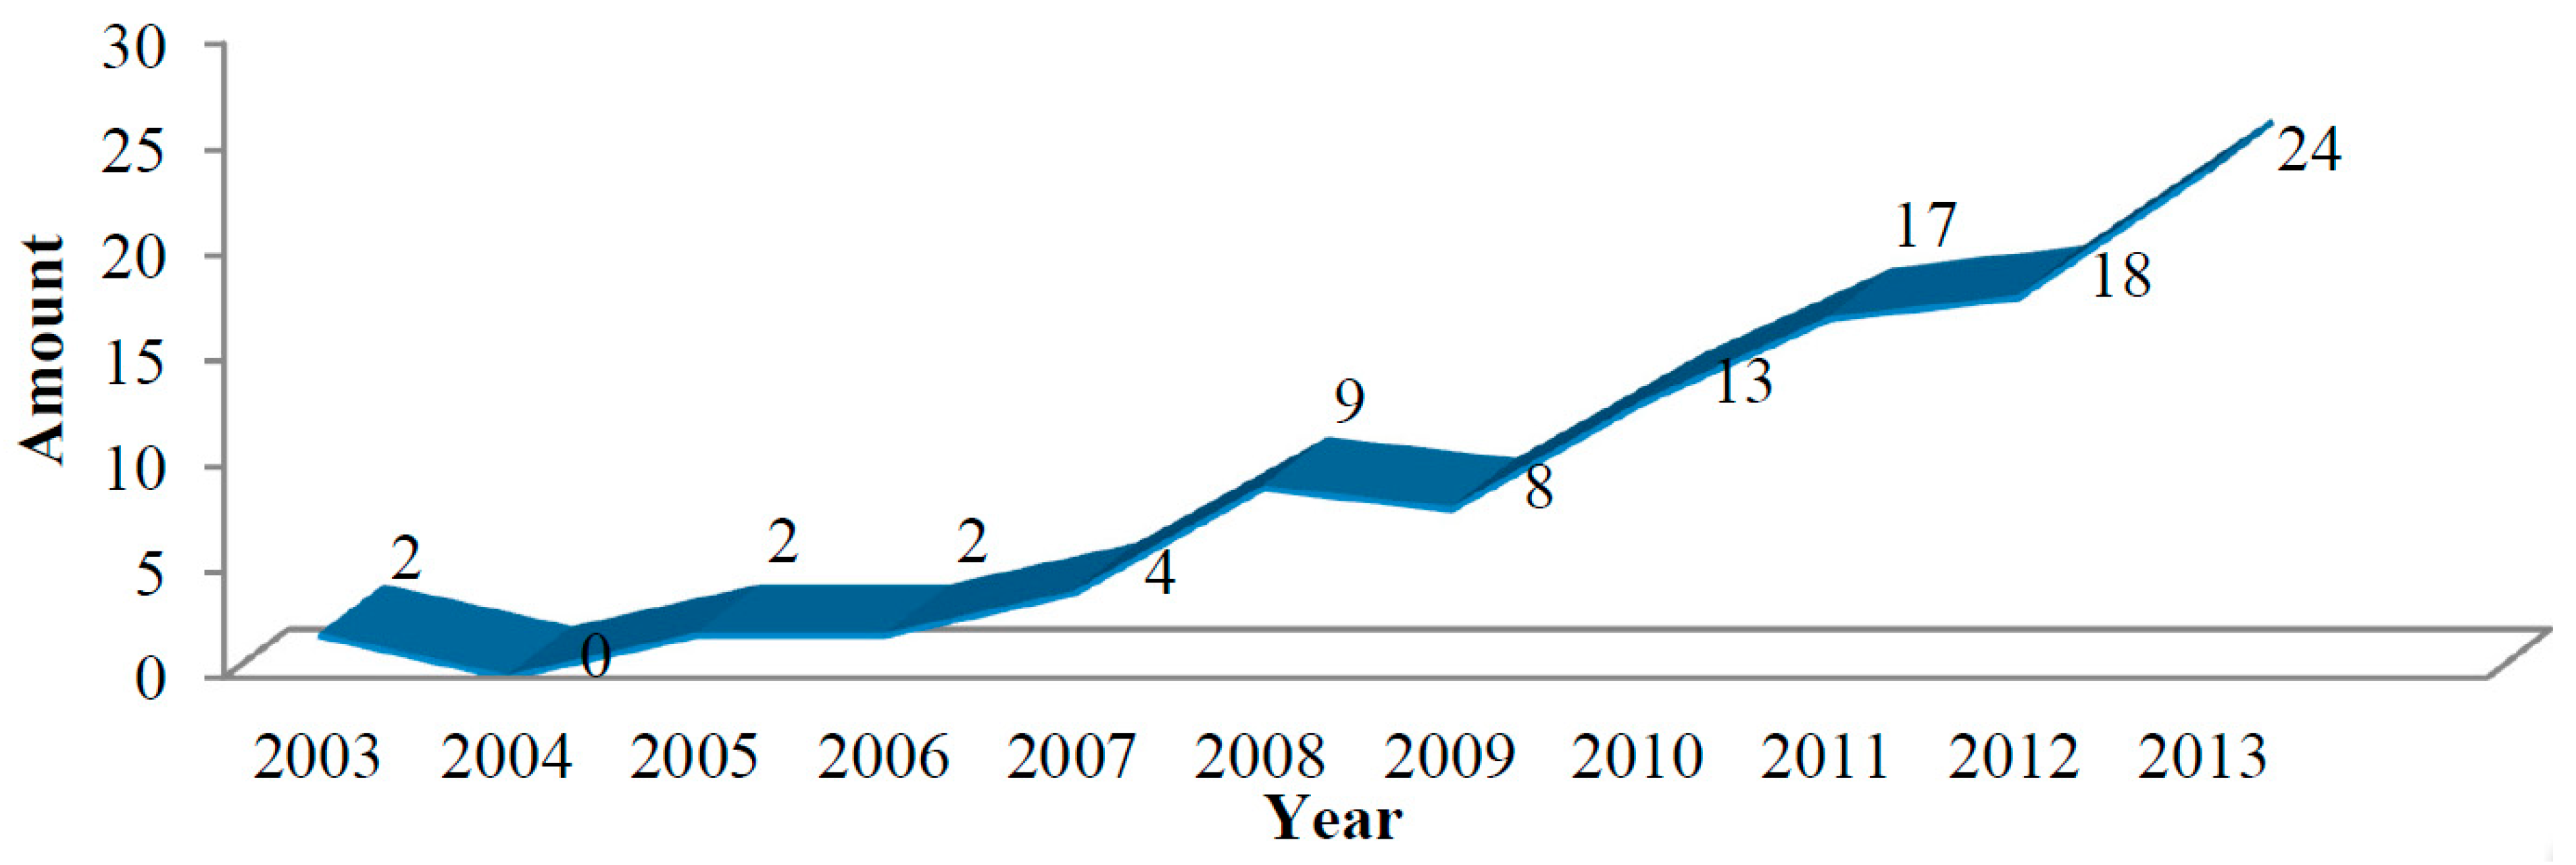
The concept of the spectrum (fingerprint)-effect relationship was a brand new way of thinking at the frontier of the modernization of TCMs proposed by TCM researchers. It could reflect the real and comprehensive pharmacological information of active constituents. It was also more adequate for controlling the quality of TCMs. It has thus become a hotspot in TCM studies. The amount of published research work related to spectrum-effect relationship studies has been displaying a rising trend year after year. Figure 1 shows that studies on spectrum-effect relationships started to appear around 2003, and the research achievements in the area have been increasing in the last 10 years, with several articles pertaining to research on TCMs having been published in the last 8 years in Science Citation Index-cited journals such as The Journal of Ethnopharmacology, Analytica Chimica Acta and Journal of Chromatography B, etc. In the field of TCM research, there are 34 projects funded by National Natural Science Foundation from the year 2006. Moreover, more and more reviews have focused on spectrum-effect relationships and it is already widely applied in the quality control of TCM preparations in China.

Figure 1.
Line chart showing the total amount of research articles on the TCM spectrum-effect relationship approach published from 2003 to 2013.
Figure 1.
Line chart showing the total amount of research articles on the TCM spectrum-effect relationship approach published from 2003 to 2013.
Based on the evolution, current research status and future perspectives, the purpose of this review is to summarize and merge the topics and research methods of the spectrum-effect relationship technique, so as to guide researchers to master this technology and encourage further research on TCMs.
2. The Evolution of Spectrum-Effect Relationships
As early as 2000 the WHO stated the following: “Research on traditional medicine safety and effectiveness of data are far from enough to meet the criteria that are needed to support its use around the world. It is because of a lack of adequate or accepted research methodology for evaluating traditional medicine, not only the deficiency of health care policies”. Containing a myriad of compounds, no matter whether a single herb medicine or a Chinese herbal formula, TCMs all need a unique methodology system to evaluate their quality. Characterized by multiple targets, components and links, TCM is based on a holistic philosophy that is totally different from Western medical practices. All these factors have led to the application of fingerprints in TCM research.
2.1. The Fingerprint
Obtained by using several techniques, both chromatographic and spectroscopic, a fingerprint is a characteristic pattern or profile which reflects the chemical constituents and usually represents as much information as possible [5,6]. Determining a few active ingredients or marker compounds to control the quality of TCM is far from sufficient. The quality control methods adopted for chemical medicines are generally not applicable to TCMs, because they lack a comprehensive evaluation of overall quality [7,8]. Moreover, the nature and amounts of chemical constituents in TCMs can be affected by many factors such as differences in harvest seasons, plant origins, processing methods and others [3]. For those reasons, any differences in the abovementioned factors can lead to different efficacies for a particular herbal medicine [9,10]. With the help of fingerprints, those variables can be well monitored and controlled.
TCM fingerprints can reflect the type and content of their chemical composition. Thus, they give an overall description and evaluation of herb quality. At present, the herbal medicine fingerprint technique is considered a powerful tool for the quality control of multi-component TCMs. Moreover, it has also internationally accepted as a feasible way to evaluate and control the quality of TCMs and their preparations around the world. Japanese scientists take fingerprints obtained from standard extraction methods as the standard fingerprint and the formula decoctions made from verified medicinal sources are regarded as the standard extract. Fingerprints have also started to be accepted by the US Food and Drug Administration, because the fingerprint method can be utilized in named material chemistry, manufacture and control (CMC) applications of Investigational New Drugs (INDs) to control the quality of Botanical Drug Substances and Botanical Drug Products. Besides, many countries and organizations such as Britain, France, Germany, India and the WHO have used fingerprinting to control the quality of medicinal plants. It has also been allowed and accepted by the Chinese State Food and Drug Administration (SFDA) for monitoring and risk management of TCM drug safety.
2.2. The Spectrum-Effect Relationship
Using the chemical fingerprint to evaluate a TCM’s pros or cons obviously has some limitations. Some components embodied by fingerprints are not necessarily the efficacious ingredients, and the connection between the chemical composition and efficacy is thus unclear. Moreover, different preparation methods and different analysis methods or conditions may afford different fingerprints. Therefore, the fingerprint method was far from being a comprehensive way to control the quality of TCMs, because it cannot describe the authentic and general active pharmacological constituent information [2]. In 2001, Xie put forward the concept of development of TCM fingerprints, whereby fingerprints can be related to curative effects by just using chemical constituent information to control quality. Li et al. were the first to clearly propose the notion of the systematic chromatographic-pharmacodynamics relationships of TCMs in 2002. They first proposed the concept and called it “spectrum-effect relationship” [2]. The relevant mathematical model was being developed simultaneously, as chemometrics were first applied by Liang to “chromatographic-pharmacodynamics” for their practical significance, providing a basis for controlling the quality and evaluating the effects of TCMs.
“Spectrum-effect relationship” thus refers to linking the TCM fingerprint peaks with specific pharmacodynamic data to form a relationship, and using this relationship to look for the effective material(s) in Chinese medicines and to help formulate control standards to reflect its internal quality. To summarize, this Introduction has given details of the following topics:
I. The fingerprint only considers the known chemical composition qualitatively or quantitatively, while the efficacy is not taken into account. Only on the premise of the curative effect of drugs, can the characteristic chemicals of a TCM fingerprint be related to its biological activity to better reflect the quality of the TCM. “Spectrum-efficiency relationships” may provide the possibility to compensate for the abovementioned shortcoming of fingerprints.
II. Through the analytic statistics method, “spectrum-efficiency relationships” could establish a mathematical model of a TCM’s chemical composition and efficacy; the “spectrum-effect relationship” technique uses informatics methods to find the alignment of key active compounds; it optimizes the compatibility of TCMs through the forecasting model of multi-component effects, and then builds the multi-factors regulating a network model of therapeutic effects; it finally explores the synergy mechanisms of the variety of aligned TCM active compounds.
III. The changes in the peaks and their areas in established TCM fingerprints reflect differences in each component and its content; the pharmacodynamic model and indexes are chosen carefully so as to evaluate the pharmacological activity of the components more precisely; then using data processing technology we can analyze the weight coefficients of the components contributing to the observed efficacy; data processing methods have their respective pertinence, and various mathematical processing methods used in combination can complement each other and improve the precision and accuracy; then effective ingredient groups with synergism or antagonism effects can be sought out to further reveal the TCM effective material basis and establish the relationship between the spectrum and efficiency of TCM. The general content of spectrum-effect relationship studies can be summarized as shown in Figure 2.
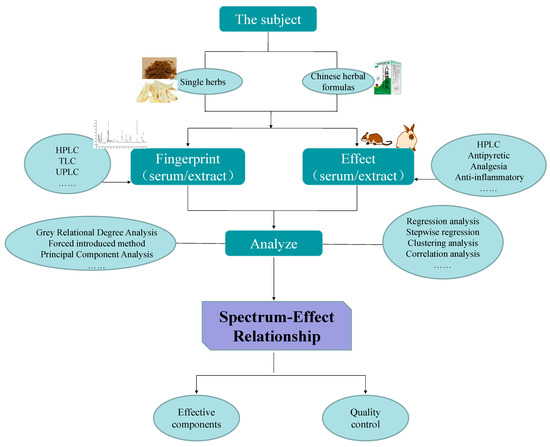
Figure 2.
The general content of spectrum-effect relationship studies.
Figure 2.
The general content of spectrum-effect relationship studies.
IV Being an interdisciplinary and cutting-edge science, the spectrum-effect relationship is technology that integrates the Chinese medicine chemistry, analytical chemistry, pharmacodynamics and chemometrics of a TCM, so it is considered to be more accurate to study TCM active materials. Based on Figure 2, the research objects, methods of establishing fingerprints, pharmacodynamics studies and data processing methods of spectrum-effect relationships will be introduced in the following sections.
3. The Research Objects of the Spectrum-Effect Relationship Method
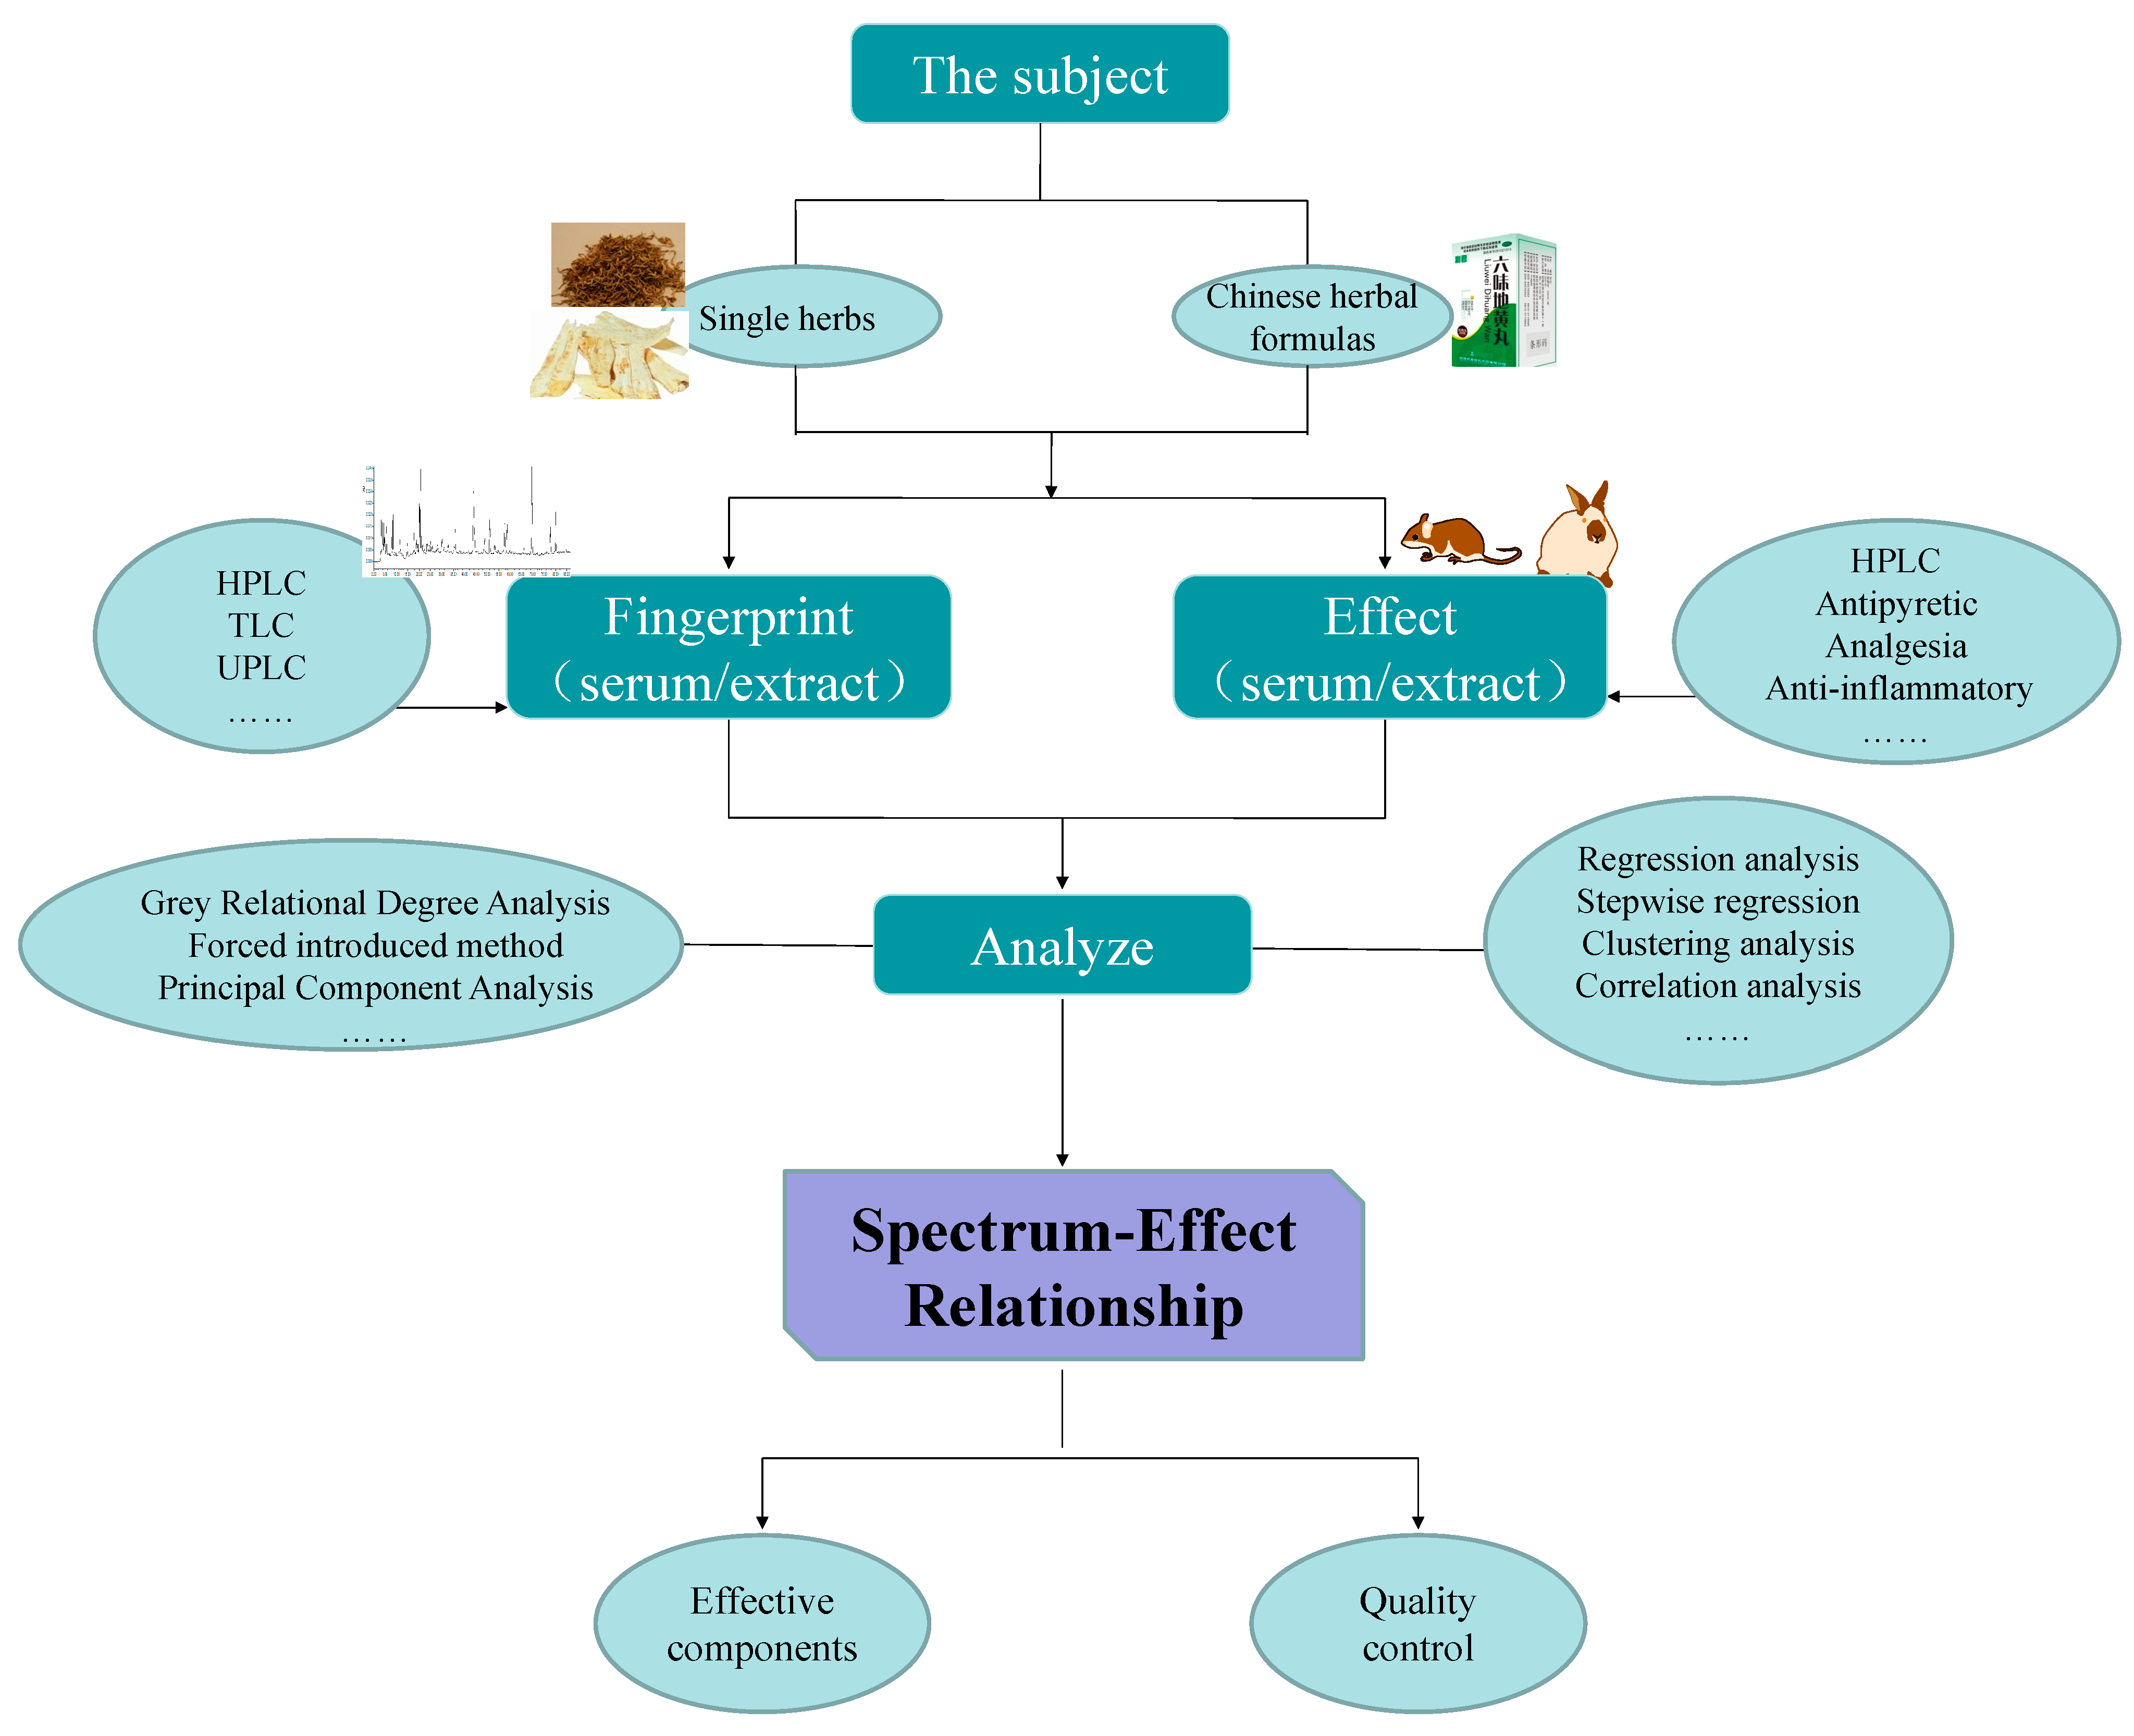
Based on the habits of TCM drug usage, the research objects of spectrum-effect relationships may contain a single herb (Chinese herbal medicine, Chinese medicine decoctions) or a Chinese herbal formula. In addition, Chinese herbal preparations and sera containing drugs are two special study forms requiring special focus. In order to simplify the study, researchers use some different and appropriate processing approaches for each of them. The basic hierarchical chart of the research objects is shown in Figure 3.
3.1. Single Herbs
In Chinese medicine, a single herb has an unmatched effect. It can cure disease by itself or with the help of other herbs. For a feasible intricate interaction of different compounds, a single herb study would be a good start. Different ways of processing a single herb were done to reduce the degree of study difficulty. Through investigating the literature, we found that most related work is about the spectrum-effect relationships of single herbs (Table 1). It is divided into four objects under the caption “single herb”, that is different batches (DB), different extracts (DE), different extract combinations (DEC), and different processing methods (DPM), respectively.
DB refers to a single herb from a different production area, resource and collection time. DE comes from a single herb and different parts of one herb. Their extractive solvents may have different polarity. Their combination, sometimes with an orthogonal method, namely DEC, was also investigated.
Through DPW, different Chinese medicines showing different effects could be prepared from one kind of herb. This process is called “Paozhi”. It refers to different processing methods such as water treatment, fire treatment, both water and fire treatment and other ways. DPWs have a certain impact on the efficacy and toxicity. In standard TCM use practice, DPWs applied to the same Chinese herbal medicine may affect different symptoms and the toxicity will vary, so what makes this effect change is also a research hotspot.
3.2. Chinese Herbal Formulas
Chinese herbal formulas, consisting of various single herbs, are the most common form used in clinical applications. Compared with single herbs, they possess unparalleled advantages when faced with miscellaneous diseases. The correlative research is relatively rare (Table 2), although TCM formulas are another main research object of the spectrum-effect relationship field.

Figure 3.
The spectrum-effect relationship research objects.
Figure 3.
The spectrum-effect relationship research objects.
Abbreviation: DB—different batches; DE—different extracts; DEC—different extracts combination; DPM—different processing ways; HC—herbs combination.

Table 1.
Summary of single herb spectrum-effect relationships.
| Chinese Herb Medicine | Processing Method | Fingerprint | Effects | Experimental Model | Analytical Method |
|---|---|---|---|---|---|
| Vaccinium ashei Reade | DB | HPLC | Antioxidant effect | Scavenge DPPH radical | HCA [11]; |
| Bostaurus domesticus Gmelin. | DB DE | UPLC | Antibacterial effect | Escherichia coli | HCA, OMLR, PCA [12,13]; |
| Isatis indigotica Fort. | DB | HPLC | Antibacterial effect | Escherichia coli | HCA, PCA, OMLR [14,15]; |
| Psoralea corylifolia Linn. | DB | HPLC | Antioxidant effect | Scavenge DPPH radical | CA [19]; |
| Angelica sinensis (Oliv.) Diles | DB DPM | HPLC | Reinforcing Qi, Replenishing blood Scavenging free radicals | Mice Fenton reaction | GRDA [20]; OMLR [21]; |
| Cureuma kwangsiensis S. G. Lee et C. F. Liang | DB | GC | Antitumor effect | Nasopharygeal carcinoma cells | GRDA [22]; |
| C.kwangsiensis S. G. Lee et C. F. Liang stir-baked with vinegar | DB | HPLC | Dispersing blood stasis effect | Mice | GRDA [23]; |
| Polygoni cuspidati Sieb. et Zucc. | DB DE | HPLC | Antibacterial effect Anticancer effect | Scavenge DPPH radical Mice, Rat, Leukemia cell line K 562, Lung cancer cell line A 549 | BCA [24] PLSR, GRDA [25,26,27,28,29,30]; |
| Morina nepalensis D. Don var. alba (Hand. -Mazz.) Y. C. Tang | DB | HPLC | Anti-inflammatory effect | RAW 264.7 cells | PLSR [31]; |
| Juglansmandshurica | DE | TLC | Antitumor effect | BGC 803 cancer cells | CA [32]; |
| Paeoniae lactiflora Pall. | DE | HPLC | Cooling blood effect | Rat alveolar macrophage NR 8383 | PLSR [33,34]; |
| Rheum palmatum L. | DB DPM | UPLC HPLC | Anti-HIV-1 effect Hemostatic effect | HIV-1 reverse transcriptase Mice | PCA [35]; GRDA [36]; |
| Rheum officinale Baill. | DE | HPLC | Tyrosinase inhibitor | Tyrosinase | CA [37]; |
| Salvia miltiorrhiza Bunge | DB DE | HPLC | Anti-oxidation effect | Fenton reaction Mice | BCA [38]; PLSR [39]; |
| Erigeron breviscapus (Vant.) Hand-Mazz. | DEC | HPLC | Neuroprotective effects | SH-SY5Y cells | BCA [40]; |
| Euphorbia humifusa Willd. | DE | HPLC | Antifungal effect | NCCLS M 38-A | GRDA [41]; |
| Cordyceps sinesis (Berk.) Sacc. | DB | HPLC | Anti-hepatic fibrosis effect | LX-2 hepatic stellate cells | BCA [42]; |
| Alpinia officinarum Hance. | DE | HPLC | Promotion of melanogenesis effect | Melanoma B 16 cells | GRDA [43]; |
| Pogostemon cahlin (Blanco) Benth. | DE | HPLC | Anti-gastrointestinal propulsion effect | Mice | GRDA [44]; |
| Polygonum orientale L. | DEC | UPLC | Protective effect on myocardial cells | Myocardial cells | BCA [45]; |
| Coptis chinensis Franch. | DB DPM | HPLC UPLC | Ameliorating insulin resistanc Antibacterial effect | 3T3-L1 preadipocyte ATP bioluminescence | PCA,CA,GRDA [46,47]; HCA [48]; OMLR [49]; |
| Astragalus membranaceus (Fisch.) Bge. var. mongholicus (Bge.) Hsiao | DB DEC | HPLC | Improving immunity effect Anti-gastric ulcer effect Diuretic effect Antifatigue effect | Mice | GRDA [50]; PLSR,GRDA [41,42,43,44,45,46,47,48,49,50,51,52,53]; GRDA [54]; |
| Scutellaria baicalensis Georgi | DB | HPLC | Antipyretic effect Antibaterial effect | Rat
Staphylococcus aureus | GRDA [55]; GRNN [56]; |
| Bupleurum chinense DC. | DE | HPLC | Hepatoprotective effect | Mice | HCA, TCA [57]; |
| Tinospora sagittata (Oliv.) Gagnep. | DB DE | HPLC | Anti-inflammatory effect Analgesia effect | Mice | CA [58]; |
| Lonicera japonica Thunb. | DB DE | HPLC | Anti-influenza virus effect Anti-inflammatory effect; Analgesia effect | MDCK cells Mice | OMLR [59,60]; |
| Murraya exotica L. | DE | HPLC | Anti-inflammatory effect | Mice | GRDA [61]; |
| Zanthoxylum nitidum (Roxb.) DC. | DB | IR | Antitumor effect Antineoplastic effect | 7901, Hela cells | OMLR [62,63,64] |
| Kalimeris indica (L.) Sch-Bip | DB | HPLC | Anti-inflammatory effect | Mice | GRDA [65] |
| Citrus grandis (L.) Osbeck | DE | HPL C | Antioxidant effect | KMnO4 | GRDA, CA, GRNN [66]; |
| Paeonia suffruticosa Andr. | DE | HPLC | Promote blood circulation Remove blood stasis | Mice | OMLR [67]; |
| Cnidium monnieri L.Cuss. | DE | HPLC | Sedative-hypnotic effect | Mice | CA [68]; |
| Artemisia capillaries Thunb. | DE | HPLC | Hepatoprotective effect | Mice | CA [69]; |
| Crataegus pinnatifida Bge. | DB | HPLC | Antioxidant effect | Rat | CA [70]; |
| Peucedunum harrysmithii var. subglabrum (shan et sheh) | DB | HPLC | Eliminate phlegm effect | Mice | GRDA [71]; |
| Evodia ruatecarpa (Juss.) Bneht. Var. bodinieri (Dode) Huang | DE | HPLC | Alleviate intestinal cramps effect | Rabbit | CA [72]; |
| Pseudostellaria heterophylla (Miq.) Pax | DE | HPLC | Cytotoxic effect | MGC 80-3, RKO, HepG2 cells | CA [73]; |
| Panax notoginseng (Burk.) F.H.Chen | DB | HPLC | Anti-myocardial ischemia effect | Rat | CA, FMA, PCA [74]; |
| Aconitum carmichaelii Debx. | DPM | UPLC | Mitochondria growth promoting effect | Rat | CA [75]; |
| Aconitum L. | DB | UPLC | Antibacterial effect | Escherichia coli | CA [76]; |
Abbreviations: DB—different batches; DE—different extracts; DEC—different extracts combination; DPM—different processing methods; HCA—Hierarchical Cluster Analysis; PLSR—Partial Least Squares Regression; OMLR—Ordinary Multiple Linear Regression; CA—Correlation Analysis; GRDA—Gray Regression Degree Analysis; FMA—Fuzzy Mathematical Analysis; PCA—The Primary Component Analysis; BCA—Bivariate Correlation Analysis; GRNN—General Regression Neural Network.
Table 2.
Summary of Chinese herbal formula spectrum-effect relationships (for abbreviations refer to the footnote in Table 1).
| Names | Involved TCMs | Fingerprint | Effects | Experimental Model | Analytical Method |
|---|---|---|---|---|---|
| Baihu Tang | Anemarrhena asphodeloides Bge. Gypsum fibrosum Glycyrrhiza uralensis Fisch. Rice | HPLC | Anti-inflammatory effect | Rat | BCA [77] |
| Danggui Chuanxiong | A. sinensis (Oliv.) Diels. Ligusticum chuanxiong Hort. | HPLC | Anti-myocardial ischaemia effect | Rat | BCA, OMLR [78] |
| Mongolian Preparation Sendeng-4 Decoction | Xanthoceras sorbifoliae Bunge. Melia toosendan Sieb.et Zucc Terminalia chebula Retz. Gardenia jasminoides Ellis. | HPLC | Anti-inflammatory and analgesic effect | Mice | OMLR [79] |
| Compound Wuren chun Capsules | Schisandra chinensis (Turcz.) Baill. B. chinense DC. P.notoginseng (Burk.) F. H. Chen Phyllanthus urinaria L. | HPLC | Liver protection | Rat | CA [80] |
| Gushu Dan | Epimedium brevicornu Maxim. Drynaria fortunei(Kunze) J. Sm. C. monnieri (L.) Cuss. S. miltiorrhiza Bge. | HPLC | The proliferative effect of osteoblast-like cells | Osteoblast-like cells | BCA, OMLR [81] |
| Tongsaimai Pellet | A. membranaceus (Fisch.) Bge.var.mongholicus (Bge.) Hsiao G. uralensis Fisch. Lonicerae japonicae Thunb. Scrophularia ningpoensis Hemsl. Dendrobium nobile Lindl. A. sinensis (Oliv.) Diels. | UPLC | Brain protection Vasodilatation effect PC12 cell injury protection; | Rat, Rabbit, PC 12 cells | HCA [82] |
| Xiaoyao Wan | B. chinense DC. G. uralensis Fisch. A. sinensis (Oliv.) Diels. Paeonia lactiflora Pall. Atractylodes macrocephala Koidz. Poria cocos (Schw.) Wolf Mentha haplocalyx Briq. Zingiber officinale Rosc. | HPLC GC | Anti-tyrosinase effect Anti-depression effect | B 16 melanoma cells Mice | BCA [83,84] |
| Jia Wei Si Miao Decoction | Atractylodes lancea (Thunb.) DC. Phellodendron chinense Schneid. Achyranthes bidentata Blume Coix lacryma-jobi L. var. mayuen. (Roman.) Stapf | GC HPLC | Anti-inflammatory effect Analgesia effect Decrease blood uric acid | Mice | OMLR, CA [85,86] |
| Ling Gui Shu Gan Tang | P. cocos (Schw.) Wolf Cinnamomum cassia Presl A. macrocephala Koidz. G. uralensis Fisch. | HPLC | Diuretic effect Anti-hypoxic effect | Mice | OMLR [87] |
| Shaoyao Gancao formulas | P. lactiflora Pall. G. uralensis Fisch. | HPLC | Analgesic effect | Mice | CA [88] |
| Qi Zhi Wei Tong | B. chinense DC. Corydalis yanhusuo W.T.Wang Citrus aurantium L. Cyperus rotundus L. P. lactiflora Pall. G. uralensis Fisch. | HPLC | Anti-inflammatory effect | RAW 264. 7 cells | GRDA, GRNN [89] |
| Sheng Hua Tang | A. sinensis (Oliv.) Diels L. chuanxiong Hort. Prunus persica (L.) Batsch Zingiber offcinale Rosc. G. uralensis Fisch. | HPLC | Invigorate the circulation of Qi | Rat | CA [90] |
| Tao Hong Si Wu Tang | P. persica (L.) Batsch Carthamus tinctorius L. A. sinensis (Oliv.) Diels. Paeonia veitchii Lynch Rehmannia glutinosa Libosch. L. chuanxiong Hort. | GC | Analgesic effect | Mice | OMLR, CA [91] |
| Wu Zhu Yu Tang | Evodia rutaecarpa (Juss.) Benth Panax ginseng C. A. Mey. Z. officinale Rosc. Ziziphus zizyphus Mill. | HPLC | Analgesic effect Anti-nausea effect | Mice | OMLR [92] |
| Xie Bai San | Morus alba L. Lycium chinesnse Mill. G. uralensis Fisch. | HPLC | Anti-inflammatory effect Expectorant effect | Mice | OMLR, BCA [93] |
| Zuo Jin Wan | C. chinensis Franch. E. rutaecarpa (Juss.) Benth. | HPLC | Biothermo-logical effect | Escherichia coli | CA [94] |
| Da Cheng Qi Tang | R. palmatum L. Magnolia officinalis Rehd. et Wils. C. aurantium L. | HPLC | Purgative effect | Mice | HCA [95] |
For the meaning of abbreviations refer to the footnotes in Table 1.
The reason is mainly that the compounds in TCMs are so complicated and it is not easy to find out the component(s) related to a particular effect. Here, Chinese herbal formulas are divided into three objects: DE, DEC and herb combinations (HCs).
HC refers to a herb and its contents in an orthogonal formula combination. It can look for the best drug combination to display a synergy or attenuation effect. It also probes into the active substance or the main drugs in a formula. One way is considering the pharmacodynamic effect of a total formula, then removing a single drug or a group of drugs from the formula to measure the effect of the remaining part, and thus evaluate the removed drugs’ influence on the effect of the total formula. This method is applied to study the interaction of a single herb in a whole formula. Chen et al. used this method to analyze Sheng Hua Tang. They found that the total formula was superior to the decomposed recipe, and 13 compounds were identified as the likely material basis of the activity [90].
Another method is on the basis of the efficacy of a whole formula, doing parallel experiments using the same dose or different doses of each herb, or dividing them into several groups in accordance with the principle of “jun, chen, zuo, shi” or “medicine pairs” to do parallel experiments. Through the study of the dose variation of each herb in Wu Zhu Yu Tang, Ning et al. identified four components as its material basis [92].
3.3. Chinese Medicine Preparations
With the development of Chinese medicine, many Chinese medicine preparations such as granules, capsules, pills and injections are now produced in order to cater to the demands of customers. To guarantee these preparations’ quality, fingerprints have been widely recognized around the world as a holistic system because they provide the possibility for the control of TCM quality. Fingerprints are based on the characteristics of systemacity and stability and they determine a few active ingredients or marker compounds. This is far from enough to control the quality of TCMs, and the chemical medicine control mode is not suitable for TCMs without a comprehensive evaluation of overall quality. Spectrum-effect relationship studies would be a better choice. For instance, in the spectrum-effect relationship study of Houttuynia cordata injections, Lu et al. preliminarily solved the problem of its quality evaluation [96]. Related reports on preparations and sera are scarce, as shown in Table 3.
3.4. Drug-Containing Serum
Serum fingerprints, being a research hotpot since Shinichi [97] put forward the idea of serum- containing drugs in 1988, could clarify the real components that produce the healing efficacy in vivo. However, their complexity has hindered development to some extent.
TCMs contain many ingredients, and only the ingredients absorbed into the bloodstream can produce an effect. That is to say, the “transitional ingredients” in serum are likely to be the real basis of efficacy. Thus, by analyzing the components present in serum after oral administration, it is able to quickly and accurately determine the direct effect(s) the compounds are causing.
Table 3.
Summary of the spectrum-effect relationships of Chinese medicine preparations and drug-containing sera.
| Names | Type | Fingerprint | Effects | Experimental Model | Analytical Method |
|---|---|---|---|---|---|
| Radix Astragali Injection | Chinese medicine preparation | HPLC | Antioxidant effect | Scavenge DPPH radical | PLSR [98]; |
| San Huang Preparation | Chinese medicine preparation | HPLC | Improve insulin resistance Antiendotoxin effect | Rat, The 3T3-L1 preadipocytes cells | OMLR, BCA, PCA [49,99]; |
| Xiang Dan Injection | Chinese medicine preparation | HPLC | Anti-myocardial ischemia effect | Rat | GRNN [100]; |
| Bu Zhong Yi Qi Wan | Serum containing drug | HPLC | Blood enriching effect | Mice | GRDA [101]; |
| Xiao Yao Fang | Chinese medicine preparation | HPLC | Anti-depression effect | Rat | GRDA [102]; |
| H. cordata Injection | Chinese medicine preparation | GC | Anti-inflammatory effect | Rat, Mice | HCA [96]; |
| Carthamus tinctorius L. | Serum containing drug | CE | Increase the coronary artery flow Enhance the heart stroke amplitude Decrease the heart rate | Rabbit Guinea pig | CA [103]. |
For the meaning of abbreviations refer to the footnotes in Table 1.
Due to the fact that the regularity of distribution, absorption, metabolism and excretion of various components in the compound are different; the variation of the characteristic peaks in the corresponding fingerprints will be diverse. This provides a good entry point to understand the changes of complex components in the body. Serum fingerprints have been reported [104]. With the help advanced technology, such as UPLC-MS, it provides the possibility for studying spectrum-effect relationships.
Seen from the introduction of the above four research objectives, the efficacy of TCMs comes from a variety of active ingredients acting in synergy, or even the collaborative or antagonistic effects of some inactive ingredient(s), other than simply a single active chemical ingredient. Nowadays, some researchers only study the spectrum-effect relationships of different single fractions without considering their superposition. We suggest that establishing a continuous dynamic fingerprint with different polarity combinations can readily find the above functional components.
4. Methods for Establishing Fingerprints for Spectrum-Effect Relationships
There are a variety of methods to establish TCM fingerprints, including thin layer chromatography (TLC), high-performance liquid chromatography (HPLC), gas chromatography (GC), high speed counter current chromatography (HSCCC), mass spectroscopy (MS) and capillary electrophoresis (CE) [105]. Nowadays, in spectrum-effect relationship studies, almost only HPLC (or UPLC) and GC methods are used, and only three references to the use of CE, TLC and IR were found [32,36,62]).
When studying the spectrum-effect relationship, the fingerprints generally come from two sources: the chemical fingerprint of the TCM and the serum fingerprint of the TCM. Currently the most used method to establish fingerprints is HPLC, which offers a high degree of separation. A complex chemical composition can be easily separated into high or low peaks forming a chromatogram, but because of the high sensitivity, choosing the appropriate peaks always involves technical difficulties that can be hard to conquer. HPLC is mainly used to identify the corresponding ingredients of the fingerprint peaks and can provide a lot of information. It is also limited by the available detectors, for example the UV detector can only discern compounds having conjugated structures, and ELSD is for more volatile components only.
GC, with its high separation efficiency, high sensitivity, small amount of sample, etc., is used to study the spectrum activity relationships of Chinese medicines containing volatile components. On the other hand GC is difficult to use in the analysis of thermally unstable substances and large molecular weight components, so its applications have been limited in spectrum-activity relationship studies.
Different methods for establishing fingerprints are suitable for different samples. Besides, when the relationship between a continuous dynamic fingerprint and the related effect(s) is established, common peaks, characteristic peaks with high content and the peaks whose content is changing in the fingerprint should all be chosen.
5. Pharmacodynamics Studies for Spectrum-Effect Relationships
When performing spectrum-effect relationship studies, usually there are two ways to obtain the effects. One is to choose a Chinese medicine extract to do pharmacodynamics studies, the other one is choosing serum containing the drug to do pharmacological experiments. Pharmacodynamics studies of Chinese medicines include in vivo and in vitro experiments. In vivo experiments use artificial animal pathology models to maintain the integrity of the body, ensuring normal contact with the external environment. Experimental studies can be carried while the animals are anesthetized or awake. In vitro experiments using organs or cells investigate the role of drugs on a particular portion of the overall body separately, so it is more intuitive [1]. We summarize the effects and pharmacodynamic models from the published articles about spectrum-effect relationships shown in Table 1, Table 2 and Table 3. Pharmacodynamic indexes and chosen models should follow the principle of reasonability, effectiveness and accuracy.
5.1. The Pharmacodynamics Studies of TCM Extracts
In the pharmacodynamics studies of TCM extracts, after extraction and separation, the extract of the medicine was added directly to the reaction system or in vitro culture system to observe the effect. These experimental methods were carried out in in vivo and in vitro experiments.
There are some problems and defects in the methodology to do in vitro experiments directly using TCM crude extracts. This approach ignores that the vast majority of cases clinical administration of TCMs is through oral administration. After being metabolized by the gastrointestinal tract and liver, the components that finally reach the blood are usually not the original drug ingredients. There are also some metabolism ingredients. Besides, in the clinic TCM focuses on dialectical therapy. That is to say, TCM treats diseases in the case where certain syndromes exist (that is, a certain body state). It is hard to copy a disease which may be affected by other body systems. What’s more, TCMs consist of a variety of ingredients, thus the overall effect of the multi-component mixture is not equal to the effect of the various parts. Therefore, it is difficult to reflect the pharmacological effects and changing rules of the body in the real blood concentration.
5.2. Pharmacodynamics Studies of Drug-Containing Serum
Many ingredients in TCMs can only act after absorption into the bloodstream. The blood contained ingredients may be the substances playing a direct role in the body. Research on the components in the serum could be an effective approach to identify the effective substance(s). Using drug-containing serum instead of the decoction or crude extracts to do in vitro or in vivo experiments is thus also a research hotpot.
The so-called drug-containing serum in vitro experiment refers to when after oral administration of a Chinese medicine or Chinese herbal compound to animals, a certain time later the animal’s blood is collected, the serum separated, and then this drug-containing serum is used to do pharmacological experiments. This can reflect not only the pharmacological effects of the components coming into the body and their metabolites, but also the role played by any drug-induced endogenous components. It can objectively simulate the process producing the pharmacological effects of the drug in an in vivo environment. The experimental conditions are closer to the internal environment where the drug plays is effects in the body, greatly improving the credibility of the experimental results.
We should base experiments on the clinical indications of Chinese medicine products to carry out pharmacodynamics studies at different levels of the whole body, organ, cell and molecular biology, to look for activity indicators which can more accurately reflect the observed effects. A TCM’s effect such as “strengthening the spleen”, “activating blood circulation to dissipate blood stasis”, “nourishing yin” and other effects are difficult to obtain or express by modern pharmacodynamic models. This needs further study [104].
6. Data Processing Methods of Spectrum-Effect Relationships
Data processing methods play a key role in “spectrum-effect relationship” studies. Different data processing methods will obviously affect the experiment results. For this reason, one or more data processing methods are used in combination when spectrum-effect relationships are established. A variety of methods each have their respective focus points. Combinations of multiple analysis methods and a secondary analysis of the data is the recommended pathway. Finally, the optimal spectrum-effect relationship will be obtained.
In recent years, scholars have been constantly improving the data processing methods applied in establishing the relationships. The processing methods used are not uniform, mainly including correlation analysis (CA), cluster analysis, regression analysis (mainly ordinary multiple linear regression, OMLR), gray correlation degree analysis (GRDA), fuzzy mathematical analysis (FMA), neural network analysis (GRNN) and the principal component analysis (PCA). According to the frequency of application, a simple introduction is shown as Table 4. Zhao et al. selected a Back Propagation Network (BPN) and Radial Basis Function Network (RBFN) to establish spectrum-activity relationship models of TCMs [106], and then used these models to predict efficacy and thus evaluate the quality of TCMs. Compared with the Hierarchical Cluster Analysis (HCA) and Partial Least Squares Regression (PLSR), the research results showed that the non-linear models based on neural networks are significantly better than the linear models, PCA and PLSR, whether it be in accuracy, prediction accuracy, or correlation coefficient. They were able to simulate well the complex nonlinear relationships between the various chemical components of the herbs and pharmacodynamic index of L. chuanxiong Hort., indicating the good application prospects for developing quality evaluation methods which can reflect the efficacy of TCMs in spectrum-effect relationship models. However, the data processing methods used have their respective defects, and one method alone is not always enough. Various mathematical processing methods using combined can be complement to each other, insure information maximization and improve accuracy. How to better combine them is another problem scholars should be delved into.
7. Conclusions and Future Perspectives
As a feasible approach to evaluate the effectiveness and safety of TCMs, spectrum-effect relationships has been considered for many years, though they are still at a preliminary stage, and this field has not yet formed mature and stable research ideas and methods.
There are some debatable issues in the existing research content [107]. We have also shown that there are some inconsistencies in the limited information presently available. The following measures should be applied to research of spectrum-effect relationships in the future:
Table 4.
Common analytical methods applied in spectrum-effect relationships.
| Method | Purpose | Advantages | Limits |
|---|---|---|---|
| CA | Study close degree between variable | Determine the relativity degree, significant extent and direction of change | Cannot explain the combined effect of the various peaks corresponding components to the pharmacodynamic indicators |
| HCA | Study the problem of classification, also known as group analysis | Intuitive, concise and achieve the classification | Cannot evaluate the correlation magnitude and the direction between fingerprint peaks and pharmacodynamic indicators |
| OMLR | Study a linear function to clarify the relationship between one dependent and two or more independent variables | Most commonly used method to study the intrinsic link | Not be able to see the contribution of peaks to the efficacy and not suitable for multiple correlation independent variables |
| PLSR | Allow the condition of the number of samples is less than that of variables to do regression modeling | Strong practicality and stability includes; Include all the original peaks of fingerprints | Abstract and difficult to understand; only suitable for qualitative analysis but not to determine the precise quantitative relationship between them |
| GRDA | Analyze the association degree of the various factors in system | Can use the known information to reveal unknown information | Difficult to describe overall contribution of the various peaks corresponding components through pharmacodynamic indicators |
| PCA | Elect fewer important variables from multiple variables through a linear transformation | Without loss of characteristic value number and information of sample | The amount of information after variable dimension reduction maintaining at a high level; The extracted principal component number being less than the original number of variables |
For the meaning of abbreviations refer to the footnotes in Table 1.
7.1. The Application of Advanced Modern Analytical Technology
As shown in Figure 1, although research articles about spectrum-effect relationships represent a rising trend, most achievements were published in Chinese journals. This may mainly be because Western and traditional Chinese medical practices represent totally different philosophies, while spectrum-effect relationships are proposed based on a holistic concept. The fingerprint emphasizes the complete component spectrum rather than the exact nuances, and the information of quality it reflects is a comprehensive result. Current fingerprint technology can only evaluate the chemical constitution stability of different TCM batches, while lacking any judgment about their quality. Moreover, the amount of information reflected in a fingerprint can be too large, which is a major problem in spectrum-effect research. When the sample was not purified, due to the limitations of the detectors, each common peak in a HPLC trace may represent one or some mixed compounds, thus the established spectrum-effect relationship may not be accurate. Last but not the least, the purpose of the spectrum-effect relationship studies is to look for the active ingredients of TCMs. The current studies are focused on the active chromatographic peaks of the fingerprints, but there is no identification of the structures.
Therefore, the use of a variety of modern analytical technologies is especially necessary to identify the structures corresponding to the main peaks. The common modern analytical technology includes HPLC-MS, UPLC-MS, GC-MS, etc. Through the combination of multi-analytical technology, multi- fingerprints possessing various and complementary information can be established, so as to integrally express the overall chemical features of complicated material systems. By connecting the multi- fingerprints with effects, and seeking out the fingerprint peaks or component group related to the effects, an effect-fingerprint that can reflect the inherent quality is hopefully established, and thus we can evaluate the TCM quality by its chemical fingerprint.
7.2. Selecting Pharmacodynamic Models Close to the Clinical Efficacy
Many westernized pharmacological models used nowadays in pharmacodynamics studies do not reflect the clinical efficacy of TCMs well. However, taking into account the needs for TCMs around the world, establishing appropriate models and indicators for evaluation of the efficacy of TCMs is an urgent problem that should be solved today [108]. When selecting a pharmacodynamic model, one should try to select a model close to Chinese medicine theory, so as to ensure the processed products screened according to the spectrum-activity relationships are able to display good efficacy in a clinical setting. From the different levels of the whole body, organs, cells and molecular biology, we should look for activity indicators which can more accurately reflect the effect and establish pharmacodynamic methods having in vitro and in vivo multi-indicators of TCM activity. The choice of a suitable pharmacodynamic index is also very important for the studies of multi-dimensional spectrum-effect relationships.
7.3. Choosing the Proper Data Processing Method
At the present, data processing methods used in TCM research are not standardized, and a variety of data processing methods each have their particular focus. For this reason, it is crucial to select the appropriate data processing method in TCM research, but there are many difficulties in choosing a proper data processing method, because of the complexity of TCMs and data processing methods.
The various methods each have their respective strengths and weaknesses. One solution is to try to use them in combination, but different methods often produce different results because of the information loss, so further work should be done to establish more exclusive mathematical models, test their rationality, and use the model to identify chromatographic peaks that have positive and negative correlations with efficacy. Then enrich and prepare samples and proceed with structural identification, testing and verification of efficacy, and even identifying the active portion of a TCM instead of stopping at the point of the spectrum-effect relationship.
Spectrum-effect relationship studies are used to put forward new ideas and methods for exploring effective substances, optimizing formulas, improving preparation processes, tracking and separating target active ingredients, and for the development of new TCM drugs. It is actually interdisciplinary and cutting-edge science. More professional talents need to be introduced to the development of related software engineering. If people with different professional background contribute to TCM research by co-operating, there may be wider world waiting for us to explore. In short, the area of spectrum-effect relationships is a hot and difficult spot in the field of research on multi-component, multi-target, and multi-link TCMs, and it should be constantly addressed and perfected in practice.
Acknowledgments
Financial support of this work was provided by National Natural Science Foundation of China (NO. 81001697), Beijing Nova Program (No.2011070), Excellent Talents of Beijing (NO. 2012B009999000003), Innovation research team of Beijing University of Chinese Medicine (NO. 2011-CXTD-12), Self-selected Topic of Beijing University of Chinese Medicine (NO. 2011JYB22XS-061, 2013-JYBZZ-JS-137 and 2014-JYBZZ-JS-026), National Training Programs of Innovation and Entrepreneurship for Undergraduates (NO. 201210026051 and 201410026040), and Scientific Research Project of Beijing Educational Committee for Undergraduates (NO. BJGJ1114 and BJGJ1115).
Author Contributions
Guanling Xu, Xiaoyan Yang and Meng Xie drafted and revised the manuscript, Yan Song, Cheng Yan, Yue Yang, Xia Zhang, Zizhen Liu, Yuxin Tian, Yan Wang, Rui Jiang, Weirui Liu, and Xiaohong Wang made suggestions and played an important role in preparing this paper, and Gaimei She approved the final version.
Conflicts of Interest
The authors declare no conflict of interest.
References
- Zhang, L.; Yan, J.B.; Liu, X.M.; Ye, Z.G.; Yang, X.H.; Meyboome, R.; Chan, K.; Shaw, D.; Duez, P. Pharmacovigilance practice and risk control of Traditional Chinese Medicine drugs in China: Current status and future perspective. J. Ethnopharmacol. 2012, 140, 519–525. [Google Scholar] [CrossRef]
- Li, R.; Yan, Z.Y.; Li, W.J.; Xu, T.; Tan, R.A.; Pan, L.; Li, Y.M.; Ma, Y.L. The establishment of chromatographic pharmacodynamics. Educ. Chin. Med. 2002, 21, 62. [Google Scholar]
- Liang, Y.Z.; Xie, P.S.; Chan, K. Quality control of herbal medicines. J. Chromatogr. B 2004, 812, 53–70. [Google Scholar] [CrossRef]
- Yuan, R.; Yuan, L. Traditional Chinese medicine: an approach to scientific proof and clinical validation. Pharmacol. Ther. 2000, 86, 191–198. [Google Scholar] [CrossRef] [PubMed]
- Alaerts, G.; Dejaegher, B.; Smeyers-Verbeke, J.; Vander Heyden, Y. Recent Developments in Chromatographic Fingerprints from Herbal Products: Set-Up and Data Analysis. Comb. Chem. High Throughput Screen. 2010, 13, 900–922. [Google Scholar] [CrossRef]
- Li, P.; Qi, L.W.; Liu, E.H.; Zhou, J.L.; Wen, X.D. Analysis of Chinese herbal medicines with holistic approaches and integrated evaluation models. Trends Anal. Chem. 2008, 27, 66–77. [Google Scholar] [CrossRef]
- Xie, P.S. A feasible strategy for applying chromatography fingerprint to assess quality of Chinese herbal medicine. Tradit. Chin. Drug Res. Clin. Pharmacol. 2001, 3, 141–151. [Google Scholar]
- Li, G.S.; Liu, C.H.; Wang, H.S.; Zhang, L.J. Assaying of content of catalpol in Rehmanniaglutinosa from different origins. Chin. Tradit. Herb. Drugs 2002, 33, 126–128. [Google Scholar]
- Pan, R.J.; Guo, F.Q.; Lu, H.M.; Feng, W.W.; Liang, Y.Z. Development of the chromatographic fingerprint of Scutellaria barbata D. Don by GC–MS combined with Chemometrics methods. J. Pharm. Biomed. Anal. 2011, 55, 391–396. [Google Scholar] [CrossRef] [PubMed]
- Zhang, Y.Y.; Dan, M.; Wu, J.B.; Yang, H.Z.; Huang, H.; Qi, Y.; Wei, S.D.; Toru, O.; Kaoru, N. Study on the chromatographic fingerprinting of Schisandra chinensis (Turcz.) Baill. by LC coupled with principal component analysis. Chromatographia 2008, 68, 101–104. [Google Scholar] [CrossRef]
- Sun, L.Q.; Ding, X.P.; Qi, J.; Yu, H.; He, S.A.; Zhang, J.; Ge, H.X.; Yu, B.Y. Antioxidant anthocyanins screening through spectrum-effect relationships and DPPH-HPLC-DAD analysis on nine cultivars of introduced rabbiteye blueberry in China. Food Chem. 2012, 132, 759–765. [Google Scholar] [CrossRef]
- Kong, W.J.; Wang, J.B.; Zang, Q.C.; Xing, X.Y.; Zhao, Y.L.; Liu, W.; Jin, C.; Li, Z.L.; Xiao, X.H. Fingerprint-efficacy study of artificial Calculus bovis in quality control of Chinese material medica. Food Chem. 2011, 127, 1342–1347. [Google Scholar] [CrossRef]
- Zang, Q.C.; Wang, J.B.; Kong, W.J.; Jin, C.; Ma, Z.J.; Cheng, J.; Gong, Q.F.; Xiao, X.H. Searching for the main anti-bacterial components in artificial Calculus bovis using UPLC and microcalorimetry coupled with multi-linear regression analysis. J. Sep. Sci. 2011, 34, 3330–3338. [Google Scholar] [CrossRef]
- Kong, W.J.; Zhao, Y.L.; Shan, L.M.; Xiao, X.H.; Guo, W.Y. Investigation on the spectrum-effect relationships of EtOAc extract from Radix Isatidis based on HPLC fingerprints and microcalorimetry. J. Chromatogr. B 2008, 871, 109–114. [Google Scholar]
- Hu, X.Y.; Liu, M.H.; Sun, Q.; Zhang, S.J.; Jiang, L. Spectrum-effect relationship of antibacterial extracts from Isatidis Radix. Chin. Tradit. Herb. Drugs 2013, 44, 1615–1620. [Google Scholar]
- Li, Y.; Ma, L.; Shen, P.; Gong, M.X. Spectrum-effect relationships between HPLC fingerprints and antiendotoxin activity of chloroform extract from Isatidis Radix. Chin. Pharm. J. 2011, 46, 741–744. [Google Scholar]
- Zhao, Y.L.; Cao, L.; Wang, J.B.; Jin, C.; Xiao, X.H. Study on the n-BuOH extracts fingerprint chromatography and bacteriostatic activity of Radix Isatis and correlation analysis. Chin. Tradit. Pat. Med. 2005, 28, 1079–1082. [Google Scholar]
- Sun, Q.; Ma, L.; Li, L.; Hu, X.Y.; Jiang, L.; Xiao, X.H. Spectrum-activity relationship of hemagglutination components in Isatidis Radix. Chin. Tradit. Herb. Drugs 2012, 43, 125–130. [Google Scholar]
- Chang, Y.X.; Zhu, Z.W.; Li, J.; Zhang, Q.H.; Kang, L.Y.; Zhang, B.L. Research on antioxidant activity fingerprint of Psoralea corylifolia L. Tianjin J. Tradit. Chin. Med. 2011, 28, 158–160. [Google Scholar]
- Yang, Y.L.; Hu, F.; Liu, X.F.; Guo, L.; Yang, T.; Li, Y.D.; Feng, S.L. Spectrum-effect relationship of active fraction from Angelicae Sinensis Radix with effect of reinforcing Qi. Chin. Tradit. Herb. Drugs 2013, 44, 3346–3351. [Google Scholar]
- Guo, Y.S.; Hua, Y.L.; Deng, H.J.; Wei, Y.M. Relationship between HPLC fingerprint chromatogram and scavenging free radicals of different processed products of Radix Angelicae sinensi. Chin. Tradit. Pat. Med. 2010, 32, 2107–2111. [Google Scholar]
- Zeng, J.H.; Mo, X.Y.; Dai, P.; Huang, F.X.; Liao, Y.; Wang, J.H.; Chen, X. Study on spectrum-effect relationship between fingerprint of essential oil and of anti-tumor effect from curcuma kwangsiensis. Chin. J. Exp. Tradit. Med. Formulae 2012, 18, 91–94. [Google Scholar]
- Liao, W.; Zhang, J.M.; Fu, S.; Wang, J.S.; Fu, C.M. Chromatography-activity relation of stagnation of vital energy and blood stasis syndrome influencing hemorheology by stir-baked Curcumae Rhizoma with vinegar. Chin. Tradit. Pat. Med. 2013, 35, 330–334. [Google Scholar]
- Luo, Z.J.; Xu, Y.; Wu, J.Y.; Zhang, Z.F. Spectrum-effect relationship between HPLC fingerprints and antioxidant activity of Polygonum cospidatum. J. Southwest Univ. 2012, 34, 138–142. [Google Scholar]
- Peng, J.B.; Li, Q.; Lei, H.M.; Long, H.L.; Zhou, Y.X. Effective compositions of Polygoni Cuspidati study (I): Study on spectrum-effect relationship about clotting time. China J. Tradit. Chin. Med. 2011, 26, 1737–1739. [Google Scholar]
- Peng, J.B.; Li, Q.; Si, Y.C.; Long, H.L.; Lei, H.M.; Xiao, H.B. Study on the effective compositions of Polygoni Cuspidati II: Spectrum-effect relationship studies about pharmacodynamic of whole blood viscosity and HPLC. China J. Tradit. Chin. Med. 2011, 26, 1964–1966. [Google Scholar]
- Long, H.L.; Li, Q.; Si, Y.C.; Peng, J.B.; Lei, H.M.; Xiao, H.B. Spectrum-effect relationship study on influence of effective compositions research III of Polygoni Cuspidati on plasma viscosity. Mod. Med. Health 2011, 20, 3080–3082. [Google Scholar]
- Long, H.L.; Lei, H.M.; Li, Q.; Peng, J.B.; Si, Y.C. Effective compositions of Polygoni Cuspidati study (IV): Study on spectrum-effect relationship about fibrinogen. Guide China Med. 2012, 33, 4–5. [Google Scholar]
- Li, Q.; Xia, X.H.; Lei, H.M.; Xiao, H.B.; Song, Y.B. Effective Compositions of Polygoni Cuspidati (V): Study on spectrum-effect relationship of blood sedimentation rate. Acta Chin. Med. Pharmacol. 2011, 39, 63–65. [Google Scholar]
- Chen, H.G.; Zhao, H.B.; Zhao, C.; Zhou, X. HPLC fingerprint analysis of the extract from Polygonum cuspidatum and associated pharmacodynamics. China Pharm. 2010, 21, 1775–1776. [Google Scholar]
- Luo, P.; Liu, Y.; Lv, L.Y.; Zhang, Z.F. Spectrum-effect correlation analysis of traditional Tibetan medicine “Morinanepalensis” on nitric oxide production inhibition. China J. Chin. Mater. Med. 2013, 17, 2882–2885. [Google Scholar]
- Zhang, L.J.; Guan, J.; Liu, L.J. Preliminary exploration of antitumor pprofile-effect of fresh rejuvenated fruits of Juglans Mandshurica. Prog. Mod. Biomed. 2010, 10, 751–752. [Google Scholar]
- Song, Y.C.; Ma, H.B.; Cui, X.R.; Zhang, Q.; Lian, C.J.; Li, Q.; Lei, H.M. Spectrum-effect relationship between LC-MS fingerprint chromatogram and cell inhibitory rate of Paeoniae Radix Rubra and Paeoniae Radix Alba. Drug Clin. 2012, 27, 103–106. [Google Scholar]
- Song, Y.C.; Cui, X.R.; Lian, C.J.; Ma, H.B.; Zhang, Q.; Li, Q.; Lei, H.M. Comparative study on cooling blood between Radix Paeniae Rubra and Radix Paeoniae Alba (II): Spectrum-effect analysis on inhibitory apoptosis of LPS-stimulated rat alveolar macrophages. Chin. J. Exp. Tradit. Med. Formulae 2012, 18, 181–184. [Google Scholar]
- Ma, P.; Zhang, X.Y.; Xu, L.J.; Wang, Z.; Xiao, P.G. Spectrum-effect relationship between anti-HIV 1 activities and ultra-performance liquid chromatography fingerprints of Rheum species. China J. Chin. Mater. Med. 2013, 15, 2434–2437. [Google Scholar]
- Zhu, S.T.; Lei, P.; Li, X.Z.; Li, Y.L. Grey relational analysis fingerprint and hemostatic function of Rheum palmatum L. Cent. South Pharm. 2009, 7, 55–58. [Google Scholar]
- Liu, Y.J.; Wang, Q.; Jiang, M.; Li, H.Y.; Zou, M.J.; Bai, G. Screening of effective components for inhibition of tyrosinase activity in rhubarb based on spectrum-efficiency-structure-activity relationship. Chin. Tradit. Herb. Drugs 2012, 43, 2120–2126. [Google Scholar]
- Sun, G.X.; Gao, Y.N.; Sun, J.S. Correlation between quantified HPLC fingerprint and its anti-oxidation activity of Salviae miltiorrhizae Radix Et Rhizoma. Cent. South Pharm. 2013, 11, 535–538. [Google Scholar]
- Ni, L.J.; He, J.; Zhang, L.G.; Bi, Y.J. Relationship between HPLC fingerprints and anti-oxidation activity of different salvianolic acid extracts. Chin. Tradit. Pat. Med. 2011, 33, 2029–2033. [Google Scholar]
- Huang, Y.; Qi, X.L.; Guan, Z.Z.; Wang, Y.L.; Wang, A.M.; Li, C.B.; Chi, M.Y. Study on fingerprints correlated with pharmacodynamic of constituents in Herba Erigerontis against neurotoxicity induced by beta-amyloid peptide. China J. Chin. Mater. Med. 2010, 35, 1038–1041. [Google Scholar]
- Li, Z.J.; Zhou, L.; Gulnar, D.W.; Siafu, A.B. Grey relational analysis on fingerprint characteristics of different eluted parts of Euphorbia humifusa and antifungal effect. China J. Chin. Mater. Med. 2012, 37, 580–584. [Google Scholar]
- Wu, S.T.; Bai, J.X.; Wang, Z.; Dai, L.; Lv, Y.Q.; Yu, C.; Han, J.; Han, J.; Yuan, H.L. Spectrum-effect relationship on anti-hepatic fibrosis efficacy of Cordyceps sinesis and its cultured mycelia. Glob. Tradit. Chin. Med. 2013, 6, 801–805. [Google Scholar]
- Huo, S.X.; Kang, Y.T.; Peng, X.M.; Gao, L.; Yan, M. Spectrum-effect relationship of extract from rhizome of Alpinia officinarum on promotion of melanogenesis. Chin. Tradit. Herb. Drugs 2013, 44, 995–1002. [Google Scholar]
- Mei, Q.H.; Chen, Y.; Lan, S.M.; Fan, C.Q. Construction of pharmacodynamics fingerprint and analysis of spectrum effect relationship on anti-gastrointestinal propulsive of Herba Pogostemonis. China Med. Her. 2013, 10, 17–20. [Google Scholar]
- Zheng, L.; Li, J.; Chen, H.; Wang, Y.L.; Wang, A.M.; Huang, Y. Study on fingerprint-pharmacology correlation of protective effect of Polygonum orientale on myocardial cell oxidative injury induced by H2O2. China J. Chin. Mater. Med. 2012, 37, 2585–2588. [Google Scholar]
- Tang, G.X.; Huang, Y.J.; Zhang, Y.; Meng, X.L.; Luo, W.Z.; Li, J.C.; Geng, Z.P. Correlation between HPLC fingerprints and activity of Rhizoma Coptidis in amelliorating insulin resistance in vitro. World Sci. Technol./Mod. Tradit. Chin. Med. Mater. Med. 2009, 11, 828–833. [Google Scholar]
- Ma, X.X.; Liu, J.H.; Yu, B.Y. Spectrum-effect relationship of antibacterial activities in Coptidis Rhizoma. Drug Eval. Res. 2013, 36, 171–175. [Google Scholar]
- Kong, W.J.; Zhao, Y.L.; Xiao, X.H.; Wang, J.B.; Li, H.B.; Li, Z.L.; Jin, C.; Liu, Y. Spectrum-effect relationships between ultra performance liquid chromatography fingerprints and anti-bacterial activities of Rhizoma coptidis. Anal. Chim. Acta 2009, 634, 279–285. [Google Scholar] [CrossRef] [PubMed]
- Lai, X.L.; Zhang, Y.; Zheng, H.J.; Deng, C.; Fan, G.; Zhou, L.; Meng, X.L. Study on effective substances of San Huang preparation and its single herbs by serum pharmacochemistry. World Sci. Technol./Mod. Tradit. Chin. Med. Mater. Med. 2010, 12, 666–670. [Google Scholar]
- Huang, X.H.; Liang, J.; Ren, Y.; Wei, X.Y.; Feng, D.M.; Feng, S.L. Spectrum-effect relationship in effect of improving immunity of Astragali Radix. J. Chin. Med. Mater. 2012, 35, 1978–1981. [Google Scholar]
- Liu, X.H.; Liang, J.; Liang, J.D.; Dang, Z.L.; Feng, S.L. Spectrum-effect relationship on anti-gastric ulcer effect of Astragali Radix. Chin. Tradit. Herb. Drugs 2012, 43, 2448–2452. [Google Scholar]
- Deng, S.H.; Song, L.; Duan, X.J.; Zhang, D.L.; Nie, L. Correlation analysis between HPLC fingerprint of Astragali Radix extracts and antifatigue effect. J. Chin. Med. Mater. 2013, 36, 260–264. [Google Scholar]
- Liu, X.H.; Zhao, L.G.; Liang, J.; Guo, L.; Yang, Y.L.; Hu, F.; Zhu, R.J.; Feng, S.L. Component analysis and structure identification of active substances for anti-gastric ulcer effects in Radix Astragali by liquid chromatography and tandem mass spectrometry. J. Chromatogr. B 2014, 960, 43–51. [Google Scholar] [CrossRef]
- Liu, X.H.; Lin, X.Y.; Liang, J.; Chen, Y.L.; Ren, Y.; Feng, S.L. Spectrum-effect relationship in diuretic effect of Astragali Radix. Chin. J. Mod. Appl. Pharm. 2013, 30, 491–495. [Google Scholar]
- Meng, Q.G.; Wang, W.; Li, Q.; Xu, S. Spectrum-effect relationship in antipyretic effect of Huangqin (Radix Scutellariae). J. Beijing Univ. Tradit. Chin. Med. 2011, 34, 379–383. [Google Scholar]
- Zhao, B.N.; Yu, Z.Y.; Ding, X.Y.; Lv, L.; Li, K.; Li, S.B. Spectrum-efficient correlation pattern for quality evaluation of Scutellariae Radix. Chin. Tradit. Herb. Drugs 2011, 42, 380–383. [Google Scholar]
- Zhang, H.F.; Liu, J.; Zhang, J.; Yang, Y.; Wei, B.; Wang, Q.S. Spectrum-effect relationship of Bupleurum chinense for hepatoprotective effect based on cluster analysis and typical correlation analysis. Chin. Tradit. Herb. Drugs 2013, 44, 2696–2702. [Google Scholar]
- Wang, L.B.; Jia, X.S.; Chen, X.F.; Huang, Y.Q.; Sun, J.P. Sdudys on spectrum of diterpenoids constituents of Radix Tinosporae and relavant its pharmacology. Chin. J. Exp. Tradit. Med. Formulae 2011, 17, 83–86. [Google Scholar]
- Liang, S.W.; Cui, Y.X.; Wang, S.M.; Wu, M.X. Pharmacodynamic fingerprint of Flos Lonicerea by HPLC. Chin. Tradit. Herb. Drugs 2006, 37, 1489–1493. [Google Scholar]
- Gao, Y.; Zhao, B.N.; Yu, Z.Y.; Li, K.; Wang, B.L.; Yin, J. Study on the spectrum-efficient correlation pattern for quality evaluation of Lonicerae Japonicae Flos on anti-influenza virus. China J. Tradit. Chin. Med. Pharm. 2013, 28, 3508–3511. [Google Scholar]
- Wu, L.H.; Wen, H.L.; Jin, Q.; Cheng, Q.L.; Chenggen, J.S. Gray relational analysis on fingerprint of Murraya exotica and anti-inflammation effects. Chin. J. Exp. Tradit. Med. Formulae 2013, 19, 338–342. [Google Scholar]
- Mao, X.L.; Qin, Y.; Cai, J.; Zheng, J.M.; YE, Y.H.; Liu, H.G.; Huang, S.S. Infrared fingerprint of Zathoxylum nitidum and its effect on inhibition of tumor cell. J. Infrared Millim. Waves 2013, 32, 91–96. [Google Scholar]
- Wang, H.H.; Liu, H.G.; Huang, H.X.; Liu, L.M.; Shen, Q.R.; Cao, L.J. Studies on chromatogram-effect relation of Zanthoxylum nitidum (Roxb.) DC. on tumor cell line HeLa. Pharmacol. Clin. Chin. Mater. Med. 2011, 27, 84–89. [Google Scholar]
- Shen, Q.R.; Huang, H.X.; Wang, H.H.; Cao, L.J.; Feng, K.; Ye, Y.H.; Liu, H.G. Study on chromatography-efficacy relation of Zanthoxylum nitidum on gastric cancer cells. China J. Chin. Mater. Med. 2011, 36, 2693–2696. [Google Scholar]
- Chen, H.G.; Zhou, X.; Zhao, C.; Yang, S.L.; Yi, Z.X. Dose-response and HPLC spectrum-activity relationships of the anti-inflammatory active site of Kalimeris indica. Chin. Pharm. J. 2013, 48, 1190–1193. [Google Scholar]
- Chen, N.D.; Fang, M.Y.; Yu, C.F.; Lin, L.; Zhao, H.Y. Research of spectral efficiency relationship between total flavonoids fingerprints and antioxidant activity of Exocarpium Citri Grandis. J. Guangzhou Univ. Tradit. Chin. Med. 2012, 29, 702–706. [Google Scholar]
- Zhou, L.Y.; Liang, S.W.; Wang, S.M.; Wu, M.X.; Chen, C.Y. Studies on the pharmacodynamic fingerprint of Cortex Moutan. Lishizhen Med. Mater. Med. Res. 2008, 19, 1337–1339. [Google Scholar]
- Tong, L.G.; Song, M.Q.; Feng, M.L.; Jia, L.L.; Wu, Y.P.; Niu, Y.Y. Spectrum analysis of sedative-hypnotic material in Fructus Cnidii. Shanxi J. Tradit. Chin. Med. 2011, 27, 52–53. [Google Scholar]
- Wu, F.Y.; Chen, Y.X.; Zhou, R.L.; Jiang, B.; Zeng, Y.E.; Zhang, J. Evaluation of refinement process for extracting Herba Artemisiae with macroporous resin by the method of pharmacodynamics combining with fingerprint. Tradit. Chin. Drug Res. Clin. Pharmacol. 2009, 20, 166–168. [Google Scholar]
- Liu, R.H.; Chen, L.Y.; Yu, B.Y.; Huang, H.L.; Shao, F.; Ren, G. Exploring study on inhibition on O2− and correlative chemical characteristic fingerprint of Crataegi Folium. Chin. Tradit. Herb. Drugs. 2010, 41, 1173–1178. [Google Scholar]
- Liang, J.D.; Zhao, L.G.; Liu, X.H.; Li, W.; Dang, Z.L.; Liang, J.; Feng, S.L. Spectrum-effect relationship of reducing phlegm effect of Peucedanum harrysmithii var. subglabrum. China J. Chin. Mater. Med. 2012, 37, 2894–2897. [Google Scholar]
- He, Q.S.; Yang, W.P.; Zhang, L.Y.; Wang, H.; Mang, R.S. Study on the spectrum efficiency relationship of the Evodia ruatecarpa extracts ease the rabbit In vitro intestinal muscle spasm. Lishizhen Med. Mater. Med. Res. 2012, 23, 1108–1110. [Google Scholar]
- Lin, S.; Cai, Q.Y.; Zeng, J.W.; Zhu, X.Q.; Wu, J.Z. Correlation between cytotoxic activity and HPLC fingerprint chromatogram of the effective fractions of Radix Pseudostellariae. Nat. Prod. Res. Dev. 2012, 24, 349–352. [Google Scholar]
- Liu, X.; Li, M.C.; Xu, X.; Ji, S.G.; Xu, J.P.; Li, X.Z. Study on associativity between fingerprint of Panax Notoginseng and curative effect on myocardial ischemia in rat. Chin. J. Mod. Appl. Pharma. 2013, 30, 819–823. [Google Scholar]
- Zheng, Q.F.; Zhao, Y.L.; Wang, J.B.; Liu, T.T.; Zhang, B.; Gong, M.; Li, J.W.; Liu, H.H.; Han, B.; Zhang, Y.M. Spectrum-effectrelationships between UPLC fingerprints and bioactivities of crude secondary roots of Aconitum carmichaelii Debeaux (Fuzi) and its three processed products on mitochondrial growth coupled with canonical correlation analysis. J. Ethnopharmacol. 2014, 153, 615–623. [Google Scholar] [CrossRef] [PubMed]
- Sun, Z.Y.; Zhao, Y.L.; Liu, T.T.; Sun, X.J.; Li, R.S.; Zhang, P.; Xiao, X.H. Spectrum-effect relationships between UPLC fingerprints and bioactivities of five Aconitum L. plants. Thermochim. Acta 2013, 558, 61–66. [Google Scholar] [CrossRef]
- Wang, Y.; Feng, F.; Sun, L.L. Investigation on formula compatibility and spectrum-effect relationship of Bai-Hu-Tang. Pharm. Clin. Res. 2010, 18, 226–230. [Google Scholar]
- Zhang, J.; Yang, Y.F.; Wu, C.Z.; Fan, S.Y.; Xiao, W.; Wang, Z.Z. Spectrum-activity relationship of Angelicae Sinensis Radix-Chuanxiong Rhizoma supercritical fluid extraction with Carthami Flos against myocardial ischemia. Chin. Tradit. Herb. Drugs 2013, 44, 1944–1950. [Google Scholar]
- Xu, L.; Bi, K. Application of multiple linear regression analytical method to spectrum-activity relationship analysis of Mongolian preparation Sendeng-4 decoction. Comput. Appl. Chem. 2008, 25, 1189–1192. [Google Scholar]
- Dou, Z.H.; Luo, L.; Ding, A.W.; Wang, L.J.; Zhang, B.; Li, M. Profile-effect between fingerprint and liver protection of serum containing compound Wurenchun capsules. J. Fourth Mil. Med. Univ. 2008, 29, 116–118. [Google Scholar]
- Liu, M.; Liu, H.P.; Liang, M.X.; Xiong, Z.L.; Li, F.M. HPLC fingerprint analysis of Gushudan prescription and the correlation with its activity. J. Shenyang Pharm. Univ. 2007, 24, 758–762. [Google Scholar]
- Chen, J.; Wang, H.; Wang, H.H.; Yun, F.; Di, L.Q.; Zhao, X.L.; Cai, B.C. Tongsaimai pellets spectral efficiency related fingerprint establishment based on “Technology-fingerprint-effect” model research. J. Nanjing Univ. Tradit. Chin. Med. 2012, 28, 259–264. [Google Scholar]
- Zhang, N.; Li, H.J.; Kuang, Y.H.; Chen, Q.Y.; Wang, X.J. TCM serum pharmacochemistry-based analysis of the effective components of Xiaoyao San for the therapy of chloasma. World Sci. Technol./Mod. Trad. Chin. Med. 2010, 12, 643–646. [Google Scholar]
- Jia, G.C.; Zhou, Y.Z.; Ren, Y.L.; Qin, X.M. Study on the spectrum efficiency relationship of the antidepressant effective parts compatibility of Xiaoyao San. Chin. J. Pharmacol. Toxicol. 2010, 25, 97. [Google Scholar]
- Yi, L.; Qian, J. Jiaweisimiao effective parts of GC fingerprint spectrum ralationship and compatibility change research. Chin. Tradit. Pat. Med. 2007, 29, 634–637. [Google Scholar]
- Yi, L.; Qian, J. Jiaweisimiao’s HPLC fingerprint and associated pharmacodynamics. World Sci. Technol./Mod. Trad. Chin. Med. 2007, 19, 40–45. [Google Scholar]
- Song, Z.H.; Feng, D.; Xu, J.B. Study on the com patibility and therapeutical basis of composite herbal medicines of Lingguishugan decoction. Chin. Tradit. Pat. Med. 2003, 25, 114–118. [Google Scholar]
- Gu, Y.; Feng, Y.; Xu, D.S. Correlation between drug effects and serum HPLC fingerprint of active compositions of Radix paeoniae alba and Radix et Rhizowa Glycyrrhizae. Chin. Tradit. Pat. Med. 2008, 30, 6–10. [Google Scholar]
- Xu, W.W.; Wang, S.; Meng, X.S.; Bao, Y.R. Study on chromatography-efficacy relationship of anti-inflammatory activity of QizhiWeitong particle compound herbs with neural network and gray correlation method. China J. Chin. Mater. Med. 2013, 38, 1806–1811. [Google Scholar]
- Chen, Y.G.; Liu, X.; Tang, D.Q.; Yin, X.X.; Shi, X.D.; Chang, Y.H.; Du, Q. Primary investigation on chromatogram-pharmacodynamics relationship of Shenghua decoction. J. Chengdu Med. Coll. 2010, 5, 126–131. [Google Scholar]
- Li, P.; Li, X.; Chen, J.W.; Wu, L.L. Spectrum-effect relationship of active components from Taohong Siwu tang in dysmenorrheal model mice. Chin. J. Exp. Tradit. Med. Formulae 2010, 16, 144–149. [Google Scholar]
- Ning, L.L.; Bi, K.S.; Wang, R.; Che, Z.T.; Wang, X.; Luo, X. Methodological study on the material basis for the efficacy of the traditional Chinese medicine Wuzhuyu decoction. Acta Pharm. Sin. 2000, 35, 131–134. [Google Scholar]
- Lin, L.; Liu, X.Q. Primary investigation on spectrum-activity relationship of Xiebai Powder. Mod. Chin. Med. 2009, 11, 35–38. [Google Scholar]
- Kong, W.J.; Zhao, Y.L.; Shan, L.M.; Xiao, X.H.; Guo, W.Y. Spectrum-effect relationships between HPLC fingerprints and biothermological activity of Zuojin Wan and its similar formulaes. Acta Chim. Sin. 2008, 66, 2533–2538. [Google Scholar]
- Xie, R.F.; Zhou, X.; Shi, Z.N.; Li, Y.M.; Li, Z.C. Study on spectrum-effect relationship of Rhizoma Rhei, Cortex Magnoliae Officinalis, Fructus Aurantii Immaturus and their formula. J. Chromatogr. Sci. 2013, 51, 524–532. [Google Scholar] [CrossRef] [PubMed]
- Lu, H.M.; Liang, Y.Z.; Qian, P. Profile-effect on quality control of Houttuynia cordata injection. Acta Pharm. Sin. 2005, 40, 1147–1150. [Google Scholar]
- Tashiro, S. “Serum pharmacology” and “serum pharmacochemistry”—use Kampo pharmacology to create a new world for the determination of drug concentration in blood. Jpn. J. Ther. Drug Monit. Res. 1988, 5, 54. (In Japanese) [Google Scholar]
- Zhang, L.; Nie, L.; Wang, W.H. Correlation analysis between HPLC fingerprint of Radix Astragali injection and antioxidant activity. J. Chin. Med. Mater. 2009, 32, 1757–1760. [Google Scholar]
- Deng, C.; Zhang, Y.; Meng, X.L.; Wang, Z.; Fan, G. Spectrum efficiency relationship research on anti-endotoxin activity of San-Huang Formula. Lishizhen Med. Mater. Med. Res. 2011, 22, 525–527. [Google Scholar]
- Yin, Y.Q.; Zhu, J.F.; Shen, Z.B.; Tang, C.P.; Yang, C.Y.; Sun, Y. Neural network analysis of active ingredients of Xiang Dan injection against myocardial ischemia spectral correlation studies. Chin. Tradit. Herb. Drugs 2009, 40, 1284–1287. [Google Scholar]
- Hu, F.; Yang, Y.L.; Liu, X.H.; Li, C.; Zhu, R.J.; Feng, S.L. The double-efficacy to evaluate the spectrum-effect relationship of blood enriching function of Buzhongyiqi Wan. Pharmacol. Clin. Chin. Mater. Med. 2013, 29, 14–18. [Google Scholar]
- Wang, Y.H.; Li, B.; Cai, G.X.; Meng, P.; Yang, Y.H. Investigation on chromatogram-pharmacodynamics relationship of three kinds of Xiao-Yao Formula on the effect of Shu-Gan-Jie-Yu. World Sci. Technol./Mod. Trad. Chin. Med. 2012, 14, 2018–2021. [Google Scholar]
- Sui, Y.; Sun, Y.; Guo, T.; Li, M.; Li, F.M. Studying the effect of Flos Carthami on the guineapigs’ hearts in vitro by serum pharmacology. J. Shenyang Pharm. Univ. 2003, 20, 373–376. [Google Scholar]
- Wang, X.J. Study on serum pharmacochemistry of traditional Chinese medicine. World Sci. Technol./Mod. Trad. Chin. Med. 2002, 4, 1–4. [Google Scholar]
- Zhou, J.L.; Qi, L.W.; Li, P. Quality control of Chinese herbal medicines with chromatographic fingerprints. Chin. J. Chromatogr. 2008, 26, 153–159. [Google Scholar] [CrossRef]
- Zhao, X.P.; Fan, X.H.; Yu, J.; Cheng, Y.Y. A method for predicting activity of traditional Chinese medicine based on quantitative composition-activity relationship of neural network model. China J. Chin. Mater. Med. 2004, 29, 1082–1085. [Google Scholar]
- Hazarika, P.; Russell, D.A. Advances in fingerprint analysis. Angew. Chem. 2012, 15, 3524–3531. [Google Scholar] [CrossRef]
- Li, Y.F.; Cheng, Y.Y.; Fan, X.H. A strategy for multidimensional spectrum-effect relationship of traditional Chinese medicine. Chin. J. Nat. Med. 2010, 8, 167–170. [Google Scholar] [CrossRef]
© 2014 by the authors. Licensee MDPI, Basel, Switzerland. This article is an open access article distributed under the terms and conditions of the Creative Commons Attribution license ( http://creativecommons.org/licenses/by/4.0/).