1. Introduction
Reactive oxygen species (ROS) generation contributes to the ethiology of many diseases, including diabetes, arteriosclerosis or neurodegenerative disorders and others [
1,
2,
3]. The increase in intracellular production of free radicals may lead to cellular damage, including alterations of lipids, proteins and DNA [
4]. ROS [
5,
6], in particular superoxide anion (O
2•−), hydroxyl radical (OH
•) or hydrogen peroxide (H
2O
2) and reactive nitrogen species [
7,
8,
9,
10], e.g., nitrogen dioxide, are highly cytotoxic. Superoxide anion is able to react with nitric oxide to form toxic peroxinitrite anions or dismutate into H
2O
2 which in turn can be transformed into highly reactive and toxic hydroxyl radicals. H
2O
2 is one of the most important mediators of oxidative stress detected under pathological conditions. It was observed that under pathological conditions such as ischemia-reperfusion injury, excessive production of H
2O
2 occurs. H
2O
2 is probably involved in the neuronal damage seen in Parkinson’s and Huntington’s diseases and other neuronal disorders.
Oxidative stress can be evaluated by detecting ROS using biosensors [
11]. However, in most cases, the concentration of ROS is evaluated without enough precision [
12,
13,
14]. The other limitations include not enough sensitivity or lack of specificity. Therefore, there is a need for developing more specific, sensitive and effective methods for the detection and measurement of intracellular ROS levels [
12]. Pyruvic acid, like other α-ketoacids, acts as a H
2O
2 scavenger and is able to react non-enzymatically with H
2O
2 yielding the following products: acetic acid, H
2O and CO
2. Interestingly, pyruvate is present in mammalian cells and its antioxidative properties contribute to the cellular defense against H
2O
2-mediated cytotoxicity [
15]. In the present study, a new method of the H
2O
2 concentration assessment has been demonstrated. This method is based on the ability of the molecular biosensor—coordinate ion
cis-[Cr(C
2O
4)(pm)(OH)
2]
+ to effectively trap CO
2, one of the final products of the chemical reaction between H
2O
2 and exogenous pyruvate (1). Noteworthily, the amount of CO
2 released in this reaction is equivalent to the amount of H
2O
2:
Glutamate is a neurotransmitter in the central nervous system. It was reported to induce neuronal cell death at mM levels of concentrations [
16]. High concentrations of extracellular glutamate inhibit the glutamate/cystine antiporter, which results in the depletion of intracellular glutathione that converts H
2O
2 to H
2O [
17]. Typically, 5 mM glutamate was shown to induce oxidative stress in HT22 cells leading to death [
18]. Therefore, as an experimental model to study the generation of H
2O
2, mouse hippocampal HT22 cells treated with 5 mM
l-glutamate were used in our study.
Previously, our research group reported a quantitative determination of H
2O
2 in osteosarcoma cells [
19]. In this method a molecular biosensor was used, the most effective being a coordination complex ion
cis-[Cr(C
2O
4)(pm)(OH
2)
2]
+. The CO
2 uptake was studied using a spectrophotometric stopped-flow method whereby it was possible to determine the content of H
2O
2 in the biological material under anaerobic conditions. The method described is based on the assumption of the selective reaction of α-keto acid—pyruvate with H
2O
2, with the subsequent decarboxylation of the intermediate product, pyruvic peracid, and the capture of the CO
2 released. The results provided arguments for the usefulness of pyruvate application for cell culture studies where culture media could produce significant levels of H
2O
2 before treatment of cells. On the other hand endogenous and exogenous sources of H
2O
2 implicated in cytotoxity in a variety of human diseases can be safely prevented by pyruvate. The efficiency of this scavenger was clearly demonstrated by a novel application of a molecular CO
2 detection method based on
cis-[Cr(C
2O
4)(pm)(OH
2)
2]
+ ion.
2. Results and Discussion
The
cis-[Cr(C
2O
4)(pm)(OH
2)
2]
+ ion was previously developed as a specific molecular biosensor to detect uptake of CO
2, generated in the reaction between Na
2CO
3 and HCl [
20]. To do this the reaction between the
cis-[Cr(C
2O
4)(pm)(OH
2)
2]
+ ion and carbon dioxide in aqueous solution was monitored between 340 nm and 700 nm using a spectrophotometric stopped-flow method. It was observed that the reaction of carbon dioxide uptake by the applied biosensor ran in two-steps. The first step was about 50 times faster than the second one. This conclusion is based on the analytical results. The analytical model was already described in [
21]. During the carbon dioxide uptake (where CO
2 was generated in a chemical reaction) by
cis-[Cr(C
2O
4)(pm)(OH
2)
2]
+ complex ion the most significant changes of absorbance were seen at λ = 560 nm. Consequently, on the basis of results obtained a two-step mechanism for the uptake of carbon dioxide by
cis-[Cr(C
2O
4)(pm)(OH
2)
2]
+ ion was proposed and described [
21].
Having the above knowledge concerning a chemical model, the same coordination compound of Cr(III) with a bidendate ligand—pyridoxamine—was checked and successfully applied in this study also in biological material, namely for the detection of CO
2 generated during the glutamate-induced oxidative stress in HT22 cells. The results obtained are presented in
Figure 1a For comparison, the previously obtained results of global analysis (GA) for reaction of CO
2 uptake by the
cis-[Cr(C
2O
4)(pm)(OH
2)
2]
+ ion in a chemical model within the consecutive reaction model (A→B→C) are presented in
Figure 1b. In
Figure 1a,b symbol “A” means the substrate
cis-[Cr(C
2O
4)(pm)(OH
2)
2]
+, “B”- intermediate product, and “C”- the final product
cis-[Cr(C
2O
4)(pm)(O
2CO)]
−. The different behaviour of A, B and C is the result of decrease in the substrate concentration and product formation. As seen the same absorption maxima can be observed for both systems – chemical and biological. This conformity can be treated as a confirmation that the proposed chemical model fits the biological system.
Figure 1a shows the global analysis results for the reaction of CO
2 uptake from biological material by the
cis-[Cr(C
2O
4)(pm)(OH
2)
2]
+ ion. Cr(III) is inert and this causes the reaction to be slowed down. To confirm the mechanism of uptake previously proposed on the basis of the chemical reaction system [
21] in the biological model, in the first step (carbon dioxide uptake), kinetic data were fitted by a simple A→B reaction model (where B denotes the intermediate). Furthermore, in the second step (the closure of the ring of carbonate ion) [
22], the reaction was monitored at the wavelength where the maximum difference in molar absorptivities between the intermediate products and products (B→C reaction model) was observed, at λ = 560 nm (
Figure 1). It should be pointed that the results obtained by the global analysis (GA) [
23] method were confirmed by another independent method of the singular value decomposition (SVD) [
22] analysis (
Figure 1). GA and SVD are the mathematical methods used in calculations.
Figure 1.
Comparison of the biological and chemical reaction models. (a) The biological reaction model (I) Curves of concentration decay and buildup of the substrate A (which is the cis-[Cr(C2O4)(pm)(OH2)2]+ ion), product C as cis-[Cr(C2O4)(pm)(O2CO)]− ion, and intermediate product B. (II) Absorption spectra of the reactants A, B and C - the detection of CO2 generated during glutamate induced oxidative stress in HT22 cells. (b) The chemical reaction model (I) Curves of concentration decay and buildup of the substrate A (which is the cis-[Cr(C2O4)(pm)(OH2)2]+ ion), product C as cis-[Cr(C2O4)(pm)(O2CO)]− ion, and intermediate product B. (II) Absorption spectra of the reactants A, B and C at pH = 7.13, t = 20 °C.
In this study a new method for H2O2 detection in cell lysates, supernatants and cell-free culture medium is demonstrated. This method is based on both the interaction of the coordination compound cis-[Cr(C2O4)(pm)(OH)2]+ with CO2 and the nonenzymatic reaction of pyruvate with H2O2. Using cis-[Cr(C2O4)(pm)(OH)2]+ and the spectrophotometric stopped-flow technique the CO2 concentration in cell lysates, supernatants and culture medium was determined. Since pyruvate reacts nonenzymatically with H2O2 with 1:1 stoichiometry releasing CO2, the amount of H2O2 in this reaction is equivalent to the amount of CO2 released. Therefore, prior to CO2 assessment pyruvate was added to all samples studied.
As an experimental model to study the generation of H
2O
2, mouse hippocampal HT22 cells treated with sodium 5 mM
l-glutamate were used. Five mM glutamate was used to induce the oxidative stress in HT22 cells, which will subsequently lead to cell death [
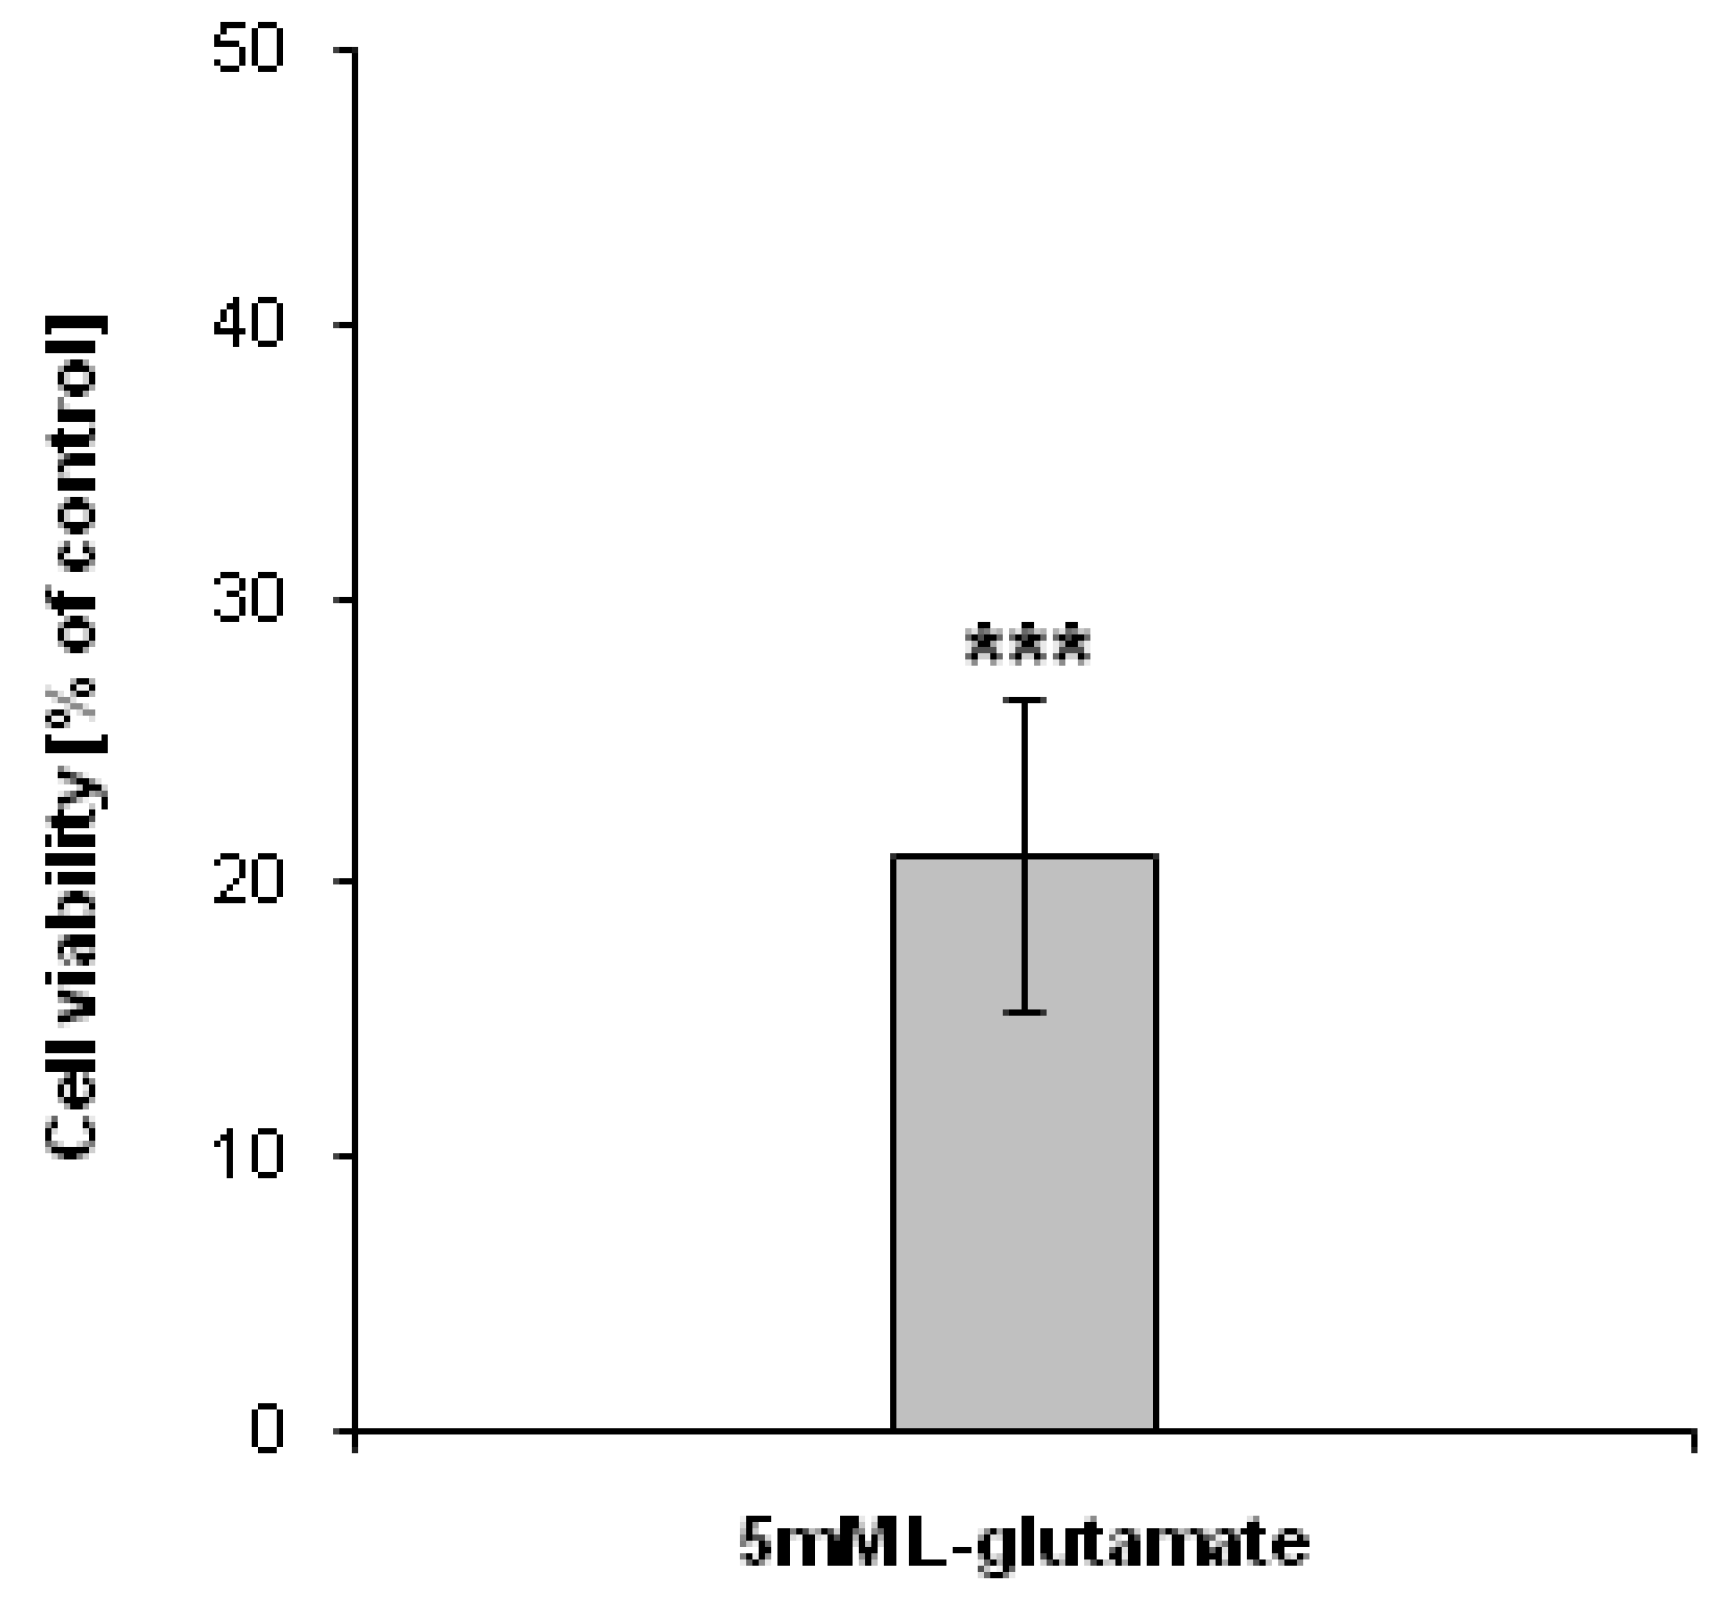
18]. In agreement with this data, our results showed that the viability of HT22 cells treated with 5 mM
l-glutamate for 24 h decreased dramatically (
Figure 2).
Figure 2.
Antiproliferative effect of l-glutamate. HT22 cells were treated with 5 mM l-glutamate for 24 h. The cell viability was assessed using the 3-[4,5-dimethylthiazol-2-yl]-2,5-diphenyltetrazolium bromide (MTT) assay. Data are presented as mean ± SD. *** p <0.001, statistically significant differences compared to control (untreated) cells.
In the experiments, the main source of CO
2 measured in cell lysates was the reaction of pyruvate with H
2O
2 produced endogenously in HT22 cells treated with 5 mM
l-glutamate for 24 h. In order to determine the most effective concentration of sodium pyruvate required to scavenge H
2O
2 present in cell lysates, the following concentrations of sodium pyruvate were tested: 0.5, 1, 2, 3, 4, 5, 6, 7, 8, 9 and 10 mM. The CO
2 levels in lysates of control (untreated) cells and lysates of cells treated with 5 mM
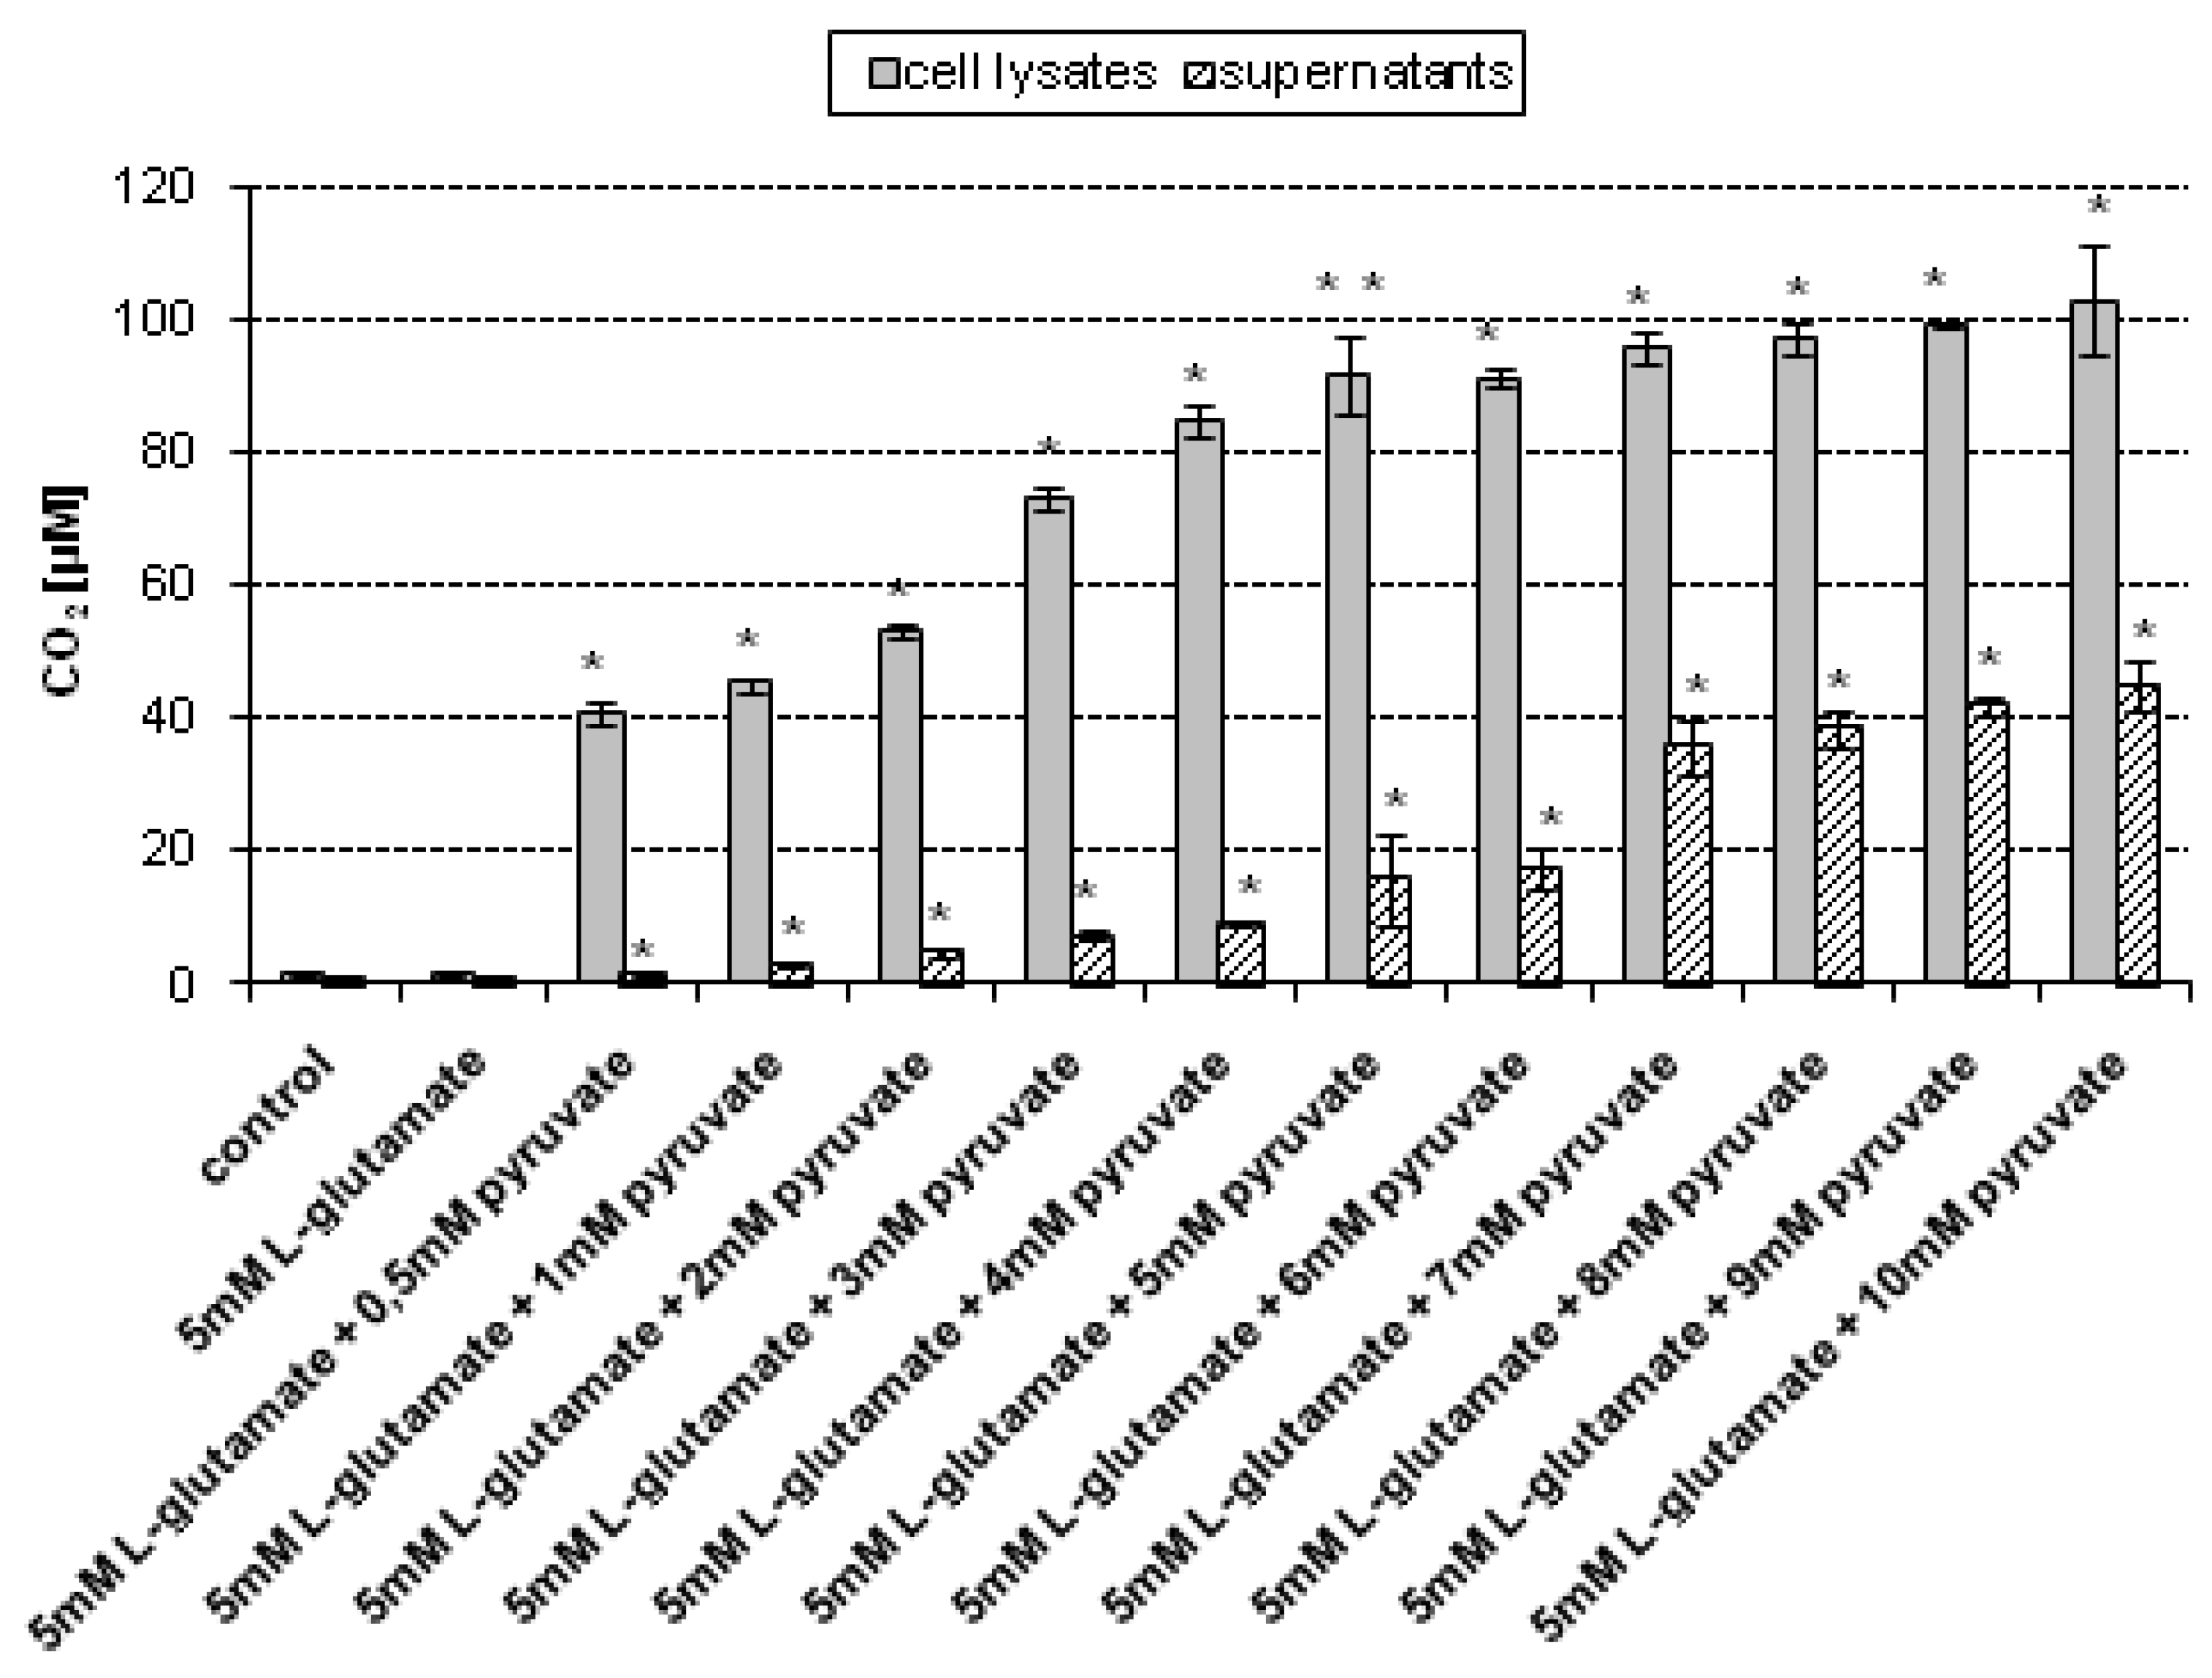
l-glutamate, measured without the addition of pyruvate, were 1.09 μM (± 0.06) and 1.1 μM (±0.05), respectively. It has been found that upon addition of 0.5–4 mM sodium pyruvate to the lysates of
l-glutamate-treated HT22 cells, the CO
2 level gradually increased (
Figure 3).
Noteworthily, at pyruvate concentrations ranging from 5 mM to 10 mM only slight changes in the CO2 level measured in the cell lysates were observed—the CO2 level did not increase significantly. These results suggest that the 5 mM–10 mM concentration range of sodium pyruvate can be used in the proposed method to effectively assess the CO2 concentration in the cell lysates obtained upon lysis of l-glutamate-treated HT22 cells.
H
2O
2 has the ability to penetrate biological membranes, which enables it to be released from the cells where it is produced and thus affect neighbouring cells [
5]. Therefore, the CO
2level in supernatants—the surrounding of HT22 cells was assessed. Noteworthily, the source of CO
2 detected in supernatants can also be H
2O
2 production resulting from oxidation of components of culture medium [
24]. The results revealed that the CO
2 levels in supernatants separated from control (untreated) cells and those collected after separation of cells treated with 5 mM
l-glutamate, both measured without the addition of pyruvate, were 0.94 μM (± 0.05) and 1.03 μM (± 0.22), respectively. Moreover, it has been found that upon addition of 0.5–6 mM sodium pyruvate to the supernatants separated from
l-glutamate-treated HT22 cells, the CO
2 level gradually increased (
Figure 3). At pyruvate concentrations ranging from 7 mM to 10 mM only slight changes in the CO
2 level in the supernatants were observed—the CO
2 level did not increased significantly. These results indicate that among the pyruvate concentrations tested, the concentration range 7-10 mM is sufficient to assess the CO
2 level in the supernatants collected upon separation of HT22 cells treated with 5 mM
l-glutamate.
Figure 3.
CO2 assessment in cell lysates and supernatants upon treatment with 5 mM sodium l-glutamate. HT22 cells were incubated with 5 mM sodium l-glutamate for 24 h. After treatment, cells and superntants were separated. The cells were then lysed using a lysis buffer. Prior to CO2 measurement sodium pyruvate was added (final concentations of sodium pyruvate: 0.5–10 mM, respectively) to the samples containing cell lysates and supernatants, respectively. The CO2 level was assessed using a stopped-flow technique. Data are expressed as mean ± SD of three independent experiments. * p < 0.05, ** p < 0.01, statistically significant differences compared to the sample treated with 5 mM l-glutamate alone, without addition of sodium pyruvate; control - untreated cells.
As mentioned previously, the culture medium may be a source of H
2O
2 generation [
24]. Moreover, it is important to evaluate whether the CO
2 level assessed by our method can be influenced by the HCO
3−/CO
2 buffer system used in growth media to maintain the proper pH. Therefore, in addition to the CO
2 assessment in cell lysates and supernatants, the CO
2 level in cell-free complete culture medium was examined, under conditions of the experiment not resulting from endogenous (cellular) production of H
2O
2. The CO
2 concentration was measured without addition or upon addition of different concentrations of sodium pyruvate, respectively. The culture medium were treated with 5 mM
l-glutamate for 24 h and then collected. The CO
2 concentration in control (untreated) medium sample and those treated with 5 mM
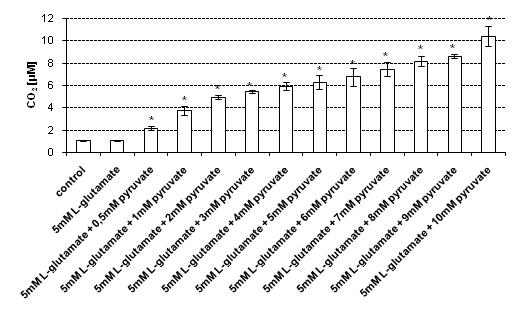
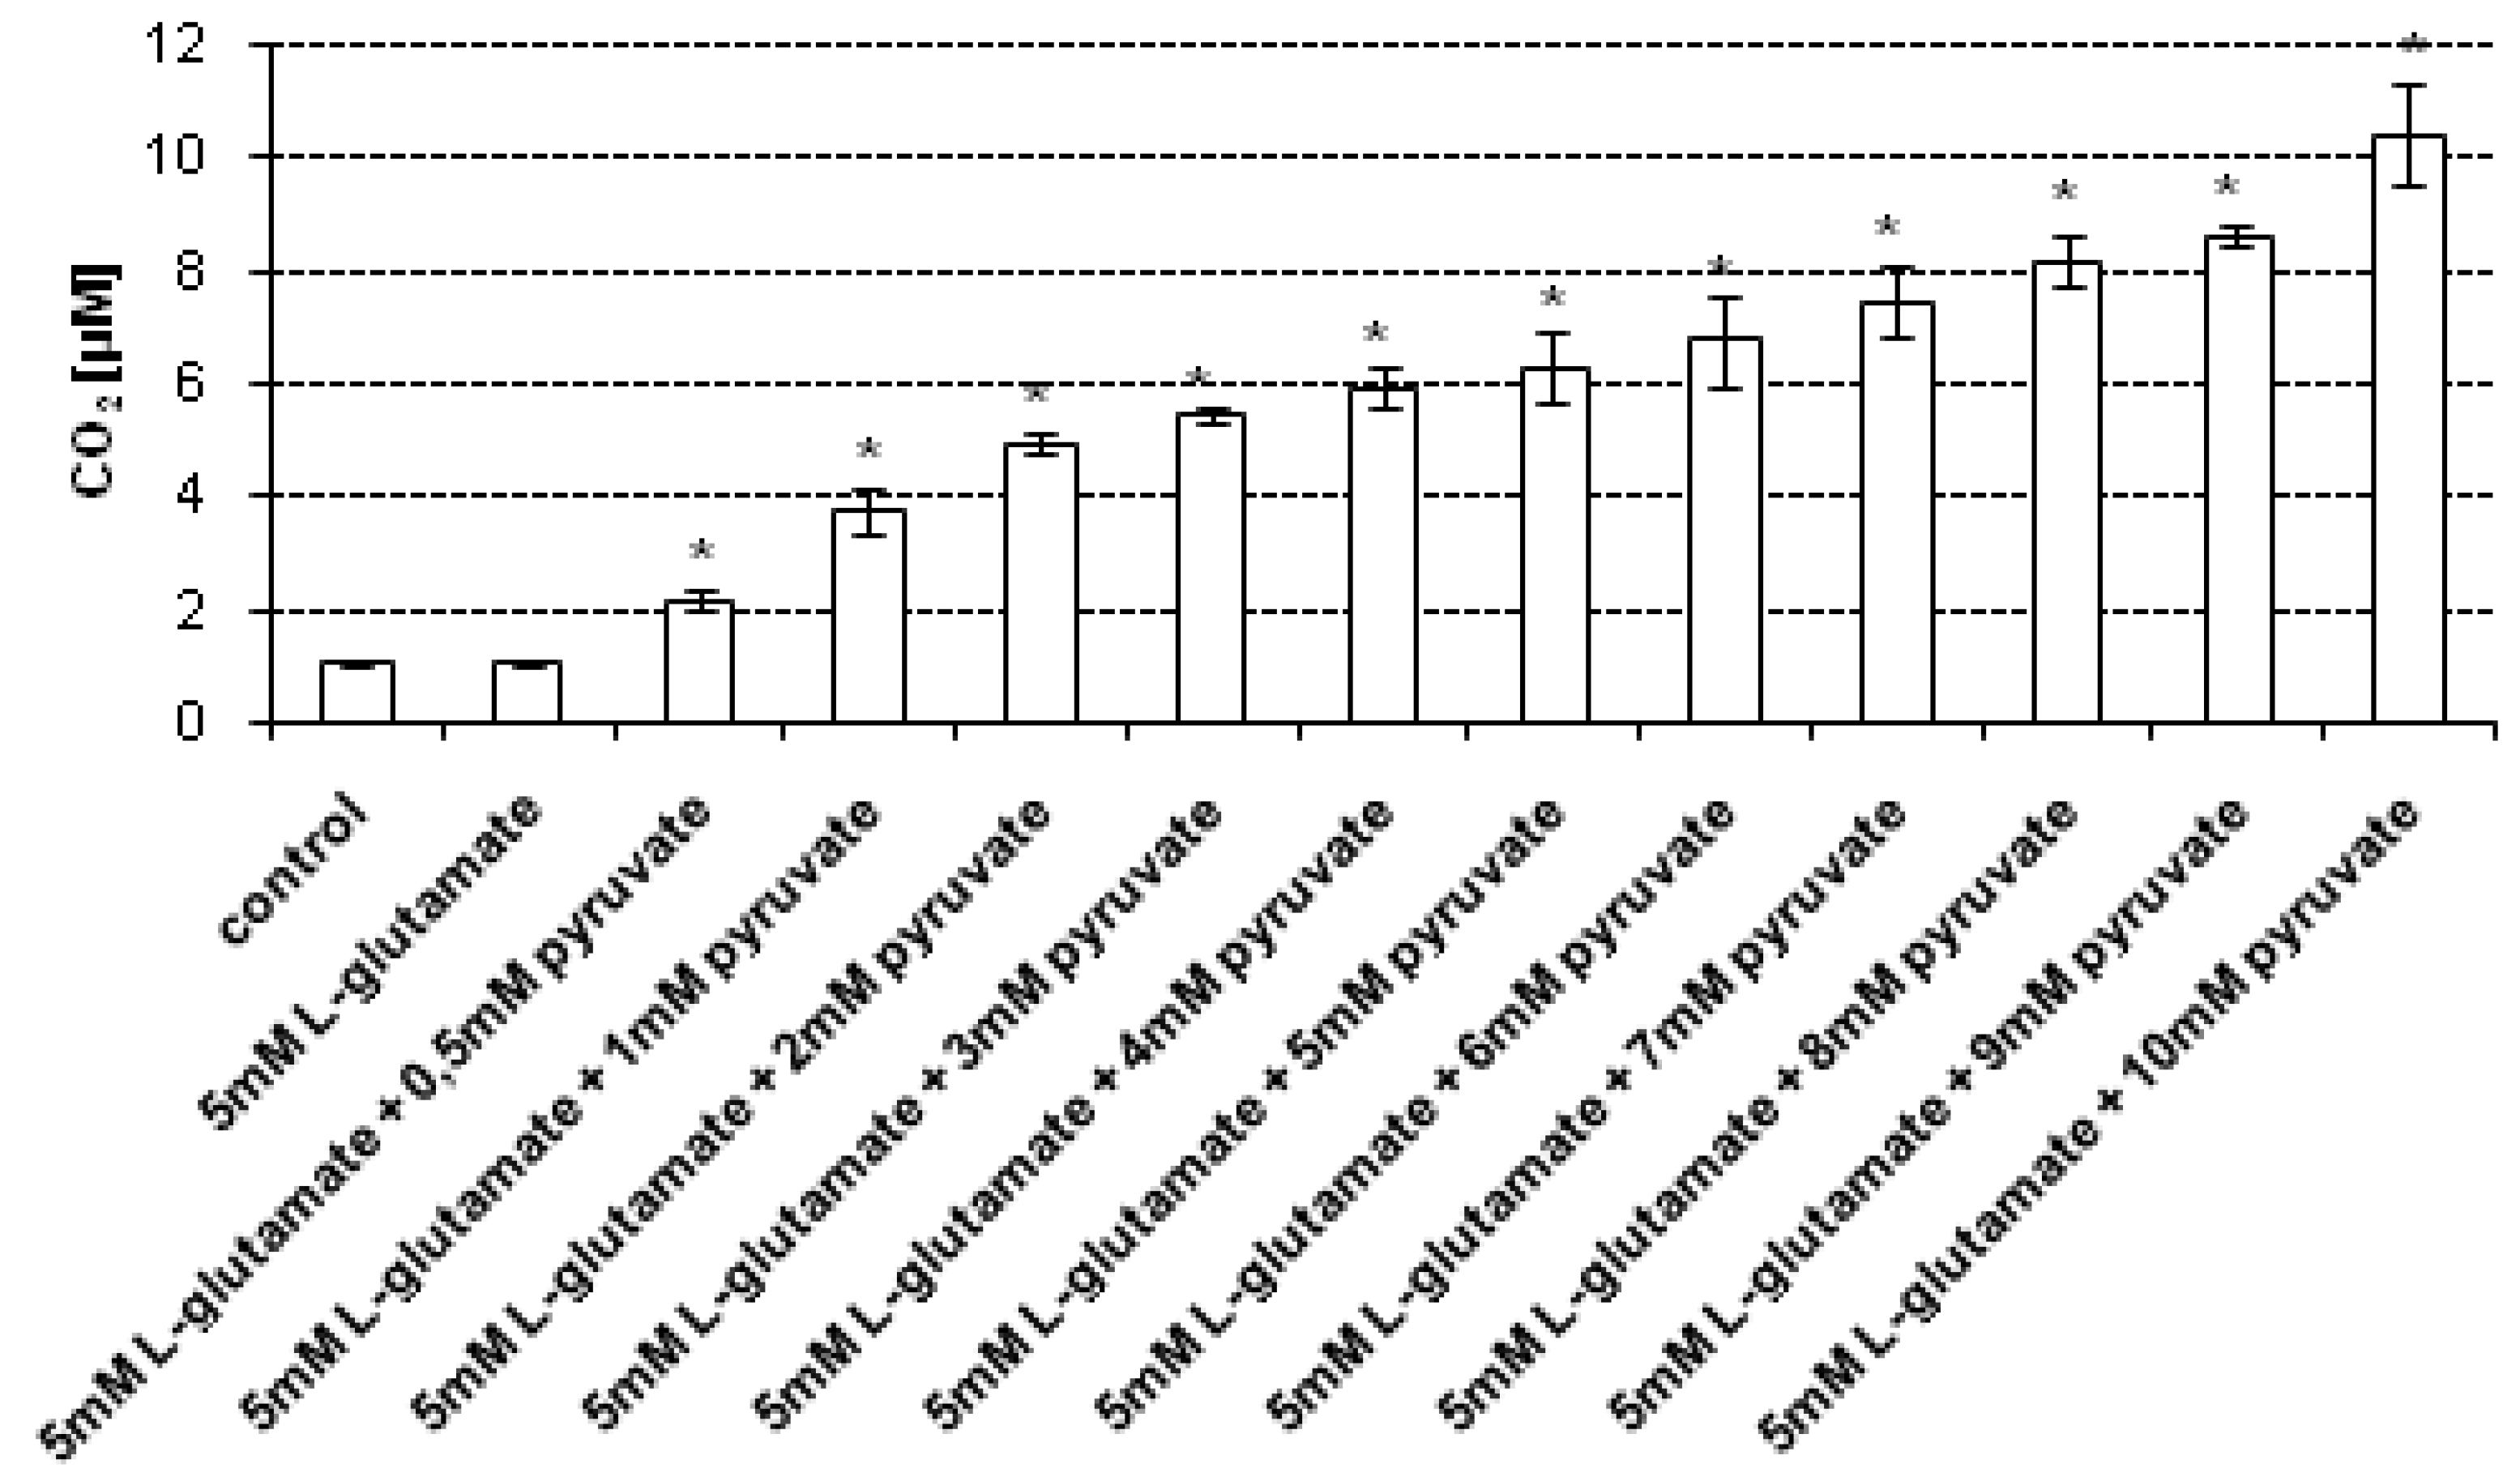
l-glutamate, both measured without the addition of pyruvate, were 1.06 μM (± 0.04) and 1.09 μM (± 0.02), respectively. It has been found that upon addition of 0.5–10 mM sodium pyruvate, the CO
2 level gradually increased (
Figure 4). As mentioned previously, one possible explanation is that the culture medium may also be a source of H
2O
2 generation [
19].
Figure 4.
CO2 assessment in cell-free complete culture medium upon treatment with 5 mM sodium l-glutamate. The cell-free complete medium was incubated with 5 mM sodium l-glutamate for 24 h. After treatment, sodium pyruvate was added (final concentations of sodium pyruvate: 0.5–10 mM, respectively). The CO2 level was assessed using a stopped-flow technique. Data are expressed as mean ± SD. * p < 0.05, statistically significant differences compared to the sample treated with 5 mM l-glutamate alone, without addition of sodium pyruvate; control – untreated sample.
3. Experimental Section
3.1. Chemicals
l-Glutamic acid monosodium salt monohydrate was purchased from Sigma (St. Louis, MO, USA). l-Glutamic acid monosodium salt solutions were prepared prior to use in sterile physiological saline solution. Sterile sodium pyruvate solution (100 mM) was obtained from Sigma and diluted in sterile water to desired concentrations before use. Dihydrochloride pyridoxamine was purchased from Sigma.
3.2. Reagents
The
cis-[Cr(C
2O
4)(pm)(OH
2)
2]
+ ion was prepared according to standard literature procedures [
19]. The final products,
cis-[Cr(C
2O
4)(L-L)(O
2CO)]
− (where L-L denotes bidentate ligand—pyridoxamine (pm)) was synthesised by the previously reported method [
21]. The complex
cis-[Cr(C
2O
4)(pm)(OH
2)
2]
+ was synthesised from K[Cr(C
2O
4)(H
2O)
2]·3H
2O and pyridoxamine.
3.3. Cell Culture
The hippocampal neuronal HT22 cell line was kindly provided by Professor T. Grune (Institute of Biological Chemistry and Nutrition, University Hohenheim, Stuttgart, Germany). HT22 cells were maintained at 37 °C in a humidified atmosphere containing 5% (v/v) CO2 in Dulbecco’s Modified Eagle’s Medium without sodium pyruvate (Sigma), supplemented with 10% (v/v) heat-inactivated fetal bovine serum (Sigma), 100 IU/mL penicillin (Sigma) and 100 μg/mL streptomycin (Sigma).
3.4. MTT Assay
The 3-[4,5-dimethylthiazol-2-yl]-2,5-diphenyltetrazolium bromide (MTT) cytotoxicity assay is based on the ability of mitochondrial succinate dehydrogenase of viable cells to reduce the MTT tetrazolium salt HT22 cells were seeded in 96-well plates (8 × 10³ cells per well). After a 24-hour incubation of cells with 5 mM l-glutamate, MTT (final concentration = 0.5 mg/mL) was added and the cells were incubated at 37 °C for the next 4 h. Supernatants were then removed and dimethyl sulfoxide (DMSO) was added to dissolve MTT formazan crystals. The absorbance was recorded using a microplate reader (ELx800; BioTek Instruments, Inc., Seattle, WA, USA). The viability of cells treated with 5 mM l-glutamate was expressed as the percentage of the viability of control cells (untreated with 5 mM l-glutamate).
3.5. CO2 Measurement
HT22 cells were incubated in 5 mM sodium l-glutamate for 24 h. After treatment, the cells and supernatants were separated. Cells were then washed with a phosphate buffered saline (PBS) and suspended in a lysis buffer (0.15 M NaCl, 0.005 M EDTA, 1% Triton X-100, 0.01 M Tris-HCl). Next, sodium pyruvate was added (final concentration: 0.5, 1, 2, 3, 4, 5, 6, 7, 8, 9 and 10 mM) to the samples containing cell lysates and supernatants, respectively, prior to CO2 measurement. The CO2 level in each sample was assessed using a spectrophotometric stopped-flow technique. The cell-free complete culture medium was treated with 5 mM l-glutamate for 24 h and then collected. Next, a different concentration of sodium pyruvate (final concentration: 0.5, 1, 2, 3, 4, 5, 6, 7, 8, 9 and 10 mM) was added prior to CO2 measurement. The concentrations of CO2 and H2O2 were determined using the complex cis-[Cr(C2O4)(pm)(OH2)2]+ as the biosensor.
3.6. Instrumentation
The UV-visible spectroscopy studies were conducted using a Perkin-Elmer Lambda 18 Instrument with the scan accuracy of 1 nm and 1 nm slit width at a scanning rate of 120.00 nm min
−1. Kinetic measurements were carried out using a stopped-flow technique and an Applied Photophysics SX-17MV spectrophotometer. The observable rate constants and concentrations of CO
2 were computed based on the global analysis using a “Glint” program [
25,
26,
27,
28,
29].
3.7. Statistical Analysis
Statistical analysis was performed using Statistica 9 software (StatSoft, Kraków, Poland). Data are expressed as mean considering SD (standard deviation). Statistical differences were evaluated using the Mann-Whitney U test. Differences were considered significant at p < 0.05, p < 0.01, p < 0.001.

 ,
, 


