2.2. Soil Chemical and Physical Properties Analysis
The selected soils from two vineyards presented very different physical and chemical properties (
Table 2), although both of the soils were classified as “slit loam” according to the texture classes in the soil survey manual. The soils from Yuanyi farm were richer in sand than those of Guangdong farm, especially in topsoil (0–20 cm). Specifically, the sand percentage was 41.99% at Yuanyi farm, and only 20.03% at Guangdong farm (
Table 2).
Table 1.
Meteorological parameters for the growing season (April–October) and the ripening period (August–September) in the study area (2011 and 2012).
Table 1.
Meteorological parameters for the growing season (April–October) and the ripening period (August–September) in the study area (2011 and 2012).
| Year | Mean Temperature ( °C) | Average Maximum Temperature ( °C) | Average Minimum Temperature ( °C) | Growing Degree Days ( °C) | Sunlight Duration (h) | Rain (mm) |
|---|
| Aug-Sep | Apr-Oct | Year | Aug-Sep | Apr-Oct | Year | Aug-Sep | Apr-Oct | Year | Aug-Sep | Apr-Oct | Year | Aug-Sep | Apr-Oct | Year | Aug-Sep | Apr-Oct | Year |
|---|
| 2011 | 22.1 | 20.3 | 8.2 | 28.7 | 26.8 | 13.6 | 16.1 | 14.6 | 3.4 | 740.9 | 2290.6 | 2290.6 | 627.4 | 2173.7 | 2899.0 | 41.2 | 180.1 | 217.8 |
| 2012 | 22.3 | 20.8 | 8.8 | 29.2 | 27.4 | 13.9 | 16.1 | 14.7 | 3.1 | 752.9 | 2356.2 | 2367.2 | 647.3 | 2235.8 | 3102.0 | 29.0 | 103.6 | 179.8 |
Figure 1.
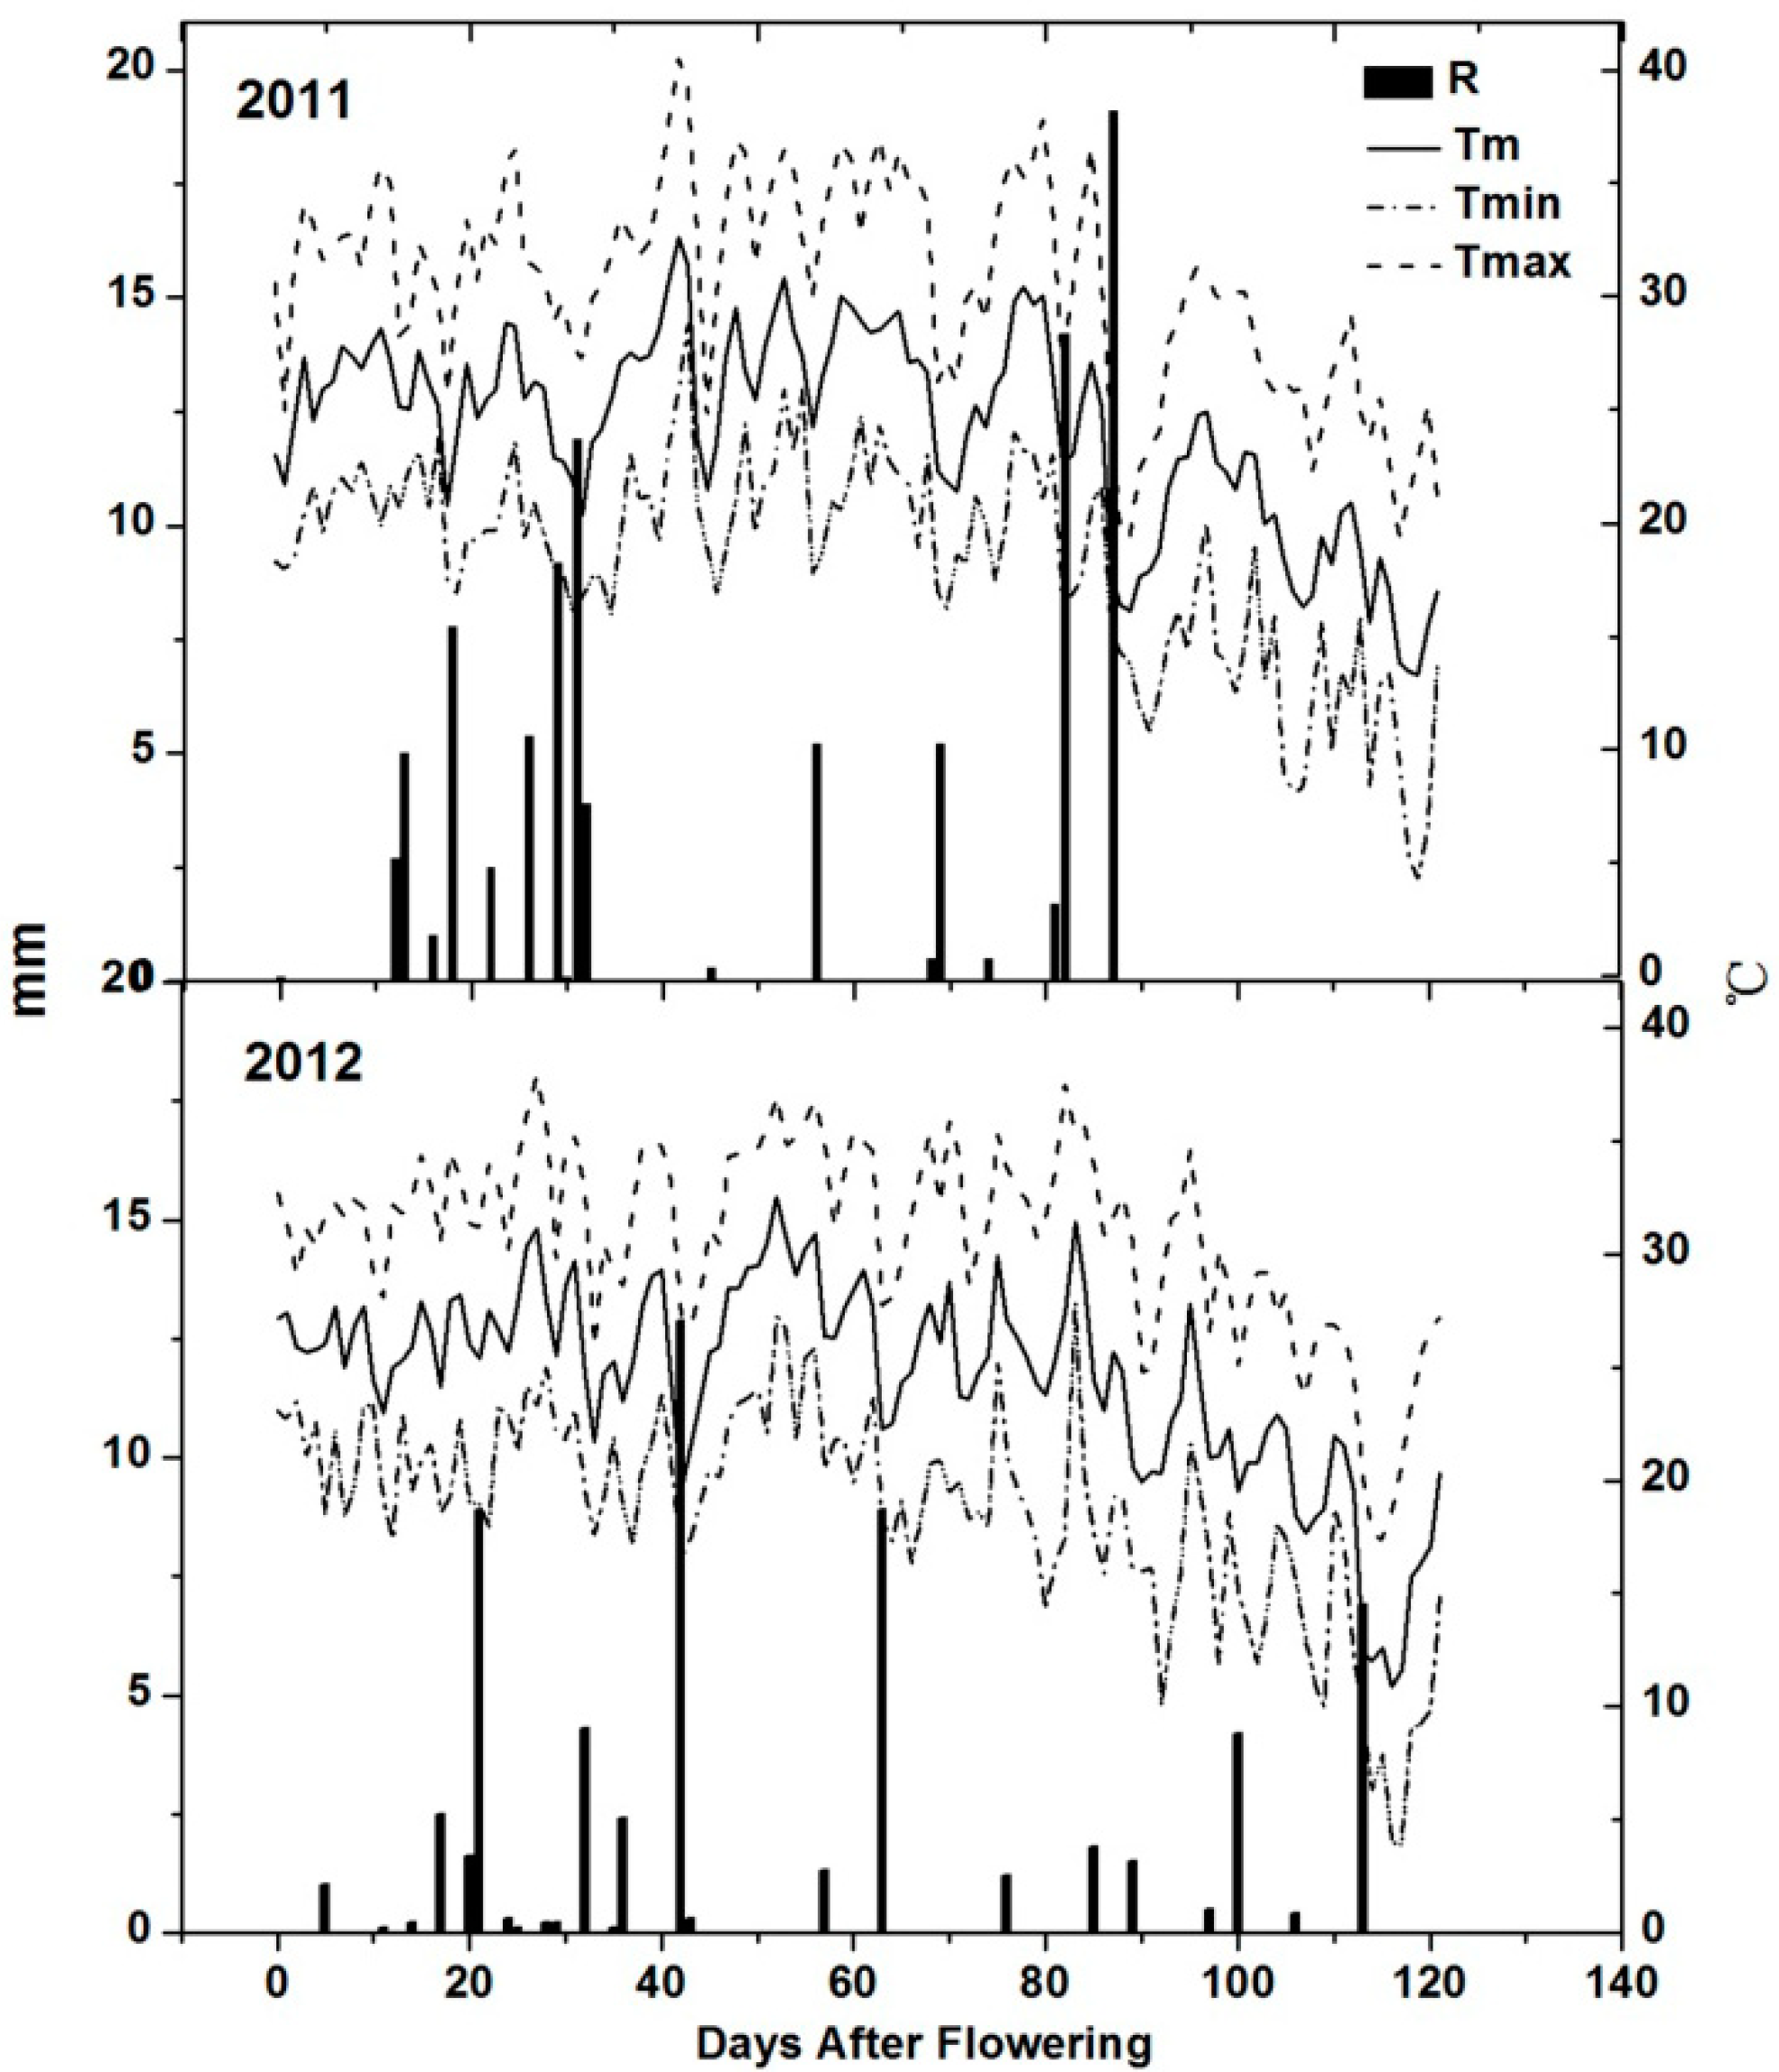
Evolution of mean, maximum and minimum daily temperature and rainfall from flowering to harvest in the study area (2011 and 2012). R, Rainfall; Tm, mean temperature; Tmax, maximum temperature; Tmin, minimum temperature.
Figure 1.
Evolution of mean, maximum and minimum daily temperature and rainfall from flowering to harvest in the study area (2011 and 2012). R, Rainfall; Tm, mean temperature; Tmax, maximum temperature; Tmin, minimum temperature.
Table 2.
Physical and chemical properties of the selected soils in two vineyards at different depths. Data are mean values of three replications.
Table 2.
Physical and chemical properties of the selected soils in two vineyards at different depths. Data are mean values of three replications.
| Vineyards | Depth (cm) | Clay (%) | Slit (%) | Sand (%) | Textural Class | pH | EC (ms/cm) | CEC (cmol/kg) | Organic Matter (%) | Bulk Density (kg/m3) | Water Content (%) |
|---|
| Yuanyi farm | 0–20 | 8.59b | 49.40b | 41.99a | Silt loam | 7.9a | 0.18b | 16.40b | 1.40b | 1.49a | 18.82b |
| 20–40 | 9.82b | 61.66b | 28.52a | Silt loam | 7.8a | 0.20b | 13.18b | 0.99b | 1.65a | 26.49b |
| 40–60 | 11.37a | 54.13a | 34.50a | Silt loam | 8.1a | 0.19b | 12.82b | 0.56b | 1.41a | 26.83b |
| 60–80 | 14.63a | 49.87b | 35.49a | Silt loam | 8.0a | 0.20b | 12.46b | 0.54b | 1.50a | 25.61b |
| 80–100 | 9.02a | 55.72b | 35.26a | Silt loam | 7.9a | 0.18b | 11.74b | 0.41b | 1.55a | 27.97b |
| Guangdong farm | 0–20 | 15.99a | 63.97a | 20.03b | Silt loam | 7.5b | 0.39a | 23.21a | 6.38a | 0.98b | 29.55a |
| 20–40 | 11.45a | 63.51a | 25.04b | Silt loam | 7.3b | 0.54a | 25.36a | 8.42a | 1.21b | 44.04a |
| 40–60 | 8.30b | 55.69a | 36.01a | Silt loam | 7.4b | 0.56a | 22.14a | 6.85a | 1.29b | 38.89a |
| 60–80 | 9.17b | 54.35a | 36.48a | Silt loam | 7.2b | 0.98a | 19.63a | 5.02a | 1.47b | 36.13a |
| 80–100 | 9.68a | 58.12a | 32.20b | Silt loam | 7.2b | 0.66a | 18.55a | 3.69a | 1.51b | 33.74a |
The soil pH at Yuanyi farm ranged from 7.8 to 8.1, which classified them as slightly alkaline soils, while the pH at Guangdong ranged from 7.2 to 7.5, which defined them as very slightly alkaline soils. At pH values above 5.0 to 5.5, grapevine performance should not be seriously impeded [
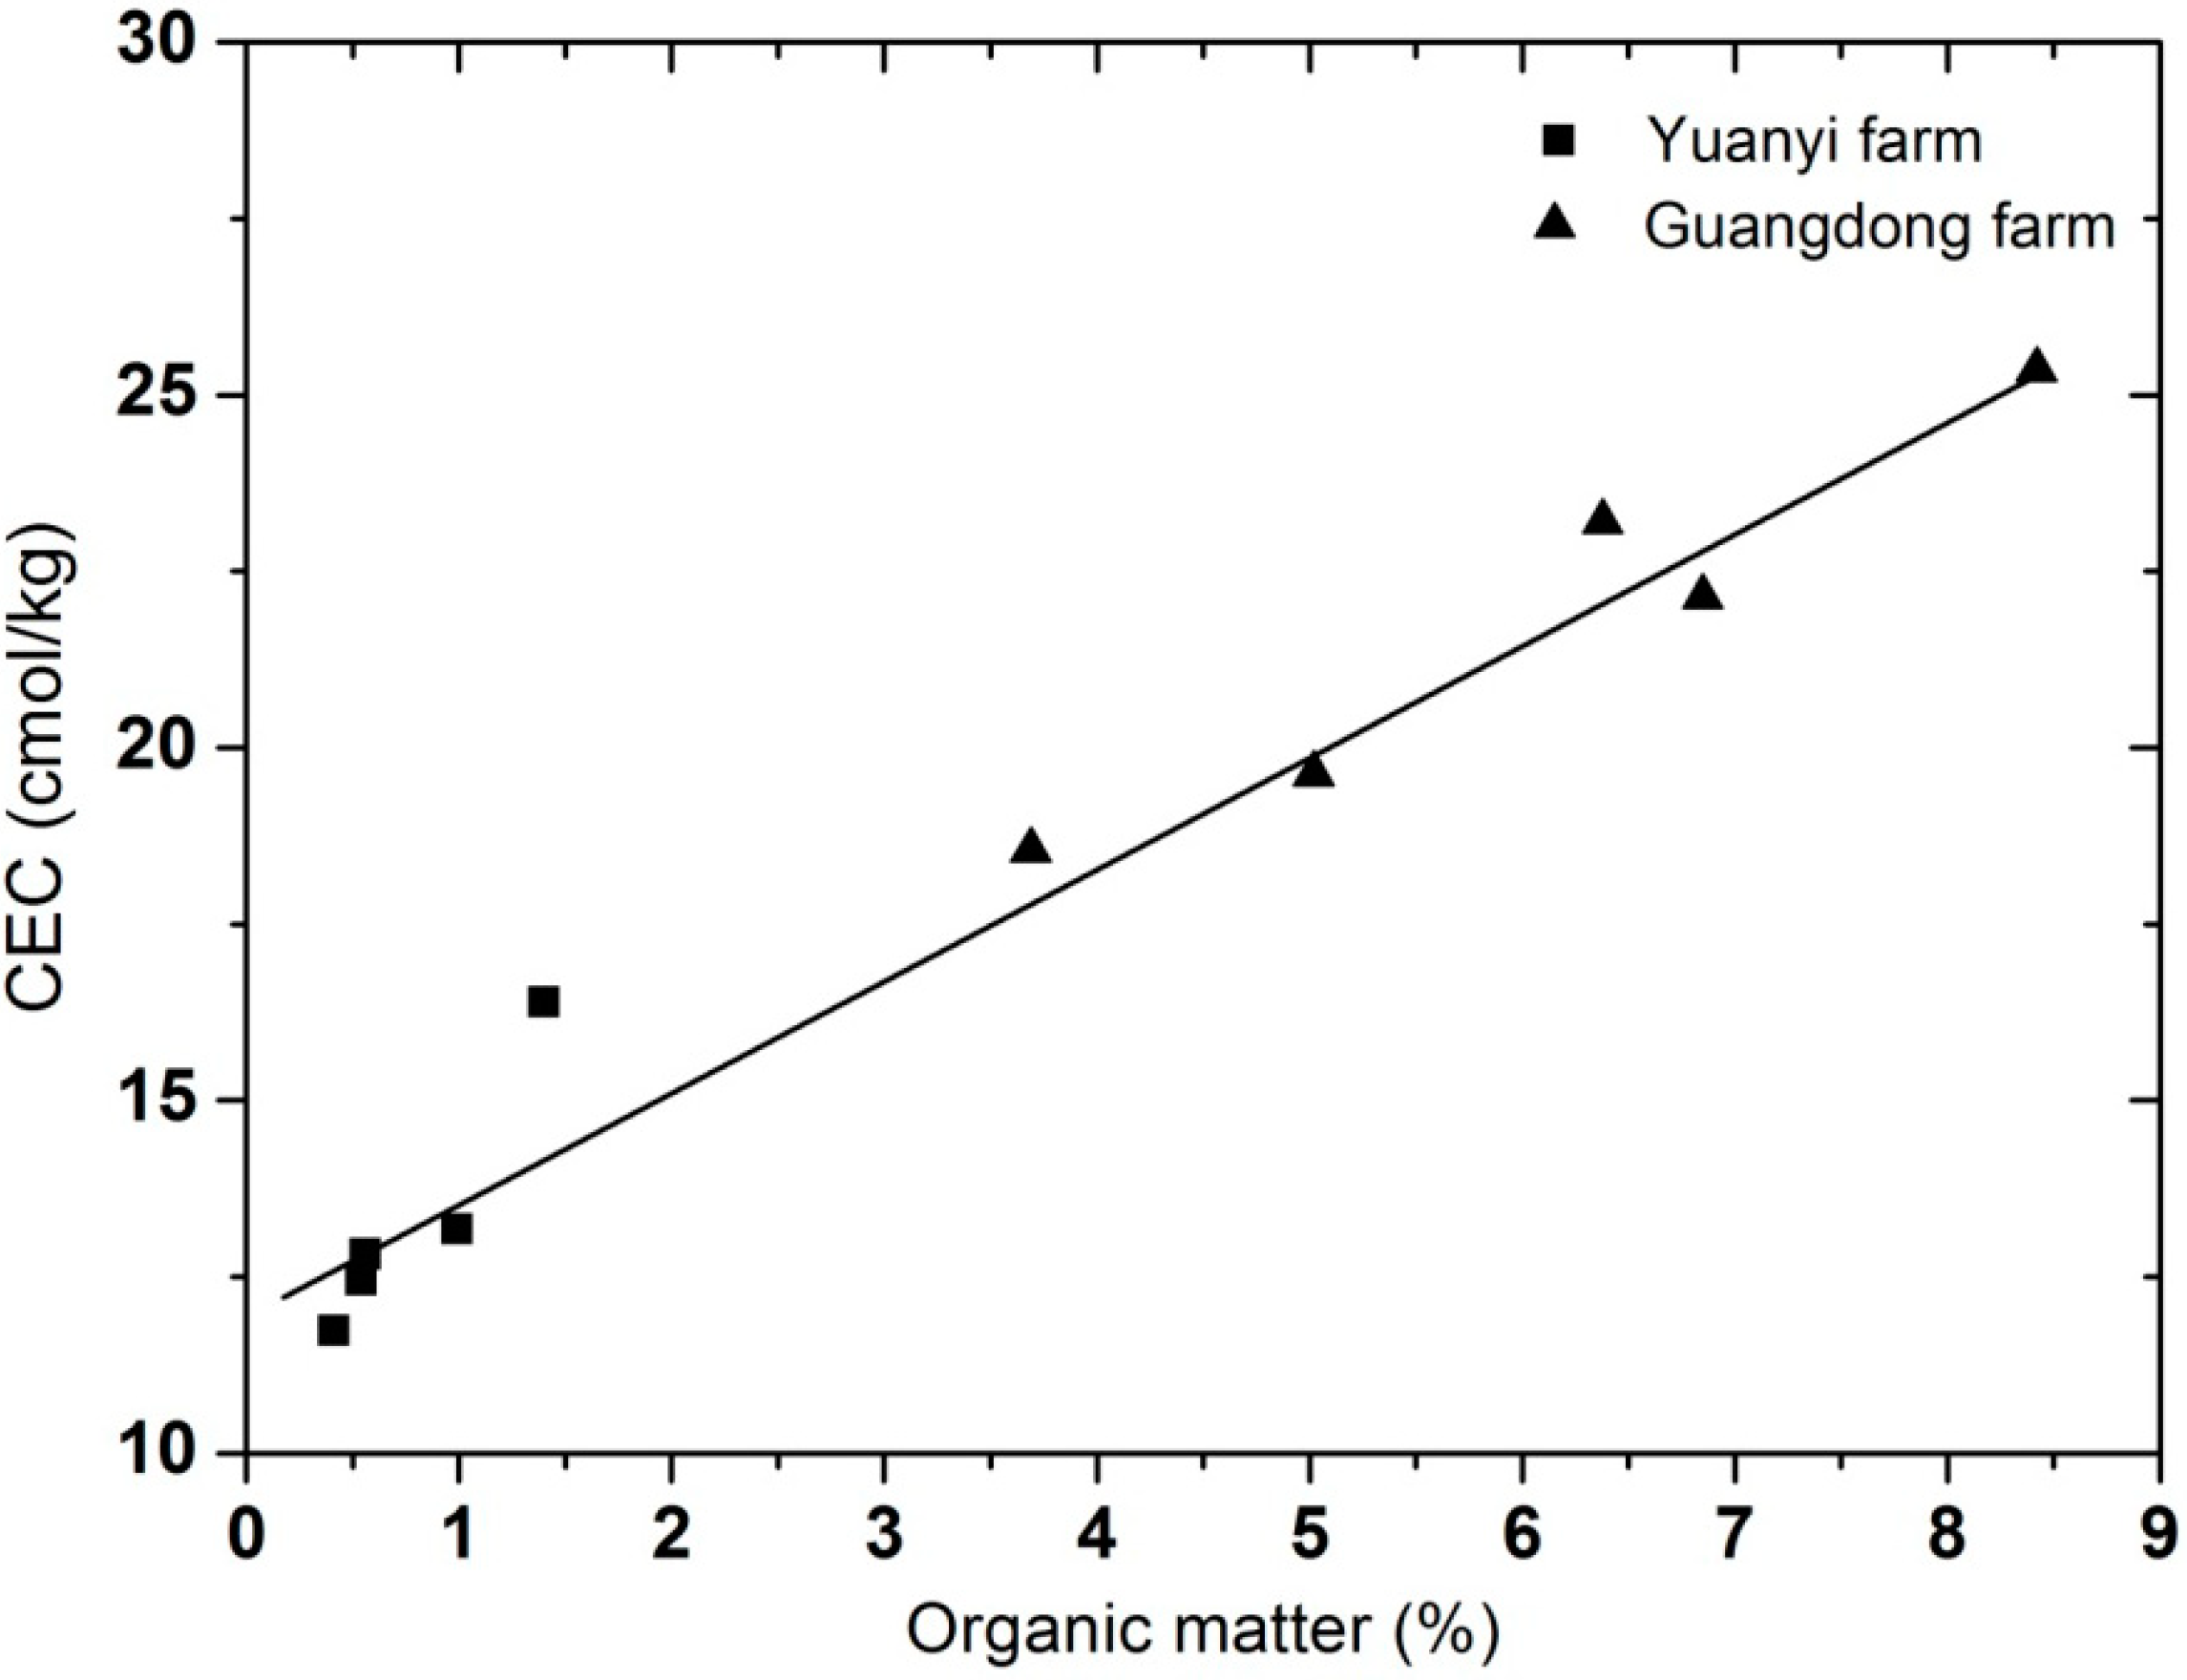
19], and none of the soils in Yuanyi farm or Guangdong farm showed any signs of sodicity. Soil electrical conductivity (EC) is a parameter which represents the amount of salts in soils (soil salinity). In our study, the EC of soils from Guangdong farm was significantly higher than at Yuanyi farm at each soil depth (54%–80%). According to the classes of salinity and EC in the NRCS Soil Survey Handbook, all the selected soils from the two vineyards belonged to the non-saline (0<EC<2) class. The relationship between cation-exchange capacity (CEC) and organic matter at the two vineyards showed a positive correlation (
Figure 2), and both of them decreased as the soil depth deepened (
Table 2). As indicated in
Table 2, the soils from Yuanyi farm had significantly higher bulk density at each depth than the Guangdong farm ones, since total pore space in sands is less than is silt or clay soils. For Guangdong farm, bulk density typically increased with soil depth since the subsurface layers contained less pore spaces and higher organic matter levels. Higher organic material may result in less compact soils. From the survey of bulk density, Yuanyi farm had more compact soils than Guangdong farm. Thus, the soils from Guangdong farm contained significantly higher percentages of organic matter than those of Yuanyi farm. In previous research, the organic matter content of soils in two vineyards located in Catalonia, Spain was 0.4%–2.0% [
20]. Another report pointed out that soils with 0.7%–0.9% organic matter were considered to be poor, whereas those with 1.7%–1.8% organic matter were considered to be rich soils [
21]. Thus, the organic matter content of soils in Guangdong farm was excessive (3.69%–8.42%) considering the general range of a rich soil. Nevertheless, the organic matter content of soils in Yuanyi farm was within a reasonable range (0.41%–1.40%). Water content of soils from Guangdong farm was significantly higher than at Yuanyi farm at each soil depth (17.2%–39.9%). Those could be attributed to organic matter increasing the water holding ability of soils directly and indirectly. On the other hand, higher bulk density consequently reduced the water holding capacity of soils.
Figure 2.
The relationship between cation-exchange capacity (CEC) and organic matter at Yuanyi farm and Guangdong farm. Data are mean values of three replications.
Figure 2.
The relationship between cation-exchange capacity (CEC) and organic matter at Yuanyi farm and Guangdong farm. Data are mean values of three replications.
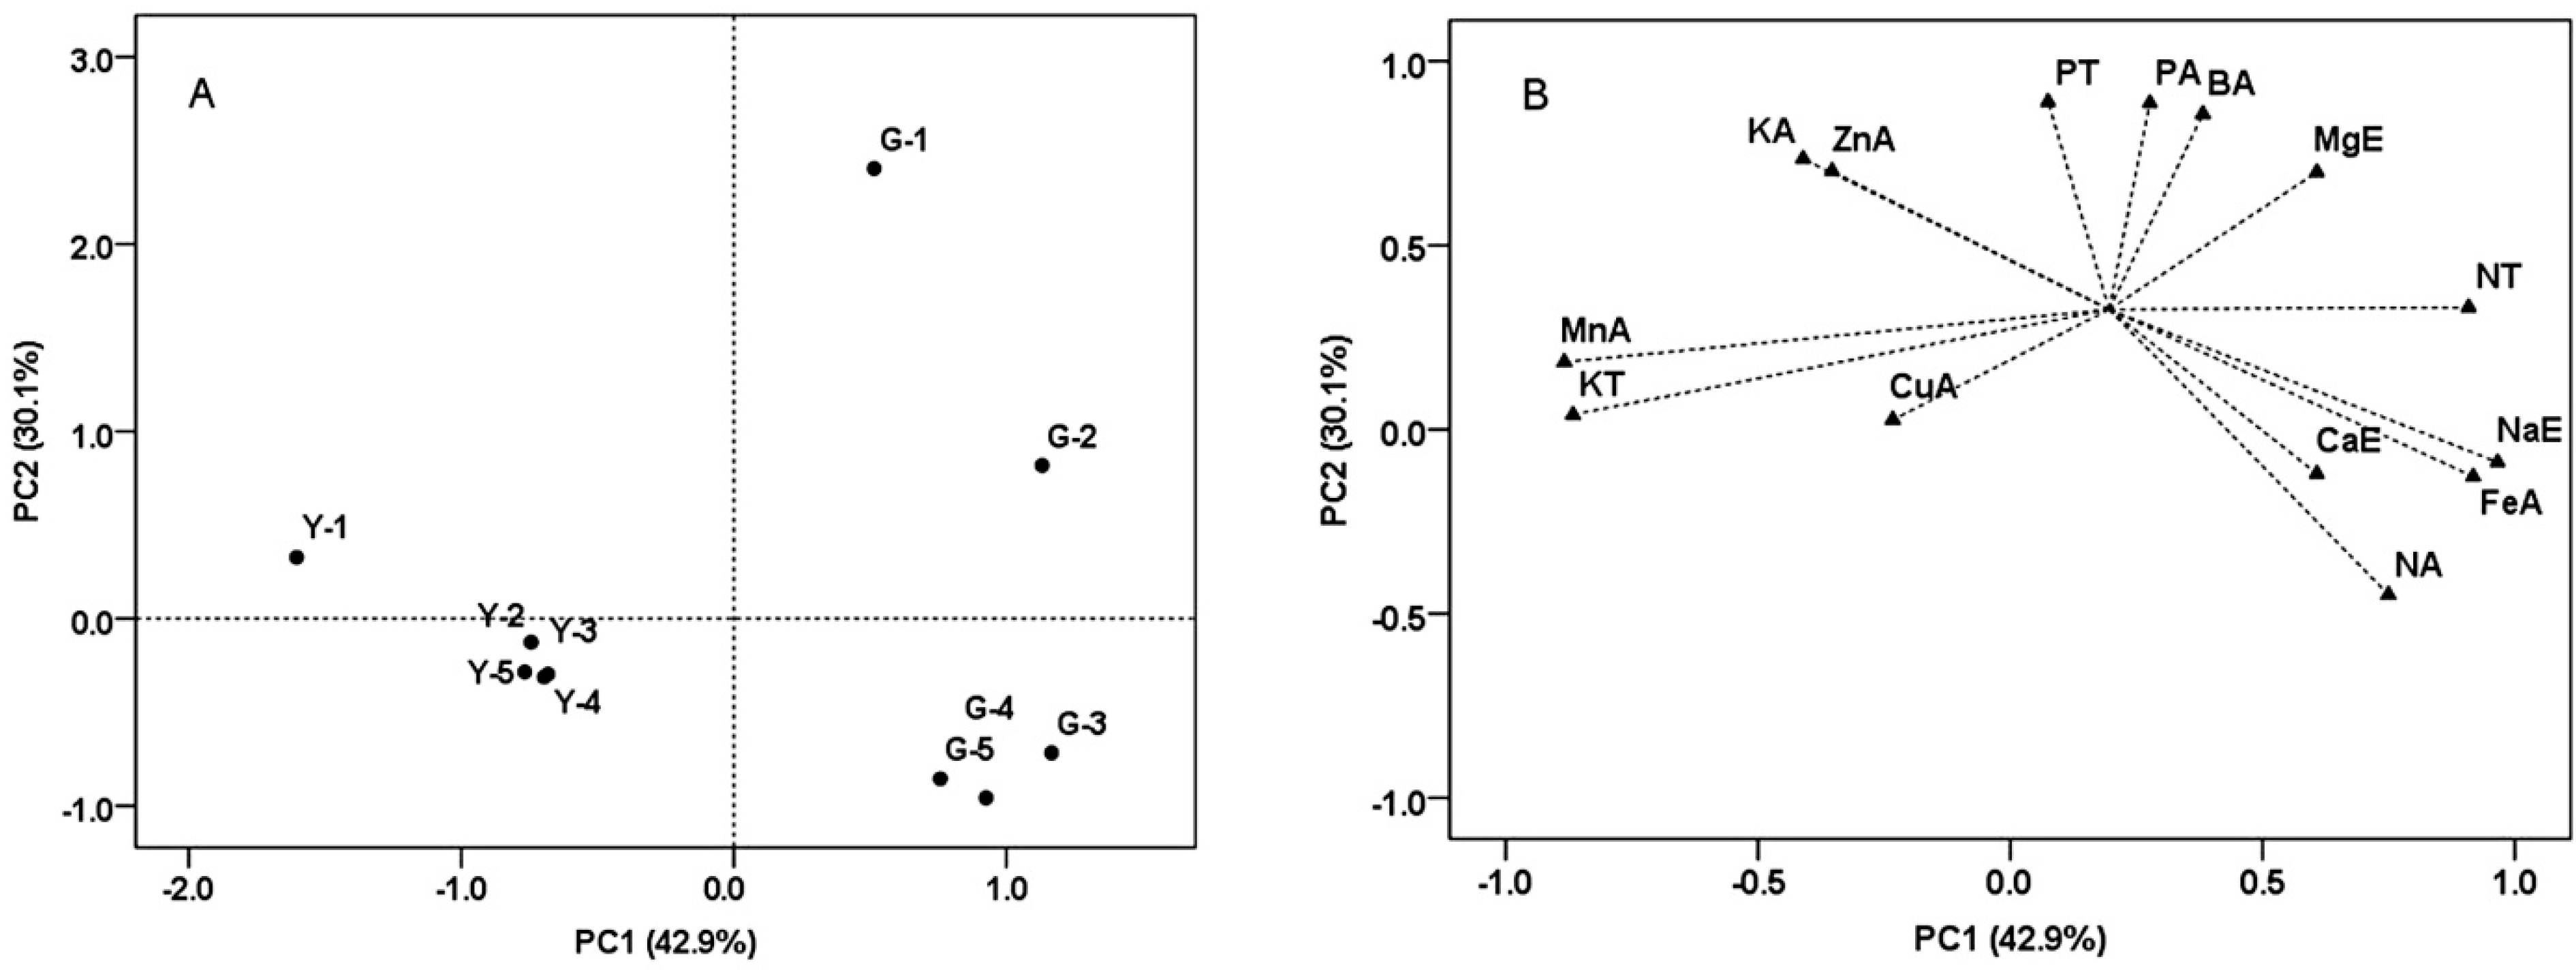
Principal component analysis (PCA) of soil properties from the two vineyards was conducted by using the variables including total, effective and readily available elements variables (
Figure 3). PC1 explained 42.9% of total variance, and was characterized by soils of all depths from Guangdong farm on the positive side. PC1 separated the soil samples of Yuanyi farm from Guangdong farm, and was mostly explained by total N, effective Na and available Fe having positive loadings. Specifically, the concentrations of these elements from soil samples were significantly higher in Guangdong farm (
Table 3). Total K and available Mn had negative loadings, and their concentrations were significantly higher in soil samples from Yuanyi farm (
Table 3). PC2 explained 30.1% of the variance and separated top soils (0–20 cm) of the two vineyards from the middle and bottom soils (40–100 cm). The top soils of two vineyards had abundant available elements such as P, Mn, Zn and B (
Table 3).
Table 3.
Chemical properties of the selected soils in two vineyards at different depths. Data are mean values of three replications.
Table 3.
Chemical properties of the selected soils in two vineyards at different depths. Data are mean values of three replications.
| Vineyards | Depth (cm) | Total Elements (%) | Effective Elements (mg/kg) | Available Elements (mg/kg) |
|---|
| N | P | K | Na | Ca | Mg | N | P | K | Cu | Fe | Mn | Zn | B |
|---|
| Yuanyi farm | 0–20 | 0.04b | 0.08a | 1.83a | 21.07b | 3494.46b | 140.62b | 50.86b | 10.10b | 133.29b | 0.75b | 1.61b | 1.01a | 1.40a | 0.47b |
| 20–40 | 0.07b | 0.08a | 1.85a | 33.40b | 3689.73b | 219.12b | 76.93a | 3.09b | 122.70a | 0.85a | 1.09b | 0.59a | 1.29a | 0.11b |
| 40–60 | 0.04b | 0.08a | 1.80a | 31.33b | 3811.77a | 233.70b | 59.05b | 1.45b | 123.05a | 0.75a | 0.89b | 0.65a | 0.66a | Nd |
| 60–80 | 0.05b | 0.07a | 1.81a | 39.48b | 3760.86b | 266.62a | 53.24b | 4.33b | 152.14a | 0.72b | 0.83b | 0.65a | 0.38a | Nd |
| 80–100 | 0.07b | 0.07a | 1.85a | 39.77b | 3800.32a | 295.58a | 55.61b | 4.36b | 134.72a | 0.76b | 1.10b | 0.91a | 0.41a | Nd |
| Guangdong farm | 0–20 | 0.30a | 0.11a | 1.73b | 51.83a | 3789.53a | 525.98a | 61.74a | 75.42a | 175.10a | 0.85a | 19.68a | 0.58b | 1.35b | 2.51a |
| 20–40 | 0.40a | 0.10a | 1.34b | 57.28a | 3775.11a | 490.15a | 69.34b | 18.25a | 129.57a | 0.58b | 22.65a | 0.45b | 0.82b | 1.03a |
| 40–60 | 0.30a | 0.06a | 1.40b | 66.10a | 3776.49b | 334.47a | 91.94a | 5.68a | 100.67b | 0.61b | 29.79a | 0.41b | 0.59b | 0.21 |
| 60–80 | 0.24a | 0.06a | 1.57b | 63.41a | 3824.79a | 265.22a | 86.13a | 8.59a | 78.92b | 0.84a | 33.92a | 0.40b | 0.35b | 0.25 |
| 80–100 | 0.19a | 0.08a | 1.66b | 52.72a | 3769.12b | 219.11b | 90.66a | 8.93a | 40.57b | 0.85a | 33.26a | 0.39b | 0.26b | 0.75 |
Figure 3.
Discrimination of the soil samples from two vineyards by some kind of elements attributes and illustrated by the score (A) and loading (B) plots from principal component analysis (PCA).Y, Yuanyi farm; G, Guangdong farm; 1 = 0–20 cm; 2 = 20–40 cm; 3 = 40–60 cm; 4 = 60–80 cm; 5 = 80–100 cm; T, Total; E, Effective; A, Readily available.
2.3. Vine Water and Nitrogen Status
Ambient CO
2 contains 98.9% of
12C isotope and 1.1% of
13C isotope.
12C is more easily used by the enzymes of photosynthesis in their production of hexoses. Therefore, the sugar produced by photosynthesis contains a higher rate of the
12C isotope than ambient CO
2. This process is called ‘isotope discrimination’. When grapevines are submitted to water deficits, isotope discrimination is reduced due to stomatal closure [
22]. Therefore, the
12C/
13C ratio (so-called δ
13C) allows a very sensitive detection of grapevine water status during grape ripening [
23].
With respect to vine water deficit thresholds [
24], there was no water deficit in vines from Guangdong farm during the two seasons (δ
13C < −26). However, vines grown in Yuanyi farm showed weak water deficit for its higher δ
13C values (−24.5 < δ
13C < −26) corresponding to its soils with lower water-holding capacity compared with Guangdong farm (
Table 4). Thus, the water content in soils affected the vine water status, which was confirmed by a significant negative correlation between δ
13C and water content in soils (
Table S1). Furthermore, N level was significantly lower in the vines of Yuanyi farm than at Guangdong farm. Soubeyrand
et al. [
3] used the chlorophyll content of the leaves to estimate the plant nitrogen status for the positive correlation between them. The chlorophyll content of the leaves from vines grown in Guangdong farm was significantly higher than that in Yuanyi farm. In addition, there was a positive correlation between N status of the plant
-leaf Chlorophyll, N status of the plan
t-organic matter in soils (
Table S1). This confirmed that the higher nitrogen content in the soils of Guangdong farm led to an increase in nitrogen uptake and assimilation by the vines. Aside from other considerations, examination of these results showed the fact that there were differences in vine nitrogen and water status between the soils of the two vineyards.
Table 4.
Differences of vine water and nutrient status between Yuanyi and Guangdong farm during two seasons. Data are mean values of three replications at least.
Table 4.
Differences of vine water and nutrient status between Yuanyi and Guangdong farm during two seasons. Data are mean values of three replications at least.
| Year | Vineyards | δ13C (‰) | N (%) | Leaf Chlorophyll |
|---|
| 2011 | Yuanyi farm | −25.34a | 0.47b | 45.01b |
| Guangdong farm | −26.76b | 0.54a | 46.95a |
| 2012 | Yuanyi farm | −25.06a | 0.46b | 45.75b |
| Guangdong farm | −26.51b | 0.49a | 46.54a |
2.4. Some Parameters of Vine, Shoot, Cluster and Berries from Two Vineyards in Two Vintages
Although there were no significant differences between the two vineyards regarding shoot number, yield, yield/pruning weigh and leaf area/yield in 2011 and 2012 (
Table 5), vines grown in Guangdong farm had significantly longer shoots and less number of clusters per shoot than Yuanyi farm ones (
Table 5). In addition, Yuanyi farm had significantly lighter and looser clusters compared with Guangdong farm (
Table 5). From
Table S1, there was a positive correlation between cluster compactness-organic matter in soils, cluster compactness-water content in soils. Thus, the clusters from the soils with less organic matter and lower water content would be characterized by their looser clusters, and this conclusion is verified in the discussion about anthocyanins.
Table 5.
Survey of some parameters about yields from two vineyards at harvest in 2011 and 2012. Data are mean values of three replications at least.
Table 5.
Survey of some parameters about yields from two vineyards at harvest in 2011 and 2012. Data are mean values of three replications at least.
| Years | Vineyards | Survey of Shoots | Survey of Clusters | Yield (ton/hectare) | Yield/Pruning Weigh (kg/kg) | Leaf Area/Yield (m2/kg) |
|---|
| Average Shoot Length (cm) | Shoot Number/m | Cluster Number/Shoot | Cluster Weight (g) | Cluster Compactness (OIV rating) |
|---|
| 2011 | Yuanyi farm | 122b a | 13.85a | 1.80a | 107.10b | 4.00b | 9.14a | 5.49a | 1.98a |
| Guangdong farm | 127a | 14.29a | 1.64b | 111.22a | 5.67a | 8.45a | 5.32a | 2.08a |
| 2012 | Yuanyi farm | 132b | 13.55a | 1.79a | 107.97b | 3.67b | 10.48a | 5.66a | 2.03a |
| Guangdong farm | 136a | 15.38a | 1.58b | 119.20a | 5.33a | 11.59a | 5.78a | 2.12a |
Some physical and chemical characteristics of berries were measured for grape samples from the two vineyards during different developmental stages (
Figure 4). During the grape development in 2011 and 2012, fresh weight per berry increased until harvest in Yuanyi and Guangdong farm (
Figure 4A). During the early stages of berry development, berries grew faster at Yuanyi farm than at Guangdong farm between 4 and 11 weeks after flowering (WAF). At harvest, fresh weight per berry in Guangdong farm was higher than Yuanyi farm in the two-year study. Overall, berries had a heavier weight in 2011 than in 2012. Skin weight per berry showed an increasing trend from 4 to 11 WAF, then decreased from 13 WAF to harvest (
Figure 4B).
Figure 4.
Some physical and chemical characteristics of berry changed with the grape development in two vineyards in 2011 and 2012. Data are mean values of three replications. Error bars show standard error (SE). Light grey background represents the phase of bunch turning colour (veraison) from 10% to 100% of coloured berries.
Low nitrogen would be expected to cause a lower rate of shoot growth and chlorophyll formation [
25]. The growth of the shoots is strongly affected by soil conditions and they grow longer where soils are more fertile and can hold more water [
26]. In a previous report, cluster weight showed a negative correlation with the number of clusters per grapevine, because of the increasing berry numbers per cluster and weight caused by the decreasing cluster number [
27]. Thus similar result patterns were seen in the two vineyards regarding shoot and cluster parameters as in previous research. Berry weight at Yuanyi farm was lighter in the soils with lower water content and weak water deficit for vines, which was consistent with a low water supply causing a reduction in berry weight [
28]. In each vintage, the value of skin weight for Yuanyi farm was higher than for Guangdong farm. Previous research on deficit irrigation has shown an increase in skin weight [
29], and a significant negative correlation between skin fresh weight and leaf Chlorophyll in our study (
Table S1). Thus, the differences in the soil and vine parameters at Yuanyi and Guangdong farm make it easy to draw conclusions on the basis of these results.
TSS exhibited a continuous increase from 4 to 15 WAF (
Figure 4C). The maximum values of TSS for Yuanyi farm and Guangdong farm were 23.0 and 23.2 °Brix in 2011, but 26.8 and 25.9 °Brix in 2012. On the other hand, the changes of TA in juice of grapes from two vineyards in 2011 and 2012 are shown in
Figure 4D. Grapes from the two vineyards in 2012 had higher TA than in 2011, and for each year, Guangdong farm had more TA in grape juice compared with Yuanyi farm.
Adequate ripening may also be problematic in soils that are too wet [
19]. While, in this study, TSS was equivalent in the two vineyards at harvest in 2011, the TSS of grapes from Yuanyi farm was higher than at Guangdong farm in 2012. A higher TA in the grapes from Guangdong farm was consistent with the other findings where canopies with excessive soil moisture had higher TA [
30]. On the other hand, grapes with lower TSS and higher TA at the Guangdong farm were attributed to wetter soils, but this could also have been an effect of excessive organic matter.
2.5. The Concentrations of Anthocyanins in Grape Skins from Two Vineyards in 2011 and 2012
The anthocyanins extracted from the grape skins during crushing, pressing, and fermentation are the major components responsible for red wine color [
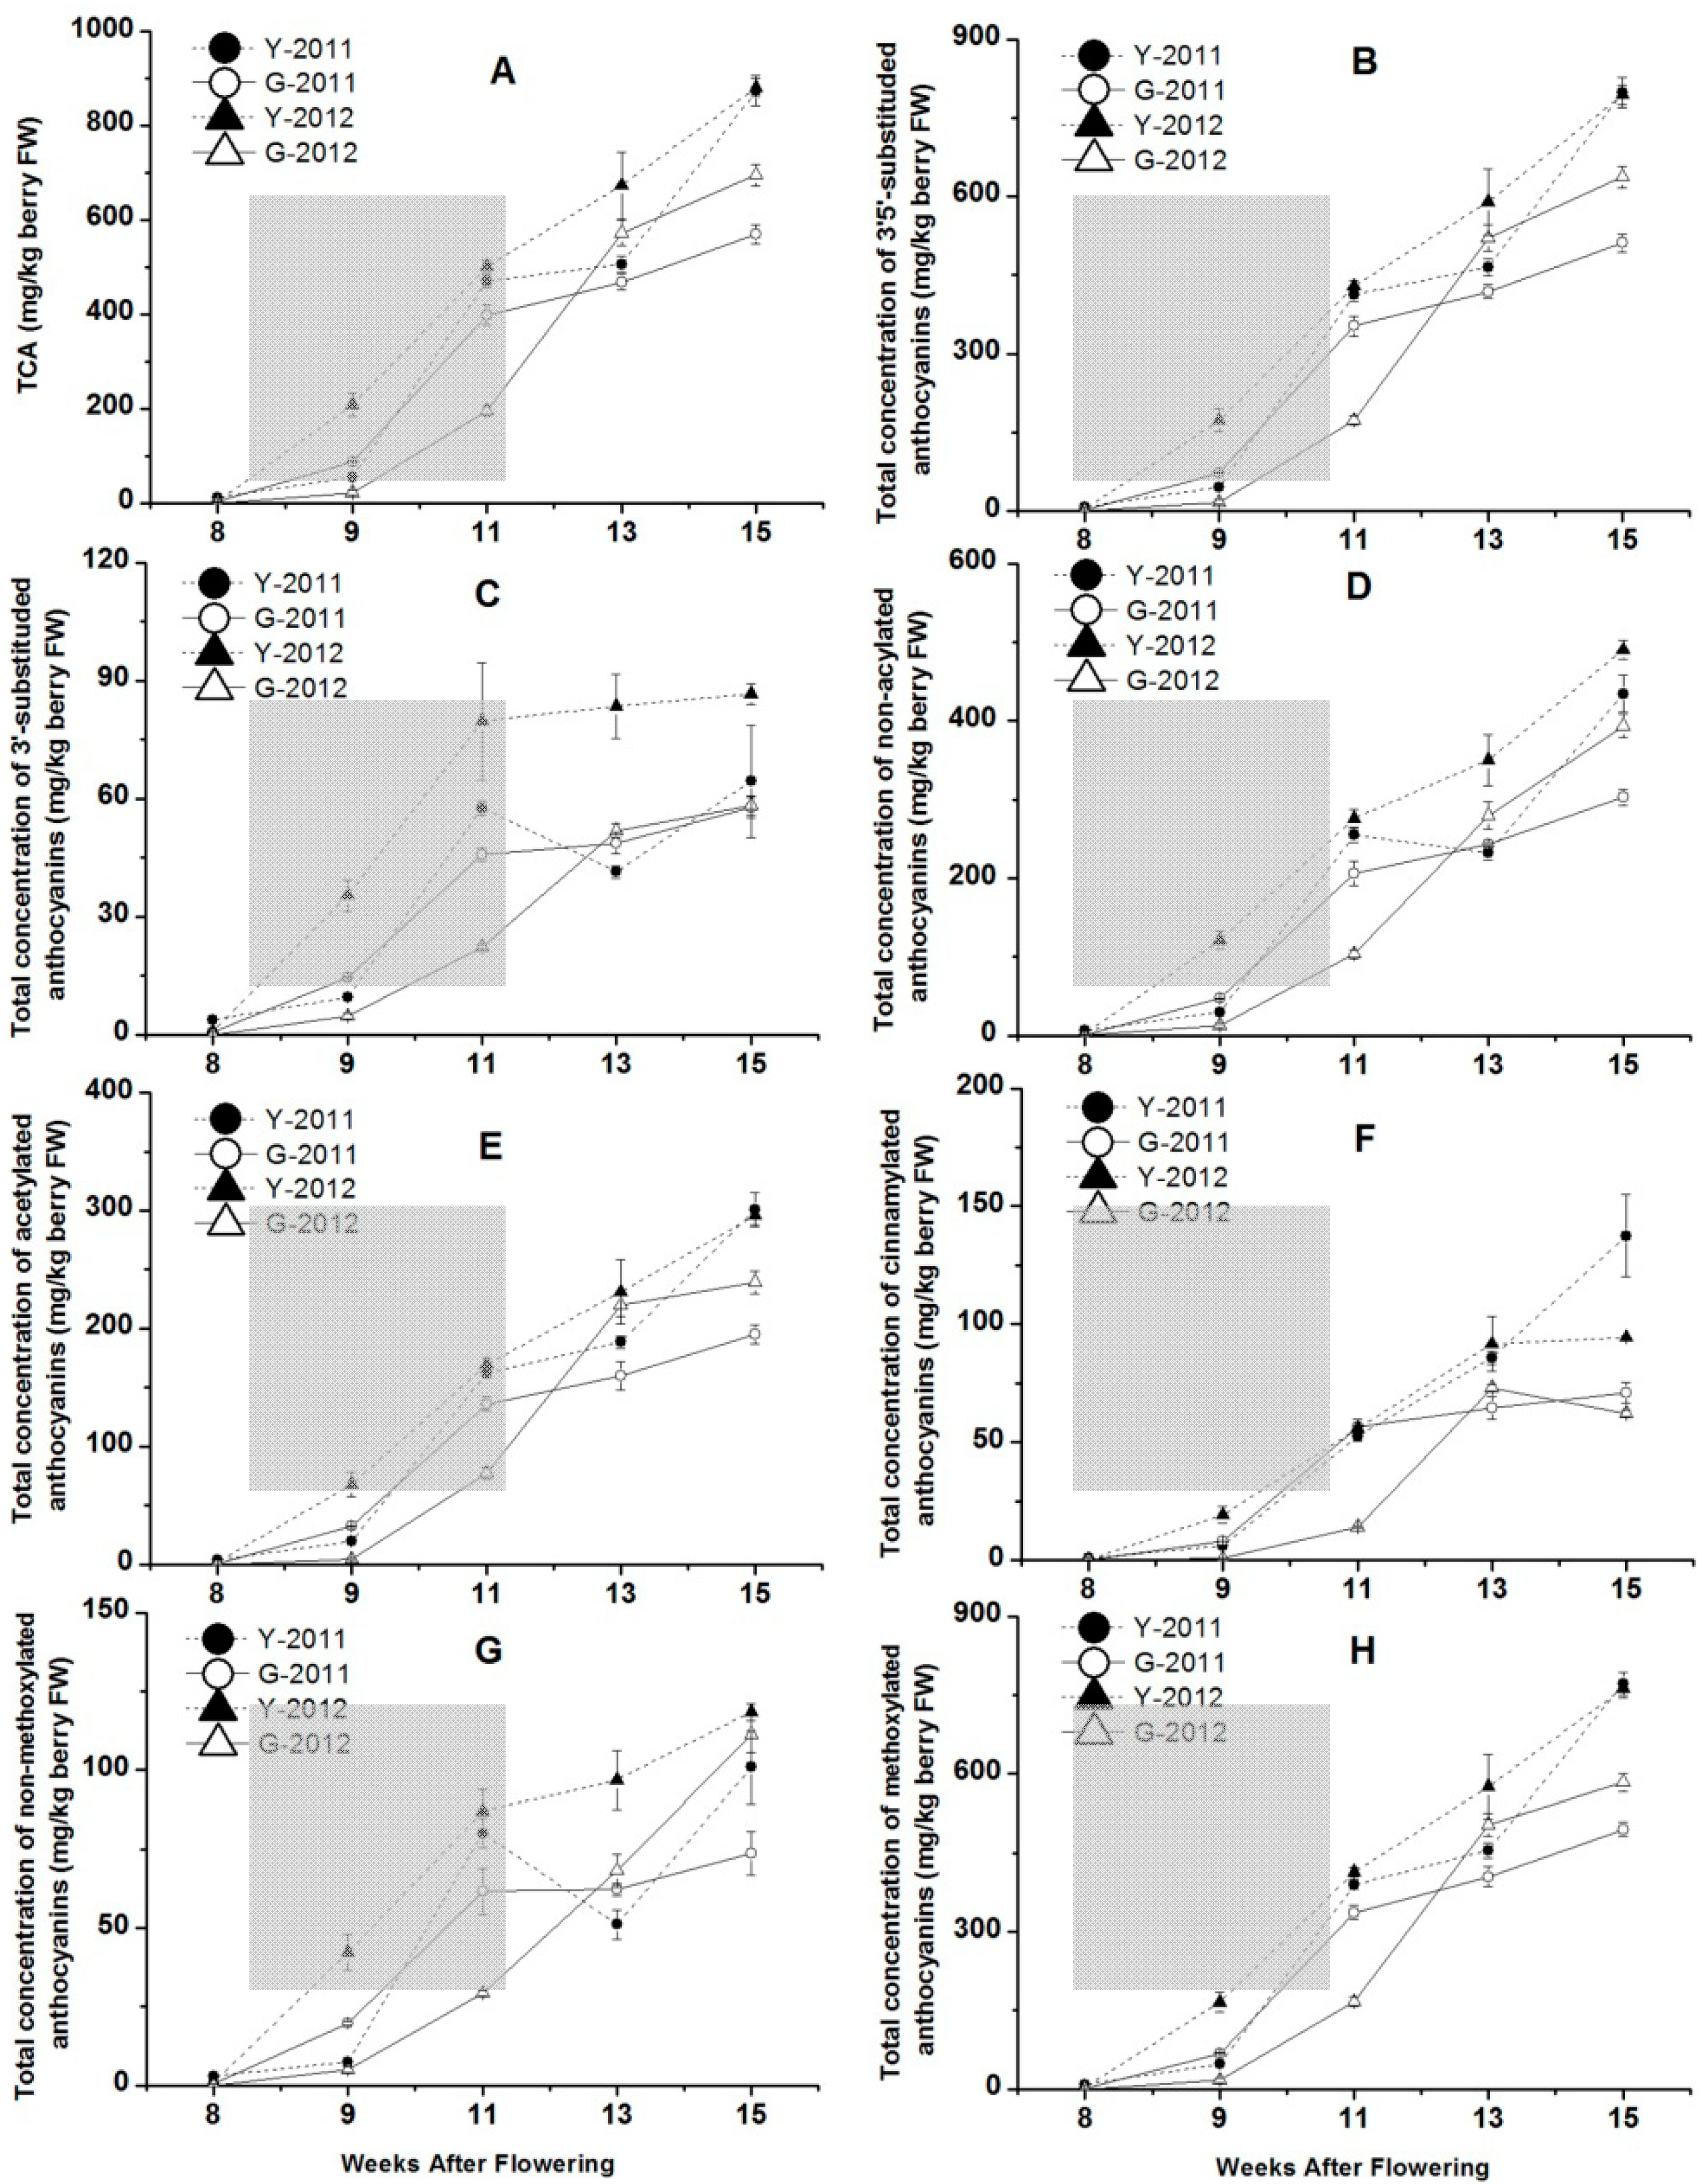
31]. The total concentration of anthocyanins (TCA) and each kinds of anthocyanin with different modifications showed continuous increases from 8 to 15 WAF (
Figure 5A). The late stage of veraison (9 to 11 WAF) was a period of rapid accumulation for anthocyanin compounds. The maximum TCA values for Yuanyi farm were 873.3 mg/kg at harvest in 2011 and 880.4 mg/kg in 2012, but those for Guangdong farm were 568.9 mg/kg in 2011 and 695.2 mg/kg in 2012 (
Figure 5A). In 2011 and 2012, grapes harvested from Yuanyi farm accumulated 35% and 21% more anthocyanins, respectively, than those from Guangdong farm, if anthocyanin content was expressed as concentration in fresh berry (mg/kg of berry fresh weight). This indicated that the effect of vintage was more significant in Guangdong farm when discussing TCA during the two seasons, while the regional differences always illustrated that grapes from Yuanyi farm could accumulate much more TCA. Meanwhile, TCA in grape skins is more variable than TSS (
Figure 4C) between the two vineyards at each sampling point, although the evolution of anthocyanins was parallelled by the accumulation of sugars.
In previous studies, some reported vintage variation [
32], whereas others reported minimal influence of the season on anthocyanin accumulation [
31]. Anthocyanin accumulation in grapes is light and temperature sensitive [
32], so air temperatures might also have an influence on anthocyanin accumulation. Considering the climatic parameters such as mean temperature, the maximum and minimum temperature and growing degree days, 2011 was a cooler year with shorter sunlight duration and more rainfall compared with the same period in 2012 (
Table 1), but extreme temperatures (>35 °C) were more frequent in 2011 than in 2012 (
Figure 1). Although the lowest anthocyanin content was detected during the hottest year [
20], this conclusion could not be verified in our study in each vineyard over two consecutive seasons. The total concentrations of anthocyanins at harvest in 2012 were higher than in 2011, especially in Guangdong farm, and their concentration increased by 22% (
Figure 5).
Furthermore, the concentrations of anthocyanins expressed in mg/kg grapes were positively related to berry number and total skin surface per kilogram of grapes, resulting in the smallest berries being characterized by the highest content of anthocyanins [
33]. In fact, exceedingly high temperatures (>35 °C) are particularly inhibitory to anthocyanin synthesis [
32], so the increase of TCA in 2012 for each vineyard could be attributed to the decrease of berry fresh weight at harvest time (
Figure 5), and less number of extreme temperature (>35 °C) days. Moreover, there was a significant positive correlation between TCA and δ
13C, but negative correlation between TCA and N (
Table S1). Thus, higher vine water status and N levels were also major causes for the low coloration of grapes in 2011.
Figure 5.
The concentration of total anthocyanins, 3′5′-substituded and 3′-substituded anthocyanins, non-acylated, acetylated and cinnamylated anthocyanins, non-methoxylated and methoxylated anthocyanins changed with the grape development in two vineyards in 2011 and 2012. Data are mean values of three replications. Error bars show standard error (SE). Light grey background represents the phase of bunch turning colour (veraison) from 10% to 100% of coloured berries.
In this survey, the effect of the soils on vine behaviour was mediated through varying water content and nitrogen levels of the grapevines. With regard to the effect of water status, moderate and not severe water stress or drought stress have been reported to increase anthocyanin concentrations [
34]. For the different growth rate of the skins and flesh responses to the change of water conditions, the mild water deficits increase the concentrations of skin tannins and anthocyanins through increasing skin weight, relative skin weight per berry, and therefore amounts of skin-localised solutes [
35]. In the present study, Yuanyi farm had higher value of berry skins than Guangdong farm at harvest in each experimental season (
Figure 4B). Furthermore, there was a significant positive correlation between TCA and skin fresh weight (
Table S1). Research on terroir shows that a moderate nitrogen deficiency (like a mild water deficit) has been correlated with improved grape quality [
36]. For the experimental samples, not only did Yuanyi farm have a faster speed of anthocyanin accumulation during berry development, but also a higher TCA at harvest in the two years (
Figure 5). The above conclusions were also associated with lower water content of soils and vine water status at Yuanyi farm (
Table S1).
F3′H (flavonoid 3′-hydroxylase) and F3′5′H (flavonoid 3′5′-hydroxylase) are involved in the biosynthetic pathway of cyanidin- and delphinidin-based anthocyanins, respectively. 3′5′-Substituted anthocyanins contain delphinidin, petunidin, malvidin anthocyanins and their derivatives. A higher accumulation of delphinidin-based anthocyanins in grape skins is expected to produce more intensely purple coloured berry and dark-colored red wine [
37,
38]. The concentrations of 3′5′-substituded anthocyanins showed an increasing trend during the developmental phase as well as TCA for each vineyard (
Figure 5B). However, the concentration of 3′5′-substituded anthocyanins at Guangdong farm was 511 mg/kg, only 64% and 80% of that at Yuanyi farm at harvest in 2011 and 2012. On the other hand, the concentrations of 3′-substituded anthocyanins increased from veraison to harvest, although they remained at low ranges compared with 3′5′-substituded anthocyanins (
Figure 5C). Additionally, 2012 showed higher concentrations of 3′5′- substituted anthocyanins than 2011. It was worth noting that the concentration of 3′-substituded anthocyanins in grape skins from Yuanyi farm in 2012 was the highest among all the developmental phases. From the analysis of correlation coefficients between variables, both of 3′5′-substituded and 3′-substituded anthocyanins showed significant positive correlations with skin fresh weight or δ
13C, but significant negative correlations with vine N status (
Table S1).
Considering further modification, two types of acylated anthocyanins are produced by acylation and cinnamylation in the grape skins of ‘Cabernet Sauvignon’. The concentrations of non-acylated, acetylated and cinnamylated anthocyanins accumulated and peaked at harvest stage for each vineyard (
Figure 5D–F). For non-acylated and acetylated anthocyanins, the concentrations in the two vineyards in 2012 were higher than those in 2011 (
Figure 5D–E), but the opposite was true for the concentrations of cinnamylated anthocyanins in each vineyard in 2011 and 2012 (
Figure 5F). The concentration of each class of anthocyanins at Yuanyi farm was higher than at Guangdong farm at harvest, which could be associated with vine N status, cluster compactness and skin fresh weight (
Table S1).
In addition,
O-methylation of the 3′ position of the anthocyanidins cyanidin and delphinidin leads to the formation of peonidin and petunidin. Finally,
O-methylation of positions 3′ and 5′ of delphinidin, leads to the formation of petunidin and malvidin. The methylated anthocyanins included peonidin, petunidin, malvidin anthocyanins and their derivatives. Because of their phenolic B ring substitution, peonidin and malvidin are relatively stable and represent the major anthocyanin pools in mature grapes [
39]. The concentrations of methylated anthocyanins were 772 and 495 mg/kg in Yuanyi and Guangdong farm at harvest time in 2011, and 762 and 584 mg/kg in 2012, respectively (
Figure 5G–H). Thus, the modification of anthocyanins influences their resulting wines by the colour, and grapes from the soils with less water content and organic matter are expected to produce more dark-colored red wine in the future (
Table S1).
2.6. Principal Component Analysis (PCA) of the Grape Samples from Two Vineyards at Harvest
Previous research suggested that the anthocyanin fingerprint of grapes was related to cultivar and weather conditions of the growing season according to PCA [
40]. In the present study, PCA was used to examine the effects of soil and vintage on the composition of anthocyanins (
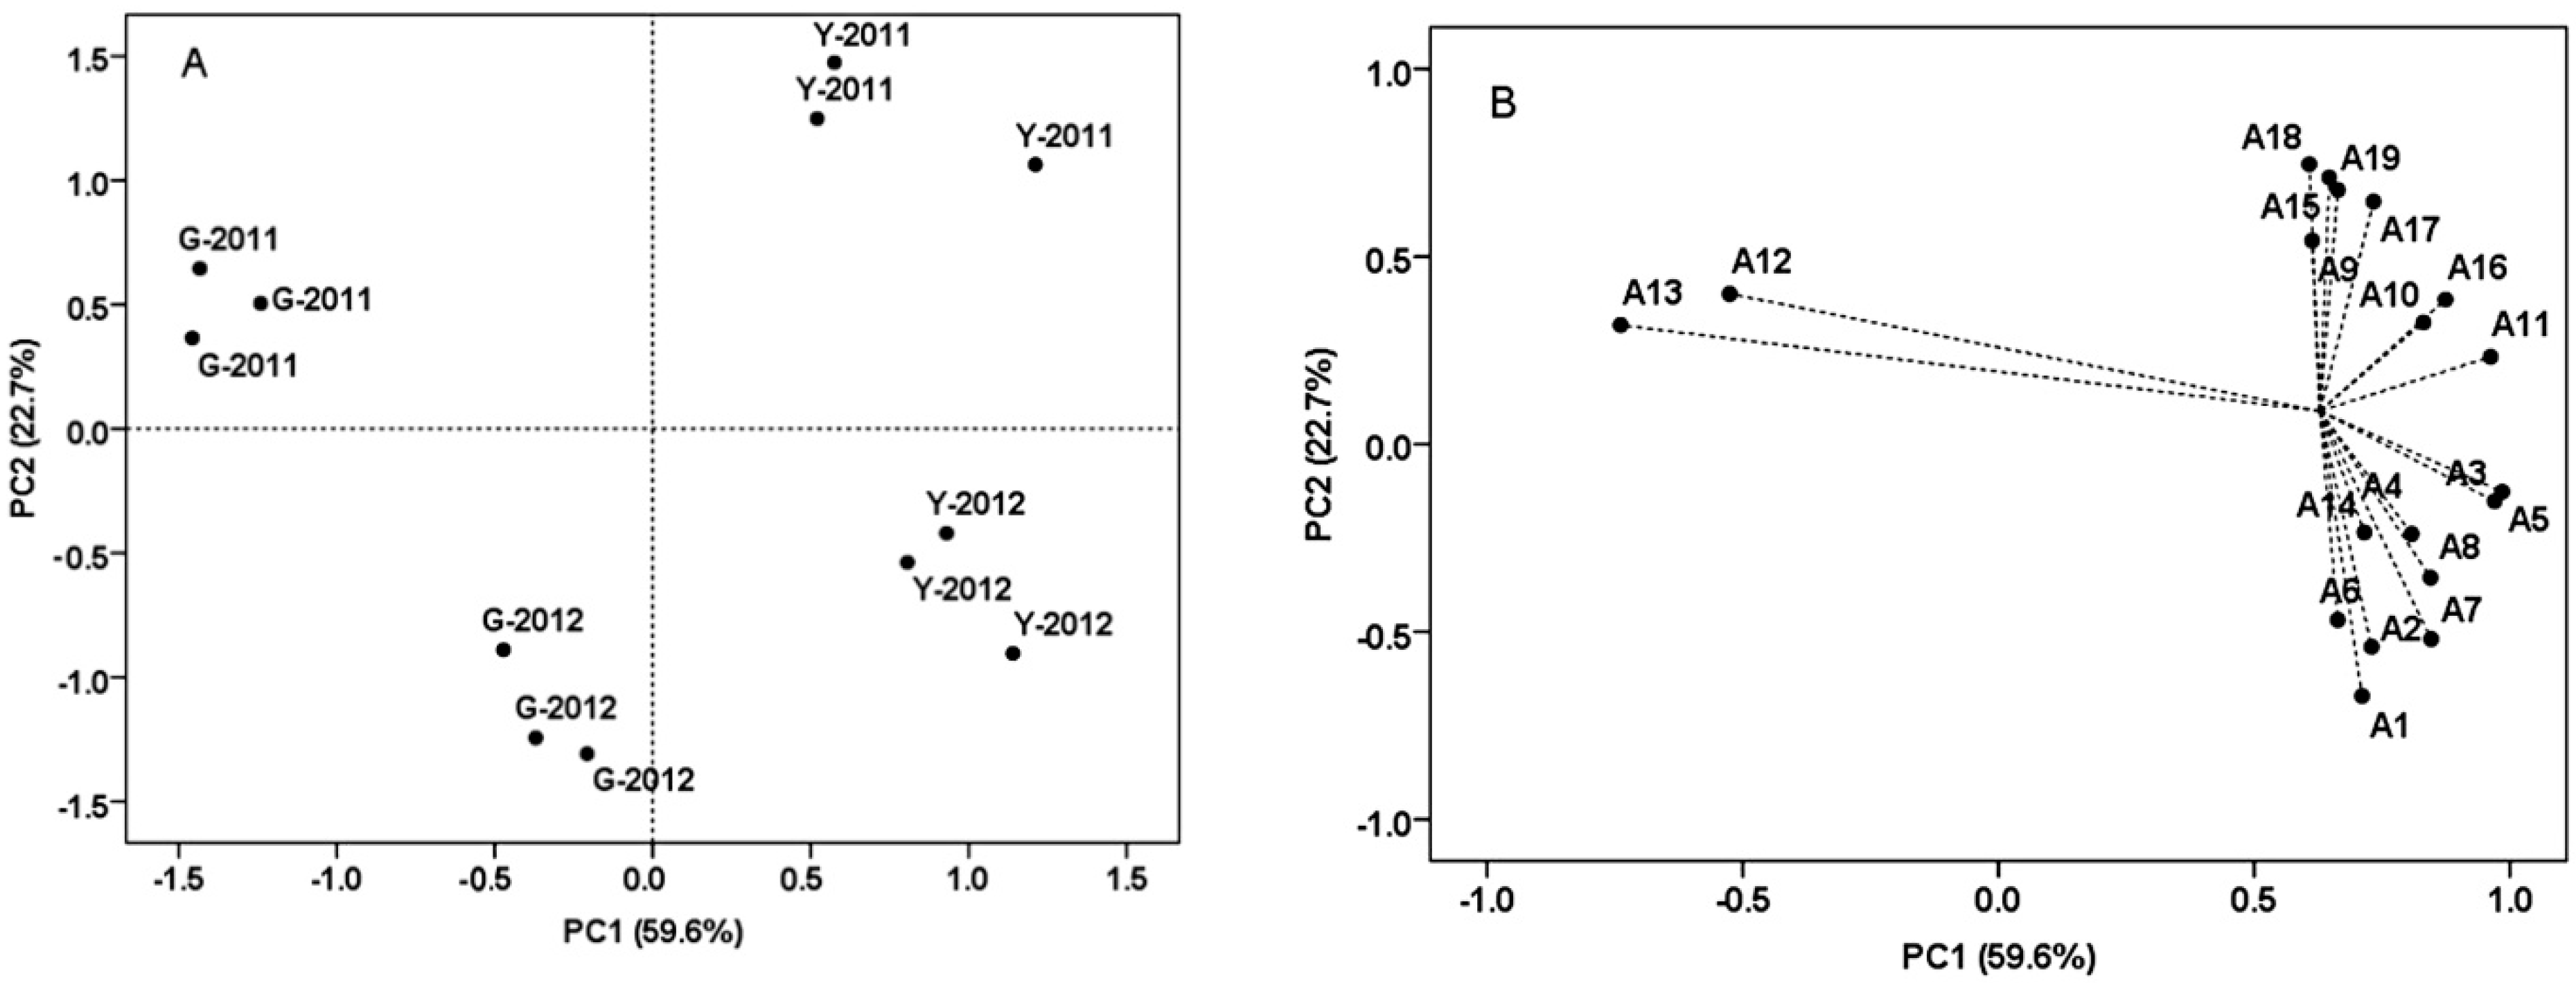
Figure 6). Nineteen different anthocyanins detected at harvest in two vintages were used as the variables, and each result contained three replicates, although malvidin-3-
O-(6-
O-caffeoyl)-glucoside was not detected in grape skins from Guangdong farm (
Table 6). PC1 explained 59.6% of total variance, and characterized all grape samples from Yuanyi farm on the positive side. PC1 separated all the grape samples of Yuanyi farm from Guangdong farm, and could be mostly explained by malvidin-3-
O-glucoside and malvidin-3-
O-(6-
O-acetyl)-glucoside having positive loadings. It is worth noting that malvidin-3-
O-glucoside was the most prevalent anthocyanin and malvidin-3-
O-(6-
O-acetyl)-glucoside was the major acylated anthocyanin in all the grape samples from the two vineyards. Some similar observations are obtained from research conducted on ‘Merlot’ grape clusters in Prosser [
41]. While petunidin-3-
O-(6-
O-caffeoyl)-glucoside and cyanidin-3-
O-(6-
O-coumaryl)-glucoside had negative loadings, and their concentrations were higher in grape samples from Guangdong farm (
Table 6). PC2 explained 22.7% of the variance and separated grape samples of 2011 from 2012. In previous research, the percentages of dephinidin-3-
O-glucoside in warm years was lower than in a relatively cool year [
40]. In the present study, the grape samples of 2012 were abundant in dephinidin-3-
O-glucoside, cyanidin-3-
O-glucoside, dephinidin-3-
O-(6-
O-acetyl)-glucoside, cyanidin-3-
O-(6-
O-acetyl)-glucoside, and those of 2011 had higher concentrations of petunidin-3-
O-(6-
O-coumaryl)-glucoside, peonidin-3-
O-(
trans-6-
O-coumaryl)-glucoside, malvidin-3-
O-(
cis-6-
O-coumaryl)-glucoside and malvidin-3-
O-(
trans-6-
O-coumaryl)-glucoside (
Table 6). Most anthocyanins in grape skins from Yuanyi farm showed higher concentrations at harvest in each year, and for each vineyard, 2011 had higher concentrations of coumarylated anthocyanins than 2012, so by using the concentrations of individual anthocyanin detected at harvest we could clearly discriminate the effects of vineyard and vintage.
Figure 6.
Discrimination of the grape samples from two vineyards by the concentration of individual anthocyanin detected at harvest in two vintages, and illustrated by the score (A) and loading (B) plots from principal component analysis (PCA). Each point means a biological replicate in plot A. Y, Yuanyi farm; G, Guangdong farm.
Table 6.
The concentration of individual anthocyanin (mean ± se; n = 3) detected in grape skins of “Cabernet Sauvignon” from two vineyards at harvest in 2011 and 2012.
Table 6.
The concentration of individual anthocyanin (mean ± se; n = 3) detected in grape skins of “Cabernet Sauvignon” from two vineyards at harvest in 2011 and 2012.
| Anthocyanins | 2011 | 2012 |
|---|
| Yuanyi farm (mg/kg berry FW) | Guangdong farm (mg/kg berry FW) | Yuanyi farm (mg/kg berry FW) | Guangdong farm (mg/kg berry FW) |
|---|
| dephinidin-3-O-glucoside (A1) | 52.31 ± 3.7 | 37.65 ± 1.28 | 66.83 ± 0.86 | 63.20 ± 2.48 |
| cyanidin-3-O-glucoside (A2) | 6.97 ± 0.52 | 6.24 ± 0.27 | 8.49 ± 0.75 | 7.31 ± 0.21 |
| petunidin-3-O-glucoside (A3) | 42.36 ± 3.09 | 31.94 ± 1.61 | 43.40 ± 1.35 | 38.92 ± 1.29 |
| peonidin-3-O-glucoside (A4) | 28.71 ± 2.22 | 23.47 ± 1.39 | 39.28 ± 2.22 | 25.05 ± 1.44 |
| malvidin-3-O-glucoside (A5) | 302.77 ± 14.46 | 201.11 ± 6.17 | 332.49 ± 10.28 | 259.38 ± 10.72 |
| dephinidin-3-O-(6-O-acetyl)-glucoside (A6) | 24.94 ± 5.45 | 17.73 ± 5.19 | 28.22 ± 4.10 | 27.84 ± 3.43 |
| cyanidin-3-O-(6-O-acetyl)-glucoside (A7) | 5.45 ± 0.95 | 2.45 ± 0.18 | 7.91 ± 0.51 | 6.13 ± 0.65 |
| petunidin-3-O-(6-O-acetyl)-glucoside (A8) | 17.74 ± 1.76 | 12.51 ± 1.01 | 18.24 ± 0.49 | 17.95 ± 0.92 |
| dephinidin-3-O-(6-O-coumaryl)-glucoside (A9) | 7.67 ± 1.42 | 4.18 ± 0.40 | 4.98 ± 0.67 | 4.88 ± 0.47 |
| peonidin-3-O-(6-O-acetyl)-glucoside (A10) | 18.20 ± 0.86 | 13.99 ± 0.51 | 19.32 ± 0.34 | 12.58 ± 0.58 |
| malvidin-3-O-(6-O-acetyl)-glucoside (A11) | 234.36 ± 8.87 | 148.40 ± 2.63 | 221.82 ± 3.50 | 174.58 ± 5.01 |
| petunidin-3-O-(6-O-caffeoyl)-glucoside (A12) | 0.49 ± 0.15 | 1.07 ± 0.28 | 0.55 ± 0.00 | 0.31 ± 0.01 |
| cyanidin-3-O-(6-O-coumaryl)-glucoside (A13) | 2.05 ± 0.21 | 4.39 ± 0.54 | 2.00 ± 0.74 | 2.00 ± 0.76 |
| malvidin-3-O-(6-O-caffeoyl)-glucoside (A14) | 0.38 ± 0.10 | Nd | 1.21 ± 0.05 | Nd |
| petunidin-3-O-(6-O-coumaryl)-glucoside (A15) | 6.28 ± 0.43 | 3.75 ± 0.23 | 4.36 ± 0.07 | 3.60 ± 0.17 |
| peonidin-3-O-(cis-6-O-coumaryl)-glucoside (A16) | 0.65 ± 0.05 | 0.41 ± 0.01 | 0.64 ± 0.03 | 0.38 ± 0.01 |
| peonidin-3-O-(trans-6-O-coumaryl)-glucoside (A17) | 12.88 ± 1.99 | 6.85 ± 0.39 | 8.95 ± 0.32 | 4.85 ± 0.19 |
| malvidin-3-O-(cis-6-O-coumaryl)-glucoside (A18) | 4.88 ± 0.41 | 2.62 ± 0.16 | 3.65 ± 0.22 | 2.31 ± 0.09 |
| malvidin-3-O-(trans-6-O-coumaryl)-glucoside (A19) | 102.01 ± 16.81 | 47.64 ± 2.77 | 68.04 ± 0.60 | 43.95 ± 1.22 |


