1. Introduction
The identification of potential drug-target interactions is a crucial task in drug discovery, which helps to find novel targets for existing drugs or identify targets for new drugs [
1]. Wet experiments are reliable ways of determining interactions between drugs and targets, but they are cost-intensive and time-consuming [
2]. In contrast, computational methods provide economic and efficient alternative to predict possible drug-target interactions with high reliability for further experiments.
To the best of our knowledge, researchers collect drug-target interaction data, and construct the public databases. Available drug-target data facilitate the development of drug-target interaction prediction methods. Traditional computational methods include molecular docking simulation methods and ligand-based methods. Though docking simulation methods are effective, they cannot work without three-dimensional (3D) structures of targets [
3]. Ligand-based methods perform well when there are sufficient known ligands for a target protein, but such methods are not suitable for large-scale data [
4].
In addition, several methods have been proposed based on properties of drug and targets. Kuhn et al. [
5] used molecular features and target proteins to predict drug-target relations. Garcia-Sosa et al. [
6,
7] introduced logistic regression and naïve Bayesian classifiers for classification of compounds into one disease category or organ by studying target-ligand data. Cao et al. [
8] found that genes that have spatial interactions may have similar molecular function and developed a new gene function prediction method based on gene-gene interacting networks. Xu et al. [
9] proposed a stochastic gradient boosting algorithm to predict effective drug combination. Zeng et al. [
10] developed a novel features fusion method and adopted the random forest classifier for protein-protein interaction prediction. Wei et al. utilized the random forest classifier [
11] and an ensemble classifier called LibD3C [
12] to predict protein-protein interaction.
Recently, a great number of machine learning methods have been introduced for the drug-target interaction prediction, and machine learning-based methods are roughly divided into four categories: classification methods, matrix factorization methods, kernel methods and network inference methods. Classification methods take drug-target interaction pairs and non-interaction pairs as positive instances or negative instances, and build the classification models for predictions. For example, Nagamine et al. [
13] and Wang et al. [
14] constructed support vector machine (SVM) models; Tabei et al. [
15] utilized logistic regression and SVM. Matrix factorization methods use the matrix factorization technique to reconstruct drug-target interactions. The kernelized Bayesian matrix factorization with twin kernels (KBMF2K) [
16] and multiple similarity collaborative matrix factorization (MSCMF) [
17] have been used for predictions and graph-regularized matrix factorization (GRMF) [
18]. Kernel methods include the pair kernel method (PKM) [
19], net Laplacian regularized least squares (NetLapRLS) [
20], and regularized least squares with Kronecker product kernel (RLS-Kron) [
21]. Network inference methods formulate the drug-target interactions as the graph learning. Bleakley and Yamanishi [
22] built bipartite local model (BLM). Mei et al. [
23] improved the BLM by considering new drug candidates through its neighbors’ interaction profiles. Chen et al. [
24] applied a random walk technique to walk on a drug-drug similarity network, a target-target similarity network and known drug-target interaction networks for predictions. Cheng et al. [
25] adopted the resource allocation method to infer interactions in the drug-target bipartite network. Moreover, there are different types of machine learning-based methods [
26,
27,
28,
29,
30].
Drug-drug similarity or target-target similarity are critical components in many drug-target interaction prediction methods [
17,
19,
20,
21,
22,
23,
24]. How to define the similar drugs (targets) is critical, and the point is to calculate drug-drug similarity. To the best of our knowledge, there are different ways of calculating drug-drug similarity based on feature vectors, such as cosine similarity, Gauss similarity and Jaccard similarity. Cosine similarity consists in measuring the cosine of the angle between two vectors in an inner product space. Gauss similarity utilizes the Gauss kernel function to measure the similarity. Jaccard similarity considers the interaction of components and the union.
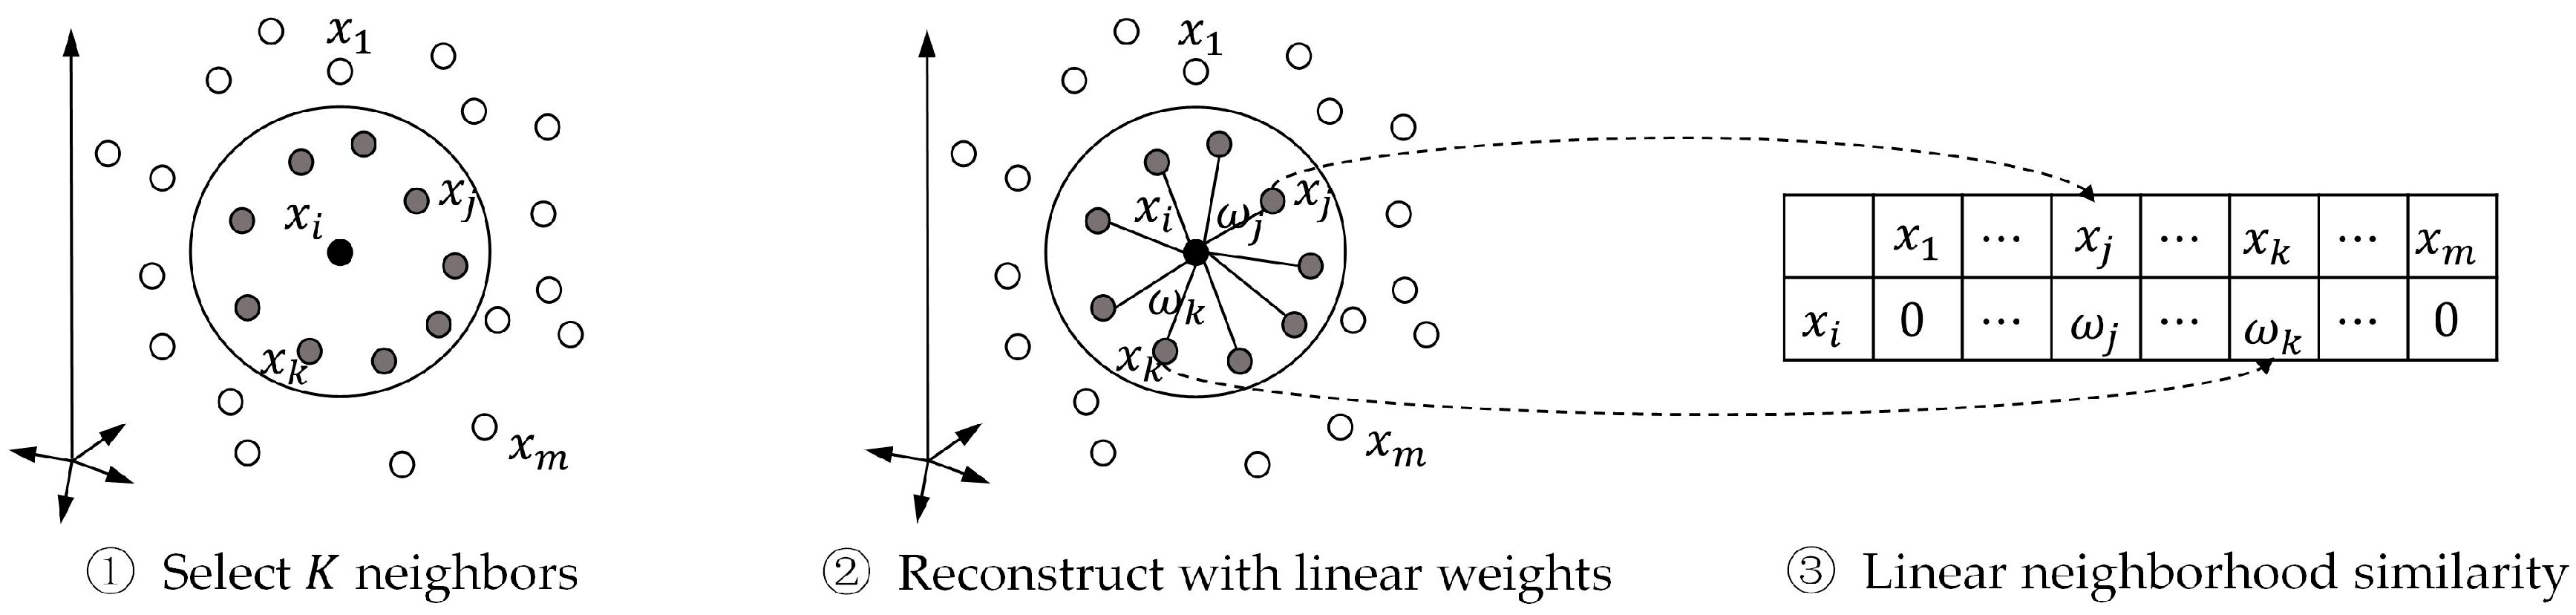
In this paper, we propose a label propagation method with linear neighborhood information (LPLNI) for drug-target interaction predictions. Firstly, we calculate drug-drug linear neighborhood similarity in the feature spaces by considering how to reconstruct data points from neighbors. Then, we take similarities as the manifold of drugs and assume the manifold unchanged in the interaction space. At last, we predict unobserved interactions between known drugs and targets by using drug-drug linear neighborhood similarity and known drug-target interactions. We present a feature of drugs named the interaction profile from the known drug-target interactions. The LPLNI model, based on the interaction profiles, perform well in the computational experiments, achieving AUPR up to 0.9051, 0.9461, 0.9658, and 0.9464 on the enzymes (Es) dataset, the GPCRs dataset, the ion channels (ICs) dataset, and the nuclear receptors (NRs) dataset, respectively. Further, we incorporate drug structure information into the LPLNI model by a nonlinear strategy, improving AUPR to 0.9069, 0.9469, 0.9684, and 0.9492 on the Es dataset, the GPCRs dataset, the ICs dataset, and the NRs dataset, respectively. The experimental results show that our method outperforms other state-of-the-art methods on these four benchmark datasets.
2. Results and Discussion
2.1. Evaluation Metrics
In order to evaluate the performances of prediction models, computational experiments were conducted on four benchmark datasets. Here, we adopted leave-one-out cross validation (LOOCV) to test model performances. That is, each drug-target pair was left out in turn, and remaining pairs were used as the training set to build models for predictions. We repeated the procedure until each drug-target pair is ever tested.
The AUC and AUPR are the most popular evaluation metrics in the previous works. AUC is the area under the receiver operating characteristic (ROC) curve, which plots the true positive rate (TPR) versus the false positive rate (FPR). AUPR is the area under the precision-recall curve, which plots the ratio of true positives among the predicted positives for each recall rate. There are more negative instances than positive ones, and AUPR punishes the false positives more in evaluation [
31]. Therefore, we adopted AUPR as the primary metric and used AUC to evaluate models.
2.2. The Performances of the LPLNI Models
In this section, we evaluate the performances of the LPLNI models. Since we had the interaction profiles and fingerprints for drugs, we respectively used these features to calculate the linear neighborhood similarities and then built LPLNI models. Here, we used the Pubchem fingerprint for analysis.
There are two parameters and in LPLNI, in which is the number of neighbors in the linear neighborhood similarity (LNS), and is the probability of absorbing target information from neighbors. These parameters may influence the results, and we can build LPLNI models using different parameter values. The number of drug neighbors should be less than the number of all drugs, and the four benchmark datasets, i.e., the nuclear receptors (NRs) dataset, the G-protein coupled receptors (GPCRs) dataset, the ion channels (ICs) dataset, and the enzymes (Es) dataset, contain 54, 223, 210, and 445 drugs, respectively. Therefore, we considered different neighborhood numbers 10, 30, and 50 for the NRs dataset, 60, 120, and 180 for the GPCRs and ICs datasets, and 120, 240, and 360 for the Es dataset. In addition, absorbing probability should be greater than zero, and smaller than one. Hence, for parameter we chose values from 0.1 to 0.9 (with a step size of 0.1).
The drug-drug similarity is critical for LPLNI. To demonstrate the superiority of linear neighborhood similarity, we also considered cosine similarity, Jaccard similarity, and Gauss similarity and applied label propagation to build similarity-based prediction models. The Gauss function calculates the similarity by
, which has the bandwidth parameter
, and we set
as in [
23], where
is the feature vector of the
-th drug, and
is the number of drugs.
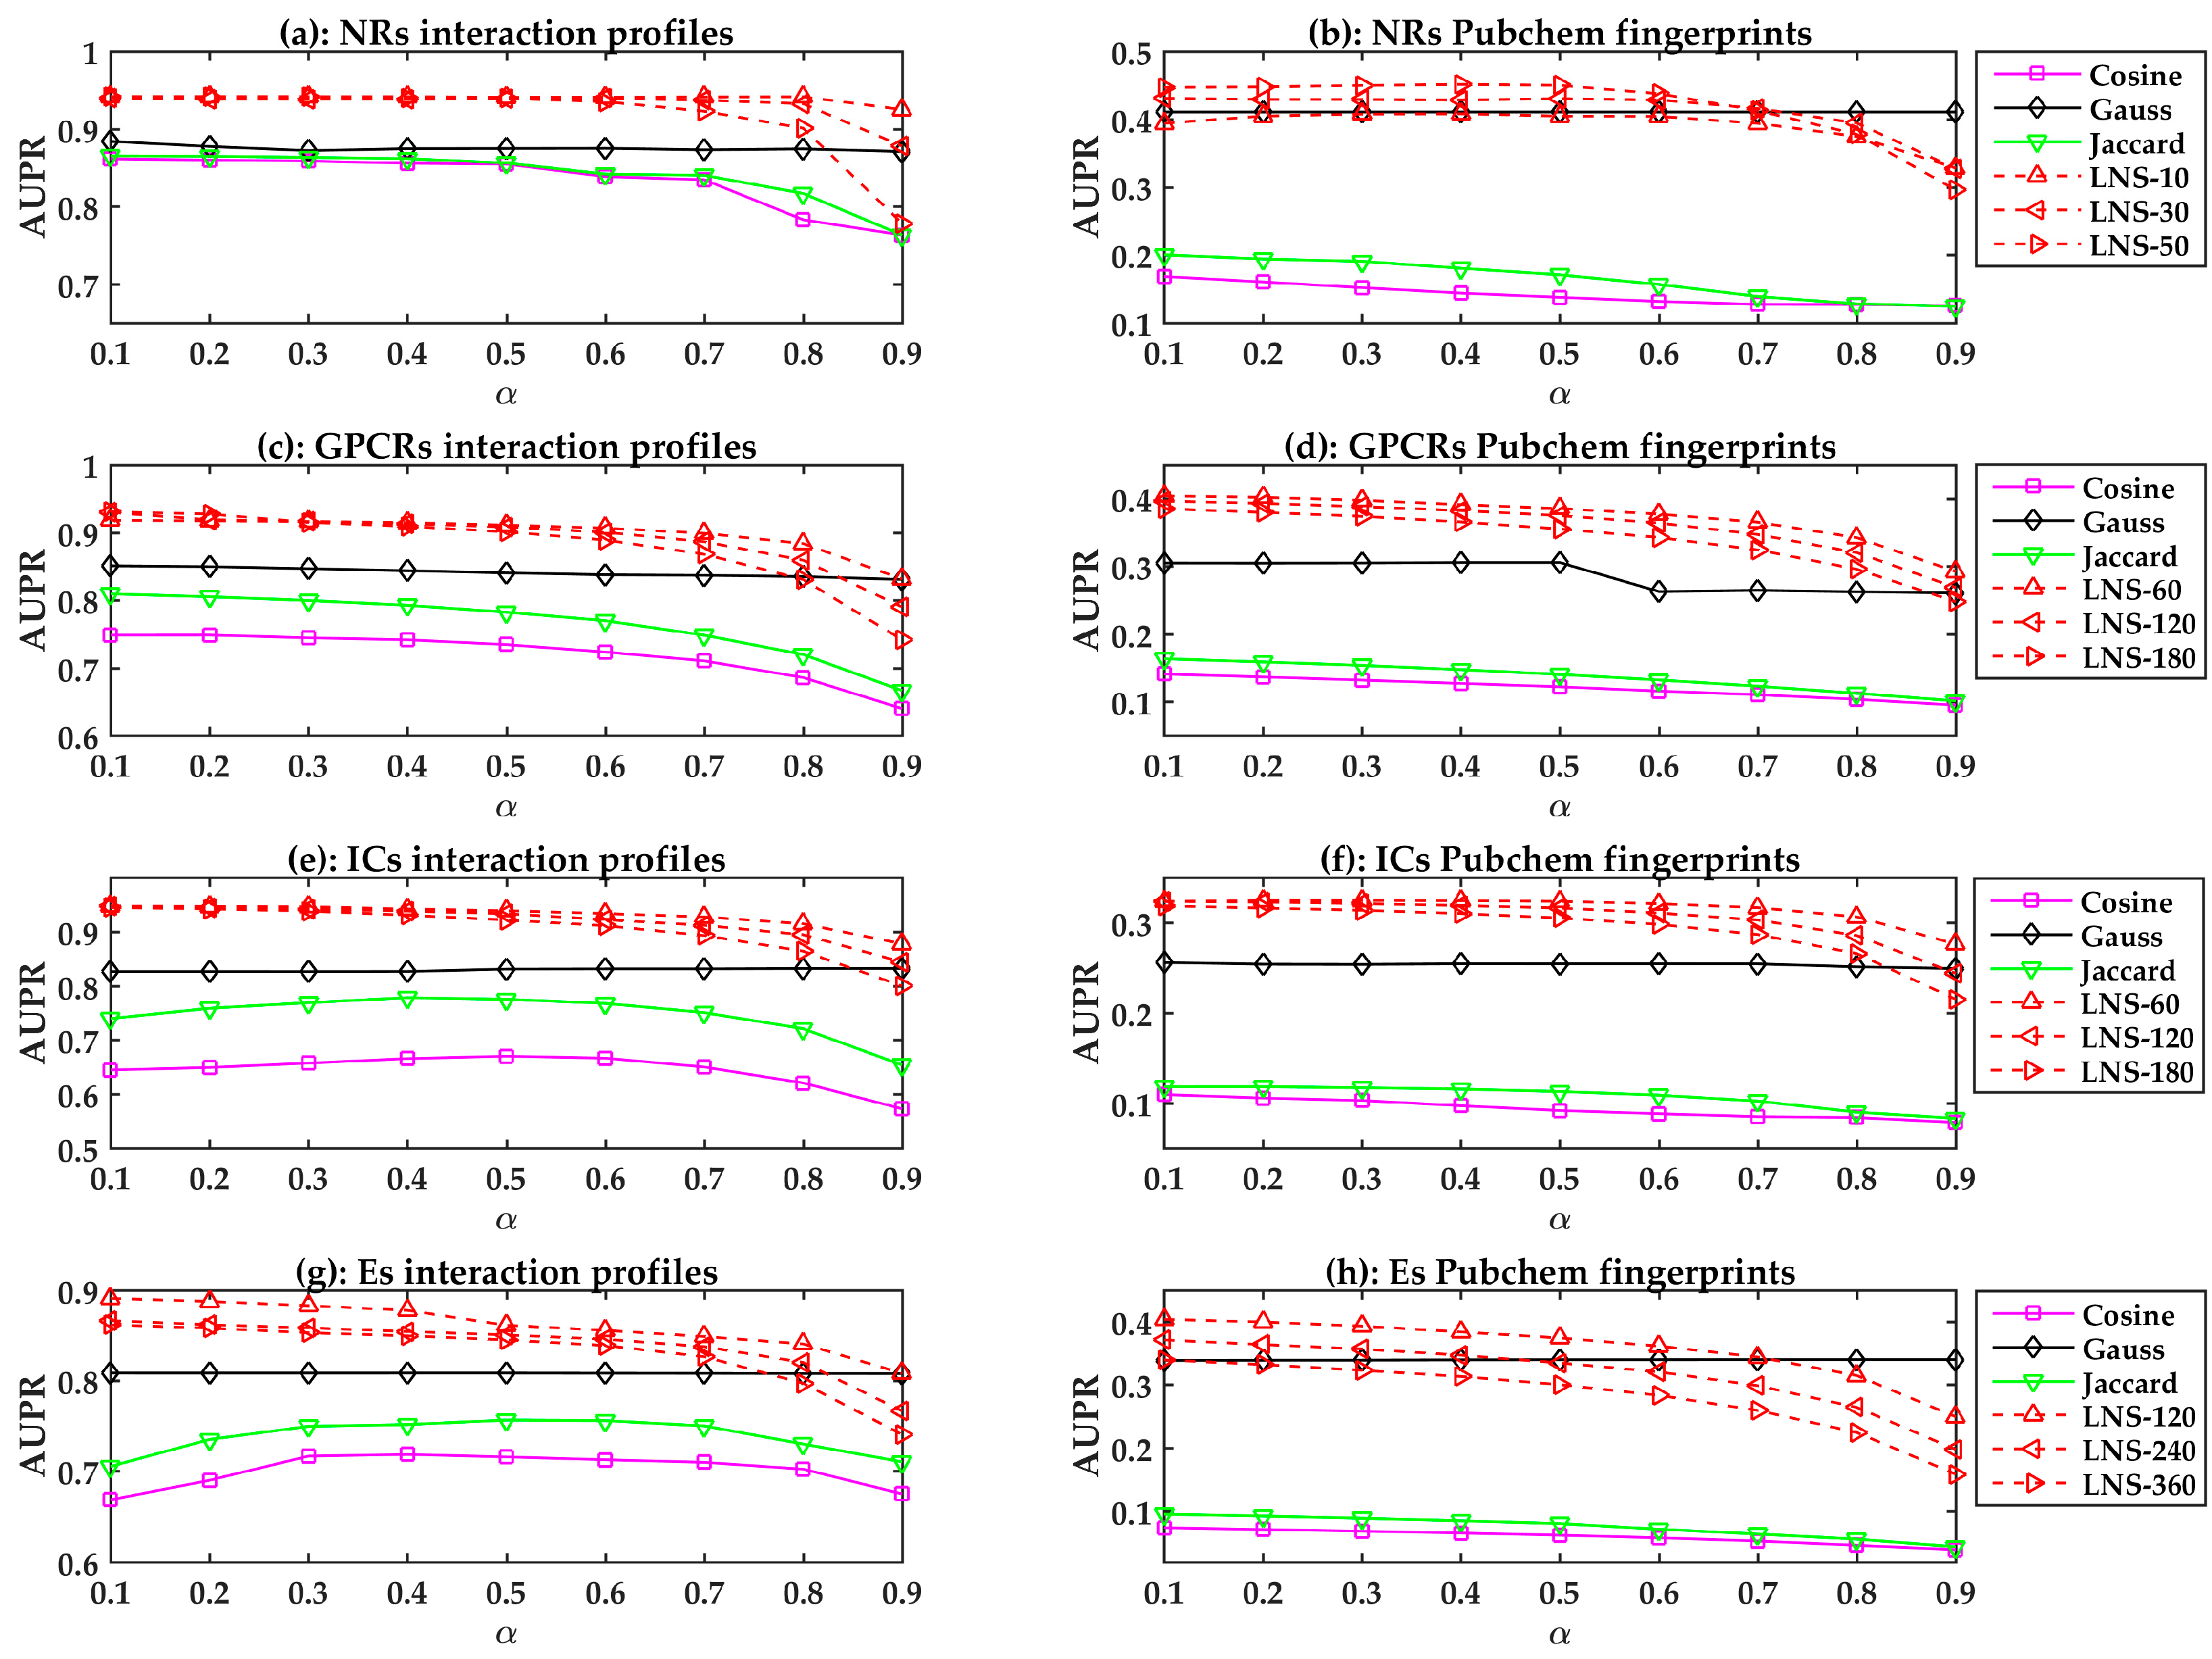
All prediction models are evaluated using LOOCV. The performances of different similarity-based models are shown in
Figure 1. In general, the linear neighborhood similarity can lead to better performances than can cosine similarity, Gauss similarity, or Jaccard similarity. The possible reason for the superior performances of the LPLNI models is that the linear neighborhood similarity describes the linear relationship of data points in the feature space. The linear neighborhood similarity is then smoothly transferred into the interaction space, and LPLNI utilizes the label propagation to make predictions based on the same linear relationship of data points in the interaction space.
Moreover, we observed that the LPLNI models based on the interaction profiles have better performances than the LPLNI models based on the Pubchem fingerprint, which indicates that the interaction profiles are an information source of utmost importance for prediction.
2.3. The Performances of LPLNI Models with Integrated Information
In machine learning, combining diverse information of drugs can improve the performance of prediction models [
32,
33,
34,
35,
36,
37]. In
Section 2.2, our study demonstrates that only the use of interaction profiles of drugs can lead to high-accuracy prediction models; however, we still attempted to incorporate structural information of drugs to further improve accuracy.
Since we had nine different fingerprints, we firstly built individual LPLNI models based on different fingerprint features and evaluated their usefulness. The leave-one-out cross validation performances of the prediction models are shown in
Table 1. Among all fingerprints, Daylight, Extended and Hybridization fingerprints produce better performances than others on the benchmark datasets. Although the performances of fingerprints are lower than the interaction profiles, fingerprints can still provide information for the drug-target interaction predictions. According to their performances, Daylight fingerprints, Extended fingerprints, and Hybridization fingerprints were adopted to incorporate into the interaction profile-based models.
By using the strategy described in
Section 3.4, we incorporated the three fingerprints into the interaction profile-based model and developed the prediction model with integrated information, named “LPLNI-II.” As shown in
Table 1, LPLNI-II can produce better results than individual feature-based models on the benchmark datasets, improving the AUPR values of 0.9464 to 0.9492 and AUC values of 0.9532 to 0.9919 (on NRs dataset), indicating the usefulness of combing various information of drugs.
2.4. Comparison with State-of-the-Art Methods
To the best of our knowledge, a great number of methods were proposed to predict drug-target interactions. NetLapRLS [
20] trained two classifiers based on the chemical and genomic information with the interaction profiles separately, and then linearly combined the two classifiers to develop the prediction model. RLS-Kron [
21] considered chemical structures, genomic sequences, and the interaction profiles, then calculated the similarity by the Gaussian function, and utilized the Regularized Least Squares (RLS) classifier to build prediction models. The model based on the interaction profiles could produce high-accuracy performances, and the final prediction model was developed by integrating diverse information with the Kronecker product. These methods and our method utilize the interaction profiles as the primary information sources to develop prediction models. To demonstrate the superiority of our method, we adopted NetLapRLS and RLS-Kron for comparison. All methods were evaluated by leave-one-out cross validation (LOOCV).
Since RLS-Kron and our method can make high-accuracy predictions using only the interaction profiles, we firstly built prediction models based on the interaction profiles and compared their performances. As shown in
Table 2, the AUPR values of LPLNI are 0.9051, 0.9461, 0.9658 and 0.9464, higher than RLS-Kron on the enzymes (Es) dataset, the G-protein coupled receptors (GPCRs) dataset, the ion channels (ICs) dataset, and the nuclear receptors (NRs) dataset, respectively. In addition, LPLNI produces superior AUC performances on the GPCRs dataset, the ICs dataset, and the NRs dataset. Therefore, the interaction profile-based LNLPI model produces better results than the interaction profile-based RLS-Kron model on these benchmark datasets.
Further, we tested the performances of the LPLNI model with integrated information (LPLNI-II) by comparing LPLNI-II with RLS-Kron and NetLapRLS. As shown in
Table 3, LPLNI-II can outperform benchmark methods on the GPCRs dataset, ICs dataset, and NRs dataset. Therefore, the LPLNI-II can integrate different information and make high-accuracy predictions.
2.5. Case Study
To test the potential of LNLPI in the drug-target interaction predictions, we built models based on known interactions of the Es dataset and then made predictions for unknown interactions. We checked the top 10 interactions predicted by our method and looked for evidences in SuperTarget [
38] to support our discoveries. SuperTarget contains updating interactions from several drug databases, i.e., DrugBank, KEGG, etc. As shown in
Table 4, 4 predictions out of 10 are confirmed, and results indicate that our method is capable of predicting novel interactions.


