An Integrated LC-MS-Based Strategy for the Quality Assessment and Discrimination of Three Panax Species


Abstract
1. Introduction
2. Materials and Methods
2.1. Materials and Reagents
2.2. Sample Solutions Preparation
2.3. Standard Ginsenosides Solutions
2.4. UHPLC-Q-Exactive Orbitrap HRMS Conditions for Qualitative Analysis
2.5. HPLC-ESI-MS/MS Conditions for Quantitative Analysis
2.6. Quantitative Method Validation
2.7. Multivariate Statistical Analysis
3. Results and Discussion
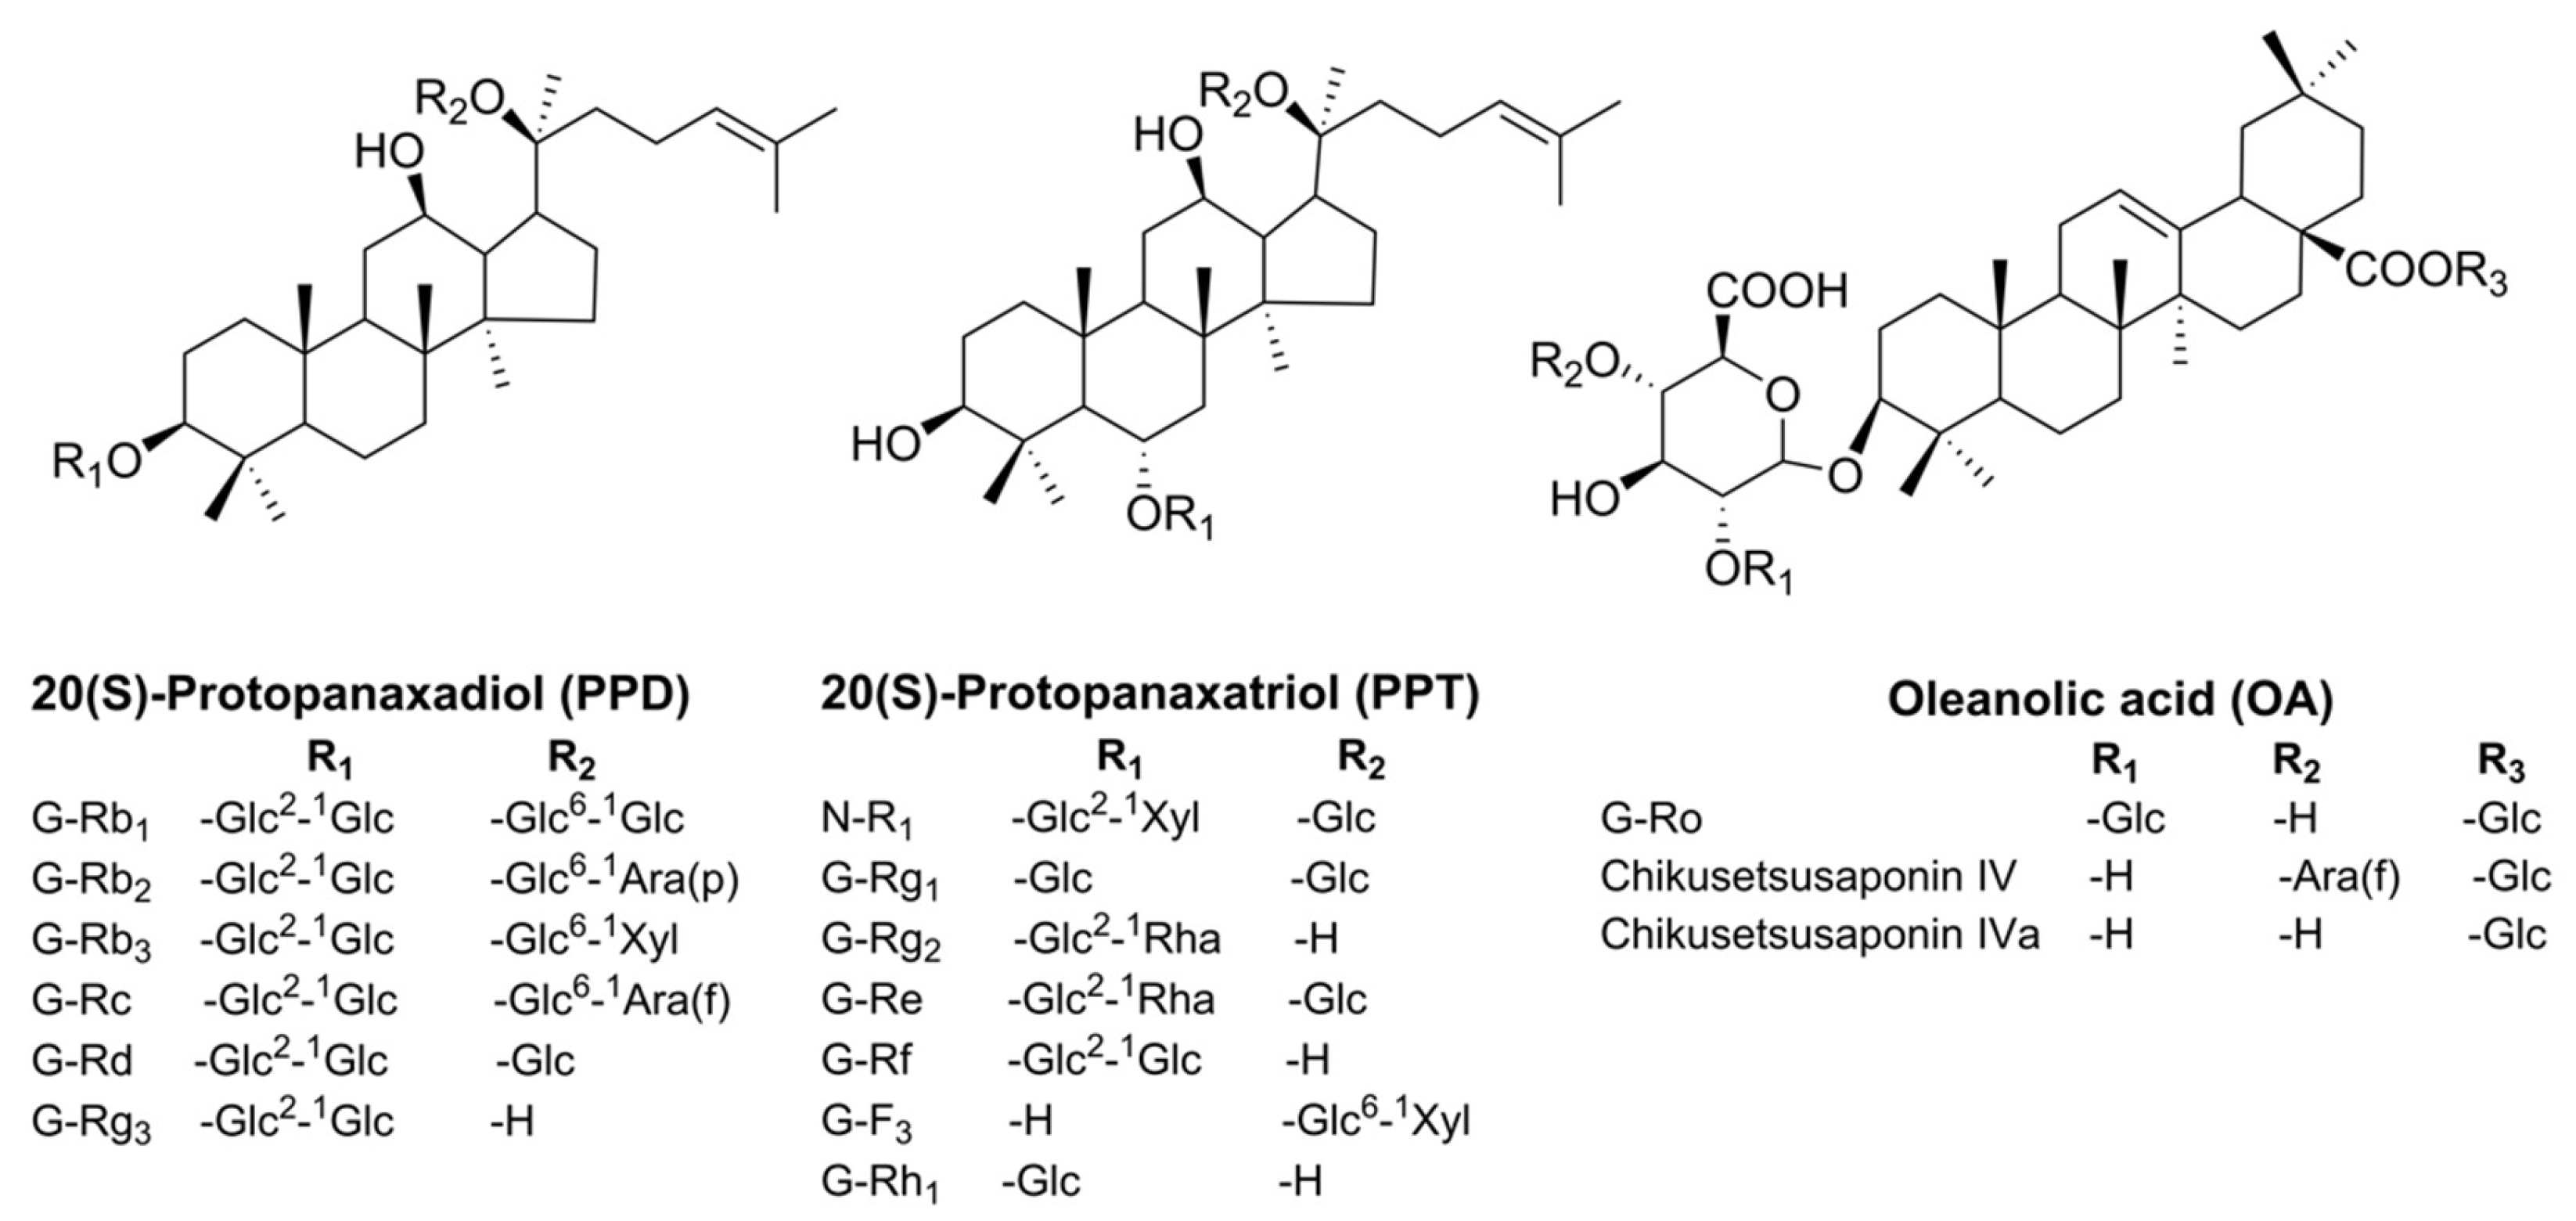
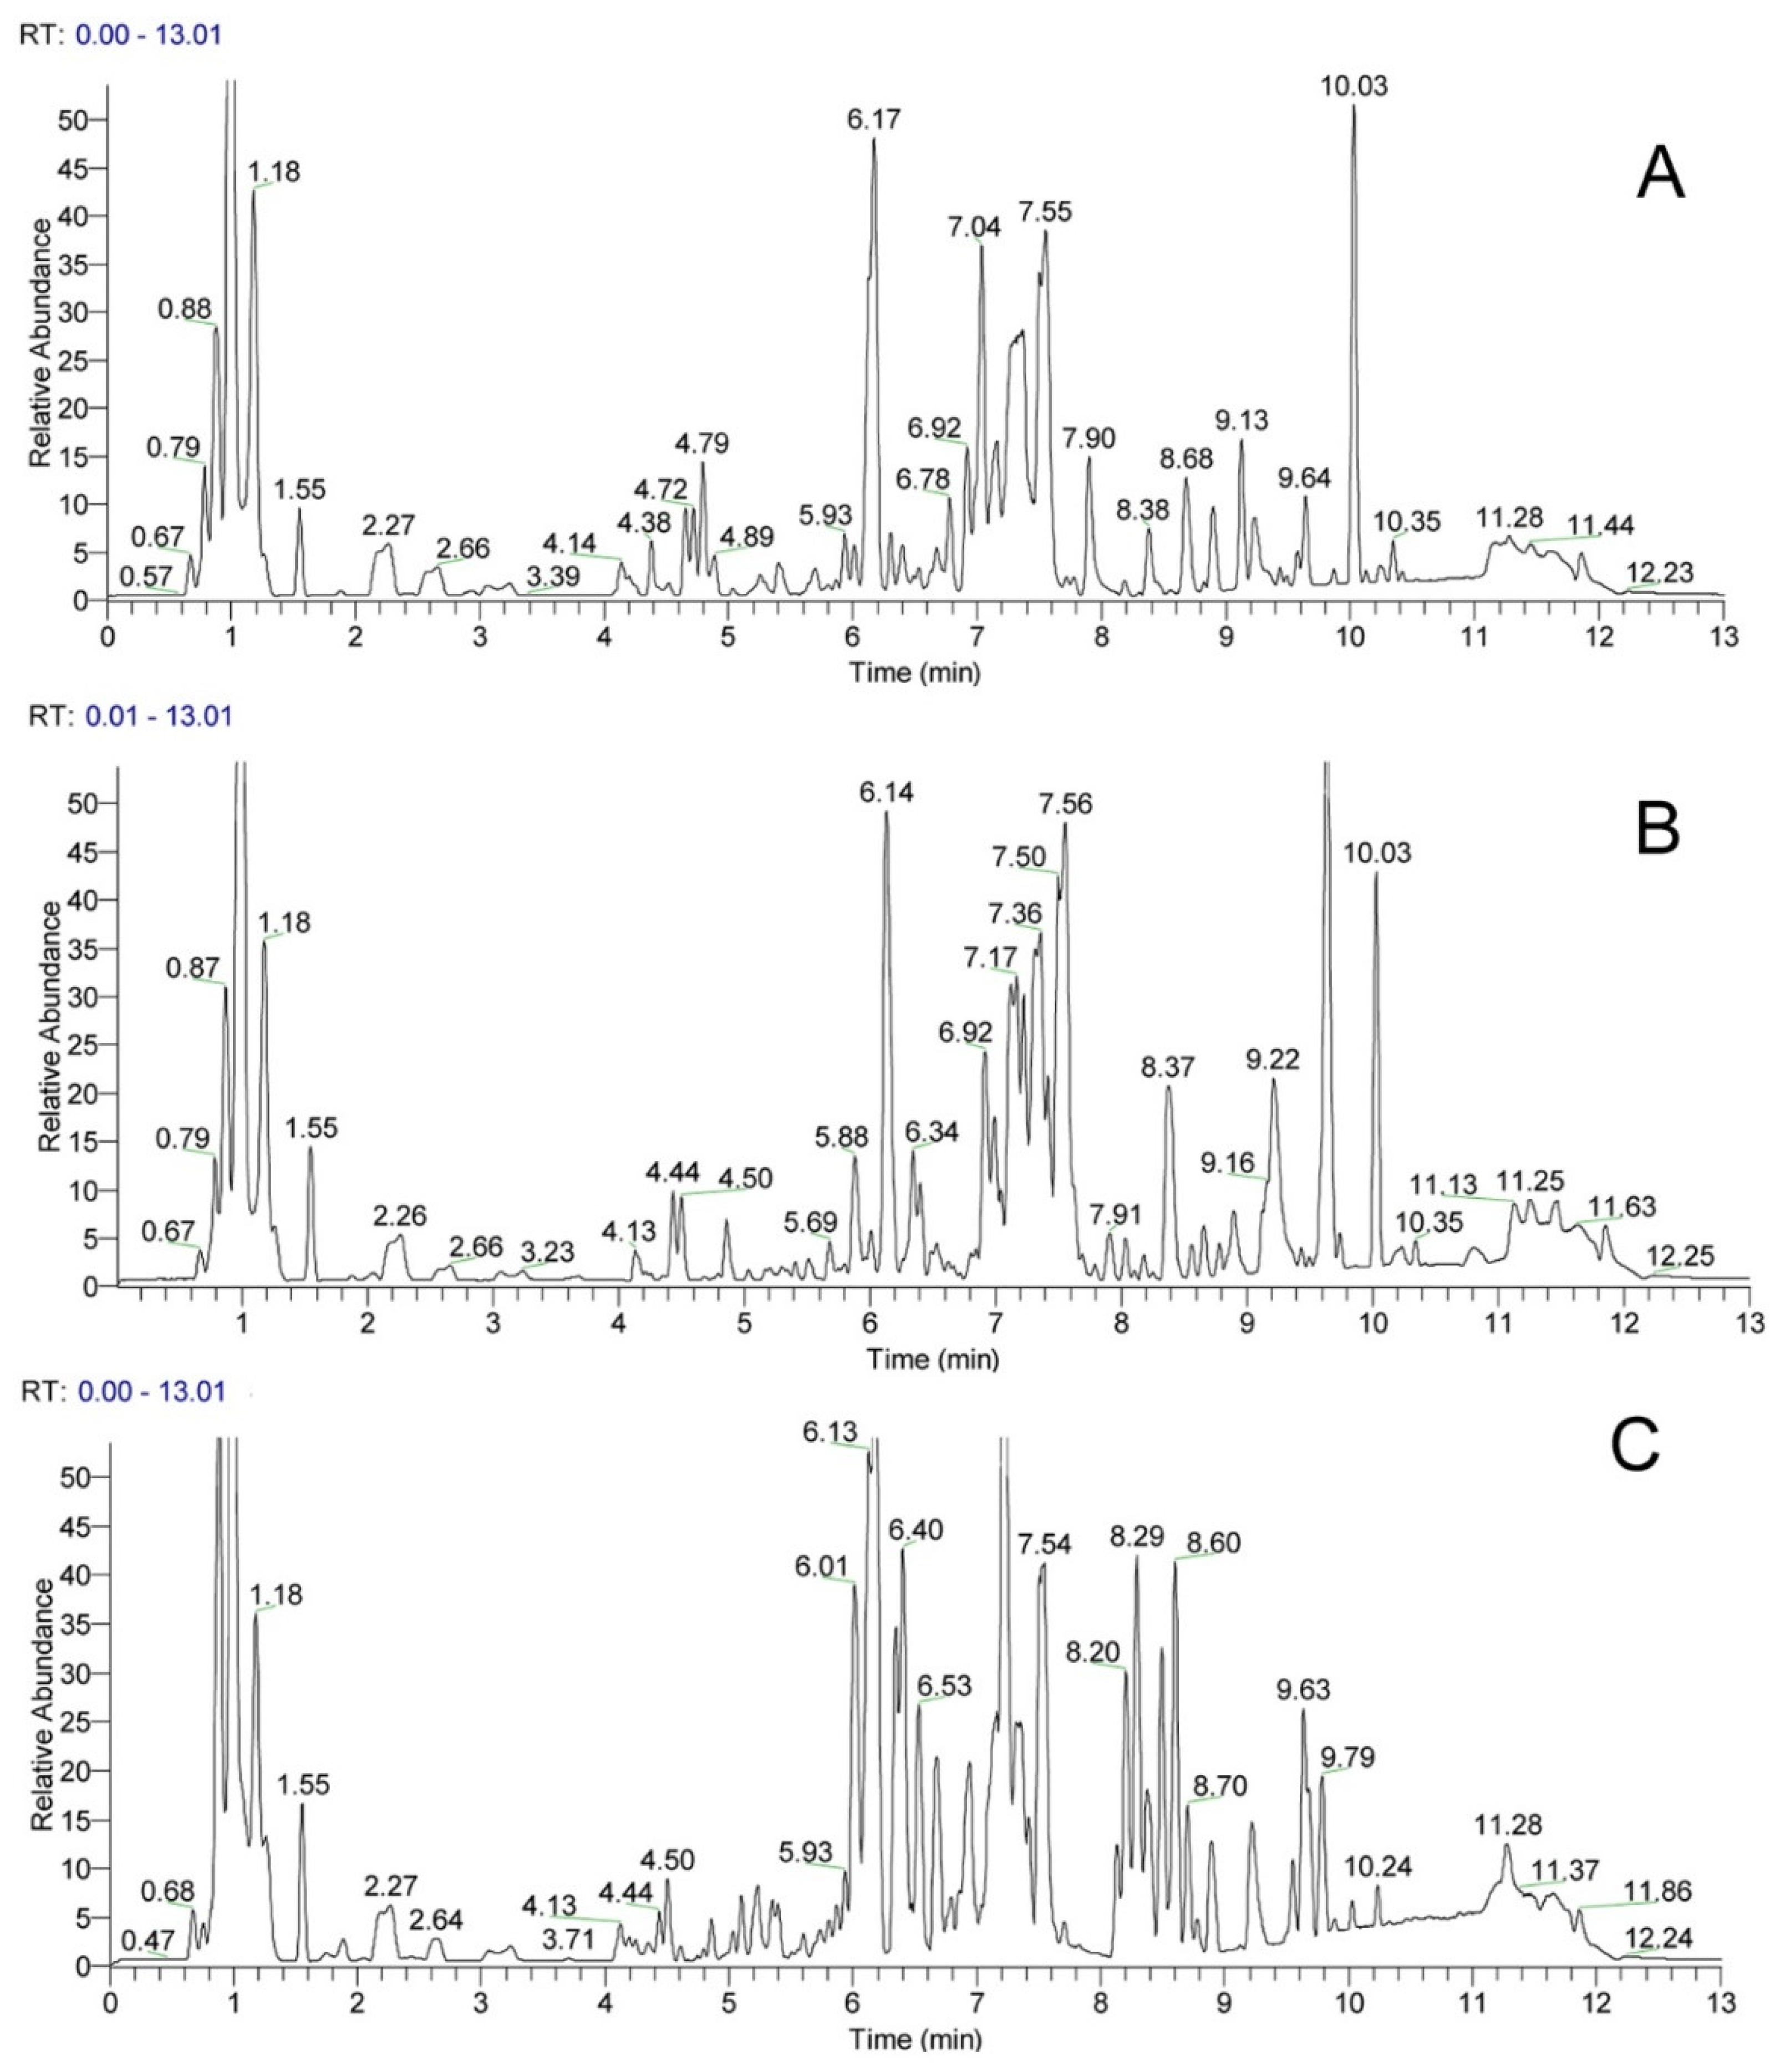
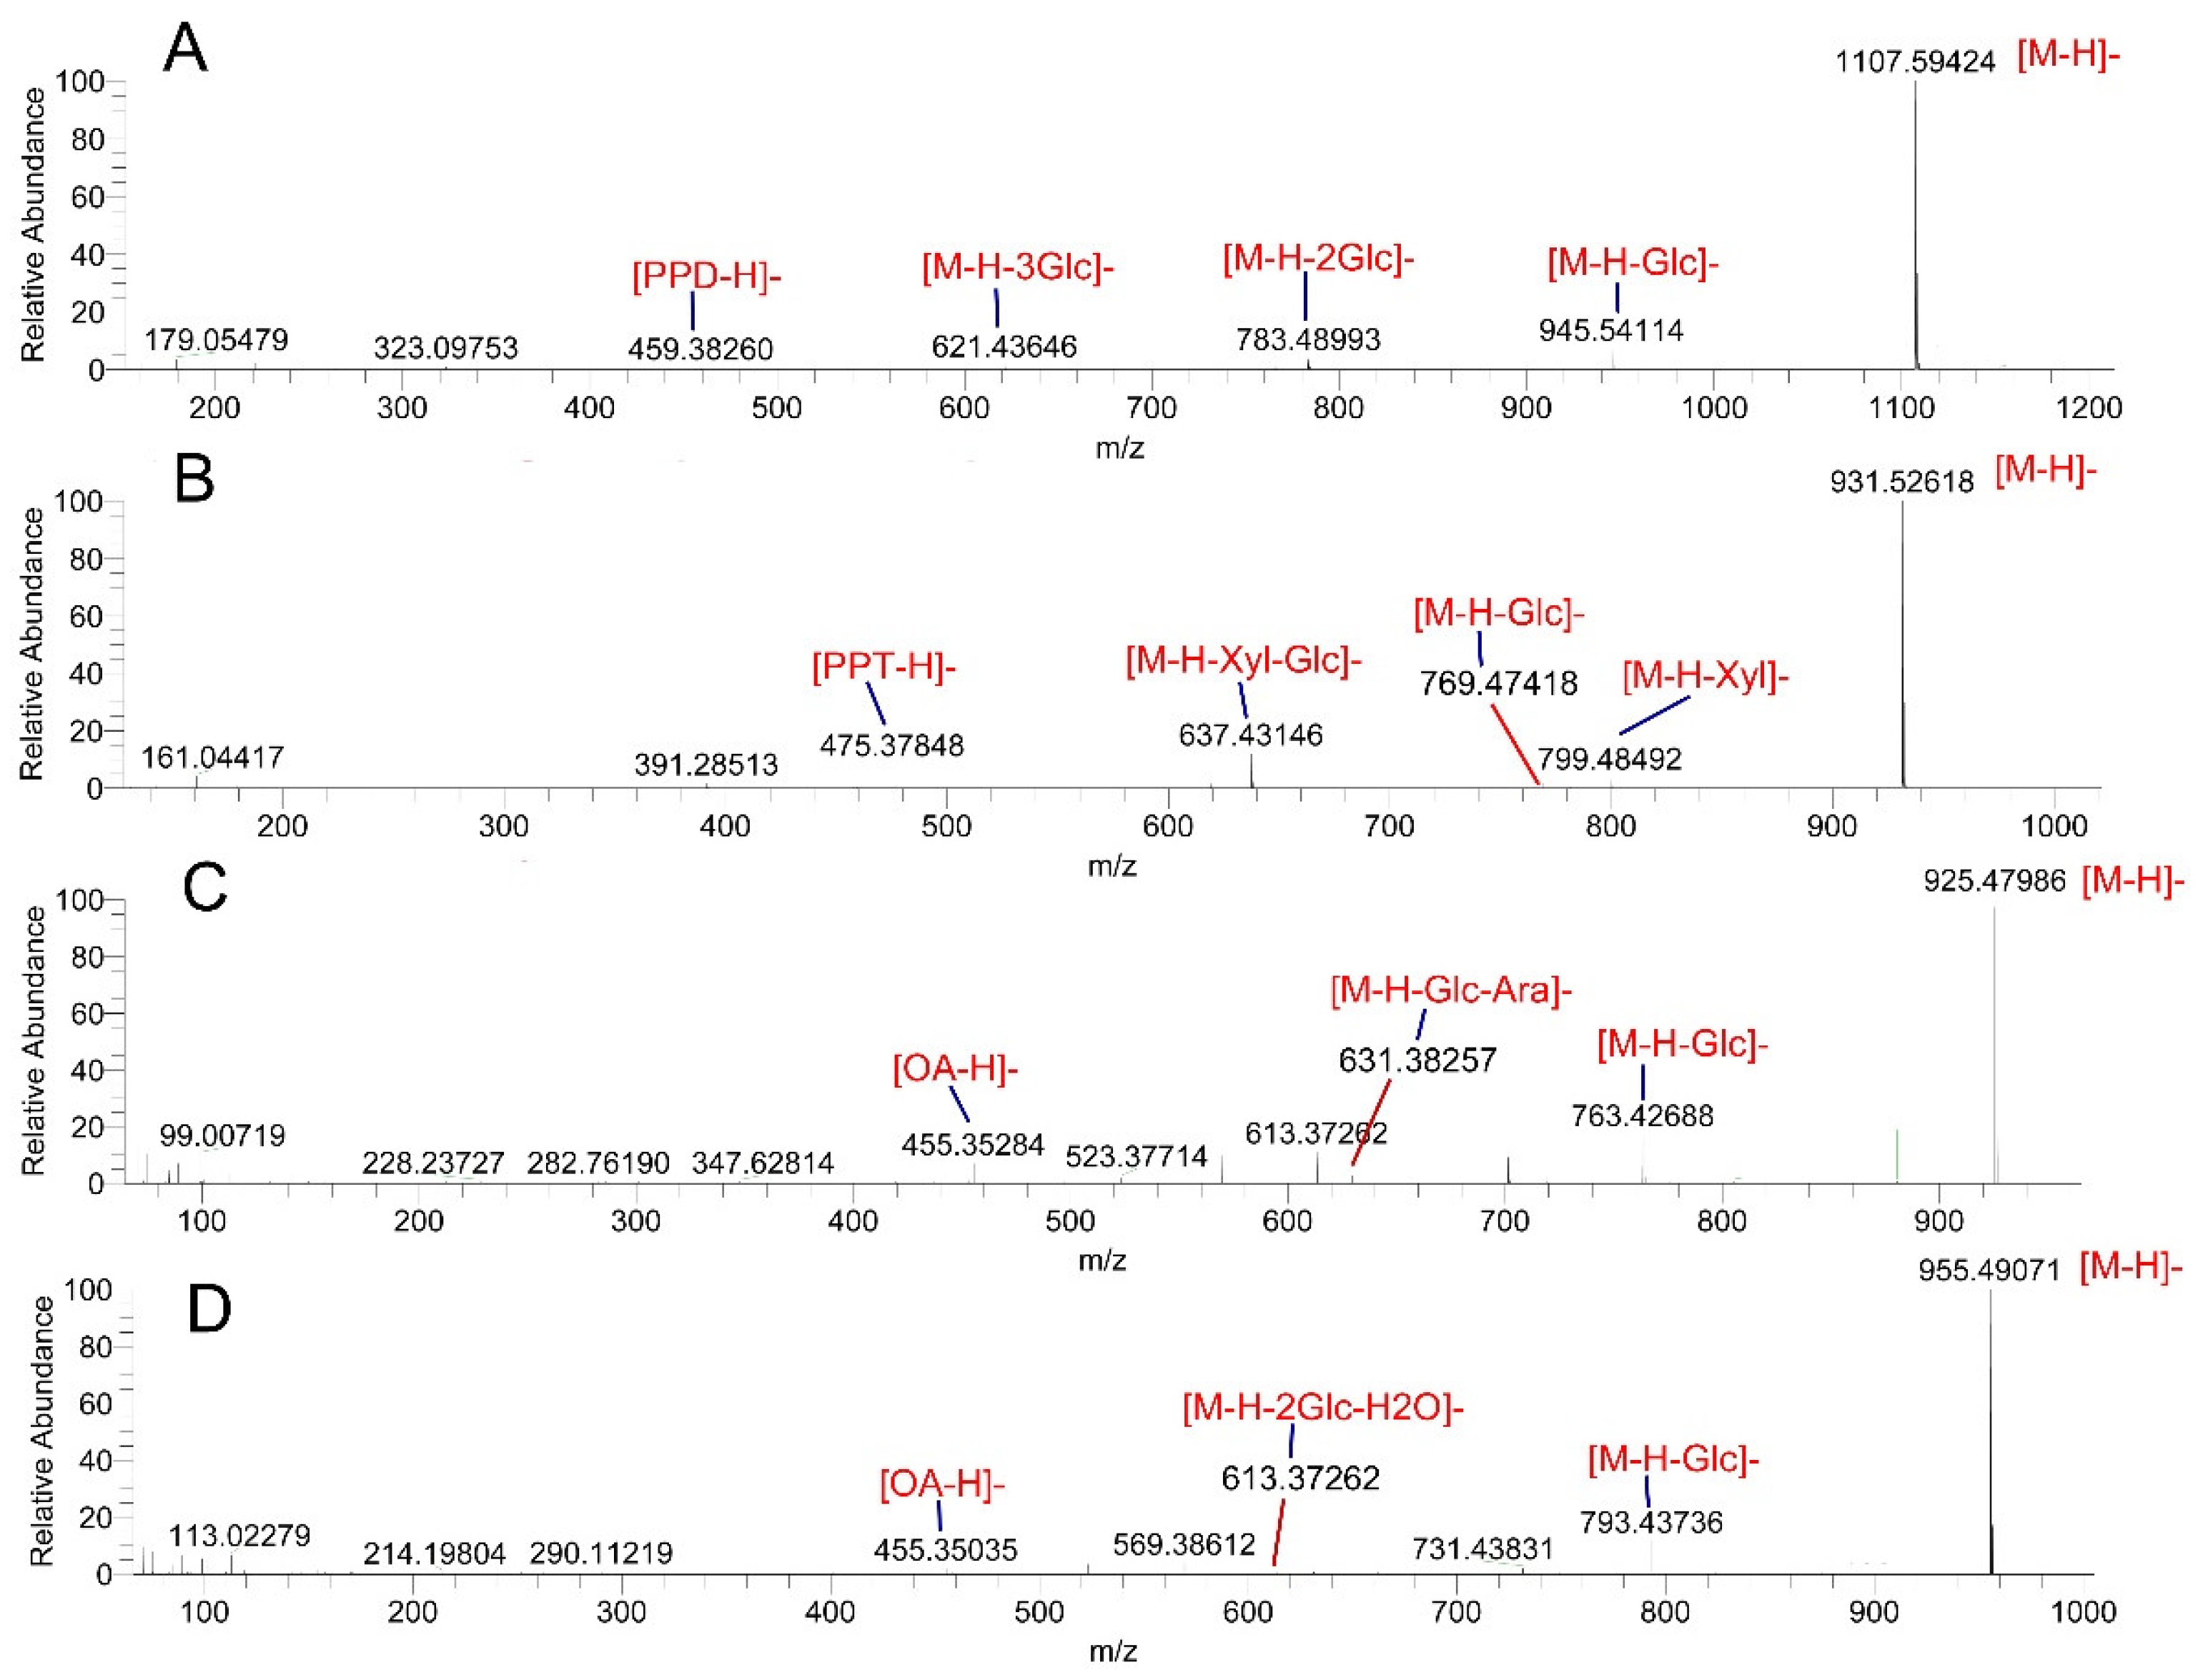
3.1. Identity Assignment and Confirmation of the Components in PJ, PM, and PZ
3.2. Validation of the Quantitative Analytical Method
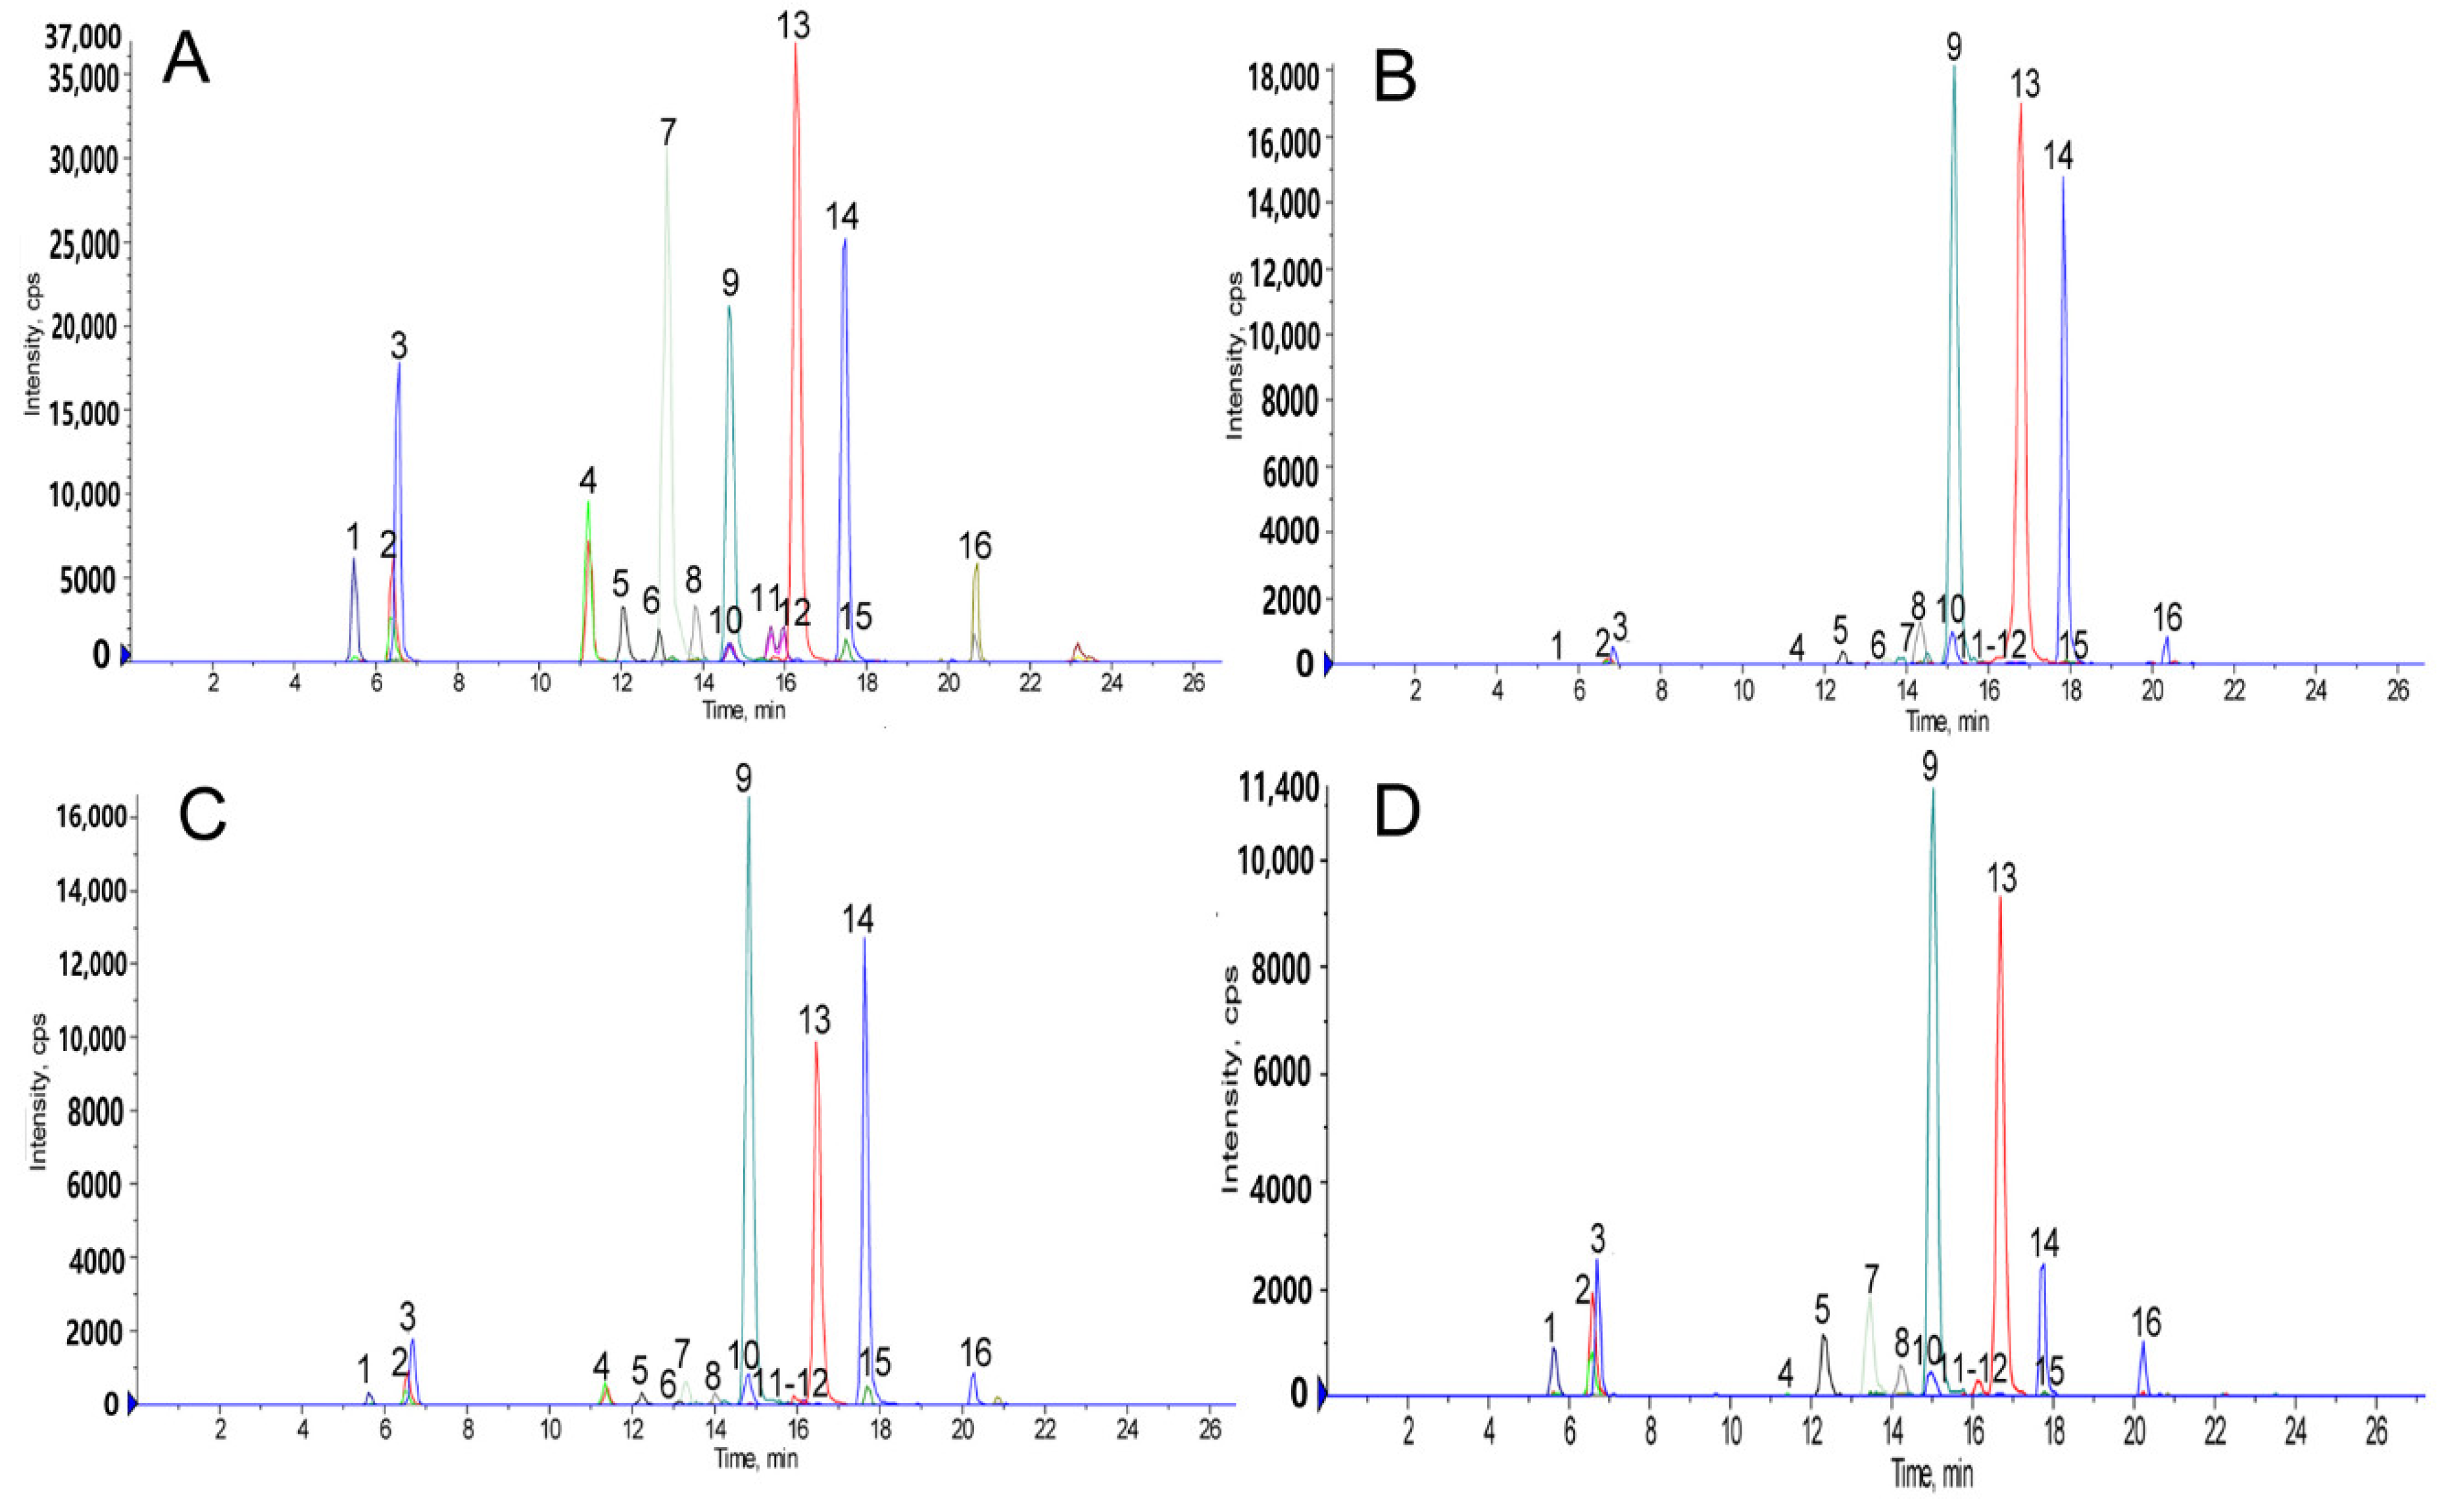
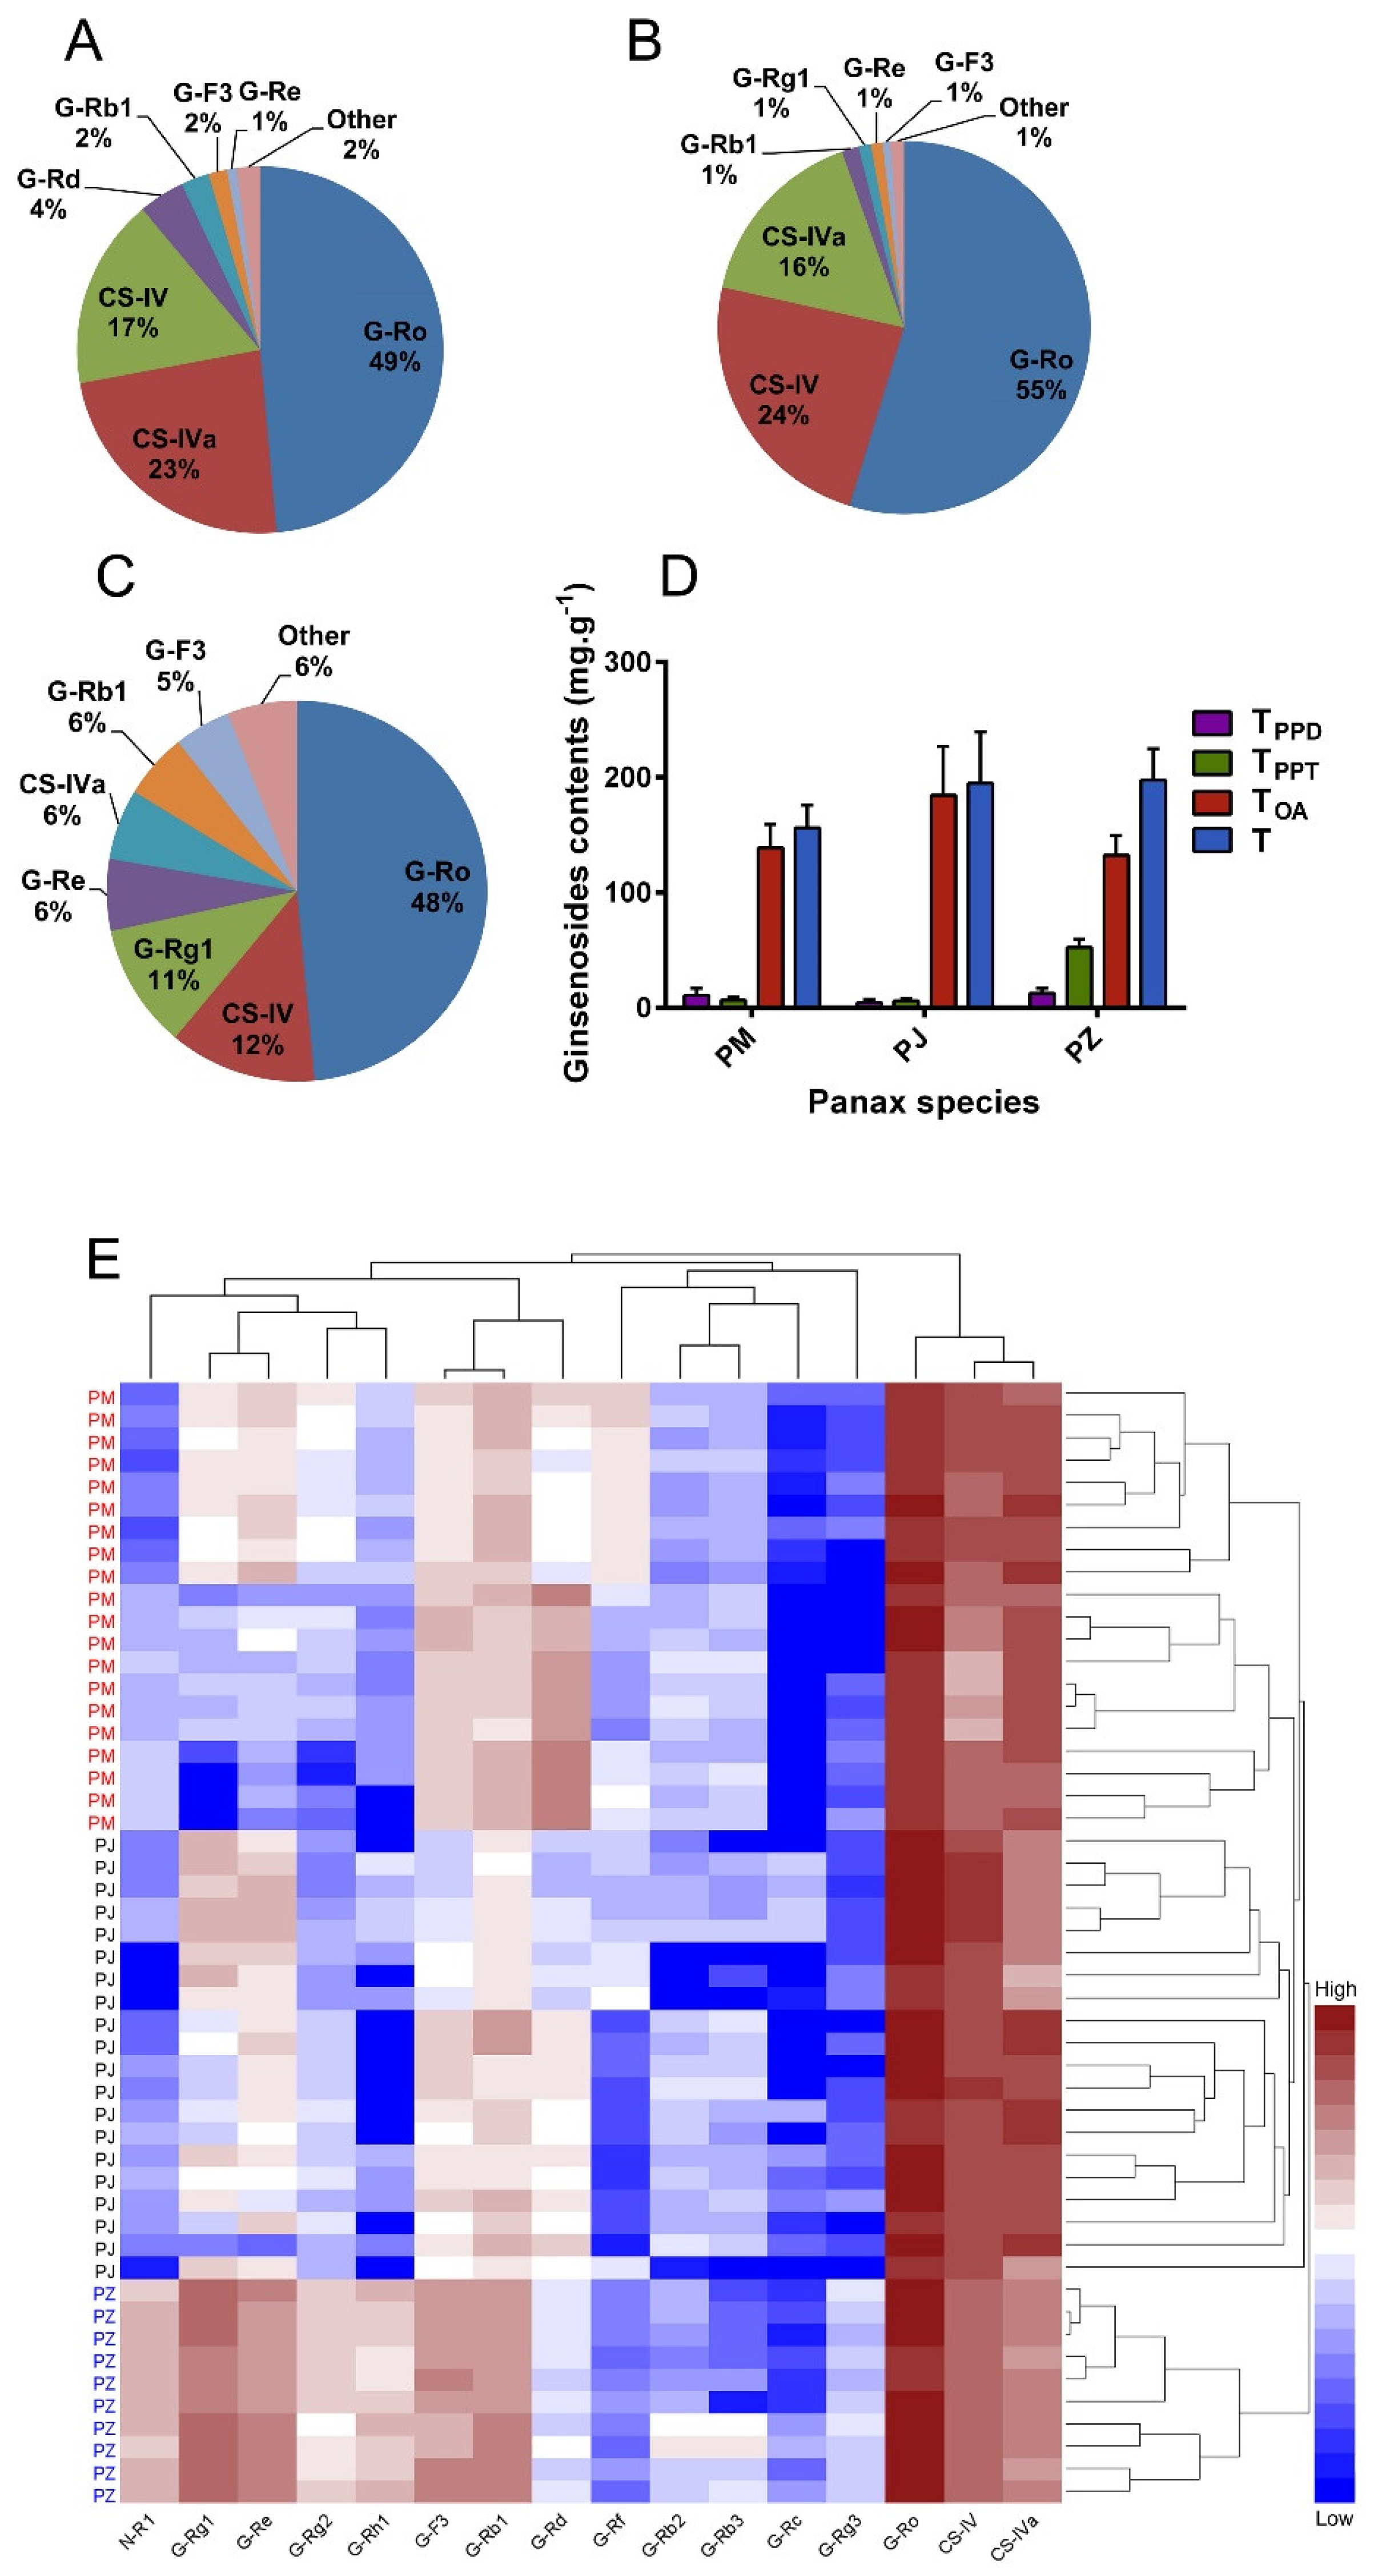
3.3. Determination of the 16 Ginsenosides Using HPLC-ESI-MS/MS
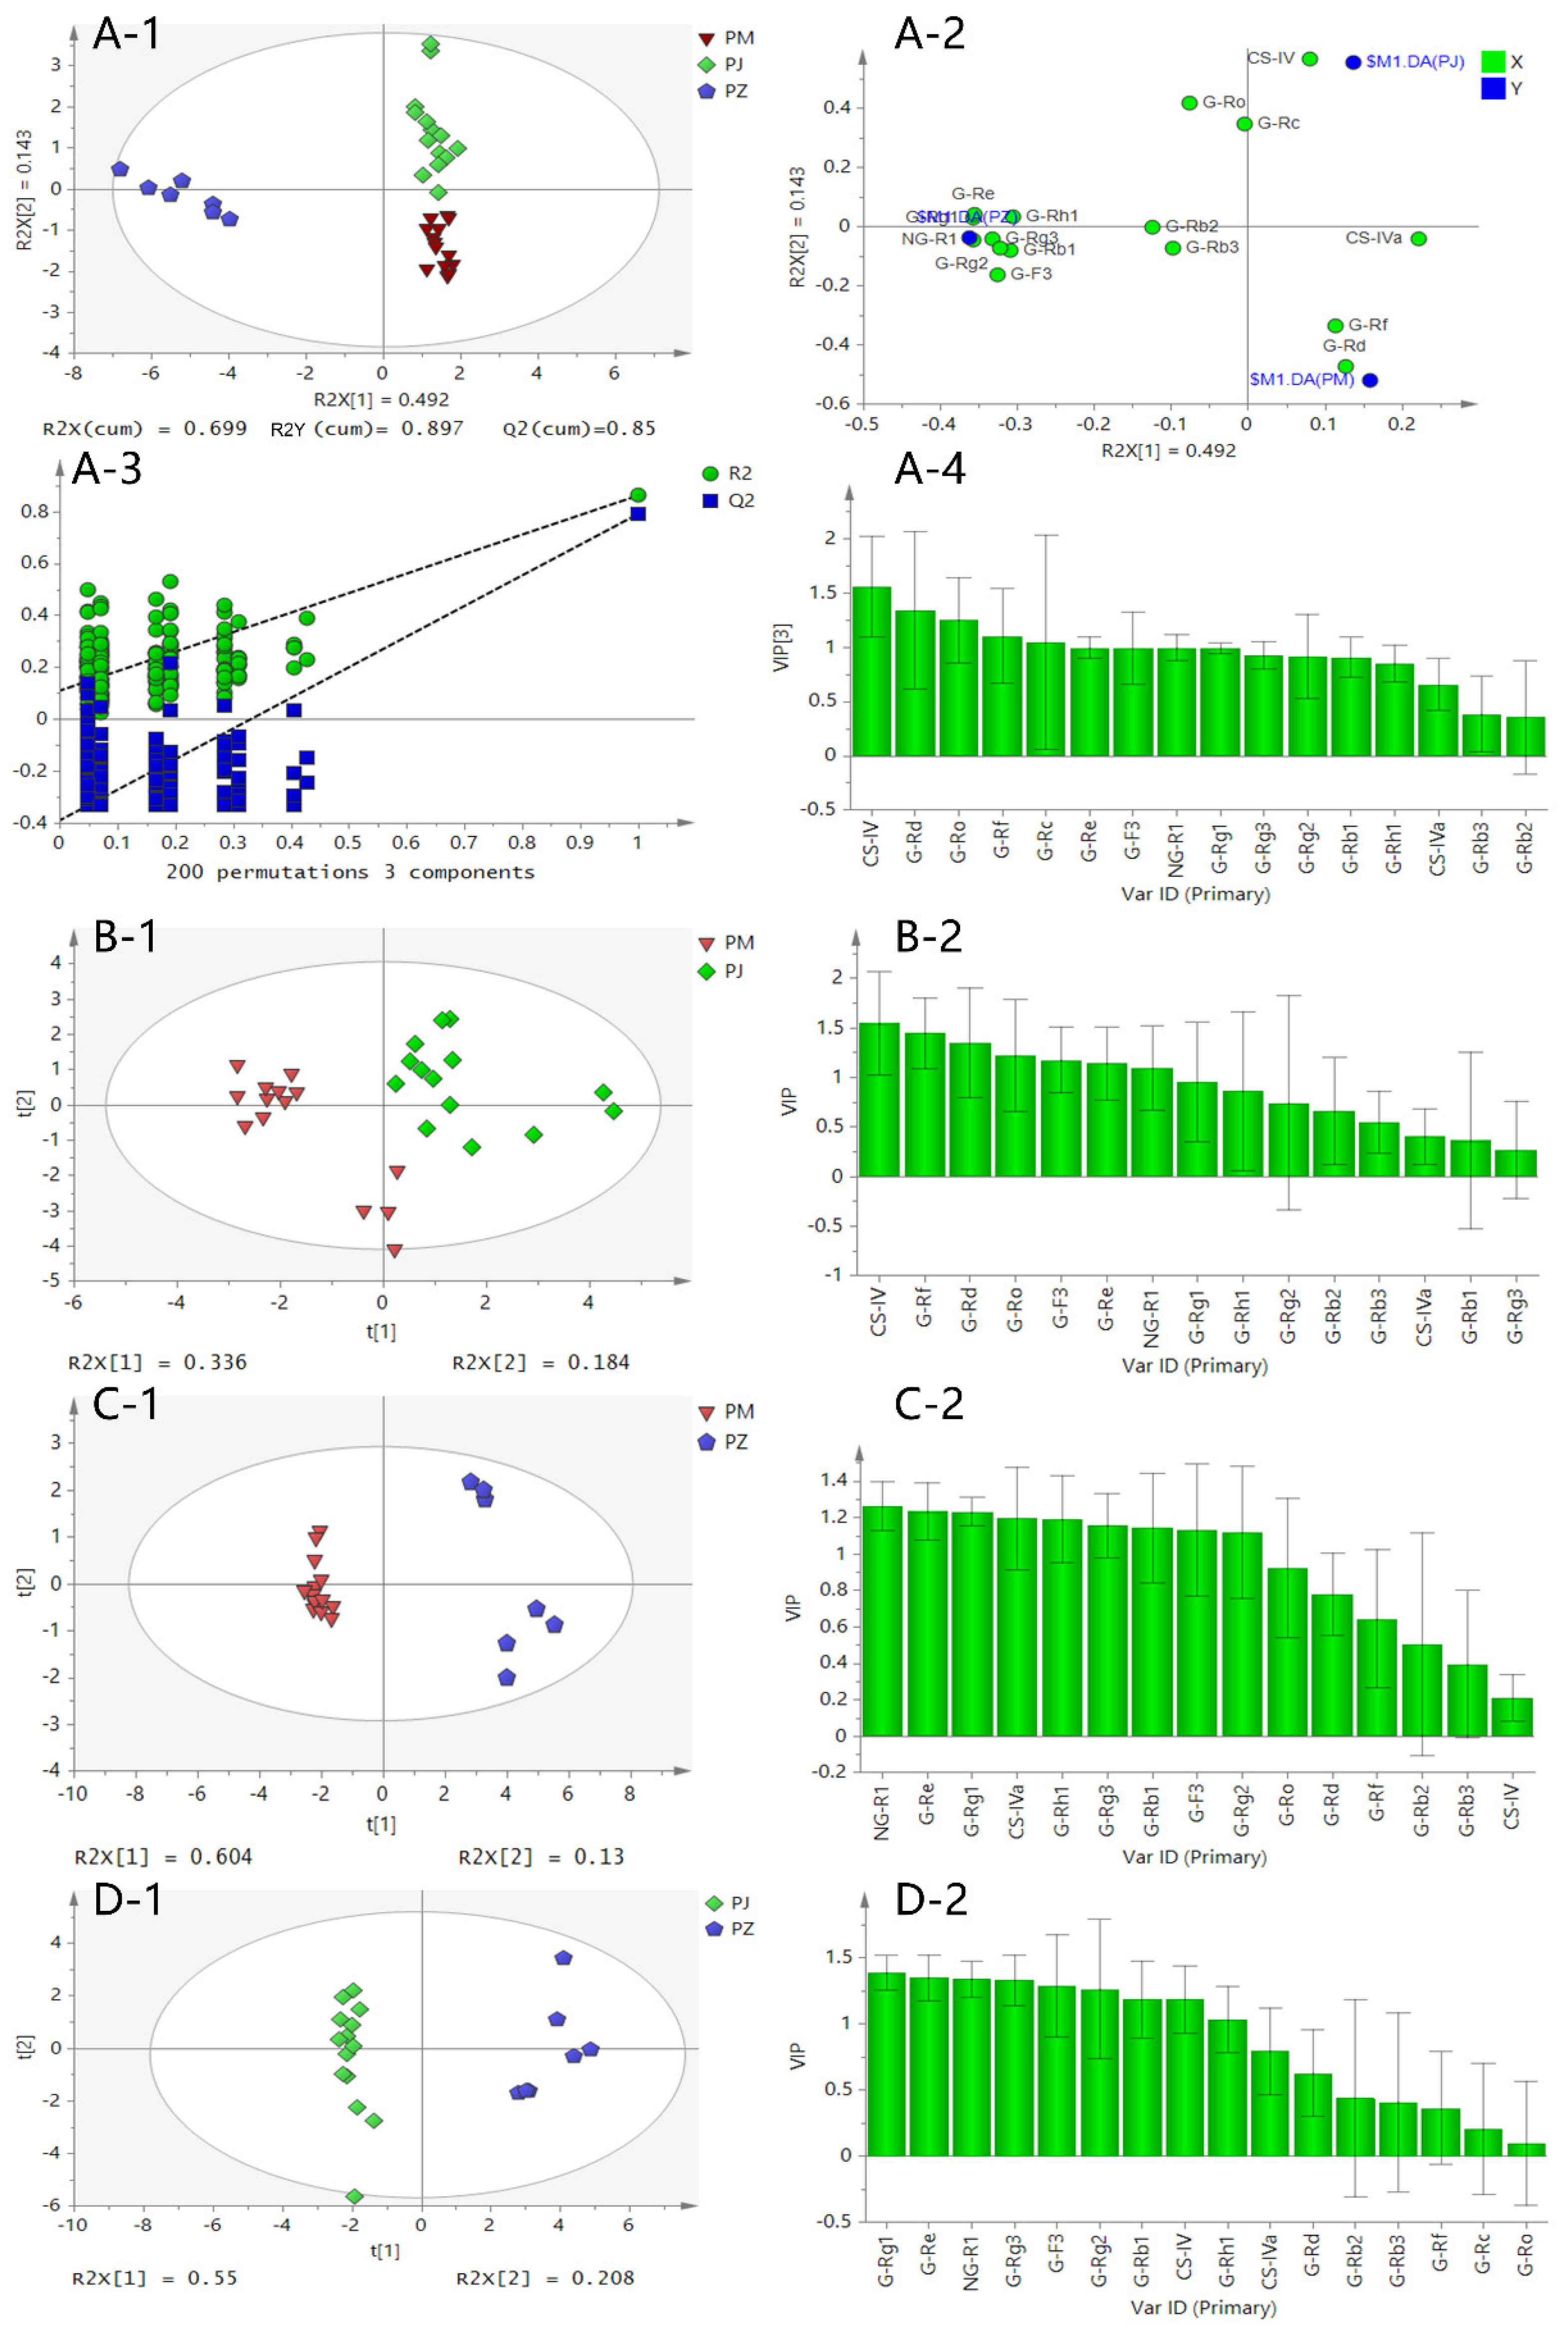
3.4. Discrimination of PJ, PM, and PZ by a Multivariate Statistical Analysis
Author Contributions
Funding
Conflicts of Interest
References
- Qi, L.W.; Wang, C.Z.; Yuan, C.S. Isolation and analysis of ginseng: advances and challenges. Nat. Prod. Rep. 2011, 28, 467–495. [Google Scholar] [CrossRef] [PubMed]
- Baeg, I.H.; So, S.H. The world ginseng market and the ginseng (Korea). J. Ginseng Res. 2013, 37, 1–7. [Google Scholar] [CrossRef] [PubMed]
- Xu, W.; Choi, H.K.; Huang, L.J.M. State of Panax ginseng Research: A Global Analysis. Molecules 2017, 22, 1518. [Google Scholar] [CrossRef] [PubMed]
- Kim, Y.S.; Woo, J.Y.; Han, C.K.; Chang, I.M. Safety Analysis of Panax Ginseng in Randomized Clinical Trials: A Systematic Review. Medicines 2015, 2, 106–126. [Google Scholar] [CrossRef] [PubMed]
- Du, Z.; Wu, J.; Meng, X.; Li, J.; Huang, L. Predicting the Global Potential Distribution of Four Endangered Panax Species in Middle-and Low-Latitude Regions of China by the Geographic Information System for Global Medicinal Plants (GMAPGIS). Molecules 2017, 22, 1630. [Google Scholar] [CrossRef] [PubMed]
- Wang, H.-P.; Zhang, Y.-B.; Yang, X.-W.; Zhao, D.-Q.; Wang, Y.-P. Rapid characterization of ginsenosides in the roots and rhizomes of Panax ginseng by UPLC-DAD-QTOF-MS/MS and simultaneous determination of 19 ginsenosides by HPLC-ESI-MS. J. Ginseng Res. 2016, 40, 382–394. [Google Scholar] [CrossRef] [PubMed]
- Michalski, A.; Damoc, E.; Hauschild, J.-P.; Lange, O.; Wieghaus, A.; Makarov, A.; Nagaraj, N.; Cox, J.; Mann, M.; Horning, S. Mass spectrometry-based proteomics using Q Exactive, a high-performance benchtop quadrupole Orbitrap mass spectrometer. Mol. Cell Proteomics 2011, 10. [Google Scholar] [CrossRef] [PubMed]
- Wang, Q.; Jiang, P.; Ye, F.-Y.; Shi, R.; Ma, Y.-M.; Zhong, J.; Wu, J.-S.; Liu, P.; Liu, C.-H.; Jia, Y.-Q. Identification and pharmacokinetics of multiple constituents in rat plasma after oral administration of Yinchenzhufu decoction. J. Ethnopharmacol. 2014, 153, 714–724. [Google Scholar] [CrossRef] [PubMed]
- Li, Q.; Zhao, Y.; Zhu, D.; Pang, X.; Liu, Y.; Frew, R.; Chen, G. Lipidomics profiling of goat milk, soymilk and bovine milk by UPLC-Q-Exactive Orbitrap Mass Spectrometry. Food Chem. 2017, 224, 302–309. [Google Scholar] [CrossRef] [PubMed]
- Hu, M.; Müller, E.; Schymanski, E.L.; Ruttkies, C.; Schulze, T.; Brack, W.; Krauss, M. Performance of combined fragmentation and retention prediction for the identification of organic micropollutants by LC-HRMS. Anal. Bioanal. Chem. 2018, 410, 1931–1941. [Google Scholar] [CrossRef] [PubMed]
- Cicero, N.; Albergamo, A.; Salvo, A.; Bua, G.D.; Bartolomeo, G.; Mangano, V.; Rotondo, A.; Di Stefano, V.; Di Bella, G.; Dugo, G. Chemical characterization of a variety of cold-pressed gourmet oils available on the Brazilian market. Food Res. Int. 2018, 109, 517–525. [Google Scholar] [CrossRef] [PubMed]
- Sato, E.; Saigusa, D.; Mishima, E.; Uchida, T.; Miura, D.; Morikawaichinose, T.; Kisu, K.; Sekimoto, A.; Saito, R.; Oe, Y.; et al. Impact of the Oral Adsorbent AST-120 on Organ-Specific Accumulation of Uremic Toxins: LC-MS/MS and MS Imaging Techniques. Toxins 2018, 10, 19. [Google Scholar] [CrossRef] [PubMed]
- Delatour, T.; Racault, L.; Bessaire, T.; Desmarchelier, A. Screening of Veterinary Drug Residues in Food by LC-MS/MS. Background and Challenges. Food Addit. Contam. Part. A Chem. Anal. Control Expo. Risk Assess. 2018, 35, 632–645. [Google Scholar] [CrossRef] [PubMed]
- Zhang, Y.; Guo, L.; Duan, L.; Dong, X.; Zhou, P.; Liu, E.H.; Li, P. Simultaneous determination of 16 phenolic constituents in Spatholobi Caulis by high performance liquid chromatography/electrospray ionization triple quadrupole mass spectrometry. J. Pharmaceut. Biomed. 2015, 102, 110–118. [Google Scholar] [CrossRef] [PubMed]
- Shi, X.J.; Yang, W.Z.; Qiu, S.; Yao, C.L.; Shen, Y.; Pan, H.Q.; Bi, Q.R.; Yang, M.; Wu, W.Y.; Guo, D.A. An in-source multiple collision-neutral loss filtering based nontargeted metabolomics approach for the comprehensive analysis of malonyl-ginsenosides from Panax ginseng, P. quinquefolius, and P. notoginseng. Anal. Chim. Acta 2017, 952, 59–70. [Google Scholar] [CrossRef] [PubMed]
- Pace, R.; Martinelli, E.M.; Sardone, N.; Combarieu, E.D. Metabolomic evaluation of ginsenosides distribution in Panax genus (Panax ginseng and Panax quinquefolius) using multivariate statistical analysis. Fitoterapia 2015, 101, 80–91. [Google Scholar] [CrossRef] [PubMed]
- Yang, X.; Wang, R.; Zhang, S.; Zhu, W.; Tang, J.; Liu, J.; Chen, P.; Zhang, D.; Ye, W.; Zheng, Y. Polysaccharides from Panax japonicus C.A. Meyer and their antioxidant activities. Carbohydr. Polym. 2014, 101, 386–391. [Google Scholar] [CrossRef] [PubMed]
- Zhang, S.; Wang, R.; Zeng, W.; Zhu, W.; Zhang, X.; Wu, C.; Song, J.; Zheng, Y.; Chen, P. Resource investigation of traditional medicinal plant Panax japonicus (T.Nees) C.A. Mey and its varieties in China. J. Ethnopharmacol. 2015, 166, 79–85. [Google Scholar] [CrossRef] [PubMed]
- He, H.; Xu, J.; Xu, Y.; Zhang, C.; Wang, H.; He, Y.; Wang, T.; Yuan, D. Cardioprotective effects of saponins from Panax japonicus on acute myocardial ischemia against oxidative stress-triggered damage and cardiac cell death in rats. J. Ethnopharmacol. 2012, 140, 73–82. [Google Scholar] [CrossRef] [PubMed]
- Liu, Y.; Zhao, J.; Chen, Y.; Li, W.; Li, B.; Jian, Y.; Sabir, G.; Cheng, S.; Tuo, Q.; Khan, I.; et al. Polyacetylenic Oleanane-Type Triterpene Saponins from the Roots of Panax japonicus. J. Nat. Prod. 2016, 79, 3079–3085. [Google Scholar] [CrossRef] [PubMed]
- Tran, Q.L.; Than, M.M.; Tezuka, Y.; Banskota, A.H.; Kouda, K.; Watanabe, H.; Zhu, S.; Komatsu, K.; Thet, M.M.; Swe, T.; et al. Wild ginseng grows in Myanmar. Chem. Pharm. Bull. 2003, 51, 679–682. [Google Scholar] [CrossRef] [PubMed]
- Yang, L.; Yu, Q.T.; Ge, Y.Z.; Zhang, W.S.; Fan, Y.; Ma, C.W.; Liu, Q.; Qi, L.W. Distinct urine metabolome after Asian ginseng and American ginseng intervention based on GC-MS metabolomics approach. Sci. Rep. 2016, 6, 39045. [Google Scholar] [CrossRef] [PubMed]
- Shin, B.K.; Kwon, S.W.; Park, J.H. Chemical diversity of ginseng saponins from Panax ginseng. J. Ginseng Res. 2015, 39, 287–298. [Google Scholar] [CrossRef] [PubMed]
- Yang, W.-Z.; Bo, T.; Ji, S.; Qiao, X.; Guo, D.-A.; Ye, M. Rapid chemical profiling of saponins in the flower buds of Panax notoginseng by integrating MCI gel column chromatography and liquid chromatography/mass spectrometry analysis. Food Chem. 2013, 139, 762–769. [Google Scholar] [CrossRef] [PubMed]
- Chu, C.; Xu, S.; Li, X.; Yan, J.; Liu, L. Profiling the Ginsenosides of Three Ginseng Products by LC-Q-TOF/MS. J Food Sci. 2013, 78, C653–C659. [Google Scholar] [CrossRef] [PubMed]
- Zhu, S.; Zou, K.; Fushimi, H.; Cai, S.; Komatsu, K. Comparative study on triterpene saponins of Ginseng drugs. Planta Med. 2004, 70, 666–677. [Google Scholar] [CrossRef] [PubMed]
Sample Availability: Samples of the compounds are not available from the authors. |


| No. | Sample | Producing Area | Collection Time |
|---|---|---|---|
| 1 | PM-1 | Hongyuan county, Sichuan province, China | 2016 |
| 2 | PM-2 | Hongyuan county, Sichuan province, China | 2016 |
| 3 | PM-3 | Yanyuan county, Sichuan province, China | 2015 |
| 4 | PM-4 | Yanyuan county, Sichuan province, China | 2015 |
| 5 | PM-5 | Wenchuan county, Sichuan province, China | 2015 |
| 6 | PM-6 | Wenchuan county, Sichuan province, China | 2015 |
| 7 | PM-7 | Kangding county, Sichuan province, China | 2016 |
| 8 | PM-8 | Kangding county, Sichuan province, China | 2016 |
| 9 | PM-9 | Kangding county, Sichuan province, China | 2016 |
| 10 | PM-10 | Fugong county, Yunnan province, China | 2015 |
| 11 | PM-11 | Fugong county, Yunnan province, China | 2015 |
| 12 | PM-12 | Ludian county, Yunnan province, China | 2015 |
| 13 | PM-13 | Ludian county, Yunnan province, China | 2015 |
| 14 | PM-14 | Ludian county, Yunnan province, China | 2015 |
| 15 | PM-15 | Nyingchi Prefecture, Tibet area, China | 2015 |
| 16 | PM-16 | Nyingchi Prefecture, Tibet area, China | 2015 |
| 17 | PM-17 | Nyingchi Prefecture, Tibet area, China | 2015 |
| 18 | PM-18 | Nyingchi Prefecture, Tibet area, China | 2015 |
| 19 | PM-19 | Bomi county, Tibet area, China | 2015 |
| 20 | PM-20 | Bomi county, Tibet area, China | 2015 |
| 21 | PJ-1 | En’shi city, Hubei province, China | 2016 |
| 22 | PJ-2 | En’shi city, Hubei province, China | 2016 |
| 23 | PJ-3 | En’shi city, Hubei province, China | 2016 |
| 24 | PJ-4 | Xuan’en county, Hubei province, China | 2016 |
| 25 | PJ-5 | Xuan’en county, Hubei province, China | 2016 |
| 26 | PJ-6 | Leshan city, Sichuan province, China | 2015 |
| 27 | PJ-7 | Leshan city, Sichuan province, China | 2015 |
| 28 | PJ-8 | Meishan city, Sichuan province, China | 2015 |
| 29 | PJ-9 | Meishan city, Sichuan province, China | 2015 |
| 30 | PJ-10 | A’ba county, Sichuan province, China | 2015 |
| 31 | PJ-11 | A’ba county, Sichuan province, China | 2015 |
| 32 | PJ-12 | Ya’an City, Sichuan province, China | 2015 |
| 33 | PJ-13 | Taibai county, Shaanxi province, China | 2015 |
| 34 | PJ-14 | Taibai county, Shaanxi province, China | 2015 |
| 35 | PJ-15 | Taibai county, Shaanxi province, China | 2015 |
| 36 | PJ-16 | Taibai county, Shaanxi province, China | 2015 |
| 37 | PJ-17 | Puer city, Yunnan province, China | 2015 |
| 38 | PJ-18 | Puer city, Yunnan province, China | 2015 |
| 39 | PJ-19 | Jinghong city, Yunnan province, China | 2015 |
| 40 | PJ-20 | Wenshan county, Yunnan province, China | 2015 |
| 41 | PZ-1 | Puer city, Yunnan province, China | 2015 |
| 42 | PZ-2 | Puer city, Yunnan province, China | 2015 |
| 43 | PZ-3 | Puer city, Yunnan province, China | 2015 |
| 44 | PZ-4 | Puer city, Yunnan province, China | 2015 |
| 45 | PZ-5 | Puer city, Yunnan province, China | 2015 |
| 46 | PZ-6 | Puer city, Yunnan province, China | 2015 |
| 47 | PZ-7 | Myanmar, Taung-gyi | 2015 |
| 48 | PZ-8 | Myanmar, Taung-gyi | 2015 |
| 49 | PZ-9 | Myanmar, Taung-gyi | 2015 |
| 50 | PZ-10 | Myanmar, Taung-gyi | 2015 |
| No. | Analyte | TR (min) | Precursor Ion (m/z) | Product Ion (m/z) | DP/V | CE/V |
|---|---|---|---|---|---|---|
| 1 | NG-R1 | 5.48 | 931.2 | 475.1 | 125 | 70 |
| 2 | G-Rg1 | 6.42 | 799.2 | 637.1 | 100 | 55 |
| 3 | G-Re | 6.56 | 945.3 | 475.2 | 105 | 62 |
| 4 | G-Rf | 11.21 | 799.2 | 475.1 | 100 | 50 |
| 5 | G-F3 | 12.09 | 769.2 | 475.1 | 105 | 55 |
| 6 | G-Rg2 | 13.14 | 783.2 | 475.1 | 105 | 58 |
| 7 | G-Rh1 | 13.27 | 637.2 | 475.1 | 75 | 45 |
| 8 | G-Rb1 | 13.86 | 1107.2 | 945.1 | 115 | 65 |
| 9 | G-Ro | 14.68 | 955.1 | 793.0 | 110 | 60 |
| 10 | G-Rc | 14.72 | 1077.2 | 783.2 | 105 | 55 |
| 11 | G-Rb2 | 15.70 | 1077.2 | 945.2 | 105 | 50 |
| 12 | G-Rb3 | 16.01 | 1077.2 | 783.1 | 100 | 55 |
| 13 | CS-IV | 16.31 | 925.1 | 569.1 | 50 | 45 |
| 14 | CS-IVa | 17.48 | 793.2 | 569.2 | 35 | 45 |
| 15 | G-Rd | 17.51 | 945.2 | 621.2 | 105 | 60 |
| 16 | G-Rg3 | 20.68 | 783.2 | 621.2 | 100 | 60 |
| No. | TR/min | Formula | [M − H]− | [M + HCOO]− | MS/MS | Identification | Sample | |
|---|---|---|---|---|---|---|---|---|
| Calculated | Measured | |||||||
| 1 | 5.07 | C53H88O23 | 1091.56327 | 1091.52698 | 1023, 1007, 965, 783 | Yesanchinoside G | PJ | |
| 2 | 5.31 | C48H82O19 | 961.53666 | 961.53546 | 1007.54340 | 799, 781, 637, 619 | G-Re1/G-Re2/G-Re3/NG-N/NG-M isomer | PJ, PZ |
| 3 | 5.36 | C53H90O22 | 1077.58400 | 1077.54590 | 945, 783, 637, 475, 391, 191 | Floral G-M/Floral G-N | PJ, PM, PZ | |
| 4 | 5.44 | C53H88O23 | 1091.56327 | 1091.52454 | 929, 767, 473 | Yesanchinoside G isomer | PJ, PM, PZ | |
| 5 | 5.61 | C47H80O19 | 947.52101 | 947.52203 | 993.52789 | 815, 653, 579, 491, 391 | Vina G-R6/Yesanchinoside C | PZ |
| 6 | 5.64 | C48H82O19 | 961.53666 | 961.53775 | 1007.54224 | 799, 781, 637, 475, 391 | 20-glc-G-Rf | PJ, PM |
| 7 | 5.74 | C48H82O19 | 961.53666 | 961.53503 | 1007.54285 | 943, 931, 799, 637 | G-Re1/G-Re2/G-Re3/NG-N/NG-M isomer | PJ, PM, PZ |
| 8 | 5.75 | C54H92O23 | 1107.59457 | 1107.59314 | 1153.60094 | 945, 783, 637, 475, 391 | Yesanchinoside E | PM, PZ |
| 9 | 5.92 | C41H70O14 | 785.46818 | 785.46246 | 831.47443 | 739, 653, 491, 391 | Majonoside R2 isomer | PJ |
| 10 | 5.93 | C48H82O19 | 961.53666 | 961.53602 | 1007.54651 | 799, 781, 637, 475, 391 | 20-glc-G-Rf isomer | PJ |
| 11 | 5.94 | C53H90O22 | 1077.58400 | 1077.58337 | 1123.58960 | 945, 783, 637, 475, 391, 191 | FloralG-M/Floral G-N | PM |
| 12 | 5.99 | C41H70O14 | 785.46818 | 785.46429 | 831.47418 | 739, 653, 491, 391 | Majonoside R2 isomer | PJ, PZ |
| 13 * | 6.01 | C47H80O18 | 931.52609 | 931.52631 | 977.53192 | 799, 769, 637, 475 | NG-R1 | PJ, PM, PZ |
| 14 | 6.09 | C42H72O14 | 799.48383 | 799.48421 | 667, 653, 491, 455, 391 | Pseudo G-F11 isomer | PJ, PM | |
| 15 | 6.10 | C51H82O18 | 981.54174 | 981.54567 | 793, 763, 619, 581, 455, 371 | Pseudo G-RT1 butyl ester | PM | |
| 16 | 6.11 | C56H94O24 | 1149.60513 | 1149.60181 | 1195.61084 | 1149, 1107, 961, 783, 637, 475, 391 | Acetyl Yesanchinoside E | PM |
| 17 * | 6.13 | C48H82O18 | 945.54174 | 945.53772 | 991.54773 | 783, 637, 619, 475, 391, 205 | G-Re | PJ, PM, PZ |
| 18 * | 6.18 | C42H72O14 | 799.48383 | 799.48541 | 845.48975 | 637, 475, 391 | G-Rg1 | PJ, PM, PZ |
| 19 | 6.27 | C45H74O17 | 885.48423 | 885.48517 | 845, 829, 781, 637, 619, 475, 391 | Malonyl-G-Rg1 | PJ, PZ | |
| 20 | 6.29 | C58H98O26 | 1209.62626 | 1209.59033 | 1165, 781, 619, 459 | NG-Fc | PM | |
| 21 | 6.30 | C47H80O19 | 947.52101 | 947.52191 | 815, 653, 579, 491, 391 | Vina G-R6/Yesanchinoside C | PJ, PM, PZ | |
| 22 | 6.32 | C51H84O21 | 1031.54214 | 1031.54419 | 987, 945, 637, 475, 391 | Malonyl G-Re | PJ, PZ | |
| 23 | 6.34 | C41H70O14 | 785.46818 | 785.46503 | 831.47430 | 739, 653, 491, 391 | Majonoside R2 isomer | PJ, PM, PZ |
| 24 * | 6.40 | C42H72O14 | 799.48383 | 799.48566 | 799.47870 | 754, 653, 491,473, 455 | Pseudo G-F11 | PJ, PM |
| 25 | 6.46 | C48H82O19 | 961.53666 | 961.53662 | 1007.54055 | 799, 781, 637, 499 | G-Re1/G-Re2/G-Re3/NG-N/NG-M isomer | PJ, PM, PZ |
| 26 | 6.53 | C50H84O19 | 987.55231 | 987.55084 | 1033.55835 | 945, 791, 763, 637,475, 391, 275 | Acetyl G-Re | PM, PJ, PZ |
| 27 | 6.54 | C44H74O15 | 841.49440 | 841.49204 | 887.50067 | 841, 795, 637, 475, 391 | Acetyl-Rg1 | PJ, PZ |
| 28 | 6.55 | C42H72O15 | 815.47875 | 815.47961 | 861.48315 | 637 | Floralquinquenoside B | PJ, PM, PZ |
| 29 | 6.60 | C48H82O19 | 961.53666 | 961.53543 | 1007.54660 | 943, 799, 781, 457 | G-Re1/G-Re2/G-Re3/NG-N/NG-M isomer | PJ |
| 30 | 6.67 | C59H100O27 | 1239.63682 | 1239.63452 | 1285.64172 | 1107, 1059, 945, 783, 621, 459 | NG-R4/NG-Fa | PJ, PM, PZ |
| 31 | 6.68 | C56H92O25 | 1163.58439 | 1163.54858 | 1209.59326 | 1117, 955, 793, 621, 537, 459, 351 | Malonyl G-Rc | PM |
| 32 | 6.69 | C48H80O19 | 959.52101 | 959.52148 | 1005.54272 | 797, 779, 635, 617, 473, 455 | NG-G | PM, PZ |
| 33 | 6.76 | C42H72O15 | 815.47875 | 815.47610 | 861.48440 | 653, 491, 415 | Floralquinquenoside D | PJ, PM |
| 34 | 6.79 | C43H72O15 | 827.47875 | 827.47998 | 695, 491, 455 | Vina G-R2 | PZ | |
| 35 | 6.82 | C58H98O26 | 1209.62626 | 1209.62500 | 1255.63147 | 1077, 1047, 945, 783, 621, 459 | G-Ra2 | PJ, PM, PZ |
| 36 | 6.84 | C63H106O30 | 1341.66852 | 1341.66748 | 1387.67493 | 1209, 1077, 945, 783, 621, 459 | NG-Q | PJ |
| 37 | 6.86 | C44H74O15 | 841.49440 | 841.49880 | 887.50098 | 799, 637, 475, 391 | Acetyl-Rf | PJ, PM, PZ |
| 38 | 6.89 | C59H100O27 | 1239.63682 | 1239.63538 | 1285.64185 | 1077, 1059, 945, 783, 765, 459 | NG-R4/NG-Fa | PJ, PM, PZ |
| 39 * | 6.92 | C54H92O23 | 1107.59457 | 1107.59302 | 1153.59973 | 945, 783, 621, 459 | G-Rb1 | PJ, PM, PZ |
| 40 | 6.95 | C57H94O26 | 1193.59496 | 1193.59509 | 1149, 1107, 945, 783, 621, 459, 375 | Malonyl G-Rb1 | PJ, PM, PZ | |
| 41 * | 6.96 | C42H72O14 | 799.48383 | 799.48175 | 845.48956 | 637, 475, 391 | G-Rf | PJ, PM, PZ |
| 42 | 6.97 | C58H98O26 | 1209.62626 | 1209.62488 | 1255.63074 | 1077, 1047, 915, 945, 783, 621, 459 | G-Ra1 | PJ, PZ |
| 43 | 6.99 | C41H70O14 | 785.46818 | 785.46852 | 831.47382 | 653, 491 | Majonoside R2 | PJ, PM, PZ |
| 44 | 7.00 | C53H84O23 | 1087.53196 | 1087.53149 | 955, 925, 793, 569, 497, 455, 283 | Stipuleanoside R2 | PJ, PM, PZ | |
| 45 | 7.03 | C61H100O29 | 1295.62665 | 1295.62537 | 1251, 1209, 1077, 945, 783, 621, 459 | Malonyl G-Ra2 | PJ, PZ | |
| 46 | 7.04 | C42H72O14 | 799.48383 | 799.48041 | 845.48962 | 637, 619, 499, 457 | Majoroside F2/F3/F4 | PJ, PM |
| 47 | 7.04 | C48H76O19 | 955.48971 | 955.49017 | 1001.49530 | 793, 631, 455, 349 | G-Ro isomer | PJ, PM, PZ |
| 48 * | 7.05 | C53H90O22 | 1077.58400 | 1077.58130 | 1123.58936 | 945, 783, 621, 459 | G-Rc | PM, PZ |
| 49 | 7.06 | C53H84O23 | 1087.53196 | 1087.53235 | 1133.53625 | 925, 731, 569, 459 | Stipuleanoside R2 isomer | PZ |
| 50 | 7.07 | C56H92O25 | 1163.58439 | 1163.58459 | 1119, 1077, 945, 783, 621, 459 | Malonyl G-Rb2 | PM | |
| 51 | 7.08 | C57H94O26 | 1193.59496 | 1193.59497 | 1149, 1107, 945, 783, 621, 459, 375 | Malonyl G-Rb1 isomer | PJ, PM | |
| 52 * | 7.09 | C41H70O13 | 769.47327 | 769.47125 | 815.47961 | 637, 485, 475, 325, 311 | G-F3 | PJ, PM, PZ |
| 53 | 7.09 | C56H94O24 | 1149.60513 | 1149.60083 | 1195.60669 | 1107, 945, 783, 621, 475 | Yesanchinoside F | PJ, PM |
| 54 * | 7.15 | C53H90O22 | 1077.58400 | 1077.58179 | 1123.58923 | 945, 915, 783, 621, 459 | G-Rb2 | PJ, PZ |
| 55 * | 7.16 | C48H76O19 | 955.48971 | 955.48987 | 1001.49347 | 793, 731, 659,631, 455 | G-Ro | PJ, PM, PZ |
| 56 | 7.18 | C61H100O29 | 1295.62665 | 1295.62561 | 1107, 945, 783, 621, 459 | Malonyl G-Ra1 | PJ | |
| 57 | 7.19 | C56H92O25 | 1163.58439 | 1163.58435 | 1119, 1077, 945, 783, 621, 459, 293 | Malonyl G-Rb3 | PJ, PM | |
| 58 * | 7.21 | C42H72O13 | 783.48892 | 783.48627 | 829.49475 | 637, 619, 475, 457, 391, 205,161 | G-Rg2 | PJ, PM, PZ |
| 59 | 7.22 | C45H74O17 | 885.48423 | 885.48474 | 829, 799, 637, 475 | Malonyl-G-Rf | PM | |
| 60 * | 7.23 | C53H90O22 | 1077.58400 | 1077.58289 | 1123.58960 | 945, 915, 783, 621, 459 | G-Rb3 | PZ |
| 61 * | 7.32 | C47H74O18 | 925.47914 | 925.47894 | 971.48279 | 873, 793, 612, 569, 455 | CS-IV | PJ, PZ |
| 62 * | 7.35 | C36H62O9 | 637.43101 | 637.42828 | 683.43695 | 457, 391, 283, 255 | G-Rh1 | PJ, PM, PZ |
| 63 | 7.37 | C48H82O19 | 961.53666 | 961.53674 | 1007.54553 | 815, 781, 499 | G-Re1/G-Re2/G-Re3/NG-N/NG-M isomer | PM |
| 64 * | 7.43 | C48H82O18 | 945.54174 | 945.53973 | 991.54706 | 783, 621, 459 | G-Rd | PJ, PM, PZ |
| 65 | 7.44 | C51H84O21 | 1031.54214 | 1031.54248 | 987, 945, 783, 621, 459, 375 | Malonyl G-Rd | PJ, PM, PZ | |
| 66 | 7.46 | C50H84O19 | 987.55231 | 987.55151 | 1033.55066 | 945, 783, 621, 459 | Acetyl G-Rd | PM, PJ |
| 67 * | 7.53 | C42H66O14 | 793.43688 | 793.43701 | 839.44269 | 631, 569, 509, 497, 455 | CS-IVa | PJ, PM, PZ |
| 68 | 7.60 | C51H84O21 | 1031.54214 | 1031.54224 | 987, 945, 783, 621, 459, 375 | Malonyl G-Rd isomer | PM, PJ | |
| 69 * | 7.61 | C36H62O9 | 637.43101 | 637.43042 | 683.43707 | 475, 391 | G-F1 | PJ, PM, PZ |
| 70 | 7.63 | C48H82O18 | 945.54174 | 945.53990 | 991.54767 | 899, 783, 855, 793, 621, 459 | Gypenoside XVII | PJ, PM, PZ |
| 71 | 7.64 | C53H90O23 | 1093.57892 | 1093.57825 | 1047, 915, 783, 621, 459 | Gypenoside LVI/LXVII/Floral G-P | PJ, PZ | |
| 72 | 7.66 | C49H78O19 | 969.50536 | 969.99005 | 1015.51208 | 807, 631, 537, 455, 393 | G-Ro methyl ester | PM, PZ |
| 73 | 7.73 | C47H80O17 | 915.53118 | 915.53667 | 961.53442 | 783, 621, 459, 375 | NG-Fe | PJ, PM, PZ |
| 74 | 7.79 | C38H64O10 | 679.44157 | 679.44607 | 633, 611, 475,391 | Acety G-Rh1 | PJ, PM | |
| 75 | 7.82 | C47H80O17 | 915.53118 | 915.52783 | 961.53748 | 783, 621, 459, 375 | CS-III | PJ, PZ |
| 76 | 7.82 | C48H82O19 | 961.53666 | 961.53802 | 1007.53357 | 931, 799, 619 | G-Re1/G-Re2/G-Re3/NG-N/NG-M isomer | PJ, PM, PZ |
| 77 | 7.90 | C38H64O10 | 679.44157 | 679.44049 | 633, 475, 391 | Acety G-F1 | PJ, PM | |
| 78 | 7.92 | C41H70O13 | 769.47327 | 769.43805 | 679, 637, 475, 391 | Pseudo G-RT3/G-F5 | PM, PZ | |
| 79 | 7.94 | C48H82O19 | 961.53666 | 961.53735 | 1007.54629 | 915, 621, 499 | G-Re1/G-Re2/G-Re3/NG-N/NG-M isomer | PM, PJ, PZ |
| 80 | 8.11 | C43H68O14 | 807.45253 | 807.41650 | 853.46051 | 793, 631, 455 | CS-IVa methyl ester | PJ, PM, PZ |
| 81 | 8.17 | C42H66O14 | 793.43688 | 793.43787 | 839.44141 | 631, 613, 569, 455 | CS-II | PM, PZ |
| 82 | 8.19 | C47H74O18 | 925.47914 | 925.47986 | 793, 731, 569, 497, 455 | CS-Ib | PJ, PM, PZ | |
| 83 | 8.31 | C47H74O18 | 925.47914 | 925.47998 | 971.48346 | 793, 763, 631, 455 | pseudo G-RT1/Stipuleanoside R1 | PJ, PM, PZ |
| 84 | 8.38 | C42H66O14 | 793.43688 | 793.43707 | 839.44318 | 731, 631, 613, 569, 455 | Zingibroside R1 | PJ, PM, PZ |
| 85 * | 8.42 | C42H72O13 | 783.48892 | 783.48669 | 829.49506 | 621, 459 | (20S) G-Rg3 | PM |
| 86 | 8.67 | C41H64O13 | 763.42632 | 763.42659 | 809.43291 | 631, 613, 569, 455, 325 | Pseudo G-RP1 | PJ, PM |
| 87 | 8.68 | C42H70O12 | 765.47835 | 765.43286 | 603, 593, 441 | G-Rk1 | PJ, PM, PZ | |
| 88 * | 8.71 | C42H72O13 | 783.48892 | 783.48826 | 829.49457 | 621, 459 | G-F2 | PJ, PM, PZ |
| 89 | 8.78 | C42H72O13 | 783.48892 | 783.48615 | 829.49524 | 752, 599, 459 | (20R)-G-Rg3 | PJ, PM, PZ |
| 90 | 8.89 | C41H64O13 | 763.42632 | 763.42631 | 613, 569, 497, 455, 405 | Pseudo G-RP1 isomer | PJ, PM, PZ | |
| 91 | 8.90 | C42H70O12 | 765.47835 | 765.43274 | 719, 673, 603, 573, 459 | G-Rg5 | PJ, PM, PZ | |
| 92 | 8.95 | C42H70O11 | 749.48344 | 749.48045 | 617, 455 | Pjs-4 | PJ | |
| 93 | 9.11 | C58H96O24 | 1175.62078 | 1175.67310 | 1221.67749 | 1159, 1095, 955, 793, 613, 569, 459 | G-Ra6 | PJ |
| 94 | 9.64 | C37H62O7 | 617.44118 | 617.44056 | 663.00000 | 455, 359 | Oleanolic acid 28-O-β-D-glucopyranoside | PJ, PM, PZ |
| 95 | 9.71 | C44H74O15 | 841.49440 | 841.49487 | 795, 633, 491, 471 | Vina G-R1 | PJ, PM, PZ | |
| 96 * | 9.84 | C30H52O4 | 475.37819 | 475.36335 | 459, 391 | PPT | PJ, PM, PZ | |
| 97 | 9.87 | C36H60O7 | 603.42553 | 603.33807 | 649.34393 | 441, 279 | G-Rk2 | PJ, PM |
| 98 | 10.08 | C36H62O8 | 621.43610 | 621.43738 | 667.44208 | 459, 375, 325, 311 | G-K | PJ, PM |
| 99 * | 10.18 | C36H62O8 | 621.43610 | 621.43530 | 667.44232 | 459, 375, 283, 255 | G-Rh2 | PJ, PM, PZ |
| 100 | 10.34 | C36H62O10 | 653.42592 | 653.42682 | 491 | Pseudo G-RT4 | PJ, PM | |
| 101 * | 10.94 | C30H52O3 | 459.38327 | 459.39596 | 375, 329 | PPD | PJ, PM | |
| No. | Analyte | Regression Equations | Correlation Coefficients (r) | Linear Range (ng × mL−1) | LOD (ng × mL−1) | LOQ (ng × mL−1) |
|---|---|---|---|---|---|---|
| 1 | N-R1 | Y = 22.1X + 29.4 | 0.9991 | 1.56~1560 | 0.61 | 1.22 |
| 2 | G-Rg1 | Y = 7.7X + 193 | 0.9999 | 3.91~3910 | 1.91 | 3.81 |
| 3 | G-Re | Y = 18X + 103 | 0.9998 | 6.25~6250 | 0.38 | 1.22 |
| 4 | G-Rf | Y = 53.4X + 20 | 0.9998 | 0.78~780 | 0.19 | 0.38 |
| 5 | G-F3 | Y = 12.3X + 8.91 | 0.9997 | 1.17~1170 | 0.36 | 0.91 |
| 6 | G-Rg2 | Y = 71.7X + 50.6 | 0.9994 | 7.03~7030 | 0.21 | 0.86 |
| 7 | G-Rh1 | Y = 2.92X − 1.56 | 0.9992 | 6.24~1560 | 2.22 | 5.90 |
| 8 | G-Rb1 | Y = 7.5X − 105 | 0.9996 | 3.15~3130 | 1.53 | 3.05 |
| 9 | G-Ro | Y = 27.8X + 3750 | 0.9992 | 9.38~9380 | 0.29 | 0.88 |
| 10 | G-Rc | Y = 7.97X + 65.1 | 0.9998 | 1.56~1560 | 0.61 | 1.22 |
| 11 | G-Rb2 | Y = 12.3X + 78.7 | 0.9998 | 1.56~1560 | 0.41 | 1.22 |
| 12 | G-Rb3 | Y = 15.1X + 56.6 | 0.9996 | 1.56~1560 | 0.41 | 1.38 |
| 13 | CS-IV | Y = 79.3X + 2610 | 0.9997 | 6.25~6250 | 0.16 | 0.31 |
| 14 | CS-IVa | Y = 13.4X + 844 | 0.9991 | 7.81~7810 | 0.13 | 0.38 |
| 15 | G-Rd | Y = 14X + 188 | 0.9993 | 1.56~1560 | 0.41 | 1.07 |
| 16 | G-Rg3 | Y = 24.1X − 17.1 | 0.9995 | 0.78~780 | 0.25 | 0.76 |
| No. | Analyte | Precision (RSD, %, n = 6) | Repeatability (RSD, %, n = 6) | Stability (RSD, %, n = 6) | Recovery | |
|---|---|---|---|---|---|---|
| Measured (%) | RSD (%) | |||||
| 1 | N-R1 | 1.78 | 3.12 | 4.43 | 99.25 | 3.45 |
| 2 | G-Rg1 | 3.23 | 4.93 | 3.93 | 101.21 | 2.45 |
| 3 | G-Re | 3.65 | 2.86 | 4.43 | 103.19 | 0.94 |
| 4 | G-Rf | 4.87 | 4.05 | 4.60 | 99.92 | 2.74 |
| 5 | G-F3 | 4.52 | 4.86 | 3.53 | 100.60 | 3.22 |
| 6 | G-Rg2 | 1.32 | 4.19 | 3.79 | 101.40 | 1.90 |
| 7 | G-Rh1 | 4.72 | 4.11 | 2.09 | 100.22 | 2.68 |
| 8 | G-Rb1 | 4.59 | 4.10 | 2.02 | 104.10 | 0.69 |
| 9 | G-Ro | 2.99 | 1.40 | 1.02 | 100.38 | 2.84 |
| 10 | G-Rc | 4.16 | 2.90 | 2.60 | 102.00 | 2.37 |
| 11 | G-Rb2 | 3.78 | 3.70 | 4.43 | 102.29 | 2.61 |
| 12 | G-Rb3 | 2.29 | 4.26 | 4.56 | 102.67 | 1.56 |
| 13 | CS-IV | 2.70 | 4.32 | 2.47 | 100.98 | 2.68 |
| 14 | CS-IVa | 3.18 | 4.74 | 1.67 | 101.55 | 1.89 |
| 15 | G-Rd | 4.21 | 3.34 | 3.72 | 100.73 | 3.14 |
| 16 | G-Rg3 | 2.72 | 3.41 | 3.31 | 101.67 | 2.77 |
| Batch | PPD-Type Ginsenoside | PPT-Type Ginsenoside | OA-Type Ginsenoside | TPPD | TPPT | TOA | T | |||||||||||||
|---|---|---|---|---|---|---|---|---|---|---|---|---|---|---|---|---|---|---|---|---|
| G-Rb1 | G-Rb2 | G-Rb3 | G-Rc | G-Rd | G-Rg3 | NG-R1 | G-Rg1 | G-Re | G-Rf | G-F3 | G-Rg2 | G-Rh1 | G-Ro | CS-IV | CS-IVa | |||||
| PM-1 | 5.104 | 0.240 | 0.221 | 0.037 | 2.320 | 0.053 | 0.039 | 1.888 | 3.328 | 2.816 | 2.480 | 1.424 | 0.298 | 55.200 | 46.240 | 29.760 | 7.976 | 12.273 | 131.200 | 151.448 |
| PM-2 | 5.664 | 0.266 | 0.245 | 0.011 | 1.344 | 0.026 | 0.057 | 2.064 | 2.864 | 2.352 | 1.558 | 1.195 | 0.381 | 50.880 | 45.760 | 31.680 | 7.555 | 10.472 | 128.320 | 146.346 |
| PM-3 | 4.016 | 0.149 | 0.160 | 0.016 | 0.958 | - | 0.041 | 0.786 | 1.984 | 1.744 | 1.302 | 0.925 | 0.159 | 53.920 | 49.440 | 31.584 | 5.300 | 6.941 | 134.944 | 147.185 |
| PM-4 | 3.648 | 0.113 | 0.173 | 0.009 | 0.960 | 0.026 | 0.039 | 1.197 | 1.616 | 1.840 | 1.416 | 1.003 | 0.181 | 63.680 | 44.640 | 32.000 | 4.929 | 7.292 | 140.320 | 152.541 |
| PM-5 | 5.488 | 0.246 | 0.259 | 0.042 | 1.184 | 0.054 | 0.025 | 1.022 | 2.464 | 2.096 | 1.824 | 1.158 | 0.151 | 61.760 | 41.120 | 43.040 | 7.273 | 8.740 | 145.920 | 161.934 |
| PM-6 | 3.472 | 0.278 | 0.275 | 0.014 | 0.699 | 0.027 | 0.024 | 1.616 | 1.541 | 1.595 | 1.453 | 0.738 | 0.221 | 71.040 | 49.120 | 34.560 | 4.766 | 7.188 | 154.720 | 166.673 |
| PM-7 | 2.944 | 0.109 | 0.158 | 0.009 | 0.765 | 0.056 | 0.089 | 1.726 | 2.080 | 1.515 | 1.320 | 0.483 | 0.162 | 82.080 | 27.520 | 40.960 | 4.040 | 7.375 | 150.560 | 161.975 |
| PM-8 | 5.712 | 0.139 | 0.182 | 0.005 | 0.890 | 0.026 | 0.056 | 1.507 | 3.008 | 1.525 | 1.808 | 0.576 | 0.376 | 106.080 | 19.840 | 60.160 | 6.955 | 8.856 | 186.080 | 201.891 |
| PM-9 | 3.232 | 0.080 | 0.118 | 0.008 | 0.539 | - | 0.078 | 1.352 | 4.096 | 1.603 | 2.624 | 0.392 | 0.317 | 104.800 | 27.840 | 54.240 | 3.977 | 10.462 | 186.880 | 201.319 |
| PM-10 | 3.904 | 0.200 | 0.296 | - | 14.557 | - | 0.259 | 0.059 | 0.136 | 0.666 | 2.656 | 0.099 | 0.111 | 78.560 | 23.856 | 29.120 | 18.957 | 3.986 | 131.536 | 154.479 |
| PM-11 | 4.256 | 0.250 | 0.231 | - | 13.240 | 0.067 | 0.291 | 0.026 | 0.166 | 0.518 | 2.688 | 0.013 | 0.130 | 81.600 | 22.338 | 33.440 | 18.044 | 3.832 | 137.378 | 159.253 |
| PM-12 | 4.240 | 0.274 | 0.489 | - | 17.056 | 0.053 | 0.347 | - | 0.099 | 0.678 | 2.726 | 0.009 | 0.130 | 76.160 | 27.040 | 28.640 | 22.112 | 3.991 | 131.840 | 157.943 |
| PM-13 | 4.736 | 0.168 | 0.386 | - | 15.824 | 0.026 | 0.293 | - | 0.163 | 0.929 | 3.086 | 0.058 | - | 78.880 | 27.200 | 26.400 | 21.140 | 4.530 | 132.480 | 158.150 |
| PM-14 | 4.992 | 0.355 | 0.292 | - | 15.744 | 0.111 | 0.307 | - | 0.077 | 0.747 | 2.720 | 0.035 | - | 75.520 | 27.360 | 33.440 | 21.494 | 3.886 | 136.320 | 161.701 |
| PM-15 | 3.296 | 0.255 | 0.296 | - | 5.894 | - | 0.235 | 0.421 | 0.714 | 0.208 | 3.936 | 0.451 | 0.062 | 91.200 | 11.360 | 35.680 | 9.741 | 6.027 | 138.240 | 154.008 |
| PM-16 | 2.992 | 0.267 | 0.250 | - | 5.304 | - | 0.232 | 0.200 | 0.904 | 0.176 | 4.443 | 0.291 | 0.117 | 96.160 | 12.960 | 40.320 | 8.812 | 6.364 | 149.440 | 164.617 |
| PM-17 | 2.464 | 0.330 | 0.354 | - | 7.968 | 0.040 | 0.206 | 0.331 | 0.387 | 0.136 | 3.376 | 0.205 | 0.090 | 65.120 | 6.128 | 46.080 | 11.155 | 4.732 | 117.328 | 133.215 |
| PM-18 | 3.024 | 0.485 | 0.376 | - | 6.640 | 0.026 | 0.234 | 0.232 | 0.429 | 0.126 | 2.576 | 0.302 | 0.102 | 81.600 | 6.544 | 37.760 | 10.551 | 4.001 | 125.904 | 140.456 |
| PM-19 | 1.984 | 0.354 | 0.224 | - | 6.848 | 0.036 | 0.261 | 0.378 | 0.338 | 0.068 | 3.504 | 0.192 | 0.107 | 75.840 | 5.216 | 30.880 | 9.445 | 4.847 | 111.936 | 126.228 |
| PM-20 | 2.640 | 0.461 | 0.635 | - | 7.904 | - | 0.278 | 0.224 | 0.208 | 0.099 | 3.632 | 0.300 | 0.089 | 66.880 | 4.272 | 34.720 | 11.640 | 4.830 | 105.872 | 122.342 |
| Mean | 3.890 | 0.251 | 0.281 | 0.008 | 6.332 | 0.031 | 0.170 | 0.751 | 1.330 | 1.072 | 2.556 | 0.493 | 0.159 | 75.848 | 26.290 | 36.723 | 10.793 | 6.531 | 138.861 | 156.185 |
| SD (n = 20) | 1.110 | 0.110 | 0.122 | 0.012 | 5.925 | 0.029 | 0.116 | 0.722 | 1.277 | 0.851 | 0.926 | 0.437 | 0.109 | 15.590 | 15.537 | 8.686 | 6.135 | 2.544 | 20.353 | 19.814 |
| PJ-1 | 1.626 | 0.061 | - | - | 0.355 | 0.031 | 0.055 | 5.360 | 2.016 | 0.422 | 0.418 | 0.136 | - | 88.480 | 50.720 | 10.880 | 2.073 | 8.407 | 150.080 | 160.560 |
| PJ-2 | 1.280 | - | - | - | 0.352 | 0.029 | - | 3.232 | 2.432 | 0.650 | 0.789 | 0.189 | 0.130 | 101.120 | 37.440 | 10.544 | 1.661 | 7.422 | 149.104 | 158.186 |
| PJ-3 | 1.363 | - | - | 0.010 | 0.432 | 0.054 | - | 2.128 | 1.427 | 1.099 | 0.571 | 0.131 | 0.130 | 70.080 | 39.680 | 8.816 | 1.859 | 5.487 | 118.576 | 125.922 |
| PJ-4 | 1.280 | 0.009 | - | - | 0.917 | 0.004 | 0.010 | 2.992 | 1.760 | 0.512 | 0.922 | 0.158 | - | 77.280 | 33.600 | - | 2.210 | 6.354 | 120.880 | 129.443 |
| PJ-5 | 1.499 | - | 0.028 | - | 0.701 | 0.056 | - | 4.560 | 1.760 | 0.638 | 0.944 | 0.136 | - | 77.600 | 31.840 | 5.984 | 2.284 | 8.039 | 115.424 | 125.746 |
| PJ-6 | 7.728 | 0.406 | 0.549 | - | 1.648 | - | 0.034 | 0.669 | 1.619 | 0.020 | 2.642 | 0.274 | - | 141.280 | 49.280 | 54.880 | 10.331 | 5.257 | 245.440 | 261.028 |
| PJ-7 | 9.232 | 0.219 | 0.416 | - | 1.363 | 0.041 | 0.036 | 0.882 | 2.336 | 0.033 | 2.762 | 0.318 | - | 139.200 | 45.920 | 55.040 | 11.272 | 6.366 | 240.160 | 257.798 |
| PJ-8 | 2.064 | 0.328 | 0.378 | - | 1.624 | 0.006 | 0.145 | 0.294 | 1.274 | 0.037 | 2.896 | 0.432 | - | 99.520 | 48.160 | 46.400 | 4.400 | 5.078 | 194.080 | 203.558 |
| PJ-9 | 1.856 | 0.674 | 0.507 | - | 1.792 | 0.026 | 0.087 | 0.394 | 2.064 | 0.019 | 2.752 | 0.434 | - | 95.840 | 58.400 | 39.200 | 4.855 | 5.750 | 193.440 | 204.044 |
| PJ-10 | 2.064 | 0.248 | 0.253 | 0.099 | 1.574 | 0.040 | 0.130 | 2.192 | 1.421 | 0.012 | 1.856 | 0.296 | 0.162 | 88.800 | 39.360 | 38.080 | 4.278 | 6.068 | 166.240 | 176.587 |
| PJ-11 | 5.456 | 0.246 | 0.276 | 0.054 | 1.512 | 0.097 | 0.132 | 1.680 | 0.736 | 0.032 | 2.338 | 0.190 | 0.115 | 118.880 | 41.600 | 44.640 | 7.642 | 5.222 | 205.120 | 217.984 |
| PJ-12 | 5.792 | 0.707 | 0.320 | 0.038 | 2.256 | 0.026 | 0.055 | 0.072 | 0.045 | 0.011 | 1.640 | 0.164 | 0.091 | 145.600 | 34.240 | 69.600 | 9.140 | 2.079 | 249.440 | 260.658 |
| PJ-13 | 1.114 | 0.126 | 0.173 | 0.300 | 0.187 | 0.026 | 0.070 | 3.904 | 3.008 | 0.302 | 0.334 | 0.067 | 0.584 | 137.920 | 57.280 | 16.160 | 1.926 | 8.270 | 211.360 | 221.556 |
| PJ-14 | 1.541 | 0.157 | 0.144 | 0.250 | 0.166 | 0.013 | 0.087 | 2.688 | 4.112 | 0.260 | 0.333 | 0.076 | 0.261 | 145.600 | 62.880 | 13.936 | 2.270 | 7.816 | 222.416 | 232.503 |
| PJ-15 | 2.112 | 0.215 | 0.117 | 0.277 | 0.514 | 0.026 | 0.187 | 4.032 | 3.808 | 0.230 | 0.475 | 0.128 | 0.290 | 146.240 | 59.840 | 10.528 | 3.260 | 9.151 | 216.608 | 229.019 |
| PJ-16 | 1.595 | 0.275 | 0.294 | 0.328 | 0.664 | 0.026 | 0.187 | 4.624 | 3.968 | 0.296 | 0.627 | 0.166 | 0.290 | 145.280 | 65.440 | 15.808 | 3.183 | 10.159 | 226.528 | 239.870 |
| PJ-17 | 3.146 | 0.434 | 0.248 | 0.171 | 1.216 | 0.026 | 0.121 | 0.469 | 1.309 | 0.031 | 1.376 | 0.656 | - | 74.080 | 39.360 | 54.720 | 5.240 | 3.962 | 168.160 | 177.363 |
| PJ-18 | 2.496 | 0.328 | 0.115 | - | 1.080 | 0.041 | 0.158 | 0.298 | 1.062 | 0.019 | 0.869 | 0.418 | - | 76.960 | 46.080 | 54.560 | 4.061 | 2.823 | 177.600 | 184.484 |
| PJ-19 | 2.269 | 0.166 | 0.181 | 0.018 | 0.981 | - | 0.117 | 0.290 | 2.224 | 0.031 | 0.832 | 0.458 | - | 78.080 | 47.040 | 36.480 | 3.614 | 3.951 | 161.600 | 169.166 |
| PJ-20 | 1.680 | 0.326 | 0.202 | 0.037 | 1.152 | 0.028 | 0.234 | 0.989 | 0.768 | 0.013 | 1.424 | 0.598 | 0.130 | 85.760 | 37.280 | 31.840 | 3.425 | 4.156 | 154.880 | 162.461 |
| Mean | 2.860 | 0.246 | 0.210 | 0.079 | 1.024 | 0.030 | 0.092 | 2.087 | 1.957 | 0.234 | 1.340 | 0.271 | 0.109 | 106.680 | 46.272 | 31.405 | 4.449 | 6.091 | 184.357 | 194.897 |
| SD (n = 20) | 2.310 | 0.203 | 0.168 | 0.116 | 0.597 | 0.022 | 0.069 | 1.730 | 1.093 | 0.299 | 0.898 | 0.173 | 0.152 | 29.528 | 10.162 | 20.349 | 2.902 | 2.143 | 42.448 | 44.410 |
| PZ-1 | 9.136 | 0.178 | 0.029 | 0.014 | 0.450 | 0.450 | 3.488 | 24.640 | 10.960 | 0.058 | 10.080 | 2.912 | 3.984 | 93.760 | 25.600 | 11.472 | 10.256 | 56.122 | 130.832 | 197.209 |
| PZ-2 | 8.128 | 0.161 | 0.053 | 0.020 | 0.453 | 0.331 | 3.760 | 21.760 | 10.128 | 0.079 | 10.112 | 2.992 | 2.880 | 91.520 | 25.760 | 10.944 | 9.146 | 51.711 | 128.224 | 189.082 |
| PZ-3 | 8.464 | 0.142 | 0.034 | 0.011 | 0.451 | 0.222 | 3.808 | 20.320 | 8.768 | 0.080 | 9.392 | 2.944 | 2.736 | 86.080 | 25.120 | 10.560 | 9.324 | 48.048 | 121.760 | 179.133 |
| PZ-4 | 8.256 | 0.071 | 0.053 | 0.020 | 0.515 | 0.328 | 3.888 | 17.040 | 8.736 | 0.050 | 9.712 | 3.376 | 2.160 | 80.960 | 23.840 | 9.744 | 9.244 | 44.962 | 114.544 | 168.750 |
| PZ-5 | 8.288 | 0.105 | 0.118 | 0.013 | 0.421 | 0.245 | 3.872 | 16.160 | 9.440 | 0.067 | 11.552 | 3.440 | 1.696 | 84.160 | 23.840 | 12.224 | 9.190 | 46.227 | 120.224 | 175.641 |
| PZ-6 | 9.296 | 0.213 | 0.007 | 0.015 | 0.541 | 0.290 | 4.768 | 16.160 | 9.376 | 0.095 | 10.480 | 3.344 | 2.720 | 88.640 | 25.600 | 12.224 | 10.361 | 46.943 | 126.464 | 183.768 |
| PZ-7 | 10.528 | 0.762 | 0.789 | 0.117 | 0.374 | 0.478 | 3.808 | 22.085 | 14.720 | 0.056 | 5.536 | 0.819 | 5.184 | 99.680 | 22.080 | 11.792 | 13.048 | 52.208 | 133.552 | 198.808 |
| PZ-8 | 14.720 | 1.378 | 1.286 | 0.197 | 1.168 | 0.371 | 3.568 | 22.402 | 15.808 | 0.039 | 4.786 | 1.619 | 3.008 | 89.920 | 18.240 | 15.120 | 19.120 | 51.229 | 123.280 | 193.629 |
| PZ-9 | 15.840 | 0.408 | 0.397 | 0.037 | 0.352 | 0.413 | 5.440 | 22.254 | 15.344 | 0.093 | 10.560 | 2.128 | 3.424 | 118.080 | 28.000 | 9.872 | 17.447 | 59.243 | 155.952 | 232.642 |
| PZ-10 | 17.120 | 0.272 | 0.507 | 0.144 | 0.496 | 0.390 | 5.792 | 26.244 | 16.960 | 0.048 | 12.688 | 2.352 | 3.952 | 125.600 | 29.440 | 14.816 | 18.930 | 68.036 | 169.856 | 256.821 |
| Mean | 10.978 | 0.369 | 0.327 | 0.059 | 0.522 | 0.352 | 4.219 | 20.907 | 12.024 | 0.066 | 9.490 | 2.593 | 3.174 | 95.840 | 24.752 | 11.877 | 12.607 | 52.473 | 132.469 | 197.548 |
| SD (n = 10) | 3.510 | 0.408 | 0.427 | 0.068 | 0.234 | 0.084 | 0.817 | 3.479 | 3.280 | 0.020 | 2.476 | 0.859 | 1.005 | 14.750 | 3.097 | 1.848 | 4.247 | 7.064 | 17.248 | 27.227 |
© 2018 by the authors. Licensee MDPI, Basel, Switzerland. This article is an open access article distributed under the terms and conditions of the Creative Commons Attribution (CC BY) license (http://creativecommons.org/licenses/by/4.0/).
Share and Cite
Du, Z.; Li, J.; Zhang, X.; Pei, J.; Huang, L. An Integrated LC-MS-Based Strategy for the Quality Assessment and Discrimination of Three Panax Species. Molecules 2018, 23, 2988. https://doi.org/10.3390/molecules23112988
Du Z, Li J, Zhang X, Pei J, Huang L. An Integrated LC-MS-Based Strategy for the Quality Assessment and Discrimination of Three Panax Species. Molecules. 2018; 23(11):2988. https://doi.org/10.3390/molecules23112988
Chicago/Turabian StyleDu, Zhixia, Jinhua Li, Xiang Zhang, Jin Pei, and Linfang Huang. 2018. "An Integrated LC-MS-Based Strategy for the Quality Assessment and Discrimination of Three Panax Species" Molecules 23, no. 11: 2988. https://doi.org/10.3390/molecules23112988
APA StyleDu, Z., Li, J., Zhang, X., Pei, J., & Huang, L. (2018). An Integrated LC-MS-Based Strategy for the Quality Assessment and Discrimination of Three Panax Species. Molecules, 23(11), 2988. https://doi.org/10.3390/molecules23112988