1. Introduction
Epimedium herb, commonly named as Yinyanghuo in Chinese, has its origins in the Berberidaceae family which include
Epimedium koreanum Nakai,
Epimedium brevicornum Maxim.,
Epimedium pubescens Maxim.,
Epimedium sagittatum (Sieb.et Zucc.) Maxim. and
Epimedium wushanense T. S. Ying [
1]. According to the “Shen Nong’s Herbal Classic” records, as one of the tonic TCMs,
Epimedium herb has been used for more than 2000 years [
2].
Chemical studies reveal that more than 260 ingredients have been isolated from
Epimedium, such as flavonoids, polysaccharides, essential oils, phytosterols, phenolic acids and alkaloid [
3,
4]. Pharmacological studies demonstrate that ingredients in
Epimedium possess various attributes. For example, flavonoids, the major constituents in
Epimedium which including baohuoside II, baohuoside I, epimedin A, epimedin B, epimedin C, quercitrin, sagittatoside A, sagittatoside B, hyperoside, icariside I, icariin and astragalin, have been widely used for improving cardiovascular and promoting sexual function [
5,
6]. They also show anti-osteoporosis, anti-inflammation, anti-cancer and anti-oxidation effects [
7,
8,
9,
10,
11]. Meanwhile, the phenolic acids such as chlorogenic acid, neochlorogenic acid and cryptochlorogenic acid have extensive pharmacological actions including anti-inflammation, anti-fatigue and antitumor properties [
12,
13,
14]. Furthermore, alkaloid such as magnoflorine is found to possess anti-glycemic and anti-oxidant activities [
15,
16].
In TCM theory, processing is a necessary procedure, which can enhance clinical efficacy and decrease the toxicity of herbs [
17]. For
Epimedium herb, much research suggests that processed and unprocessed herbs have a different effect in pharmacological and clinical. The drug processed has greater efficacy for improving sexual desire and performance, while the raw has stronger efficacy in osteoporosis and rheumatism [
18,
19]. Modern studies focusing on pharmacological properties reveal that the processed method is an important factor influencing composition contents. Chen et al. reported that the contents of flavonoids were increased when the processing temperature was 60 °C [
20] while Gao et al. claimed that 120 °C may be the best [
21]. Comparing the contents of flavonoids after processing, Li et al. pointed out roasting was better than frying [
22]. In practical production, there are many processing methods for Chinese herbs, including stir-frying, steaming, calcining, roasting and boiling. The Chinese Pharmacopoeia (2015 edition) record stir-frying with lamb oil as the processing method of
Epimedium herb but not in detail [
1]. Thus, it is necessary to optimize the traditional processing method to gain standardization.
The previous study reported that both species and region had a notable impact on the contents of TCMs [
17]. Gao et al. indicated that the magnolia content of
E. koreanum Nakai was 10 times higher than
E. brevicornu Maxim. Moreover, the
E. brevicornum Maxim. collected from Gansu province were better than other provinces [
23]. So it is important to develop a reliable method for
Epimedium identification based on the appearance and microscopic features.
In general, baohuoside I and icariin are considered as the major active components and the quality marker of Epimedium herb [
1]. However, other ingredients such as phenolic acids and alkaloid with verified pharmacological activities are also abundant in
Epimedium. Comprehensive quality control demands a method to analyze multiple active components of
Epimedium simultaneously. Chen et al. compared the methods for determination of 15 flavonoids in raw
Epimedium by high-performance liquid chromatography (HPLC) and ultra performance liquid chromatography (UPLC). The analysis time of the UPLC method was shorter than HPLC, and the UPLC method was more sensitive [
24]. Moreover, Zhu et al. had established the fingerprint chromatogram of
Epimedium by UPLC, and found there were 5 differences in fingerprint between crude and processed product [
25]. Naseer’s research demonstrated that the HPLC–MS method exhibits higher sensitivity, lower LOQs and shorter analysis time compared with the HPLC–ultraviolet (UV) and UPLC–UV methods [
26,
27].
Considering all these factors,
Epimedium from 6 regions in China were ascribed to 5 species (
E. koreanum Nakai,
E. brevicornum Maxim.,
E. pubescens Maxim.,
E. sagittatum (Sieb.et Zucc.) Maxim. and
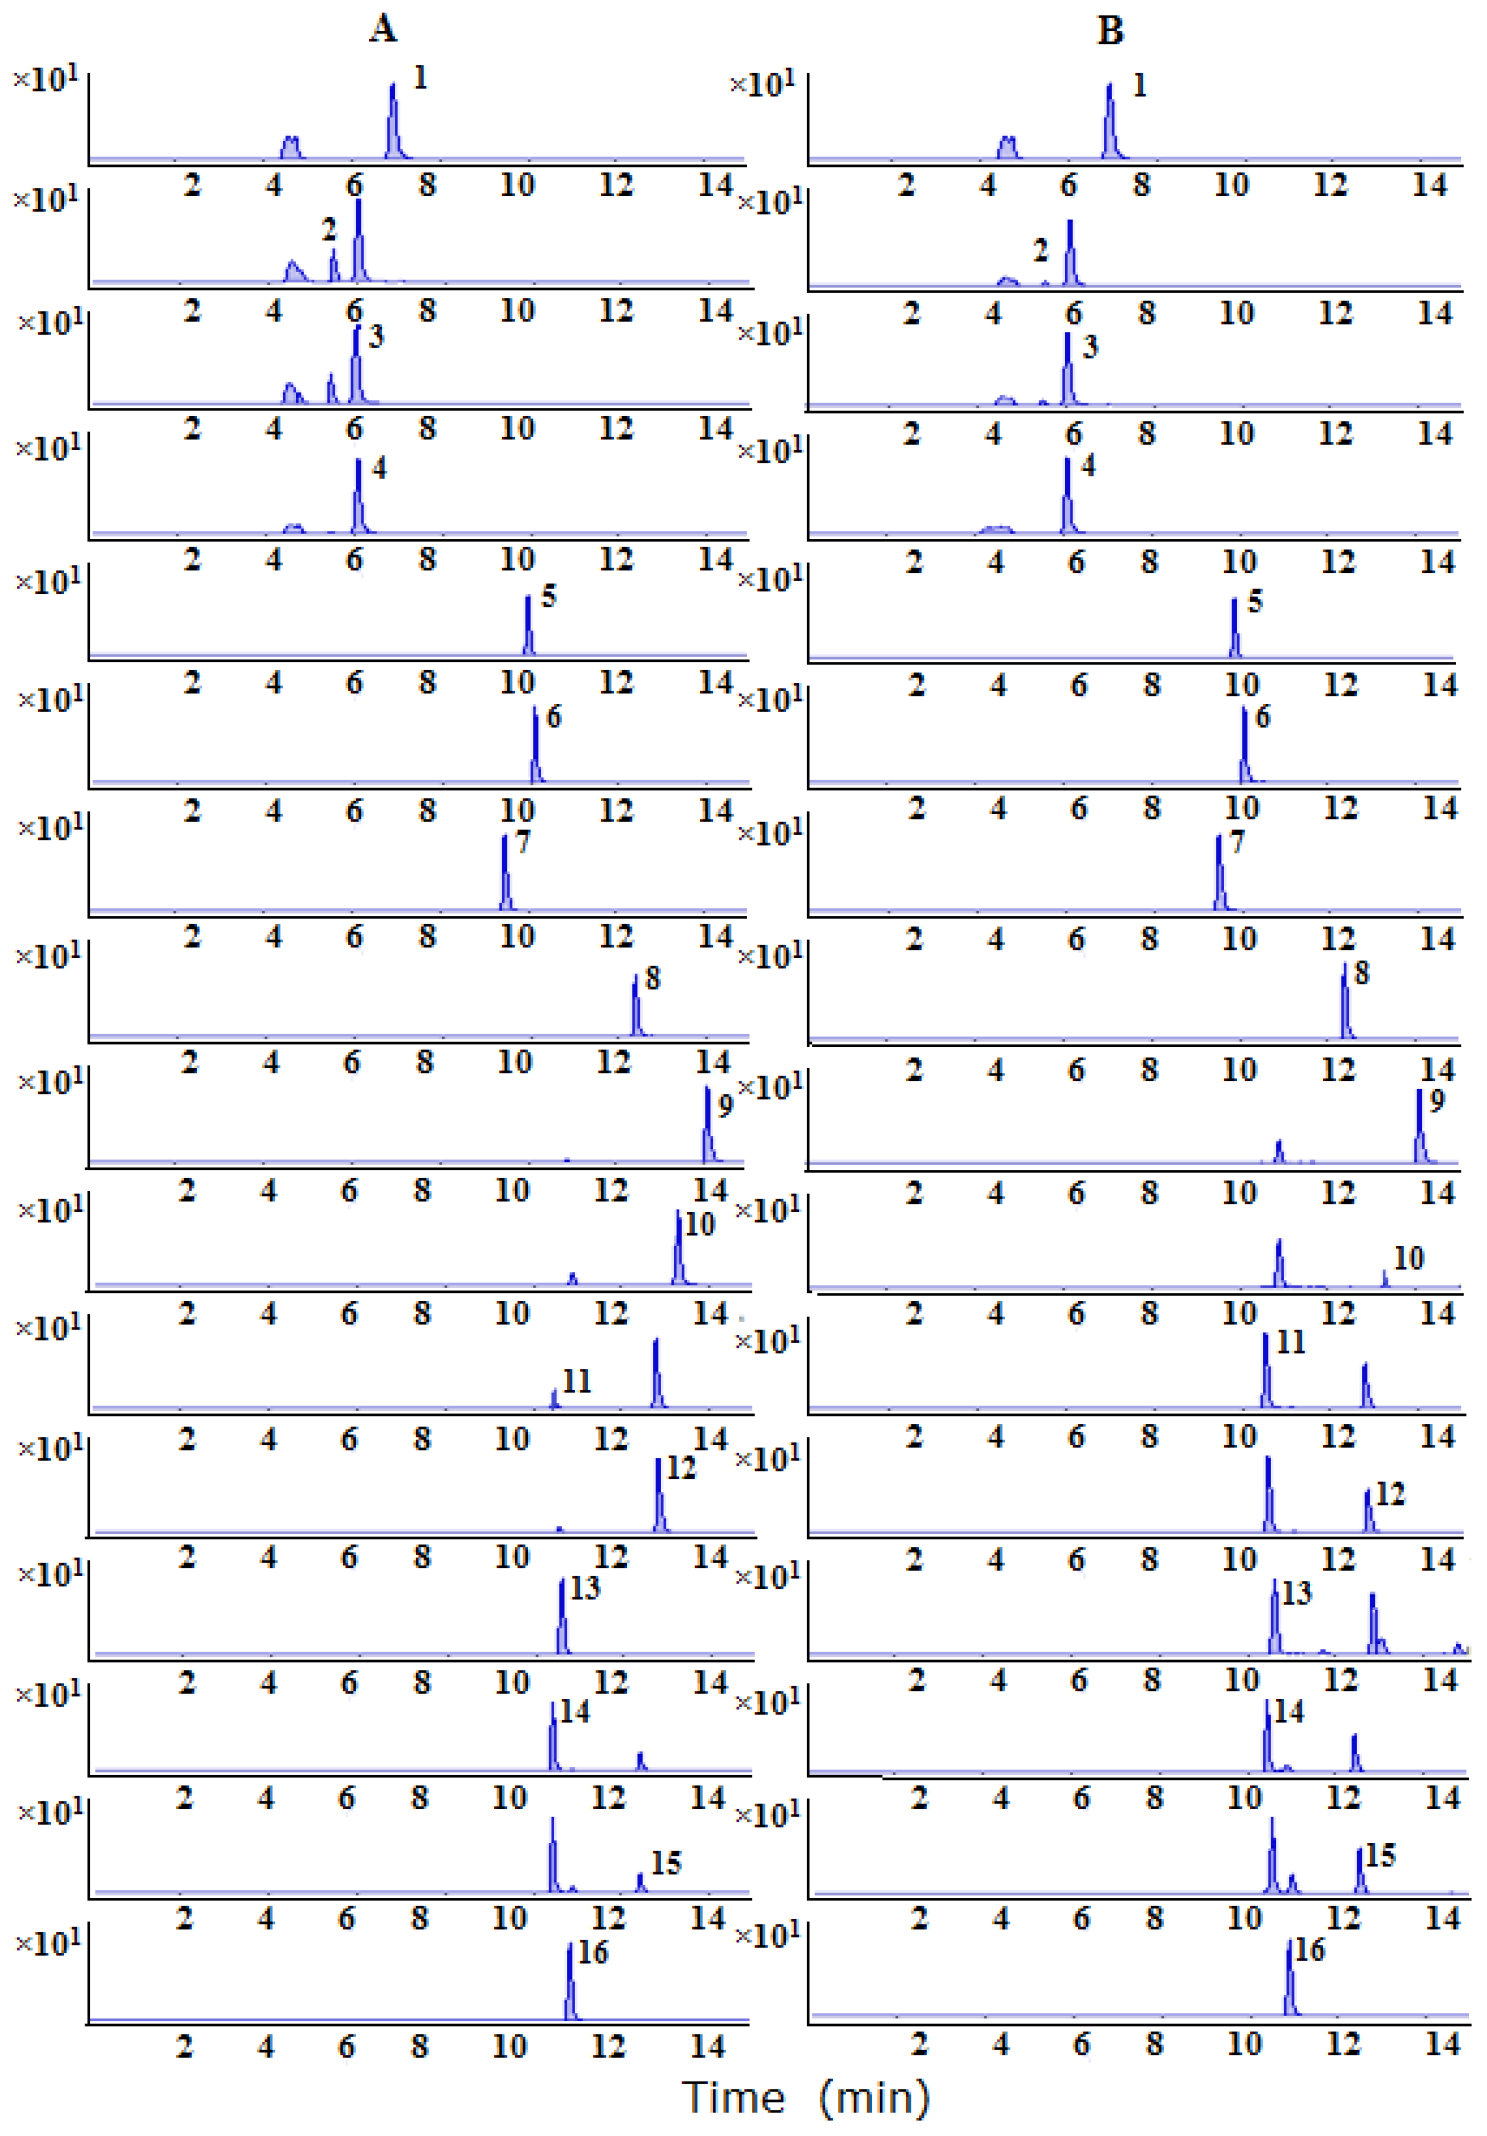
E. wushanense T. S. Ying) by appearance and microscopic features. Then, 13 batches of samples were processed by optimized method and 16 ingredients including 12 flavonoids such as baohuoside II, baohuoside I, epimedin A, epimedin B, epimedin C, quercitrin, sagittatoside A, sagittatoside B, hyperoside, icariside I, icariin and astragalin, 3 phenolic acids such as chlorogenic acid, neochlorogenic acid, cryptochlorogenic acid and 1 alkaloid such as magnoflorine were simultaneously evaluated by LC–MS/MS. The present assay was further applied to investigate and compare the main components of crude and processed
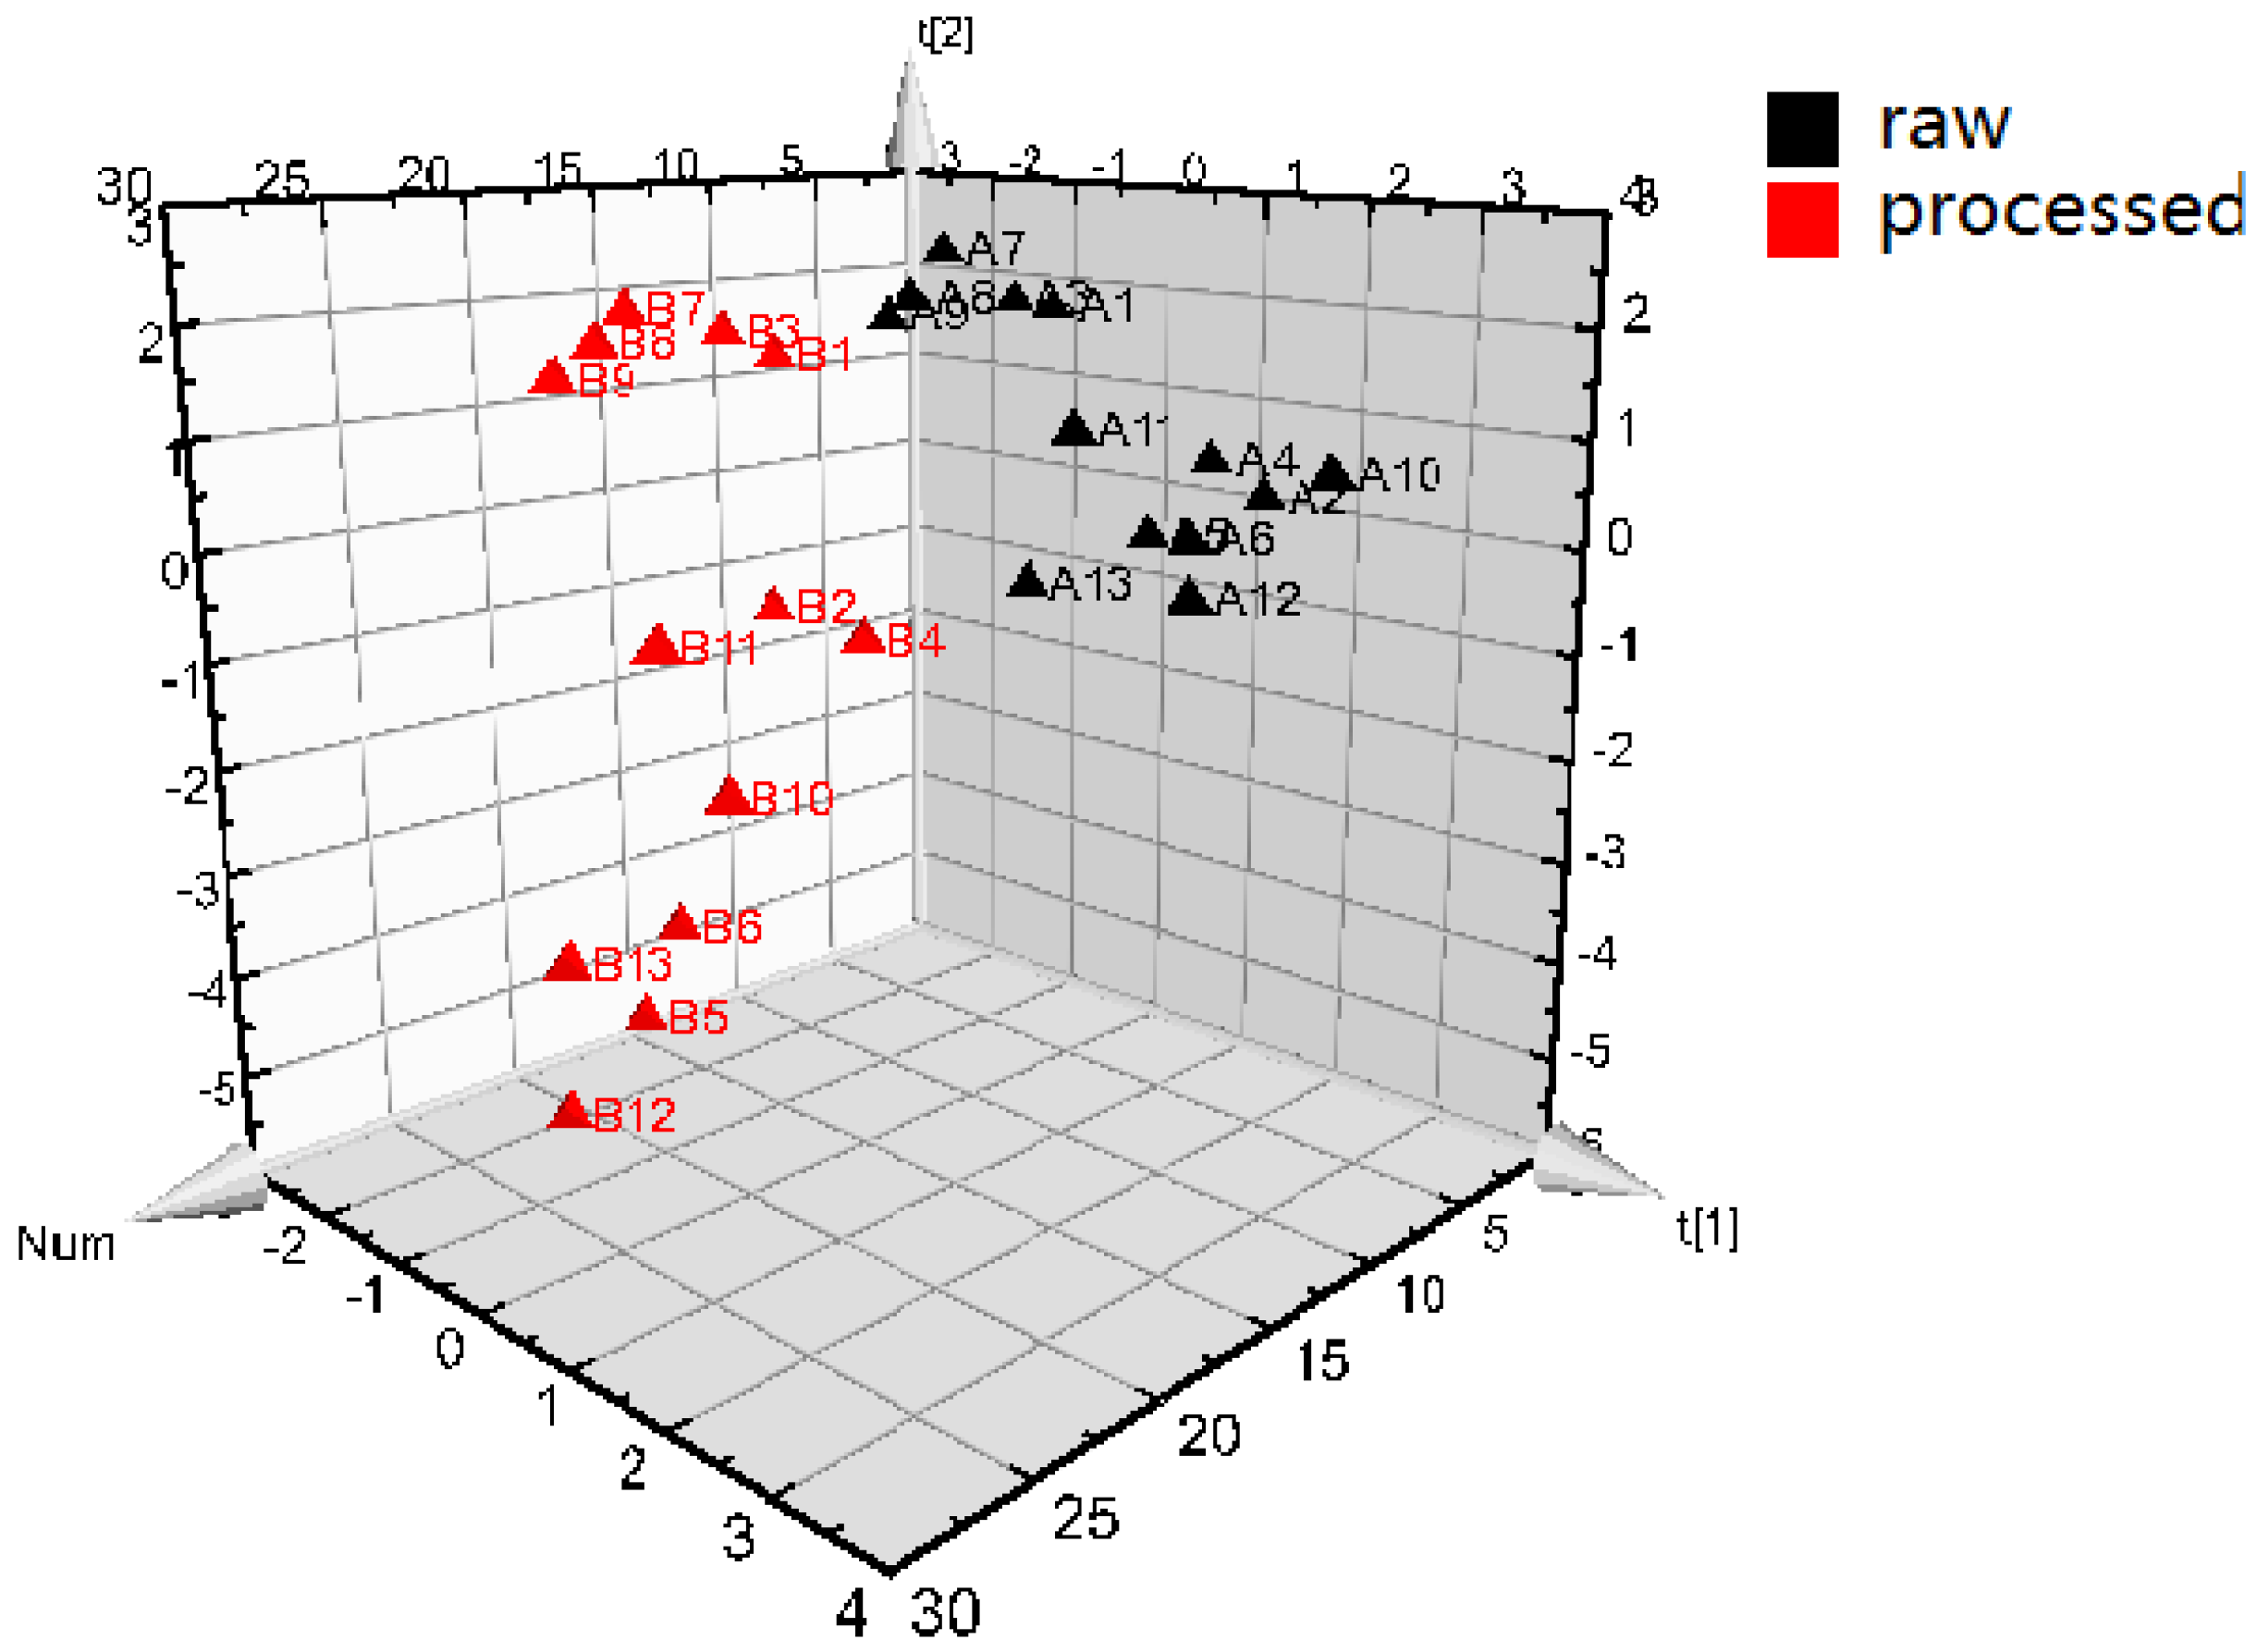
Epimedium using multivariate data analysis (partial least squares discriminant analysis (PLS-DA)) [
28,
29].
3. Materials and Methods
3.1. Plant Material
In the present study, 13 batches of
Epimedium were collected from different regions of China during 2015 and 2016. The origins of the samples were shown in
Table 1.
3.2. Chemicals
Acetonitrile, methanol (Thermo Fisher Scientific, Waltham, MA, USA), formic acid (ROE SCIENTIFIC INC Newark, NJ, USA) were all of HPLC grade. Analytical grade ethanol was obtained from Tianjin Guangfu Science Co. Ltd. (Tianjin, China). Ultrapure water was prepared by a Milli-Q water purification system (Millipore, Milford, MA, USA). The reference standards (purity > 98%) of baohuoside II, baohuoside I, epimedin A, epimedin B, epimedin C, quercitrin, sagittatoside A, sagittatoside B, hyperoside, chlorogenic acid, magnoflorine, neochlorogenic acid, cryptochlorogenic acid, icariside I, icariin and astragalin were purchased from Tianjin, Yifangzhongkang Pharmaceutical Technology Co. Ltd. (Tianjin, China). Lamb oil was purchased from Yuquan Road Market (Tianjin, China).
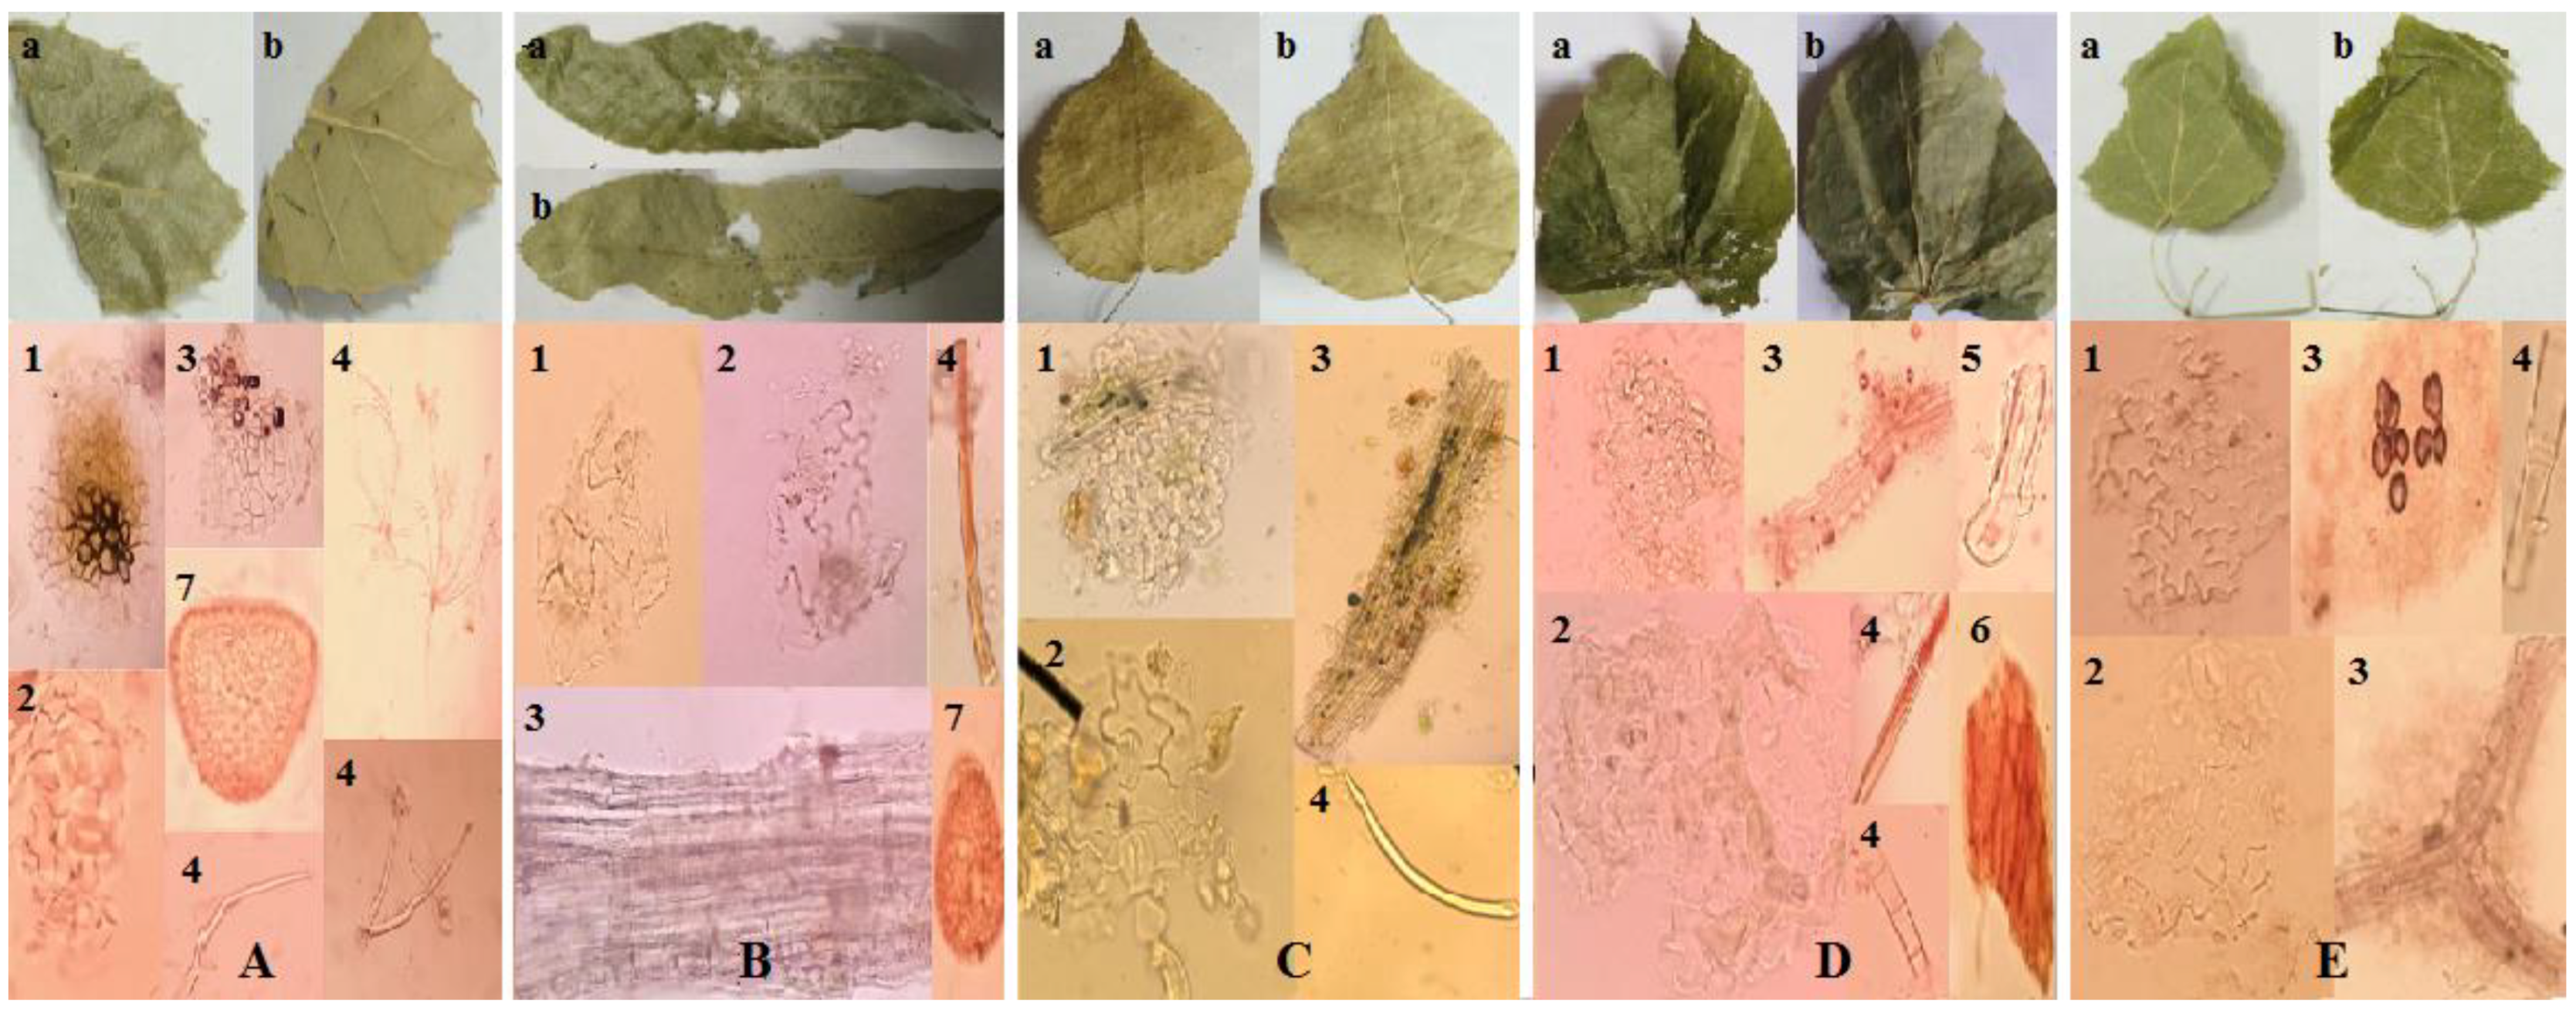
3.3. Identification of Epimedium
The species of Epimedium were identified according to the leaves’ appearance and microscopic features. After screening with the No. 4 sieve, each dried sample was ground to powder by an electric grinder. Samples were placed on the slides and permeated twice with 1–3 drops of chloral hydrate, and then sealed by diluted glycerol and coverslip. For observation, Epimedium powder samples were taken with a digital camera and light microscope with 20 times magnification.
3.4. Optimization of the Processing Method of Epimedium
Lamb oil, 20% weight of raw samples, was melted in a hot pot. Raw
Epimedium was then added and heated with constant tossing or stirring until the raw samples became sheeny and yellow. In order to optimize the processing method of
Epimedium, the effects of processing technological factors, including processing heat, processing time and weight of
Epimedium were investigated by orthogonal experimental design (L9 (3)
4). Total flavonoids (epimedin A, epimedin B, epimedin C, icariin and baohuoside I), as major active constituents, were chosen as the marker chemicals to evaluate the quality of processed
Epimedium (
Table 5).
3.5. Quantification by Liquid Chromatography–Mass Spectrometry (LC–MS/MS)
3.5.1. Preparation of Samples
Thirteen batches of Epimedium were processed by the optimized method. Then, 100 mg Epimedium samples (raw or processed) were extracted with 100 mL of 70% aqueous ethanol under ultrasonic extraction conditions over 60 min at room temperature. After filtering through a nylon membrane filter (0.22 μm), the filtrate was used as the test solution.
Sixteen reference standards (magnoflorine, chlorogenic acid, cryptochlorogenic acid, neochlorogenic acid, hyperoside, epimedin A, epimedin C, sagittatoside B, baohuoside I, icariin, astragalin, quercitrin, baohuoside II, icariside I, epimedin B and sagittatoside A) were dissolved in methanol at a final concentration of 1 mg/mL as stock solutions, respectively. Working standard solutions were further obtained by appropriate stock standard solutions mixed and diluted with methanol.
3.5.2. Chromatographic and Mass Spectrometry (MS) Conditions
Chromatography was performed on a CORTECSR C18 column (150 × 4.6 mm, 3 μm) at a 0.3 mL/min flow rate. The separation was obtained using the following gradient program: 0–4 min, 20–50% B; 4–5 min, 50–60% B; 5–15 min, 60–70% B (A: water containing 0.1% formic acid, B: acetonitrile). The injection volume was 5 µL and the column temperature was set at 30 °C.
The optimized conditions for MS detector were as follows: capillary voltage, −4000 V; drying gas (N2) flow rate, 9.0 L/min with a temperature at 300 °C; nebulizer pressure, 20 psi. The MRM scanning mode was employed for quantification in negative mode simultaneously. The mass spectra properties of 16 analytes were shown in
Table 6. Data analysis was performed using Masshunter Workstation Software from Agilent Technologies (version B.04.00).
3.5.3. LC–MS/MS Method Validation
The linearity of the assay for the test compounds was performed by least-square linear regression of 16 analytes-to-standard peak area ratios (y) versus the normalized standard concentration (x). The LLOQ for each sample was defined by the concentrations that generated peaks with signal-to-noise values (S/N) of 5. For precision, the method was evaluated by intraday and interday variability. The RSDs were calculated as the measure of precision. In the repeatability examination, six replicates of the samples from the same batch were extracted and analyzed. To evaluate the stability of analytes, sample solutions were stored at room temperature and then analyzed by replicate injection at 0, 2, 4, 8, 12 and 24 h, the RSDs were used to assess the stability. The recovery was evaluated by adding the standard solution to samples, which was used to further investigate the accuracy of the method. In the study, a known amount of 16 standards were added to Epimedium samples in 100 mL of 70% aqueous ethanol. The samples were thoroughly mixed before analyzing by LC–MS/MS. The recoveries were calculated by the formulae: recovery (%) = (amount found − original amount)/amount spiked × 100%.
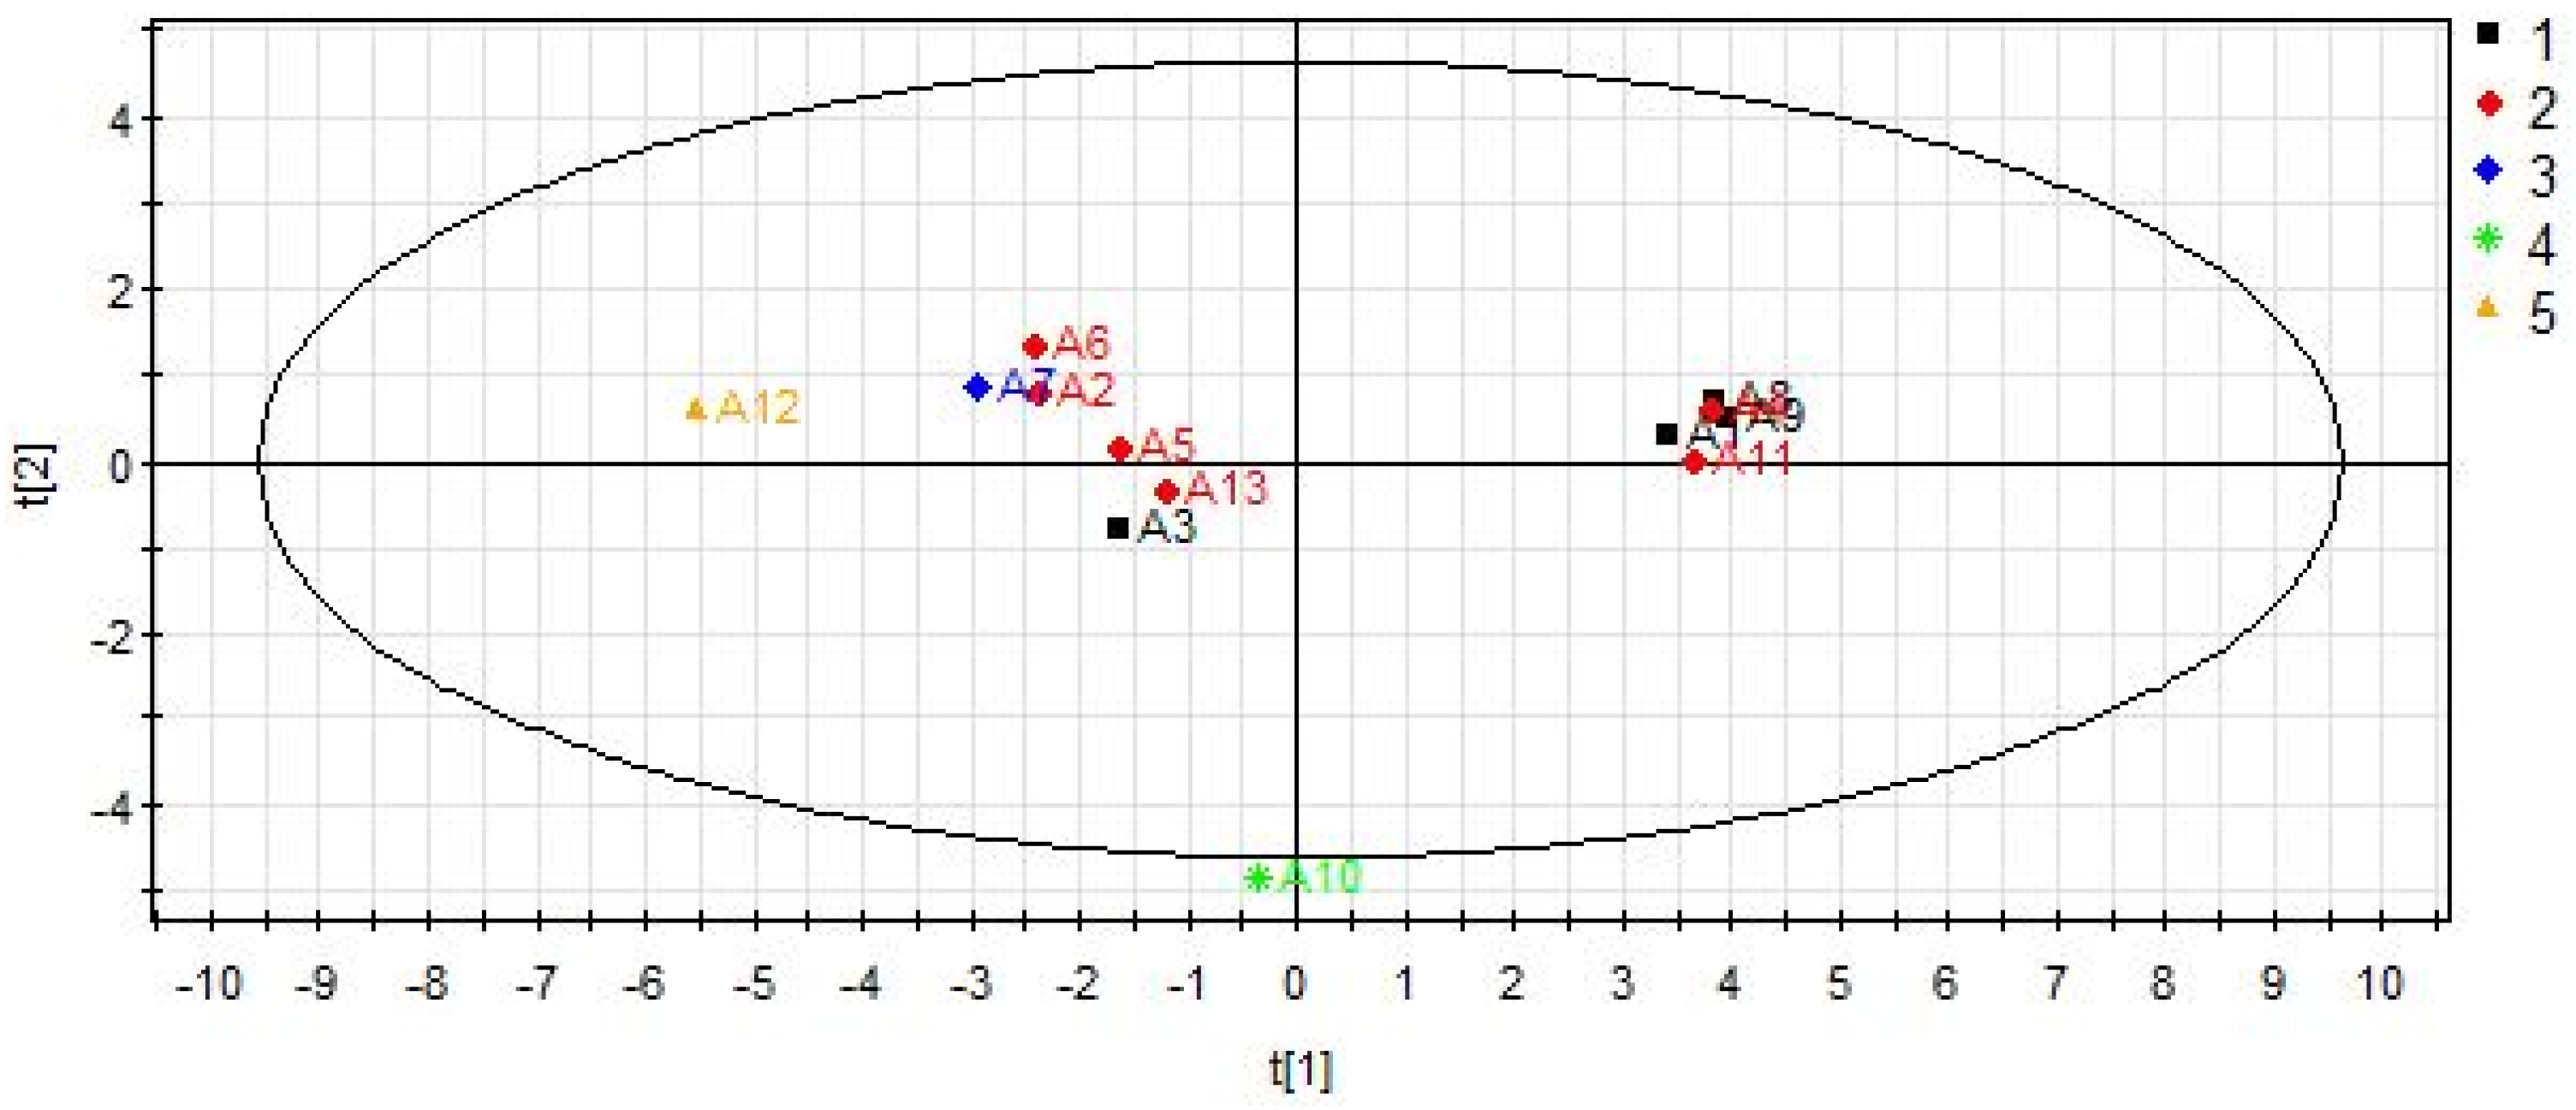
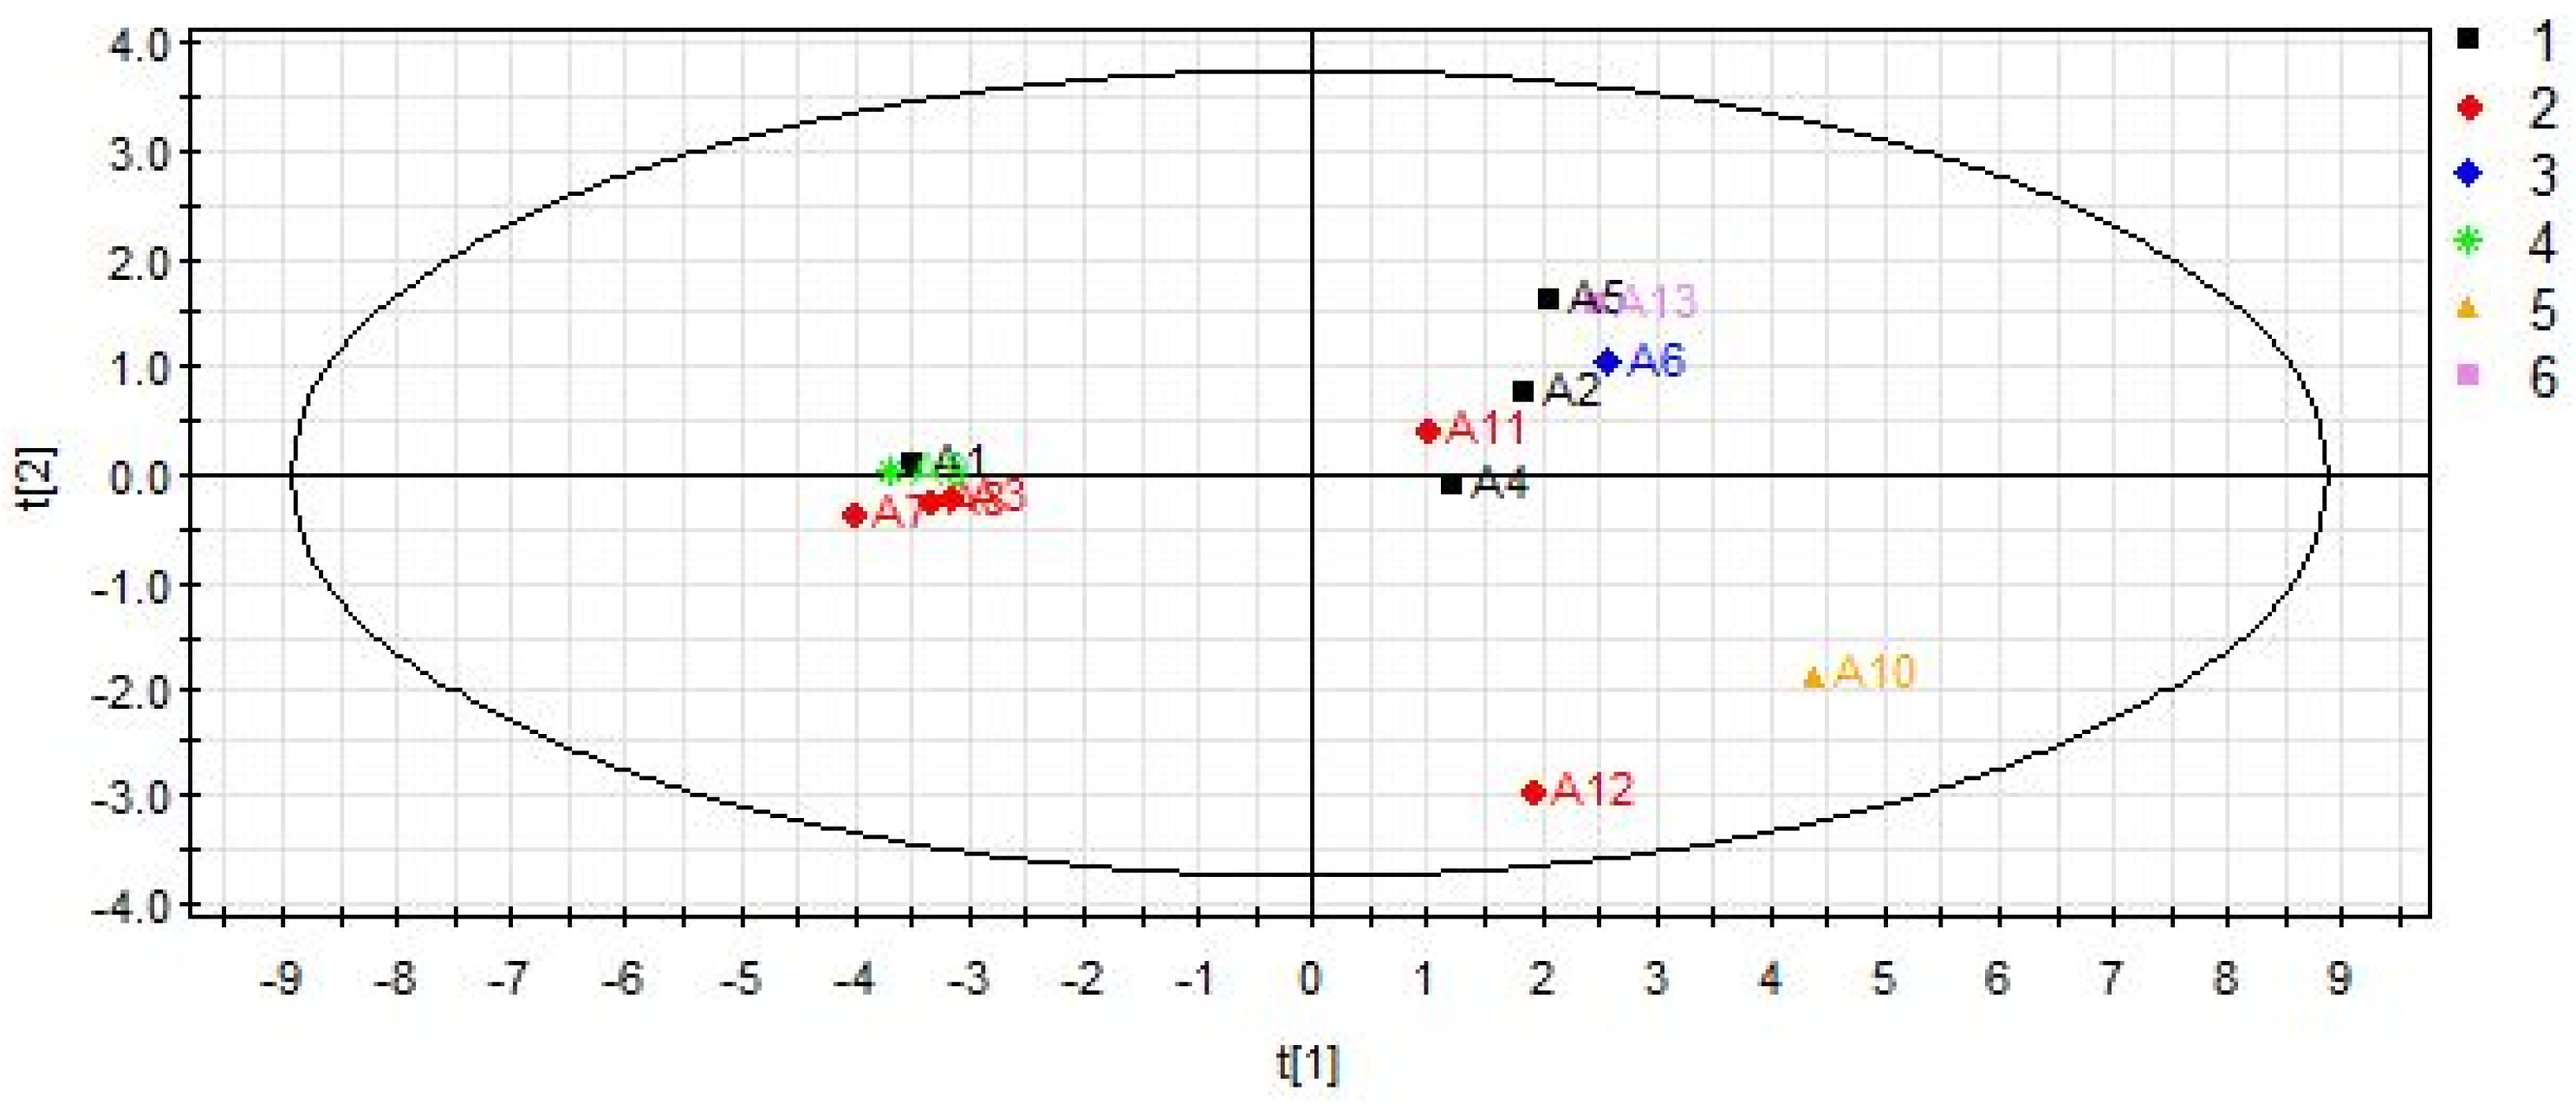
3.6. Statistical Analysis
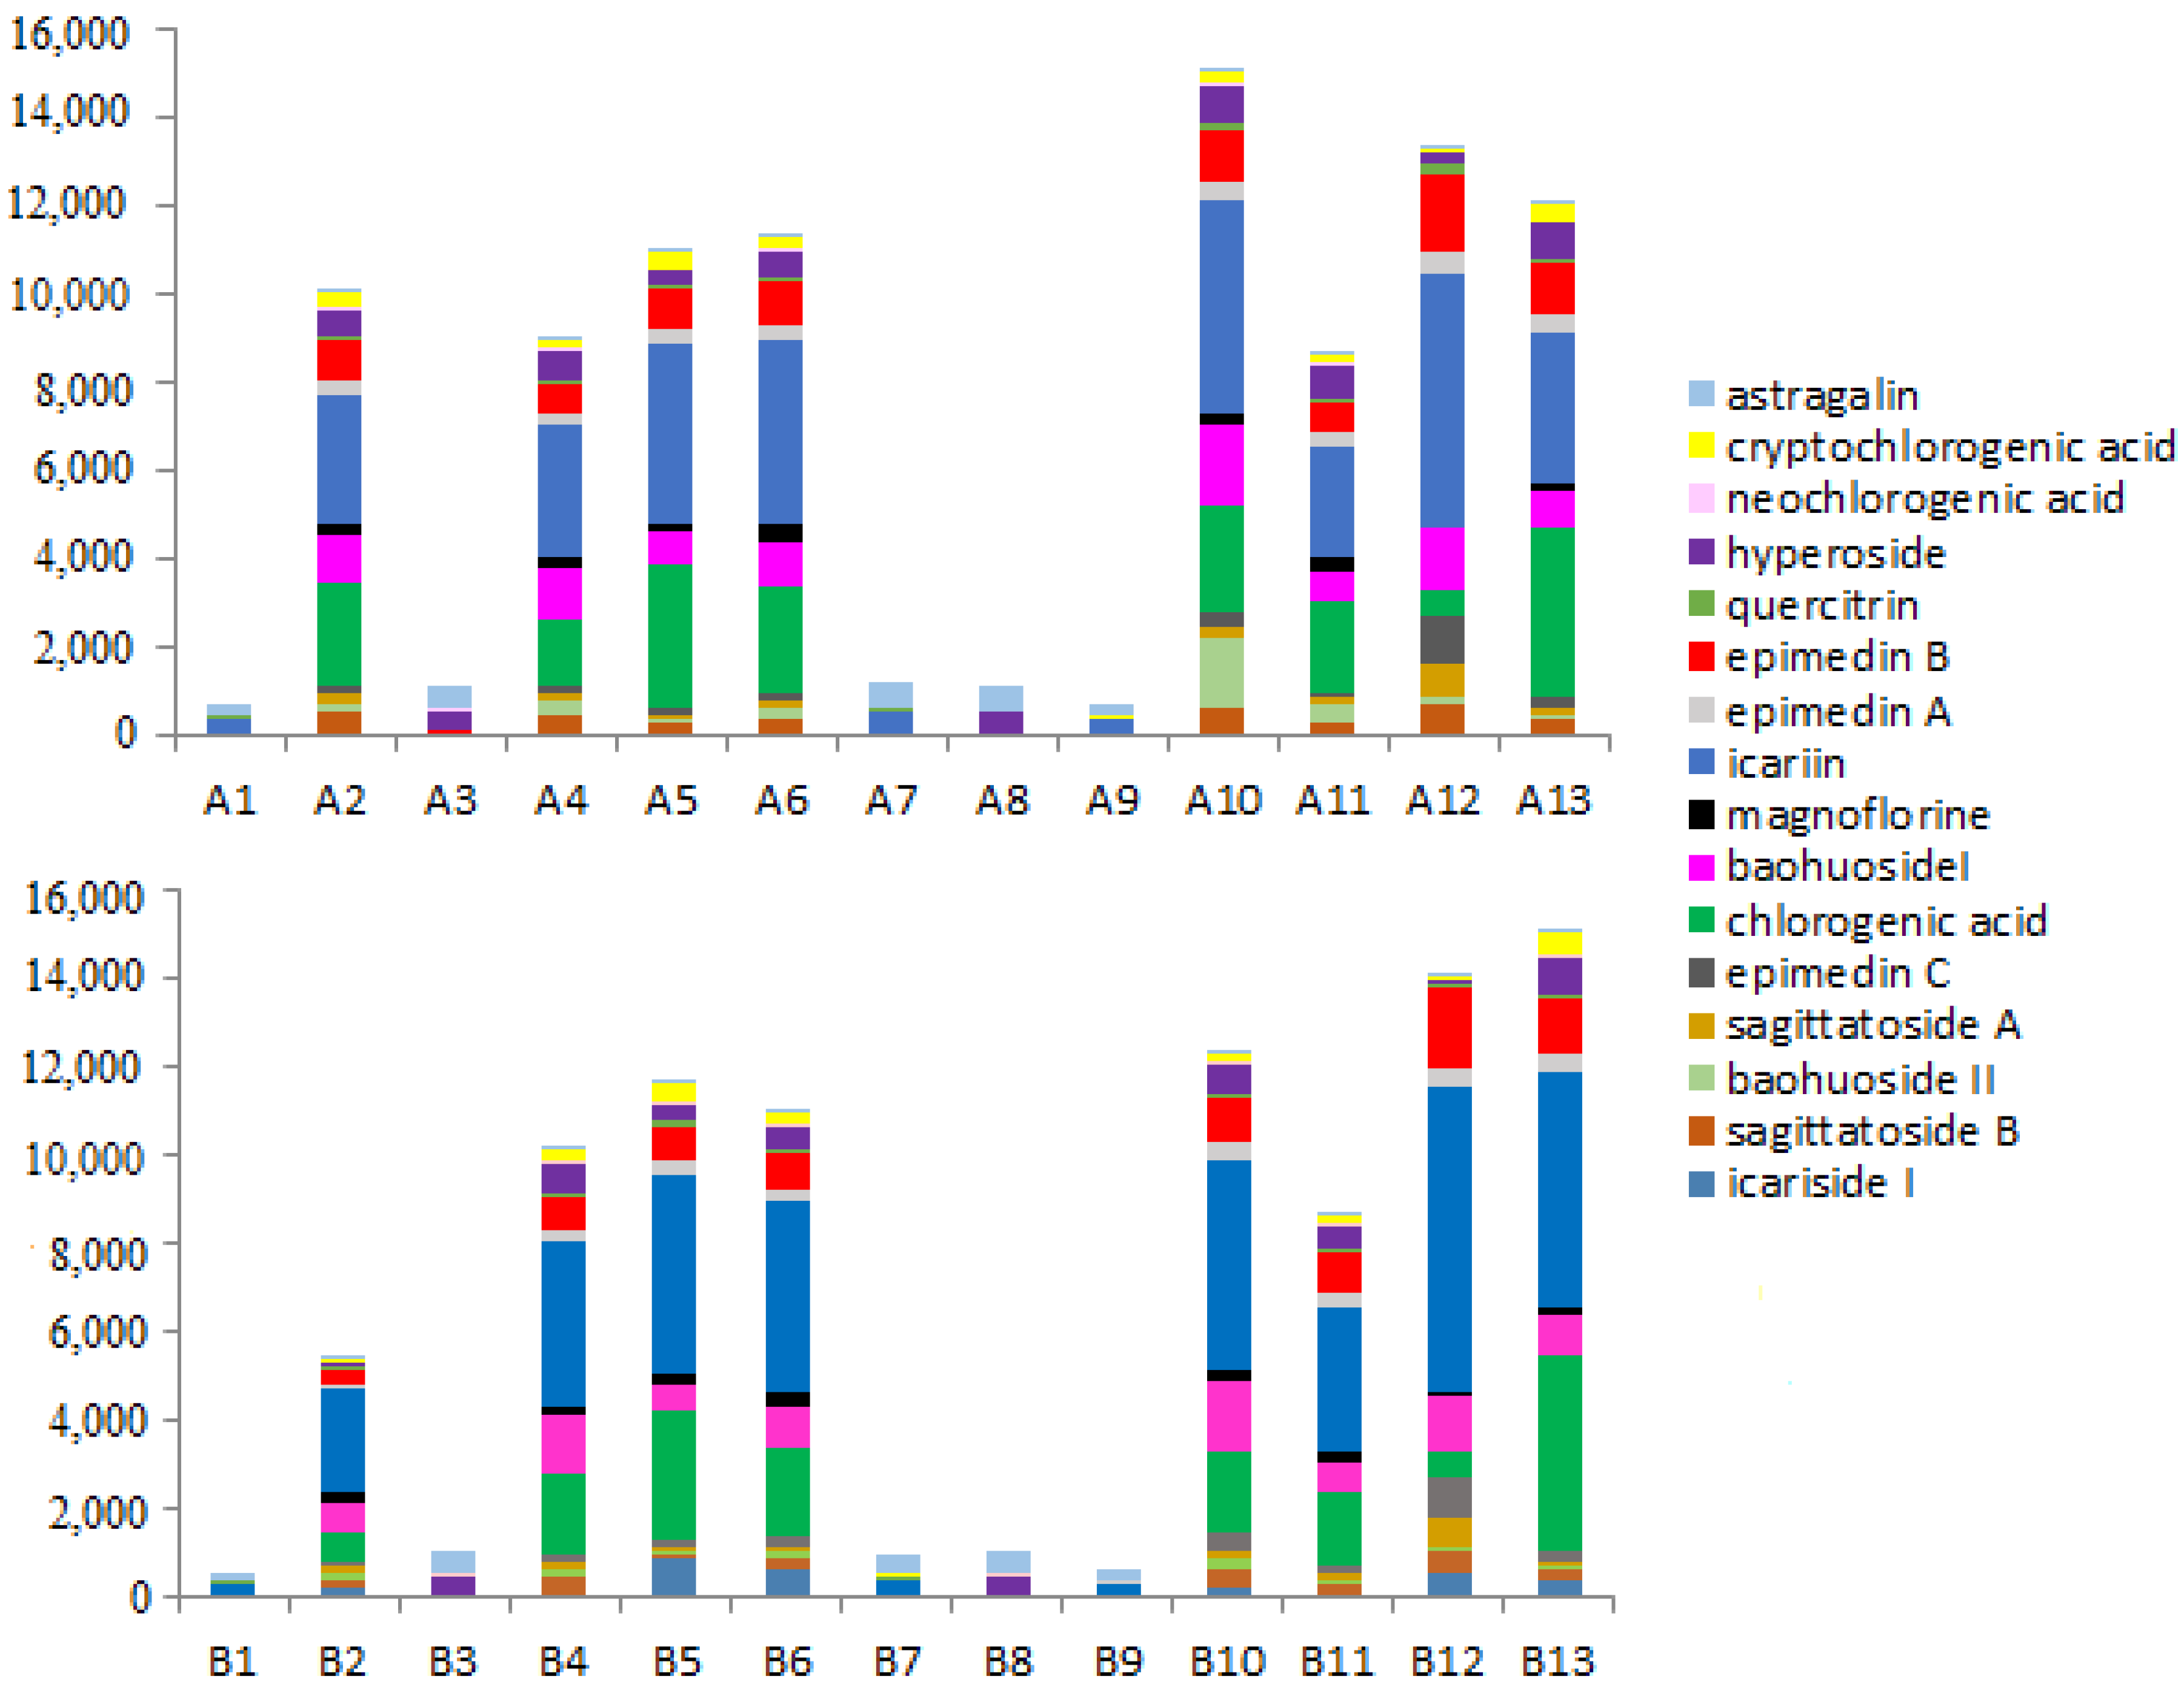
The differences of Epimedium were analyzed by PLS-DA. The method established the regression relationship between the matrixes, so as to get a better regression prediction result. When the supervised pattern recognition method was employed, the samples would divide into training and validation set. The classification model is obtained by training set, and the established model is used to predict the validation set. In the research, the validated method was applied to analyze Epimedium samples, including 13 batches of raw Epimedium samples (A1–A13) and 13 batches of processed Epimedium samples (B1–B13). A total of 16 compounds, including 12 flavonoids (hyperoside, epimedin A, epimedin C, sagittatoside B, baohuoside I, icariin, astragalin, quercitrin, baohuoside II, icariside I, epimedin B and sagittatoside A), 3 phenolic acids (chlorogenic acid, cryptochlorogenic acid, neochlorogenic acid) and 1 alkaloid (magnoflorine) were used to evaluate the changes of Epimedium after processing. The statistical performances of the models were evaluated by R2X, R2Y, and Q2. Statistical analysis was analyzed by SIMCA-P 12.0 software (Umetrics, Umea, Sweden).

 ,
, 


