Article

Preclinical Evaluation of Radiolabeled Peptides for PET Imaging of Glioblastoma Multiforme

Institute of Molecular and Translational Medicine, Faculty of Medicine and Dentistry, Palacky University Olomouc, 77900 Olomouc, Czech Republic
*
Authors to whom correspondence should be addressed.
Molecules 2019, 24(13), 2496; https://doi.org/10.3390/molecules24132496
Submission received: 7 June 2019 / Revised: 2 July 2019 / Accepted: 7 July 2019 / Published: 8 July 2019
(This article belongs to the Special Issue Analytical Chemistry in Clinical Studies and PET Developments)

Abstract

:
In this study, we have compared four 68Ga-labeled peptides (three Arg-Gly-Asp (RGD) peptides and substance-P) with two 18F-tracers clinically approved for tumor imaging. We have studied in vitro and in vivo characteristics of selected radiolabeled tracers in a glioblastoma multiforme tumor model. The in vitro part of the study was mainly focused on the evaluation of radiotracers stability under various conditions. We have also determined in vivo stability of studied 68Ga-radiotracers by analysis of murine urine collected at various time points after injection. The in vivo behavior of tested 68Ga-peptides was evaluated through ex vivo biodistribution studies and PET/CT imaging. The obtained data were compared with clinically used 18F-tracers. 68Ga-RGD peptides showed better imaging properties compared to 18F-tracers, i.e., higher tumor/background ratios and no accumulation in non-target organs except for excretory organs.

Graphical Abstract

1. Introduction

Glioblastoma multiforme (GBM) is an aggressive primary brain tumor and, despite the current intensive therapy regimen, median overall survival period is only 16–21 months from the date of diagnosis [1]. Therefore, early and precise diagnosis of GBM is a key aspect for appropriate patient care approach [2]. Imaging techniques play an important role in the diagnosis of GBM and subsequent disease monitoring. Although magnetic resonance imaging (MRI) is the first-line technique for GBM imagining, positron emission tomography (PET) is increasingly used in gliomas diagnosis as well [3,4]. The diagnostic information acquired with 18F-fluorodeoxyglucose (18F-FDG), the gold standard in clinical PET tumor imaging, is relatively variable; however, amino acid PET tracers, such as 11C-methionine (11C-MET), 18F-fluoro-L-DOPA (18F-FDOPA) or 18F-fluoroethyltyrosine (18F-FET) allow a more accurate glioma characterization [5]. The better tumor characterization could also be the case of more recent radiotracers developed for PET imaging of αvβ3 integrins [4,6]. αvβ3 integrin is highly expressed in glioma cells and generally in neovascular endothelial cells, in conjunction with tumor-related angiogenic processes [7]. The expression rate of αvβ3 integrin increases with the malignancy grade of the glioma and is particularly important in high-grade gliomas, where this integrin may facilitate tumor progression [8]. The radiotracers that bind αvβ3 integrin contain one or more tripeptide Arg-Gly-Asp (RGD) amino acid sequences providing high affinity towards αvβ3 integrins [9,10,11,12]. Although some of these RGD peptides were labeled with fluorine-18, this approach appears not to be convenient for practical use in terms of demanding radiochemical synthesis despite its great diagnostic potential [10,13].
The preparation of RGD peptides, labeled with radiometals like gallium-68 via a metal complexing approach, is much more straightforward in preclinical as well as in clinical settings [6,12]. Recently, RGD peptide coupled with a suitable macrocyclic chelator (e.g., dimeric 68Ga-NOTA-PRGD2 peptide) was successfully tested in human gliomas and showed better properties than 18F-FDG in differentiating high and low-grade gliomas [6]. Apart from RGD peptides and 18F-FDG, radiolabeled substance P that targets NK-1 receptors is another promising approach for imaging GMB [14]. In addition to the aforementioned tracers, there were also attempts to visualize glioblastoma with 18F-FLT [15].
Nevertheless, a comparison of 18F-FDG has never been performed to date with NODAGA-c(RGDyK)2, a dimeric RGD peptide employing NODAGA as the chelating moiety, with RGD monomer DOTA-c(RGDfK) and DOTA-substance P in preclinical GBM imaging. Despite the fact that the affinity for αvβ3 integrins is lower for monomeric and dimeric than multimeric RGD peptides, monomeric and dimeric RGD peptides usually have more favorable pharmacokinetic and imaging properties in vivo. The smaller size of mono- and dimeric RGD peptides result in faster pharmacokinetics and are often a more suitable biodistribution profile for tumor imaging [11,14]. In this study, we have focused on the preclinical evaluation of 68Ga-labeled peptides (DOTA-c(RGDfK), NODAGA-c(RGDyK), NODAGA-c(RGDyK)2, and DOTA-substance P) and comparison of their in vivo behavior with two clinically established 18F-based tumor radiotracers (18F-FDG and 18F-FLT) in a mouse xenograft model of human glioblastoma. Our glioblastoma model is based on U-87 MG cell line, a well-established tumor model expressing αvβ3 integrins and NK-1 receptors [16,17].

2. Results

2.1. Radiolabeling of Studied Peptides

The radiochemical purity of 68Ga-labeled peptides determined by HPLC was 95%. The lowest radiochemical purity of 96.3% was reported for 68Ga-DOTA-substance P, while the highest radiochemical purity of 99.8% was observed for 68Ga-DOTA-c(RGDfK)

2.2. In Vitro Characterization

The results of in vitro evaluation of 68Ga-labeled peptides are presented in Table 1. All four studied peptides appeared as hydrophilic entities having partition coefficient values around -3. The three studied RGD peptides showed low plasma protein binding values ranging from 1% to 3%, while substance P displayed slightly different results with approximately 29% fraction bound to the plasma proteins. Another tested in vitro parameter was the stability of 68Ga-peptides in the presence of an excess of Fe3+ (0.1 M FeCl3). RGD peptides showed high stability of 95–99% under these conditions. However, the stability of 68Ga-DOTA-substance-P in the presence of a competing metal was 79% after 120 min of incubation. In the presence of an excess concentration of another competing chelator (6 mM DTPA), RGD peptides displayed stability of 99%, while the stability of substance P decreased to 56% after 120 min of incubation. The results of stability test in neutral pH and human plasma were in the range of 98–99% for all four tested 68Ga-peptides (Table 1).

2.3. In Vitro Uptake

Uptake studies using U-87 MG cell line showed the accumulation of approximately 0.4–0.8% of the applied dose in cells, with the highest accumulation observed for 68Ga-NODAGA-c(RGDyK)2 and the lowest for 68Ga-DOTA-c(RGDfK) (Figure 1). The presence of an excess of a cold ligand resulted in the decrease of the uptake of radiolabeled ligand in all tested 68Ga-RGD peptides except 68Ga-DOTA-substance P, which had an uptake of 0.3% of the applied dose under both normal and blocked variants of the experiment. For details, see Figure 1.

2.4. In Vivo Stability of 68Ga-Peptides

The urine of animals injected with 68Ga-peptides was collected 30 and 90 min after the administration for HPLC analysis, and the respective radiochromatograms of 68Ga-peptides and urine are summarized in Figure 2. The HPLC analysis of 68Ga-RGD peptides compared to appropriate urine samples showed no major shift in the retention time and the shape of the chromatographic peaks is almost similar to the peaks of observed with original peptides and urine samples. The percentage of radiochemical impurities is practically negligible. However, the urine samples of animals injected with 68Ga-DOTA-substance P show a clear shift in the retention time of main peak (approximately 1 min) and appearance of new peaks suggesting the formation of more hydrophilic metabolites.

2.5. Ex Vivo Biodistribution

The biodistribution results were similar for all four tested 68Ga-peptides showing very low accumulation of the tracers in non-targeted tissues (Figure 3). The highest radioactive accumulation was registered in kidneys and ranged between 6–11% ID/g for 68Ga-RGD peptides and 15–17% for 68Ga-DOTA-substance P. In summary, all tested 68Ga-labeled peptides showed rapid pharmacokinetics with the main renal excretion route and very low accumulation in non-targeted tissues. Ex vivo biodistribution data for 18F-FDG displayed relatively low accumulation in non-targeted tissues (1–8% ID/g) with the exception of heart, where the accumulation reached 40% ID/g. 18F-fluorothymidine (18F-FLT) showed uniform accumulation and retention of 5–8% ID/g in all examined tissues for 30 and 90 min post injection (p.i.). Both 18F-tracers had relatively higher accumulation in non-targeted tissues and slower elimination from blood compared to 68Ga-compounds.
Comparative tumor to blood/kidney/muscle ratios were calculated from the data obtained from ex vivo biodistribution studies (Table 2). Tumor to blood ratios 30 min p.i. were in the range of 1–2.3 for all tested 68Ga-peptides. Ninety minutes p.i., the tumor to blood ratio values ranged from 14–23 for 68Ga-RGD peptides and 2.8 for 68Ga-substance P. Similarly, the tumor to blood ratio 30 min and 90 min p.i. for 18F-FDG was 2.0 for both time points and 1.1 and 2.4, respectively, for 18F-FLT.

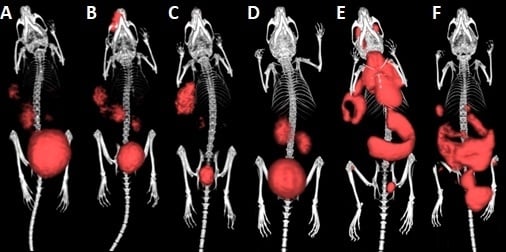
2.6. µPET/CT Imaging

PET/CT imaging of 68Ga-labeled peptides clearly showed the highest accumulation of tracer in the kidneys and bladder U-87 MG tumor xenografts were visualized with all three 68Ga-RGD peptides, with the highest accumulation of radioactivity noted for 68Ga-NODAGA-c(RGDyK)2. 68Ga-substance P did not visualize the tumor in any of the studied time intervals. PET/CT of U-87 MG tumor xenografts with 18F-FDG tracer allowed clear imaging of the tumor; however, high radioactivity signal was also observed in non-target tissues such as spleen, heart, brain, and brown adipose tissue. 18F-FLT PET/CT imaging of U-87 MG xenografted mice 90 min p.i. showed the accumulation of the tracer mainly in the gastrointestinal tract, spleen, and bladder. The tumor on the right flank of the animal could also be imaged with 18F-FLT. The acquired three-dimensional PET/CT images are shown in Figure 4. Using acquired PET data we have determined standard uptake values (SUV) for the tumor and brain regions and calculated tumor-to-brain ratios listed in Table 3. These ratios have ranged from 0.64 up to 4.70.

3. Discussion

MRI imaging and tumor biopsy still remain as the diagnostic gold standard for GBM. Nevertheless, various studies now confirm the diagnostic potential and advantages of PET imaging for GBM patients due to better tumor delineation or monitoring tumor progression [18,19]. Recently, radiolabeled RGD peptides were successfully used to image other human carcinomas with PET technology [20] and RGD-sequence peptides remain emerging candidates for glioblastoma imaging [21,22,23].
In the past 20 years, RGD peptides underwent relatively extensive preclinical development, beginning with 18F-based 18F-galacto-RGD peptide [12]. This promising tracer was substituted with 68Ga-labeled variants due to its better targeting properties and more simple synthesis. The cyclization of the structure and its multimerization was also part of the development, which indicated that dimerization of the structure and cyclic form show the best in vivo imaging results. The multimeric (four and more moieties) RGD structure has the disadvantage of slower pharmacokinetics and higher image background. Among the most studied RGD-based tracers, RGDyK and RGDfK sequences, the published data are more favorable towards RGyK due to its faster renal elimination [24]. To our knowledge, there are very few complex reports focusing on the comparison of traditional 18F-tracers with 68Ga-labeled RGD peptides for glioblastoma imaging. In this comparative study, we reveal the potential of 68Ga-RGD peptides under preclinical settings and show their advantages over clinically used 18F-FDG and 18F-FLT. We cover here the whole issue ranging from radiolabeling, in vitro characterization, in vivo biodistribution studies to PET/CT imaging of U-87 MG xenografted tumors in mice.
The radiolabeling of studied peptide tracers with 68Ga resulted in excellent radiochemical purity (97–99%) for all RGD peptides and slightly lower value for 68Ga-substance P (96%). DOTA modified tracers required elevated reaction temperatures (95 °C), while NODAGA-modified tracers provided excellent labeling results at room temperature. Log P values of all peptide tracers indicated that these molecules are highly hydrophilic, which was subsequently confirmed by animal experiments.
The plasma protein binding values of all three tested RGD peptides were very low (1–3%), except 68Ga-DOTA-substance P that showed a higher (about 29%) protein binding value, what is in accordance with previously published data [12]. Nevertheless, we did not register much higher blood levels of 68Ga-DOTA-substance P in animals compared to 68Ga-RGD peptides. In the presence of an excess of competing chelator (DTPA), all tested 68Ga-RGD peptides displayed excellent stability (99.06–99.65%), while 68Ga-DOTA-substance P had an average stability. The presence of an excessive amount of Fe3+ ions had lower effect on radiochemical purity, resulting in the lowest stability again for 68Ga-DOTA-substance P. These findings confirmed previously published data, indicating that NODAGA has better chelating properties for 68Ga3+ compared to DOTA [12]. Additionally, all 68Ga-peptides showed excellent stability under physiological pH and in human plasma, with a negligible decrease in the radiochemical purity. These findings are in general in accordance with previous published data [12].
The specificity of tracer binding to U-87 cells was tested by incubating the cells with an excess concentration of a cold tracer. The highest binding was detected for 68Ga-NODAGA-c(RGDyK)2, while 68Ga-DOTA-c(RGDfk) and 68Ga-DOTA-substance P showed the lowest uptake of about 50% compared to 68Ga-NODAGA-c(RGDyK)2. This is in accordance with previous studies that showed the benefits of multimerization and the superiority of RGDyK sequence over RGDfK [11,25]. The RGD dimer possesses higher cell binding property compared to monomer as shown by Li et al. [11]. Blocking the in vitro uptake of 68Ga-tracers by cold ligand was successful for all RGD peptides except 68Ga-DOTA-substance P, despite the fact that U-87 MG cells express neurokinin (NK1) receptor, the target of substance P [26].
Determination of in vivo stability of studied tracers in mice urine showed that RGD peptides are excreted in unchanged form, while 68Ga-DOTA-substance P is rapidly metabolized and excreted in different forms compared to the parent molecule. This is clearly visible in radiochromatograms (Figure 2), where the 68Ga-substance P peak is shifted and branched in urine samples. HPLC analysis of urine from 68Ga-RGD peptides-injected animals showed a similar radiochromatogram as radiolabeled peptide. These findings indicate that 68Ga-DOTA-substance P have a poor in vivo stability compared to other tested 68Ga-RGD peptides.
Ex vivo biodistribution studies revealed the highest uptake of 68Ga-tracers in kidneys as the principal organ of their excretion, where 68Ga-substance P had the highest uptake of 15% ID/g. The GBM tumors had relatively low uptake values of about 2% ID/g, except for 68Ga-NODAGA-c(RGDyK)2 with 6% ID/g for 30 min p.i. These findings are in accordance with previously published data by other research groups, where tumor accumulation for RGD peptides ranges from 2.5% to 4% ID/g [11,27]. Ex vivo biodistribution data for 68Ga-DOTA-substance P showed relatively low uptake across all studied organs with exception of kidneys, the tumor uptake 30 min p.i. was 2.14% ID/g; compared with the work of Mozaffari et al., we obtained very similar results. However, the tumor uptake in the article was 3.36% ID/g, i.e., higher when compared to our data, in what could be explained by the structural difference of studied compounds [28]. The accumulation of RGD peptides in tumors appears to be quite a fast process. This is indicated by the maximum tumor uptake of 68Ga-NODAGA-c(RGDyK)2 in 30 min p.i. Tumor to blood and tumor to muscle ratios are the best ex vivo parameters for prediction of an appropriate tumor to background contrast, which can result in suitable images. In this respect, 68Ga-NODAGA-c(RGDyK) showed the best tumor to blood ratio of 23.1 in 90 min p.i. All three tested 68Ga-RGD peptides revealed excellent tumor to blood ratios (14.7–23.1), in contrast to 68Ga-DOTA-substance P (2.8). The best results for tumor to muscle (background) ratio was observed for 68Ga-DOTA-c(RGDfK). 18F-FDG biodistribution displayed typical high uptake of the tracer in the heart (almost 42% ID/g) and also in the spleen, what is in line with published data [29]. Finally, 18F-FLT exhibited relatively uniform accumulation across all studied organs (4–6% ID/g). Nevertheless, this was expected according to the literature [30]. The decrease of tracer uptake between 30 and 90 min post injection was apparent, but it was not the case for spleen, intestine, bone and tumor, On the contrary to 68Ga-tracers, 18F-tracers had tumor to blood ratio of 2.0. Tumor to kidney ratio was low for all studied 68Ga-labeled compounds and all time points, where the lowest values were for 68Ga-DOTA-substance P. 18F-tracers had lower tumor to muscle ratios and higher tumor to kidney ratio in comparison to 68Ga-tracers. These results are fully in accordance with the main excretion route of all 68Ga-peptides.
In accordance with our ex vivo data, PET/CT imaging with 68Ga-tracers showed kidneys and bladder as the organs with the highest accumulation of radioactivity. However, the tumors were clearly visualized using the three studied 68Ga-RGD peptides. The best tumor images were obtained with 68Ga-NODAGA-c(RGDyK)2, whereas the other two 68Ga-RGD peptides displayed lower radioactivity signal in the tumor. These results are in concordance with PET RGD imaging data published by Li et al. and Provost et al. [11,23]. We did not observe any substantial signal in tumors with 68Ga-substance P. 18F-FDG PET scan was also in the line with our ex vivo data and previously published imaging data, showing predominant accumulation of radioactivity in the heart, spleen, tumor and interscapular brown adipose tissue [23]. Similarly, data from 18F-FLT PET imaging were in congruence with ex vivo results with the highest activity seen in the spleen, gastrointestinal tract, tumor, and largest bone tissue sites, such as knees, what confirms the findings published by Chan et al. [30]. The data gained from PET acquisitions were also used for the uptake quantification of the tracers in tumor and brain regions by calculation of standardized uptake values (SUV). Using the SUVs, we have calculated tumor to brain ratios in order to reveal potential tumor to background ratio for the situation of orthotopic glioblastoma. Interestingly, all the ratios ranged between 4 and 5 with the exception of 18F-FDG (0.64). These results suggest that 18F-FDG is not an appropriate tracer for intracranial tumor imaging because of the high background of the tissue. Surprisingly, 68Ga-DOTA-substance P had comparable tumor to brain ratio as 68Ga-RGD peptides and 18F-FLT; however, the SUVs were very low in both tumor and brain regions in the case of 68Ga-substance P. Among 68Ga-RGD peptides and 18F-FLT, all the tumor to brain ratios were very similar not preferencing any of the studied tracers. Nevertheless, the highest value (4.70) of tumor to brain ratio was registered for 68Ga-DOTA-c(RGDfK). In summary, 68Ga-RGD peptides showed much favorable kinetics and biodistribution compared to 18F-FDG and 18F-FLT. Despite relatively low tumor to blood ratio, tumors could be imaged on PET scans with 18F-tracers presumably due to the high tumor uptake.
The accumulation of radiolabeled RGD peptides as ligands of αvβ3 integrins reflect the expression rate of these receptors and the tracer could monitor tumor progression and its metastases [31]. The integrin receptors are saturable as was shown in our in vitro cell study. Therefore, it is important to inject the lowest possible dose (low molar amount of RGD peptide) to avoid saturation of target receptors with the cold fraction of the peptide and consecutive decrease in the detected signal in tumor tissues. In contrast to 68Ga-RGD peptides, 18F-tracers do not image the rate of integrin expression but only the metabolic rate of compounds (glucose or thymidine). The metabolic rate is also a very useful characteristic of a tumor and could be used to predict various biological characteristics [32].
In conclusion, our study confirmed αvβ3 integrins as a good target for GBM imaging using 68Ga-RGD peptides that have a favorably biodistribution profiles and a rapid pharmacokinetics. RGD peptides are very versatile and are not exclusive for GBM as they can image various other malignancies, such as breast cancer, rectal cancer, NSCLC. [33]. The possibility of radiolabeling 68Ga-labeled RGD peptides in laboratories without the need an on-site cyclotron facility give them an undisputed advantage over 18F-tracers.

4. Materials and Methods

4.1. Chemicals

All reagents were purchased from commercial sources as analytical grade and used without further purification. Two clinically used radiopharmaceuticals were employed in this study, 18F-fluorotymidine (RadioMedic, Rez, Czech Republic) and 18F-fluorodeoxyglucose (UJV, Rez, Czech Republic), for comparison with non-RGD peptide DOTA-substance P and RGD peptides coupled with chelators, namely DOTA-c(RGDfK), NODAGA-c(RGDyK) and NODAGA-c(RGDyK)2. and. All “cold” peptides were purchased from ABX-Advanced biochemical compounds (Radeberg, Germany) with >95% purity. The structures of these four peptides are shown in Figure 5. 68GaCl3 was eluted from a 68Ge/68Ga generator (Eckert & Ziegler Eurotope GmbH, Berlin, Germany) with 0.1 N HCl using a fractionated elution approach.

4.2. Radiolabeling and in Vitro Characterization of Studied Peptides

Gallium-68 was obtained from 68Ge/68Ga generator (Eckert & Ziegler, Berlin, Germany) by elution with 0.1 M HCl (Sigma Aldrich, St. Louis, MO, USA). The optimal 68Ga-labeling conditions for all peptides were evaluated as follows: 5 μg of peptide (1 μg/μL) dissolved in LC-MS ultrapure water (Sigma Aldrich, St. Louis, MO, USA) mixed with 30 μL of 1.14 M sodium acetate trihydrate (Merck, Darmstadt, Germany) and with 300 µL of 68Ga eluate. The mixture was incubated for 10 min at RT for RGD peptides with NODAGA and at 90 °C for DOTA modified tracer. For substance P, the labeling conditions were slightly different: 10 μg of substance P, temperature of 95 °C, incubation time of 15 min. The radiochemical purity of 68Ga-peptides was determined by HPLC analysis employing gradient elution (water to acetonitrile). The HPLC method was described in detail previously [12].

4.2.1. Stability in the Presence of Competing Metal

50 μL of 68Ga-labeled peptides were mixed with 150 μL of 0.1 mM FeCl3 (Sigma Aldrich, St. Louis, MO, USA). The mixture was incubated at 37 °C and the samples for HPLC analysis to determine the radiochemical purity were taken at selected time points (30, 60 and 120 min) and directly injected on HPLC.

4.2.2. Stability in the Presence of Competing Chelator

50 μL of 68Ga-labeled peptides were mixed with 150 μL of 6 mM DTPA solution (Sigma Aldrich, St. Louis, MO, USA). The mixture was then incubated at 37 °C and the samples were processed for HPLC analysis to determine the radiochemical purity were taken at selected time points (30, 60, and 120 min) and directly injected on HPLC.

4.2.3. Stability in Physiological pH

The peptides were labeled as described above. Subsequently, 100 μL of 1.14 M sodium acetate was added to adjust the pH to 7.0. The mixture was incubated at 37 °C and the samples for HPLC analysis to determine the radiochemical purity were taken at selected time points (30, 60, and 120 min) and directly injected on HPLC.

4.2.4. Plasma Stability

100 μL of the labeled peptide was mixed with 400 μL of human plasma (Sigma Aldrich, St. Louis, MO, USA). This mixture was incubated at 37 °C and the samples for HPLC analysis to determine the radiochemical purity were taken at selected time points (30, 60, and 120 min). The individual samples were adjusted before the injection on HPLC—every sample was mixed with acetonitrile (Roth, Karlsruhe, Germany) and placed on the shaker (450 rpm) for 60 s and then centrifuged (20,000 RCF, 3 min), followed by removing the supernatant. Finally, the supernatant was analyzed using HPLC.

4.2.5. Determination of Partition Coefficient (Log P)

Labeled peptide was diluted with 600 μL of phosphate-buffered saline (PBS), and 50 µL of the solution was mixed in the test tube with 450 μL of PBS and 500 μL of octanol. The sample was placed on the shaker (1000 RPM) for 20 min and then centrifuged at 15,000 RPM for 1 min. Subsequently, 50 µL from both octanol and water layer were collected and measured on an automatic gamma counter (PerkinElmer, Waltham, Massachusetts, USA). Partition coefficient was calculated as the decadic logarithm of the ratio of octanol/water activity.

4.2.6. Plasma Protein Binding

10 µL of the labeled peptide was mixed with 190 μL of human plasma (Sigma Aldrich, St. Louis, MO, USA), and incubated at 37 °C. Twenty-five µL of sample were collected at 30, 60, and 120 min time intervals for the determination of protein binding. The samples were separated by size-exclusion chromatography (illustra MicroSpin G-50 Column, GE Healthcare, UK) by centrifugation (2000 × g, 1 min). The eluate (protein-bound) and appropriate column (non-protein-bound) were measured on an automatic gamma counter. The percentage of plasma protein binding (PPB) was calculated as the ratio of the activity in the eluate and the activity of the whole sample (column plus the eluate). The blank determination of protein binding, i.e., incubation of the radiotracer in PBS buffer followed by separation of the sample on gel column was performed as the control step.

4.2.7. Determination of Metabolic Stability in Vivo

The experimental animals were intravenously injected with tested radiolabeled peptides (5 MBq corresponding to 1 μg of the peptide per animal) and urine was collected 30 and 90 min post-injection. The urine samples were directly analyzed on HPLC using the same method as for other stability assays. The obtained radiochromatograms were compared with the radiochromatograms of studied 68Ga-peptides. The goal of this experiment was to determine whether the peptides are metabolized in vivo or are excreted in unchanged form.

4.3. Cell Culture and Cell Uptake Assay

Human glioblastoma multiforme U-87 MG cells (ATCC, Manassas, VA, USA) were cultured in Dulbecco’s Modified Eagle Medium (Sigma Aldrich, St. Louis, MO, USA) supplemented with 10% fetal bovine serum, 0.1 mM non-essential amino acids and 1.0 mM sodium pyruvate at 37 °C in a 5% carbon dioxide humidified incubator. The cells were subcultured and used for experiments at a confluency of 70–90%.
Cell uptake assay was performed in 24-well plates with U-87 MG cell at high confluency. The assay itself was carried out using a dedicated buffer instead of the regular cell culture media. The buffer consists of 25 mM Tris/HCl, 5.4 mM KCl, 1.8 mM CaCl2, 0.8 mM MgSO4, 5 mM glucose, 140 mM NaCl in H2O [34].
The cells were incubated with 68Ga-labeled RGD peptides (20 µM) alone and also with excess (2 mM) of cold RGD peptide for 90 min (37 °C) in the buffer described above. The cells were rinsed with PBS, lysed in 0.1 M NaOH and measured for radioactivity in a gamma counter (PerkinElmer, Waltham, Massachusetts, USA). The uptake was calculated as the mean of the percentage of the applied dose ± standard deviation.

4.4. Tumor Xenografts

SCID female mice (Harlan, Indianapolis, IN, USA) at 6–8 weeks of age were subcutaneously injected into the right flank with 5 × 10⁶ U-87 MG cells mixed with Matrigel Matrix (Corning, Corning, NY, USA) at a 1:1 ratio. The tumor growth was continuously monitored by caliperation. When the tumor volume reached 100–300 mm3 (i.e., 6–8 weeks after inoculation of cells), the mice were used for ex vivo biodistribution studies or µPET/CT imaging. The experimental animals were housed in a specific-pathogen-free animal facility. All experiments with animals were performed in accordance with appropriate legal norms (Czech Law No. 246/1992) and with the approval of Ministry of Education, Youth and Sports (MSMT-18933/2013-1 and MSMT-22421/2013-12) and approval of Ethical committee of Faculty of Medicine and Dentistry, Palacky University in Olomouc. The number of animals was reduced as much as possible (n = 3 per group and time point) for all in vivo experiments. The tracer injection and small animal imaging were carried out under 2% isoflurane anesthesia (FORANE, Abbott Laboratories, Abbott Park, IL, USA) to minimize animal suffering and to prevent animal motion.

4.5. Ex Vivo Biodistribution

For ex vivo biodistribution studies, radiolabeled tracers were diluted with saline. The prepared solutions were applied retro-orbitally (r.o.) to the mice [35] at a dose of 1–2 MBq per mouse corresponding to 0.2–0.4 µg of the peptide. The mice were sacrificed by cervical dislocation 30 min and 90 min post-injection and organs of interest (blood, spleen, pancreas, stomach, intestine, kidneys, liver, heart, lungs, muscle, bone, and tumor) were collected. The samples were weighed and the radioactivity was measured by an automatic gamma counter. The accumulation of radiotracer in studied organs was expressed as a percentage of injected dose per gram of organ.

4.6. µPET/CT Imaging

Experimental animals were imaged using microPET/SPECT/CT system Albira (Bruker, Billerica, Massachusetts, USA). Mice were r.o. injected with the radiolabeled tracer at a dose of 5–10 MBq (corresponding to 1–2 μg of peptide for animals injected with 68Ga-peptides) per animal. Anesthetized animals were placed in a prone position in the Albira system before the start of imaging. Static PET/CT images were acquired over 30 min interval starting 30 and 90 minutes after injection. A 10-min PET scan (axial FOV 148 mm) was performed, followed by a double CT scan (axial FOV 65 mm, 45 kVp, 400 μA, at 400 projections). Scans were reconstructed with the Albira software (Bruker Biospin Corporation, Woodbridge, CT, USA) using the maximum likelihood expectation maximization (MLEM) and filtered back-projection (FBP) algorithms. The PMOD software (PMOD Technologies, Zurich, Switzerland) was used for the image analysis and tracer uptake quantification. Three-dimensional volume rendered images were created in VolView software (Kitware, Clifton Park, NY, USA). The data obtained by PET scan were quantified in PMOD via manually selected volumes of interest (VOIs) and expressed as standardized uptake values (SUV). Using SUVs for the tumor and brain regions the tumor to brain ratios were calculated.

5. Conclusions

Studied 68Ga-RGD peptides displayed excellent in vitro characteristics as well as in vivo behavior; on the contrary, 68Ga-DOTA-substance P failed in the in vivo stability test and was not able to image the tumor. In vivo comparison of 68Ga-RGD peptides with 18F-FDG and 18F-FLT in glioblastoma tumor model in mice revealed better imaging properties for 68Ga-RGD peptides. 68Ga-RGD peptides showed higher tumor to background ratio and a low accumulation in non-target organs except the excretory organs. These properties make 68Ga-RGD peptides, in particular, 68Ga-NODAGA-c(RGDyK)2, more suitable for preclinical imaging of GBM than clinically used 18F-tracers.

Author Contributions

Conceptualization, M.P. (Milos Petrik); Data curation, Z.N., J.S., M.H. and D.F.; Investigation, J.S., M.H., D.F., M.P. (Miroslav Popper) and M.P. (Milos Petrik); Methodology, M.P. (Milos Petrik); Project administration, M.P. (Miroslav Popper); Visualization, Z.N.; Writing – original draft, Z.N.; Writing – review & editing, M.P. (Milos Petrik)

Funding

This research was funded by the Czech Ministry of Education, Youth and Sports, projects No. LO1304 and LM2015064.

Acknowledgments

We gratefully acknowledge Jarmila Drymlova and Radek Navratil from Nuclear Medicine Department of University Hospital Olomouc for technical support. We thank all staff from the Animal Facilities of Institute of Molecular and Translational Medicine of Faculty of Medicine and Dentistry of Palacky University in Olomouc for taking care of the animals. We would like to express our gratitude to Viswanath Das for language revision of the manuscript.

Conflicts of Interest

The authors declare no conflict of interest.

References

  1. Ladomersky, E.; Scholtens, D.M.; Kocherginsky, M.; Hibler, E.A.; Bartom, E.T.; Otto-Meyer, S.; Zhai, L.; Lauing, K.L.; Choi, J.; Sosman, J.A.; et al. The Coincidence Between Increasing Age, Immunosuppression, and the Incidence of Patients With Glioblastoma. Front. Pharmacol. 2019, 10, 200. [Google Scholar] [CrossRef] [PubMed]
  2. Ahmed, R.; Oborski, M.J.; Hwang, M.; Lieberman, F.S.; Mountz, J.M. Malignant gliomas: current perspectives in diagnosis, treatment, and early response assessment using advanced quantitative imaging methods. Cancer Manag. Res. 2014, 6, 149–170. [Google Scholar] [PubMed]
  3. Frosina, G. Positron emission tomography of high-grade gliomas. J. Neuro Oncol. 2016, 127, 415–425. [Google Scholar] [CrossRef] [PubMed]
  4. Frosina, G. Non-routine tracers for PET imaging of high-grade glioma. Anticancer Res. 2016, 36, 3253–3260. [Google Scholar] [PubMed]
  5. Chen, W. Clinical Applications of PET in Brain Tumors. J. Nucl. Med. 2007, 48, 1468–1481. [Google Scholar] [CrossRef] [Green Version]
  6. Li, D.; Zhao, X.; Zhang, L.; Li, F.; Ji, N.; Gao, Z.; Wang, J.; Kang, P.; Liu, Z.; Shi, J.; et al. 68Ga-PRGD2 PET/CT in the Evaluation of Glioma: A Prospective Study. Mol. Pharm. 2014, 11, 3923–3929. [Google Scholar] [CrossRef] [PubMed] [Green Version]
  7. Schnell, O.; Krebs, B.; Wagner, E.; Romagna, A.; Beer, A.J.; Grau, S.J.; Thon, N.; Goetz, C.; Kretzschmar, H.A.; Tonn, J.C.; et al. Expression of integrin alphavbeta3 in gliomas correlates with tumor grade and is not restricted to tumor vasculature. Brain Pathol. 2008, 18, 378–386. [Google Scholar] [CrossRef]
  8. Holmes, K.M.; Annala, M.; Chua, C.Y.X.; Dunlap, S.M.; Liu, Y.; Hugen, N.; Moore, L.M.; Cogdell, D.; Hu, L.; Nykter, M.; et al. Insulin-like growth factor-binding protein 2-driven glioma progression is prevented by blocking a clinically significant integrin, integrin-linked kinase, and NF-κB network. Proc. Natl. Acad. Sci. USA 2012, 109, 3475–3480. [Google Scholar] [CrossRef]
  9. Nieberler, M.; Reuning, U.; Reichart, F.; Notni, J.; Wester, H.-J.; Schwaiger, M.; Weinmüller, M.; Räder, A.; Steiger, K.; Kessler, H. Exploring the Role of RGD-Recognizing Integrins in Cancer. Cancers 2017, 9, 116. [Google Scholar] [CrossRef]
  10. Haubner, R.; Weber, W.A.; Beer, A.J.; Vabuliene, E.; Reim, D.; Sarbia, M.; Becker, K.F.; Goebel, M.; Hein, R.; Wester, H.J.; et al. Noninvasive visualization of the activated alphavbeta3 integrin in cancer patients by positron emission tomography and [18F]Galacto-RGD. PLoS Med. 2005, 2, e70. [Google Scholar] [CrossRef]
  11. Li, Z.B.; Chen, K.; Chen, X. (68)Ga-labeled multimeric RGD peptides for microPET imaging of integrin alpha(v)beta (3) expression. Eur. J. Nucl. Med. Mol. Imaging 2008, 35, 1100–1108. [Google Scholar] [CrossRef] [PubMed]
  12. Knetsch, P.A.; Petrik, M.; Griessinger, C.M.; Rangger, C.; Fani, M.; Kesenheimer, C.; Von Guggenberg, E.; Pichler, B.J.; Virgolini, I.; Decristoforo, C.; et al. [68Ga]NODAGA-RGD for imaging αvβ3 integrin expression. Eur. J. Nucl. Med. Mol. Imaging 2011, 38, 1303–1312. [Google Scholar] [CrossRef] [PubMed]
  13. Haubner, R.; Kuhnast, B.; Mang, C.; Weber, W.A.; Kessler, H.; Wester, H.-J.; Schwaiger, M. [18F]Galacto-RGD: Synthesis, Radiolabeling, Metabolic Stability, and Radiation Dose Estimates. Bioconjugate Chem. 2004, 15, 61–69. [Google Scholar] [CrossRef] [PubMed]
  14. Rangger, C.; Helbok, A.; Sosabowski, J.; Kremser, C.; Koehler, G.; Prassl, R.; Andreae, F.; Virgolini, I.J.; Von Guggenberg, E.; Decristoforo, C.; et al. Tumor targeting and imaging with dual-peptide conjugated multifunctional liposomal nanoparticles. Int. J. Nanomed. 2013, 8, 4659–4671. [Google Scholar] [CrossRef] [PubMed] [Green Version]
  15. Brahm, C.G.; Hollander, M.W.D.; Enting, R.H.; De Groot, J.C.; Solouki, A.M.; Dunnen, W.F.A.D.; Heesters, M.A.A.M.; Wagemakers, M.; Verheul, H.M.W.; De Vries, E.G.E.; et al. Serial FLT PET imaging to discriminate between true progression and pseudoprogression in patients with newly diagnosed glioblastoma: a long-term follow-up study. Eur. J. Nucl. Med. Mol. Imaging 2018, 45, 2404–2412. [Google Scholar] [CrossRef] [PubMed] [Green Version]
  16. Muñoz, M.; Coveñas, R.; Esteban, F.; Redondo, M. The substance P/NK-1 receptor system: NK-1 receptor antagonists as anti-cancer drugs. J. Biosci. 2015, 40, 441–463. [Google Scholar] [CrossRef]
  17. Isal, S.; Pierson, J.; Imbert, L.; Clement, A.; Collet, C.; Pinel, S.; Veran, N.; Reinhard, A.; Poussier, S.; Gauchotte, G.; et al. PET imaging of 68Ga-NODAGA-RGD, as compared with 18F-fluorodeoxyglucose, in experimental rodent models of engrafted glioblastoma. EJNMMI Res. 2018, 8, 51. [Google Scholar] [CrossRef] [PubMed]
  18. Delgado-López, P.D.; Riñones-Mena, E.; Corrales-García, E.M. Treatment-related changes in glioblastoma: A review on the controversies in response assessment criteria and the concepts of true progression, pseudoprogression, pseudoresponse and radionecrosis. Clin. Transl. Oncol. 2018, 20, 939–953. [Google Scholar] [CrossRef]
  19. Lohmann, P.; Stavrinou, P.; Lipke, K.; Bauer, E.; Ceccon, G.; Werner, J.; Neumaier, B.; Fink, G.; Shah, N.; Langen, K.; et al. FET PET reveals considerable spatial differences in tumour burden compared to conventional MRI in newly diagnosed glioblastoma. 57. Jahrestag. der Dtsch. Ges. für Nukl. 2019, 58, V54. [Google Scholar] [Green Version]
  20. Van Der Gucht, A.; Pomoni, A.; Jreige, M.; Allemann, P.; Prior, J.O. 68Ga-NODAGA-RGDyK PET/CT Imaging in Esophageal Cancer: First-in-Human Imaging. Clin. Nucl. Med. 2016, 41, e491–e492. [Google Scholar] [CrossRef]
  21. Zhai, C.; Franssen, G.M.; Petrik, M.; Laverman, P.; Summer, D.; Rangger, C.; Haubner, R.; Haas, H.; Decristoforo, C. Comparison of Ga-68-Labeled Fusarinine C-Based Multivalent RGD Conjugates and [68Ga]NODAGA-RGD—In Vivo Imaging Studies in Human Xenograft Tumors. Mol. Imaging Boil. 2016, 18, 758–767. [Google Scholar] [CrossRef] [PubMed]
  22. Shi, X.; Shen, L. Integrin αvβ3 receptor targeting PET/MRI dual-modal imaging probe based on the 64Cu labeled manganese ferrite nanoparticles. J. Inorg. Biochem. 2018, 186, 257–263. [Google Scholar] [CrossRef] [PubMed]
  23. Provost, C.; Rozenblum-Beddok, L.; Nataf, V.; Merabtene, F.; Prignon, A.; Talbot, J.N. [68Ga]RGD Versus [18F]FDG PET Imaging in Monitoring Treatment Response of a Mouse Model of Human Glioblastoma Tumor with Bevacizumab and/or Temozolomide. Mol. Imaging Biol. 2019, 21, 297–305. [Google Scholar] [CrossRef] [PubMed]
  24. Eo, J.S.; Jeong, J.M. Angiogenesis Imaging Using 68Ga-RGD PET/CT: Therapeutic Implications. Semin. Nucl. Med. 2016, 46, 419–427. [Google Scholar] [CrossRef] [PubMed]
  25. Chen, X.; Liu, S.; Hou, Y.; Tohme, M.; Park, R.; Bading, J.R. MicroPET imaging of breast cancer alphav-integrin expression with 64Cu-labeled dimeric RGD peptides. Mol. Imaging Biol. 2004, 6, 350–359. [Google Scholar] [CrossRef] [PubMed]
  26. Burmeister, A.R.; Johnson, M.B.; Chauhan, V.S.; Moerdyk-Schauwecker, M.J.; Young, A.D.; Cooley, I.D.; Martinez, A.N.; Ramesh, G.; Philipp, M.T.; Marriott, I. Human microglia and astrocytes constitutively express the neurokinin-1 receptor and functionally respond to substance P. J. Neuroinflammation 2017, 14, 245. [Google Scholar] [CrossRef]
  27. Liu, S.; Liu, Z.; Chen, K.; Yan, Y.; Watzlowik, P.; Wester, H.J.; Chin, F.T.; Chen, X. 18F-abeled galacto and PEGylated RGD dimers for PET imaging of αvβ3 integrin expression. Mol. Imaging Biol. 2010, 12, 530–538. [Google Scholar] [CrossRef]
  28. Mozaffari, S.; Erfani, M.; Beiki, D.; Daha, F.J.; Kobarfard, F.; Balalaie, S.; Fallahi, B. Synthesis and preliminary evaluation of a new (99m)tc labeled substance p analogue as a potential tumor imaging agent. Iran. J. Pharm. Res. 2015, 14, 97–110. [Google Scholar] [PubMed]
  29. Rinne, P.; Silvola, J.M.U.; Hellberg, S.; Ståhle, M.; Liljenbäck, H.; Salomäki, H.; Koskinen, E.; Nuutinen, S.; Saukko, P.; Knuuti, J.; et al. Pharmacological Activation of the Melanocortin System Limits Plaque Inflammation and Ameliorates Vascular Dysfunction in Atherosclerotic Mice. Arter. Thromb. Vasc. Boil. 2014, 34, 1346–1354. [Google Scholar] [CrossRef] [PubMed] [Green Version]
  30. Chan, S.R.; Salem, K.; Jeffery, J.; Powers, G.L.; Yan, Y.; Shoghi, K.I.; Mahajan, A.M.; Fowler, A.M. Sex as a Biologic Variable in Preclinical Imaging Research: Initial Observations with 18F-FLT. J. Nucl. Med. 2018, 59, 833–838. [Google Scholar] [CrossRef]
  31. Monaco, A.; Zoete, V.; Alghisi, G.C.; Rüegg, C.; Michelin, O.; Prior, J.; Scapozza, L.; Seimbille, Y. Synthesis and in vitro evaluation of a novel radioligand for αvβ3 integrin receptor imaging: [18F]FPPA-c(RGDfK). Bioorg. Med. Chem. Lett. 2013, 23, 6068–6072. [Google Scholar] [CrossRef] [PubMed]
  32. Xu, H.-L.; Li, M.; Zhang, R.-J.; Jiang, H.-J.; Zhang, M.-Y.; Li, X.; Wang, Y.-Q.; Pan, W.-B. Prediction of tumor biological characteristics in different colorectal cancer liver metastasis animal models using 18 F-FDG and 18 F-FLT. Hepatobiliary Pancreat. Dis. Int. 2018, 17, 140–148. [Google Scholar] [CrossRef] [PubMed]
  33. Liu, J.; Yuan, S.; Wang, L.; Sun, X.; Hu, X.; Meng, X.; Yu, J. Diagnostic and Predictive Value of Using RGD PET/CT in Patients with Cancer: A Systematic Review and Meta-Analysis. BioMed Res. Int. 2019, 2019, 1–15. [Google Scholar] [CrossRef] [PubMed] [Green Version]
  34. Müller, S.A.; Holzapfel, K.; Seidl, C.; Treiber, U.; Krause, B.J.; Senekowitsch-Schmidtke, R. Characterization of choline uptake in prostate cancer cells following bicalutamide and docetaxel treatment. Eur. J. Nucl. Med. Mol. Imaging 2009, 36, 1434–1442. [Google Scholar] [CrossRef] [PubMed]
  35. Yardeni, T.; Eckhaus, M.; Morris, H.D. Retro-orbital injections in mice. Lab Anim. 2011, 40, 155–160. [Google Scholar] [CrossRef] [PubMed] [Green Version]
Sample Availability: Samples of the compounds are not available from the authors.
Figure 1. Accumulation of labeled peptides in normal U-87 MG cells (black bars) and U-87 MG cells blocked with an excess of appropriate “cold” RGD peptide (red bars). Data are presented as the mean of the percentage of applied dose ± standard deviation (n = 4).
Molecules 24 02496 g001
Figure 2. HPLC radiochromatograms of (A) 68Ga-DOTA-c(RGDfK), (B) 68Ga-NODAGA-c(RGDyK), (C) 68Ga-NODAGA-c(RGDyK)2, and (D) 68Ga-DOTA-substance P. The upper line in every chromatogram represents the tracer before the application to animals; the other two are samples of urine 30 min p.i. and 90 min p.i.
Molecules 24 02496 g002
Figure 3. Ex vivo biodistribution of 68Ga-peptides and 18F-tracers in U-87 MG tumor SCID mouse 30 and 90 min p.i. The data are presented as the mean of the percentage of injected dose per gram of organ ± standard deviation (n = 3).
Molecules 24 02496 g003
Figure 4. 3D volume rendered PET/CT images of (A) 68Ga-DOTA-c(RGDfK), (B) 68Ga-NODAGA-c(RGDyK), (C) 68Ga-NODAGA-c(RGDyK)2, (D) 68Ga-DOTA-substance P, (E) 18F-FDG and (F) 18F-FLT in mice bearing U-87 MG xenograft tumor on the right flank 90 min p.i. of the tracer. Yellow arrows are indicating the position of the tumor.
Molecules 24 02496 g004
Figure 5. The chemical structures of tested peptides coupled with respective chelators. (A) DOTA-c(RGDfK), (B) NODAGA-c(RGDyK), (C) NODAGA-c(RGDyK)2, and (D) DOTA-substance P.
Molecules 24 02496 g005
Table 1. In vitro characterization of tested peptides. Partition coefficient (log P), human plasma protein binding and in vitro stability of 68Ga-peptides under various conditions presented as the mean of radiochemical purity ± standard deviation (n = 3 and n = 1 for 68Ga-DOTA-substance P) at different time points.
The PeptideLog PIncubation TimePlasma Protein Binding (%)% Stability in 0.1 M FeCl3% Stability in 6 mM DTPA % Stability in pH 7 % Stability in Plasma
68Ga-DOTA-c(RGDfK)−3.43 ± 0.1130 min2.3997.04 ± 1.2499.39 ± 0.4399.60 ± 0.2399.23 ± 0.18
60 min2.6596.76 ± 1.2199.39 ± 0.5499.51 ± 0.1399.14 ± 0.19
120 min3.2995.83 ± 1.0499.06 ± 0.5799.49 ± 0.2098.81 ± 0.33
68Ga-NODAGA-c(RGDyK)−3.05 ± 0.6230 min2.7499.24 ± 0.4499.65 ± 0.0799.82 ± 0.0599.23 ± 0.18
60 min1.3198.56 ± 0.6099.20 ± 0.3799.78 ± 0.1299.14 ± 0.19
120 min3.2198.94 ± 0.4299.23 ± 0.3299.72 ± 0.2298.81 ± 0.33
68Ga-NODAGA-c(RGDyK)2−3.34 ± 0.1330 min1.7498.66 ± 0.8299.39 ± 0.4399.83 ± 0.1199.51 ± 0.17
60 min1.8999.22 ± 0.1999.39 ± 0.5499.74 ± 0.1899.31 ± 0.11
120 min3.4099.17 ± 0.1899.06 ± 0.5799.62 ± 0.2199.02 ± 0.33
68Ga-DOTA-substance P−3.03 ± 0.3330 min22.3588.473.498.298.2
60 min24.4985.163.198.198.2
120 min29.2178.856.198.198.0
Table 2. Tumor to blood, tumor to muscle and tumor to kidney ratios calculated from ex vivo biodistribution data for four studied 68Ga-peptides and two 18F-tracers. Every tracer was evaluated at two times points of 30 min and 90 min post-injection. Data are presented as mean values (n = 3).
68GA-DOTA-C(RGDFK)68GA-NODAGA-C(RGDYK)68GA-NODAGA-C(RGDYK)268GA-DOTA-SUBSTANCE P18F-FDG18F-FLT
30 min p.i.90 min p.i.30 min p.i.90 min p.i.30 min p.i.90 min p.i.30 min p.i.90 min p.i.30 min p.i.90 min p.i.30 min p.i.90 min p.i.
Tumor to blood ration 1.0914.701.9023.122.3016.380.932.841.961.951.102.36
Tumor to muscle ration2.4213.533.236.515.8410.473.106.452.673.581.312.83
Tumor to kidney ratio 0.291.430.360.900.610.910.140.041.012.210.761.79
Table 3. Tumor to brain ratios calculated from positron emission tomography (PET) data (standard uptake values (SUV) of respective regions) acquired 90 min p.i. of the tracers.
68Ga-DOTA-c(RGDfK)68Ga-NODAGA-c(RGDyK)68Ga-NODAGA-c(RGDyK)268Ga-DOTA-Substance P18F-FDG18F-FLT
Tumor to brain ratio4.704.004.144.250.644.58

