
DFT Investigations of the Vibrational Spectra and Translational Modes of Ice II

 , ,
, , 
Abstract
:1. Introduction
2. Computational Methods
3. Results and Discussion
4. Conclusions
Supplementary Materials
Author Contributions:
Funding
Acknowledgments
Conflicts of Interest
References
- Petrenko, V.F.; Whitworth, R.W. Physics of ICE; Oxford University Press: Oxford, UK, 1999. [Google Scholar]
- Gu, Y.; Zhu, X.L.; Jiang, L.; Cao, J.W.; Qin, X.L.; Yao, S.K.; Zhang, P. Comparative analysis of hydrogen bond vibrations in ice VIII and VII. J. Phys. Chem. C 2019, 123, 14880–14883. [Google Scholar] [CrossRef]
- Bertie, J.E.; Labbe, H.J.; Whalley, E. Absorptivity of ice I in the range 4000-30 cm−1. J. Chem. Phys. 1969, 50, 4501–4519. [Google Scholar] [CrossRef]
- Wong, P.T.T.; Whalley, E. Optical spectra of orientationally disordered crystals. VI. The Raman spectrum of the translational lattice vibrations of ice Ih. J. Chem. Phys. 1976, 65, 829–836. [Google Scholar] [CrossRef]
- Li, J.C.; Ross, D.K.; Howe, L.; Hall, P.G.; Tomkinson, J. Inelastic incoherent neutron scattering spectra of single crystalline and polycrystalline ICE Ih. Physica B 1989, 156, 376–379. [Google Scholar] [CrossRef]
- Li, J.C. Inelastic neutron scattering studies of hydrogen bonding in ices. J. Chem. Phys. 1996, 105, 6733–6755. [Google Scholar] [CrossRef]
- Yuan, Z.Y.; Zhang, P.; Yao, S.K.; Lu, Y.B.; Yang, H.Z.; Luo, H.W.; Zhao, Z.J. Computational assignments of lattice vibrations of ice Ic. RSC Adv. 2017, 7, 36801–36806. [Google Scholar] [CrossRef] [Green Version]
- Zhang, K.; Zhang, P.; Wang, Z.R.; Zhu, X.L.; Lu, Y.B.; Guan, C.B.; Li, Y.H. DFT simulations of the vibrational spectrum and hydrogen bonds of ice XIV. Molecules 2018, 23, 1781. [Google Scholar] [CrossRef]
- Wang, Z.R.; Zhu, X.L.; Jiang, L.; Zhang, K.; Luo, H.W.; Gu, Y.; Zhang, P. Investigations of the hydrogen bonds and vibrational spectra of clathrate ice XVI. Materials 2019, 12, 246. [Google Scholar] [CrossRef]
- Zhu, X.L.; Yuan, Z.Y.; Jiang, L.; Zhang, K.; Wang, Z.R.; Luo, H.W.; Gu, Y.; Cao, J.W.; Qin, X.L.; Zhang, P. Computational analysis of vibrational spectrum and hydrogen bonds of ice XVII. New J. Phys. 2019, 21, 043054. [Google Scholar] [CrossRef]
- Fortes, A.D.; Wood, I.G.; Brodholt, J.P.; Vočadlo, L. Ab initio simulation of the ice II structure. J. Chem. Phys. 2003, 119, 4567–4572. [Google Scholar] [CrossRef]
- Tammann, G. Ueber die Grenzen des festen Zustandes IV. Ann. Der Phys. 1900, 307, 1–31. [Google Scholar] [CrossRef] [Green Version]
- Kamb, B. Ice II. A proton-ordered form of ice. Acta Crystallogr. 1964, 17, 1437–1449. [Google Scholar] [CrossRef]
- Finch, E.D. Neutron-diffraction study of ice polymorphs. II. ice II. J. Chem. Phys. 1968, 49, 4361. [Google Scholar] [CrossRef]
- Kamb, B.; Hamilton, W.C.; Laplaca, S.J.; Prakash, A. Ordered proton configuration in Ice II, from single-crystal neutron diffraction. J. Chem. Phys. 1971, 55, 1934. [Google Scholar] [CrossRef]
- Wilson, G.J.; Chan, R.K.; Davidson, D.W.; Whalley, E. Dielectric properties of ices II, III, V, and VI. J. Chem. Phys. 1965, 43, 2384. [Google Scholar] [CrossRef]
- Whalley, E.; Davidson, D.W. Entropy changes at the phase transitions in ice. J. Chem. Phys. 1965, 43, 2148–2149. [Google Scholar] [CrossRef]
- Scheuermann, M.; Geil, B.; Löw, F.; Fujara, F. Deuteron spectra, spin-lattice relaxation, and stimulated echoes in ice II. J. Chem. Phys. 2009, 130, 14–207. [Google Scholar] [CrossRef]
- Bauer, M.; Elsaesser, M.S.; Winkel, K.; Mayer, E.; Loerting, T. Compression-rate dependence of the phase transition from hexagonal ice to ice II and/or ice III. Phys. Rev. B 2008, 77, 220105. [Google Scholar] [CrossRef]
- Lobban, C.; Finney, J.L.; Kuhs, W.F. The p–T dependency of the ice II crystal structure and the effect of helium inclusion. J. Chem. Phys. 2002, 117, 3928–3934. [Google Scholar] [CrossRef]
- Shephard, J.J.; Slater, B.; Harvey, P.; Hart, M.; Bull, C.L.; Bramwell, S.T.; Salzmann, C.G. Doping-induced disappearance of ice ii from water’s phase diagram. Nat. Phys. 2018, 14, 569–572. [Google Scholar] [CrossRef]
- Bertie, J.E.; Whalley, E. Infrared spectra of ices II, III, and V in the range 4000 to 350 cm−1. J. Chem. Phys. 1964, 40, 1646–1659. [Google Scholar] [CrossRef]
- Bertie, J.E.; Labbé, H.J.; Whalley, E. Far-infrared spectra of ice II, V, and IX. J. Chem. Phys. 1968, 49, 775–780. [Google Scholar] [CrossRef]
- Bertie, J.E.; Francis, B.F. Raman spectra of the O–H and O–D stretching vibrations of ices II and IX to 25° K at atmospheric pressure. J. Chem. Phys. 1980, 72, 2213–2221. [Google Scholar] [CrossRef]
- Bertie, J.E.; Francis, B.F. Raman spectra of ices II and IX above 35 K at atmospheric pressure: Translational and rotational vibrations. J. Chem. Phys. 1982, 77, 1–15. [Google Scholar] [CrossRef]
- Li, J.C.; Londono, D.; Ross, D.K.; Finney, J.L.; Bennington, S.M.; Taylor, A.D. Inelastic incoherent neutron scattering study of ice Ih, II, IX, V and VI in the region from 50–500 meV. J. Phys. Condens. Matter 1992, 4, 2109–2116. [Google Scholar] [CrossRef]
- Clark, S.J.; Segall, M.D.; Pickard, C.J.; Hasnip, P.J.; Probert, M.I.J.; Refson, K.; Payne, M.C. First principles methods using CASTEP. Z. Krist. Cryst. Mater. 2005, 220, 567–570. [Google Scholar] [CrossRef] [Green Version]
- Hammer, B.; Hansen, L.B.; Norskov, J.K. Improved adsorption energetics within density-functional theory using revised Perdew-Burke-Ernzerhof functionals. Phys. Rev. B 1999, 59, 7413–7421. [Google Scholar] [CrossRef] [Green Version]
- Zhang, P.; Wang, Z.; Lu, Y.B.; Ding, Z.W. The normal modes of lattice vibrations of ice XI. Sci. Rep. 2016, 6, 29273. [Google Scholar] [CrossRef]
- Whale, T.F.; Clark, S.J.; Finney, J.L.; Salzmann, C.G. DFT-assisted interpretation of the Raman spectra of hydrogen-ordered ice XV. J. Raman Spectrosc 2013, 44, 290–298. [Google Scholar] [CrossRef]


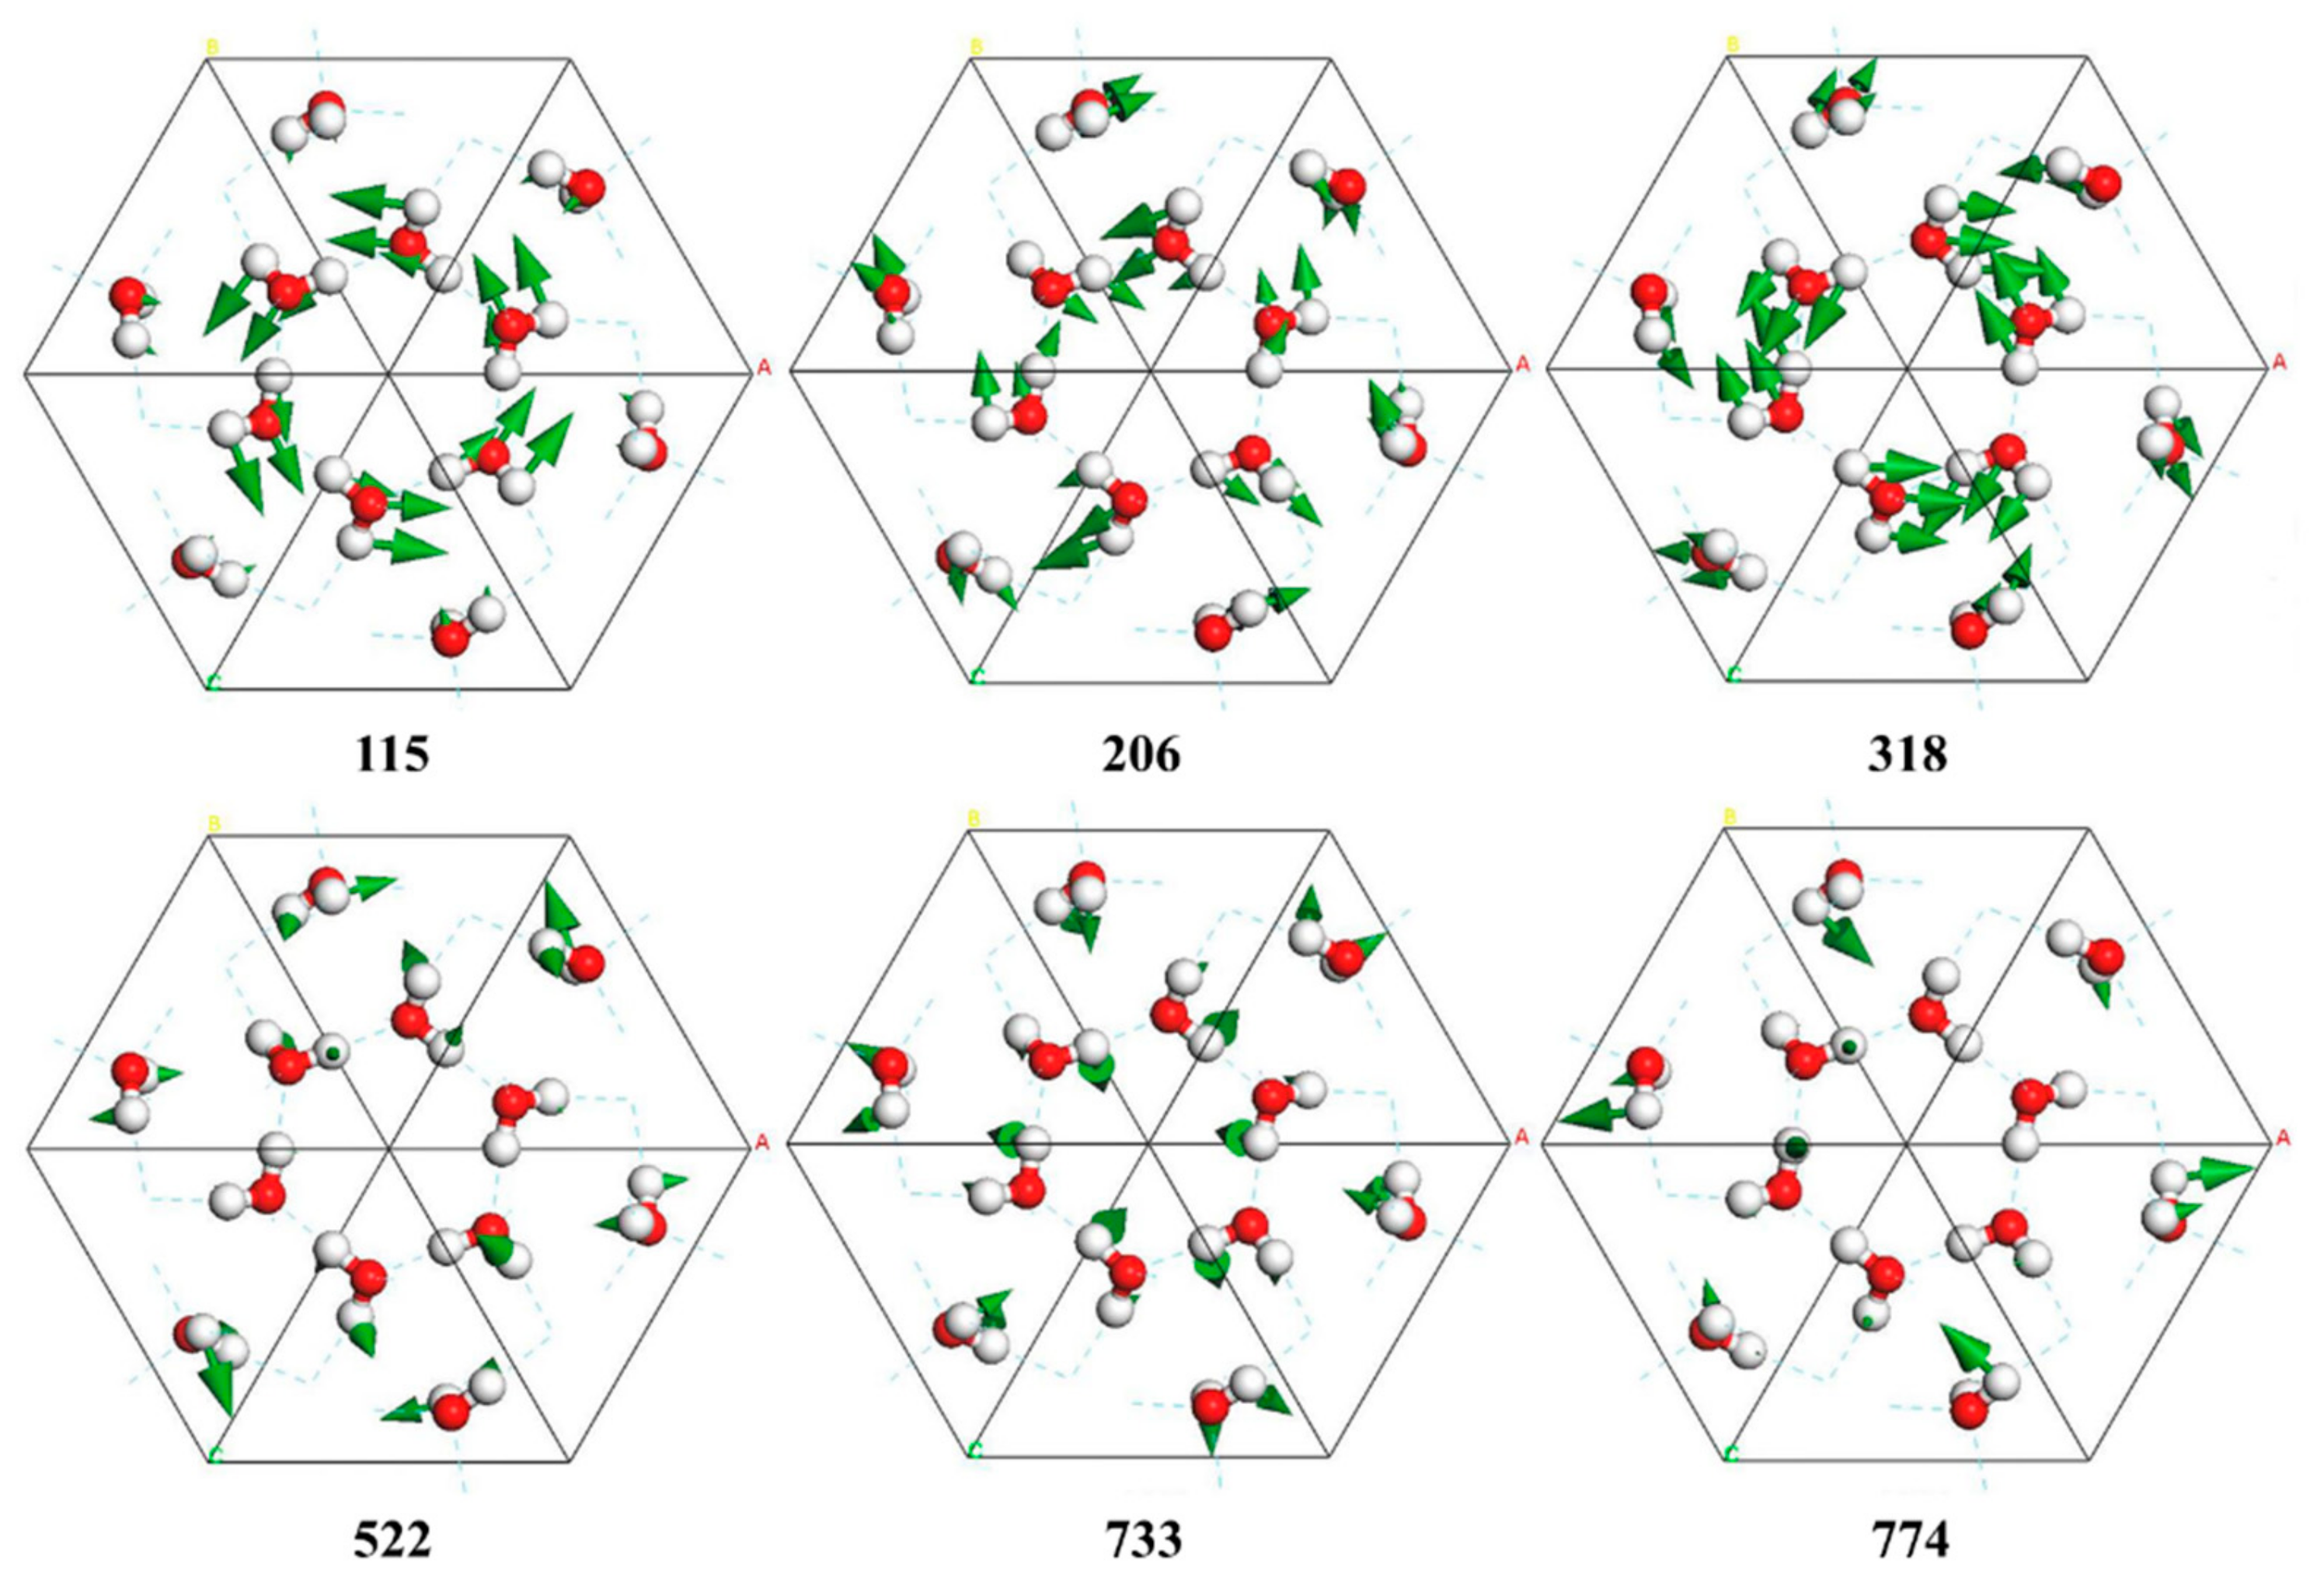
| PDOS | INS [6,26] | Normal Modes | IR [22,23] | Raman [24,25] |
|---|---|---|---|---|
| 41 | 39 | 54 (2) | ||
| 76 | 83 | 82 (2) | ||
| 86 | ||||
| 90 (2) | 72 | |||
| 93 | ||||
| 102 | 96 | 115 | ||
| 117 | 104 | |||
| 118 (2) | ||||
| 130 (2) | 107 | |||
| 135 | ||||
| 142 | ||||
| 147 | 154 (2) | 152 | ||
| 129 | 157 | 136 | ||
| 153 | 164 (2) | 151 | ||
| 185 | 176 | 187 | ||
| 198 | 206 (2) | 186 | ||
| 206 | 219 | 200 | ||
| 221 | 239 | 223 (2) | 253 | |
| 267 | 262 (2) | 262 | ||
| 282 | 294 | 293 | 295 | |
| 298 (2) | 268 | |||
| 302 | 327 | 318 | 335 | 322 |
| 513 | 477 | 522 (2) | 489 | |
| 523 (2) | 473 | |||
| 483 | ||||
| 498 | ||||
| 527 | 516 | |||
| 529 | 548 | 538 | 495 | |
| 585 | 597 | 533 | ||
| 599 (2) | 573 | |||
| 610 | 597 | |||
| 607 | 611 | 544 | ||
| 635 | 630 (2) | 593 | ||
| 654 | 617 | |||
| 646 | 655 (2) | 642 | ||
| 690 | 657 (2) | 648 | ||
| 660 | 660 | |||
| 712 | 733 | 700 | ||
| 738 | 752 | 685 | ||
| 753 | 746 | 774 (2) | 715 | |
| 790 | 804 (2) | 775 | ||
| 805 | 815 (2) | 745 | ||
| 838 | 844 (2) | 800 | ||
| 851 | 895 | 853 (2) | 845 | |
| 871 | 835 | |||
| 884 | 881 (2) | 960 | ||
| 904 | 909 | 950 | ||
| 954 | 969 | |||
| 1066 | ||||
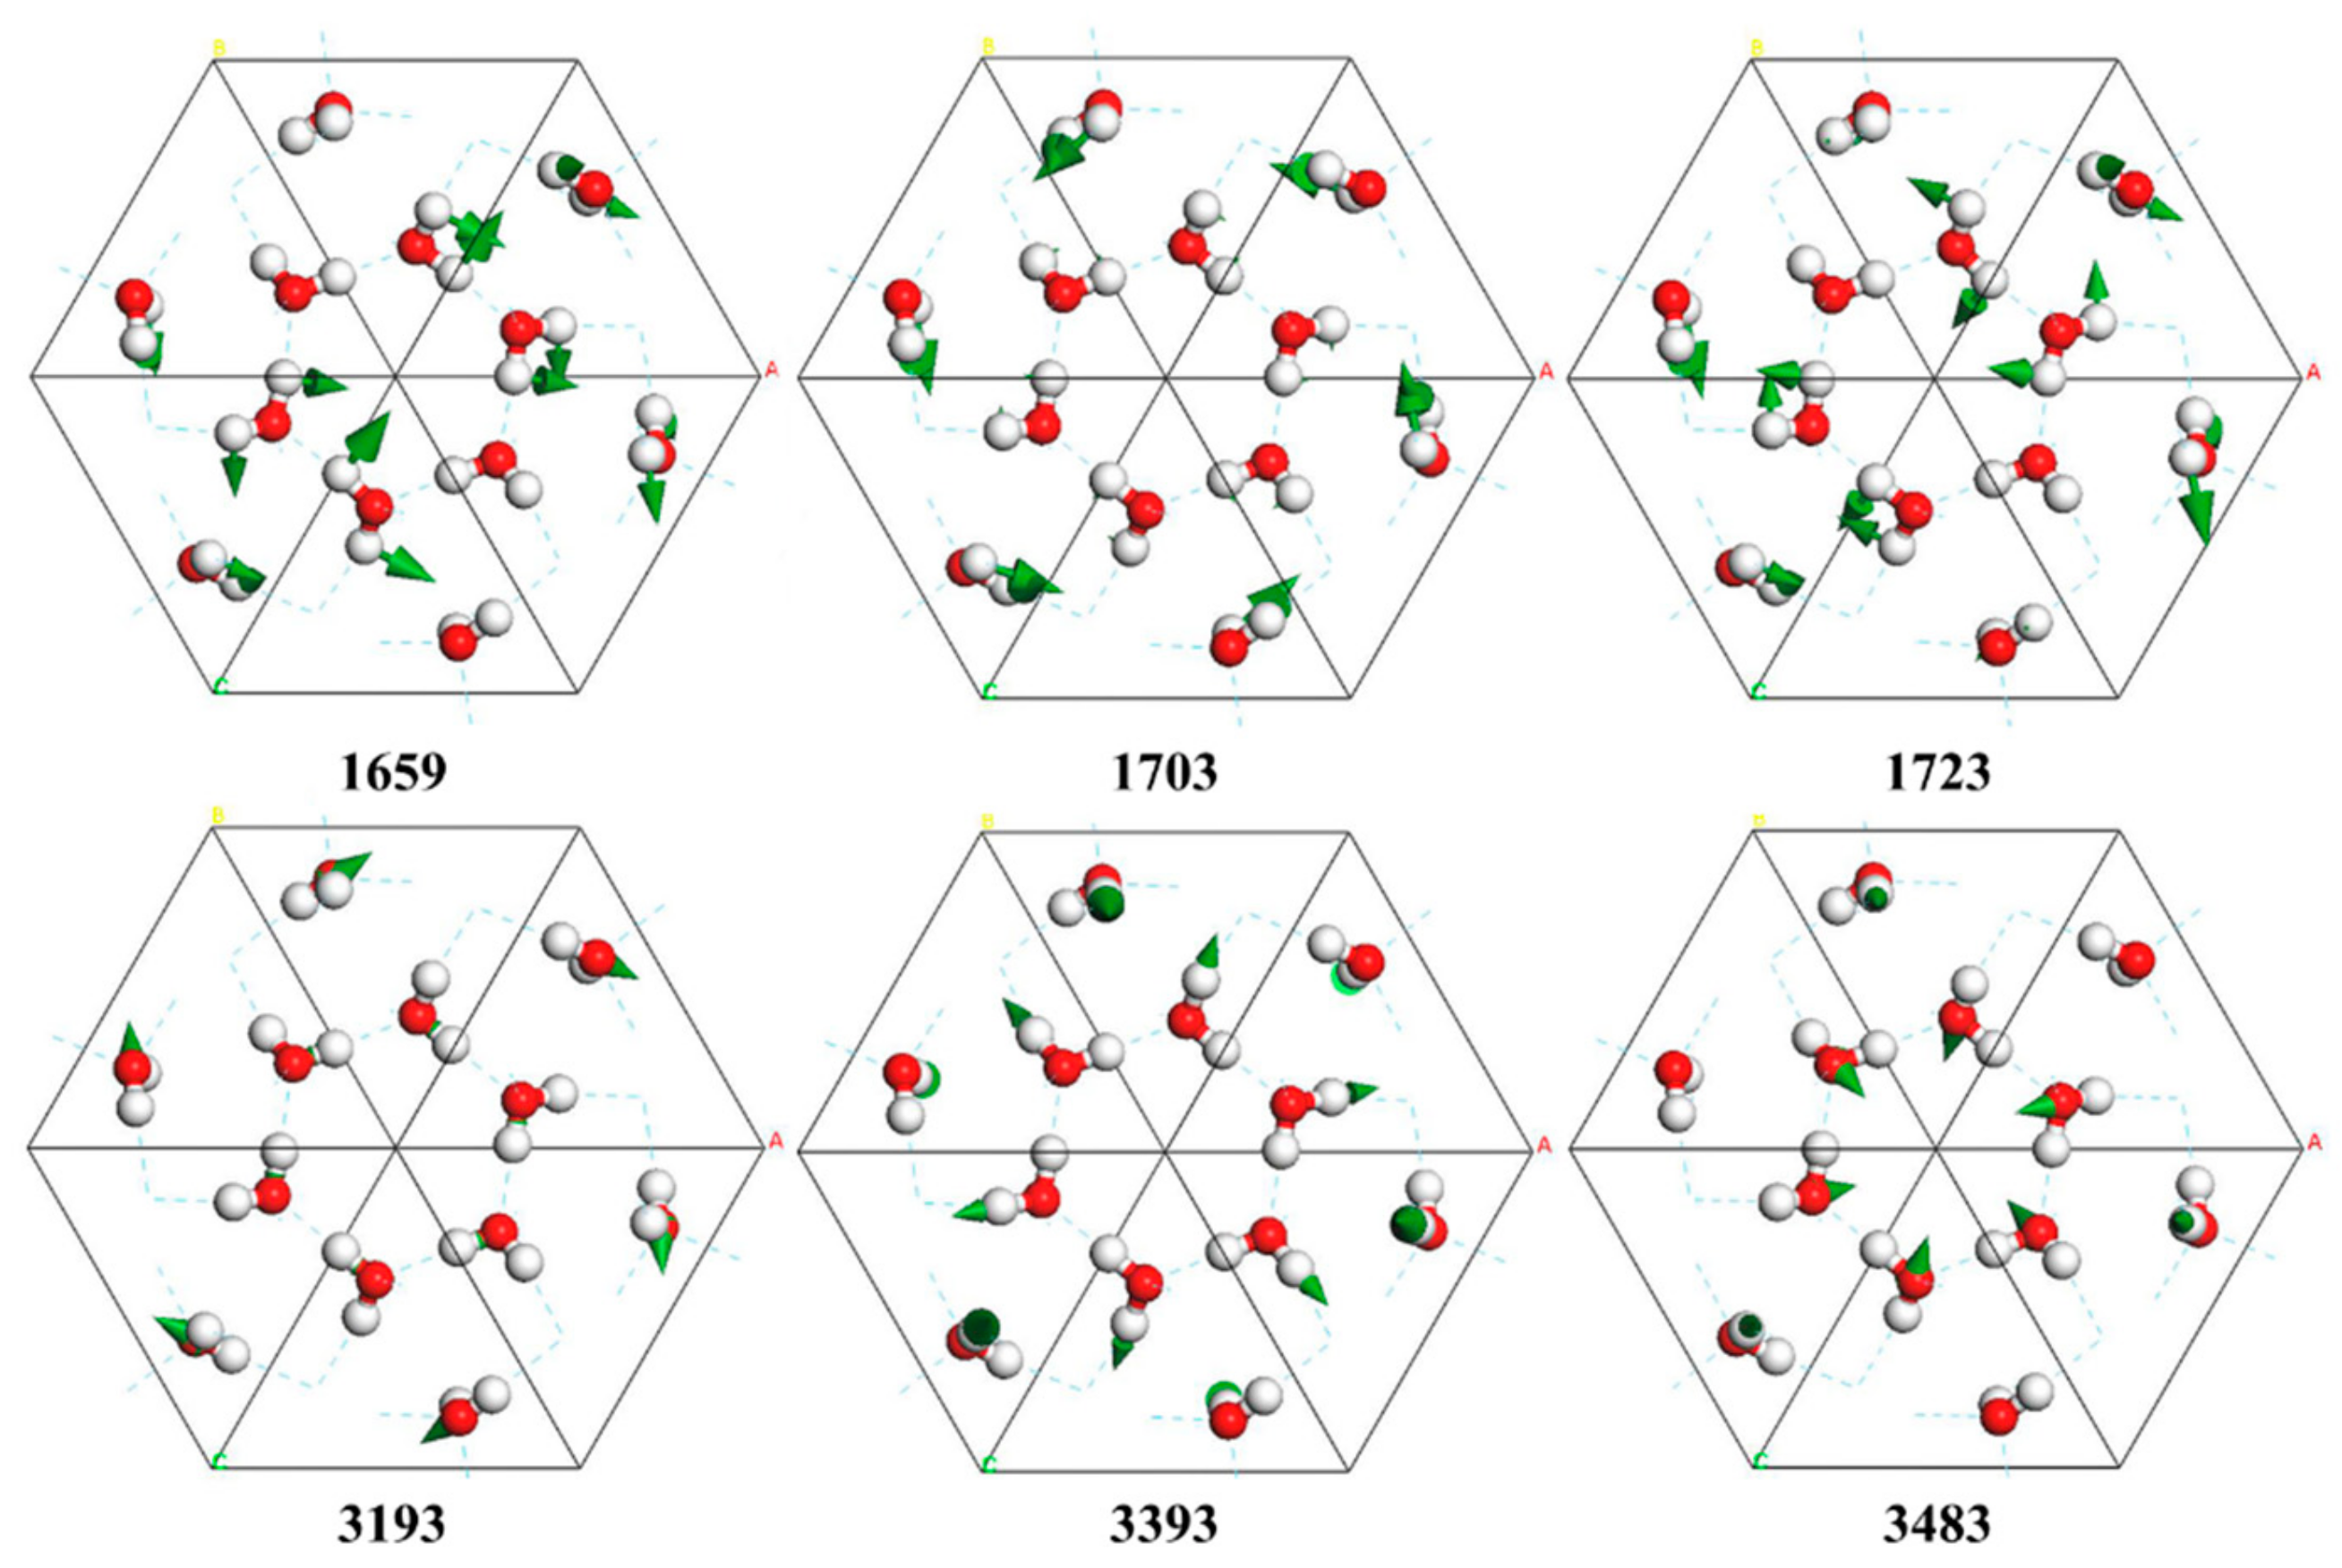
| 1664 | 1669 | 1659 (2) | ||
| 1661 | ||||
| 1665 (2) | ||||
| 1680 | 1690 | |||
| 1686 (2) | ||||
| 1699 | 1703 | |||
| 1708 | ||||
| 1723 (2) | 1748 | |||
| 2220 | ||||
| 2300 | ||||
| 3207 | 3193 | 3189 | ||
| 3198 | 3225 | |||
| 3242 | 3387 | 3227 (2) | 3000 | |
| 3245 (2) | 3225 | |||
| 3279 (2) | ||||
| 3303 | 3304 | 3280 | ||
| 3327 | 3321 (2) | 3270 | ||
| 3335 | 3390 | |||
| 3414 | 3393 | 3306 | ||
| 3438 | 3405 (2) | 3340 | ||
| 3412 | 3470 | |||
| 3425 (2) | ||||
| 3456 | ||||
| 3488 | 3466 (2) | 3400 | ||
| 3469 (2) | 3500 | |||
| 3483 | 3465 |
© 2019 by the authors. Licensee MDPI, Basel, Switzerland. This article is an open access article distributed under the terms and conditions of the Creative Commons Attribution (CC BY) license (http://creativecommons.org/licenses/by/4.0/).
Share and Cite
Cao, J.-W.; Chen, J.-Y.; Qin, X.-L.; Zhu, X.-L.; Jiang, L.; Gu, Y.; Yu, X.-H.; Zhang, P. DFT Investigations of the Vibrational Spectra and Translational Modes of Ice II. Molecules 2019, 24, 3135. https://doi.org/10.3390/molecules24173135
Cao J-W, Chen J-Y, Qin X-L, Zhu X-L, Jiang L, Gu Y, Yu X-H, Zhang P. DFT Investigations of the Vibrational Spectra and Translational Modes of Ice II. Molecules. 2019; 24(17):3135. https://doi.org/10.3390/molecules24173135
Chicago/Turabian StyleCao, Jing-Wen, Jia-Yi Chen, Xiao-Ling Qin, Xu-Liang Zhu, Lu Jiang, Yue Gu, Xu-Hao Yu, and Peng Zhang. 2019. "DFT Investigations of the Vibrational Spectra and Translational Modes of Ice II" Molecules 24, no. 17: 3135. https://doi.org/10.3390/molecules24173135