1. Introduction
Among biologically protective polyphenols, phenolic acids are widely distributed in plants, and have antioxidant capacity by neutralizing radicals by donating or accepting electrons. Major classes of phenolic acids comprise carbon chains of C6+C1 (hydroxybenzoic acids, HBA) and of C6+C3 (hydroxycinnamic acids, HCA), where C6 is the phenyl ring and C3 the propanoid moiety of various
trans-cinnamic acids (caffeic,
p-coumaric, and ferulic acid). Jerusalem artichoke (
Helianthus tuberosus L.) is a perennial tuberous plant for which the content of phenolic substances has been described by several authors. Tchone and colleagues [
1] identified 22 phenolic compounds in methanolic extracts of tubers; salicylic acid ranked highest of the HBAs, and highest of the HCAs was chlorogenic acid (CQA), an ester of caffeic acid and quinic acid. Within the family of caffeoyl quinic acids, the hydroxyl groups of quinic acid can be esterified with caffeic acid in multiple positions (1, 3, 4, 5) to produce mono-, di-, and even tricaffeoyl isomers. The leaves, in particular, contain a broad specter of mono- and dicaffeoyl esters of CQA; more than 30 variants were identified by LC-MS [
2]. Out of these, the 3-O-caffeoylquinic acid (3-CQA) isomer and two dicaffeoyl esters of quinic acid (1,5- and 3,5-diCQA) were dominating. Additionally, Chen and colleagues [
3] also observed high levels of the 4,5-diCQA isomer in leaves. In the tubers of Jerusalem artichoke, three isomers of CQA and four isomers of dicaffeoylquinic acids have been identified [
4].
Due to the diversity of the CQA isomers, their abundance in solvent extracts and corresponding antioxidant activity depend on the strength and polarity of the solvent system used. Exploratory extractions of polyphenols can be lengthy, stretching from several hours up to overnight, followed by classical sequential extractions and separations into more non-polar solvents. The most abundant phenolic acid obtained from leaves extracted by ethyl acetate was 1,5-diCQA (104 mg/g dry substance (DS), or 39%), while 3-CQA (74 mg/g DS or 55%) dominated in the
n-butanol fraction extracts [
5]. Ethyl acetate extracts also showed the highest radical scavenging activity (SC
50). Polar solvent systems, e.g., ethanol [
3,
5,
6,
7,
8] or methanol [
2,
4,
9,
10], are frequently used for the initial extraction of polyphenols from leaf and tuber material. Moreover, to improve yields, extractions are sometimes intensified with ultrasound [
2,
7], heat [
3,
9], or pressure [
4]. For example, Petrova and colleagues [
7] made extracts of Jerusalem artichoke flowers in 95%, 80%, and 70% ethanol applying an ultrasound bath, which produced the highest total phenolic content (TPC; 17.4 mg gallic acid equivalents (GAE) per gram fresh weight) in 70% ethanol. In a high-yielding preparative method, the 3-CQA, an isomer of considerable commercial value, was purified from leaves. The protocol contained repeated extractions in methanol (60% at 60 °C and 3 × 30 min), followed by column adsorption on a polar resin eluted with sequential flushes of 60–90% ethanol, resulting in a more than 5-fold enrichment and 89% yield of 3-CQA [
9].
The potential commercial value of polyphenolic substances in Jerusalem artichoke, including the CQAs, is connected to the many reported beneficial bioactivities, besides antioxidants, found in tuber and aerial organs (leaf, flower, and stems), reviewed by Lim [
11] and Yang and colleagues [
12]. The phenolic content of ethanol extracts of tubers and leaves elicited the effects observed in anti-inflammatory and cytotoxic [
13] as well as antifungal [
6] bioassays. Although tubers of Jerusalem artichoke are considered both a valuable food and energy (inulin) crop [
14], its cultivation in northern countries remains limited [
15,
16]. From a bio-economy perspective, finding better uses also for the top residues or aerial parts other than as animal feed may increase the overall value of the crop. Considering the usefulness and biological potential of phenolic acids, the objectives of the study were to assess the distribution and antioxidant activity of the major phenolic acids throughout the whole plant (tuber, stem, leaf, and flower). We also wanted to chart the boundaries of critical variables (holding time, solvent strength, and temperature) for ethanol extraction of phenolic acids from leaf material, starting out investigating whether thermal intensification could improve yields.
3. Discussion
The Jerusalem artichoke has been proposed as a biorefinery crop due to the multipurpose uses of the plant [
12,
19,
20]. The inulin-rich tubers are the main crop, mainly for food use and for bioethanol production. Well documented in the literature, the aerial parts represent a rich source of bioactive constituents including phenolic acids, and therefore logical targets for such value-added utilization. However, as indicated by Johansson and colleagues [
14], suitable extraction procedures must be developed for utilization of the whole plant to be economically viable, not only as an energy crop. To work out an approach for biomass utilization, we undertook an assessment of total phenolic content (TPC) in various plant organs. The genotype “Dagnøytral” is an early variety of Jerusalem artichoke, developed for growth in the Nordic climate [
15]. When fully grown in October, it reaches a height of about 2.5 m. Mid-season, the leaves can make up about 40% of the plant dry mass, while the stalk grows thicker and at the time of harvest in November dominates the dry mass of aerial parts [
15,
19].
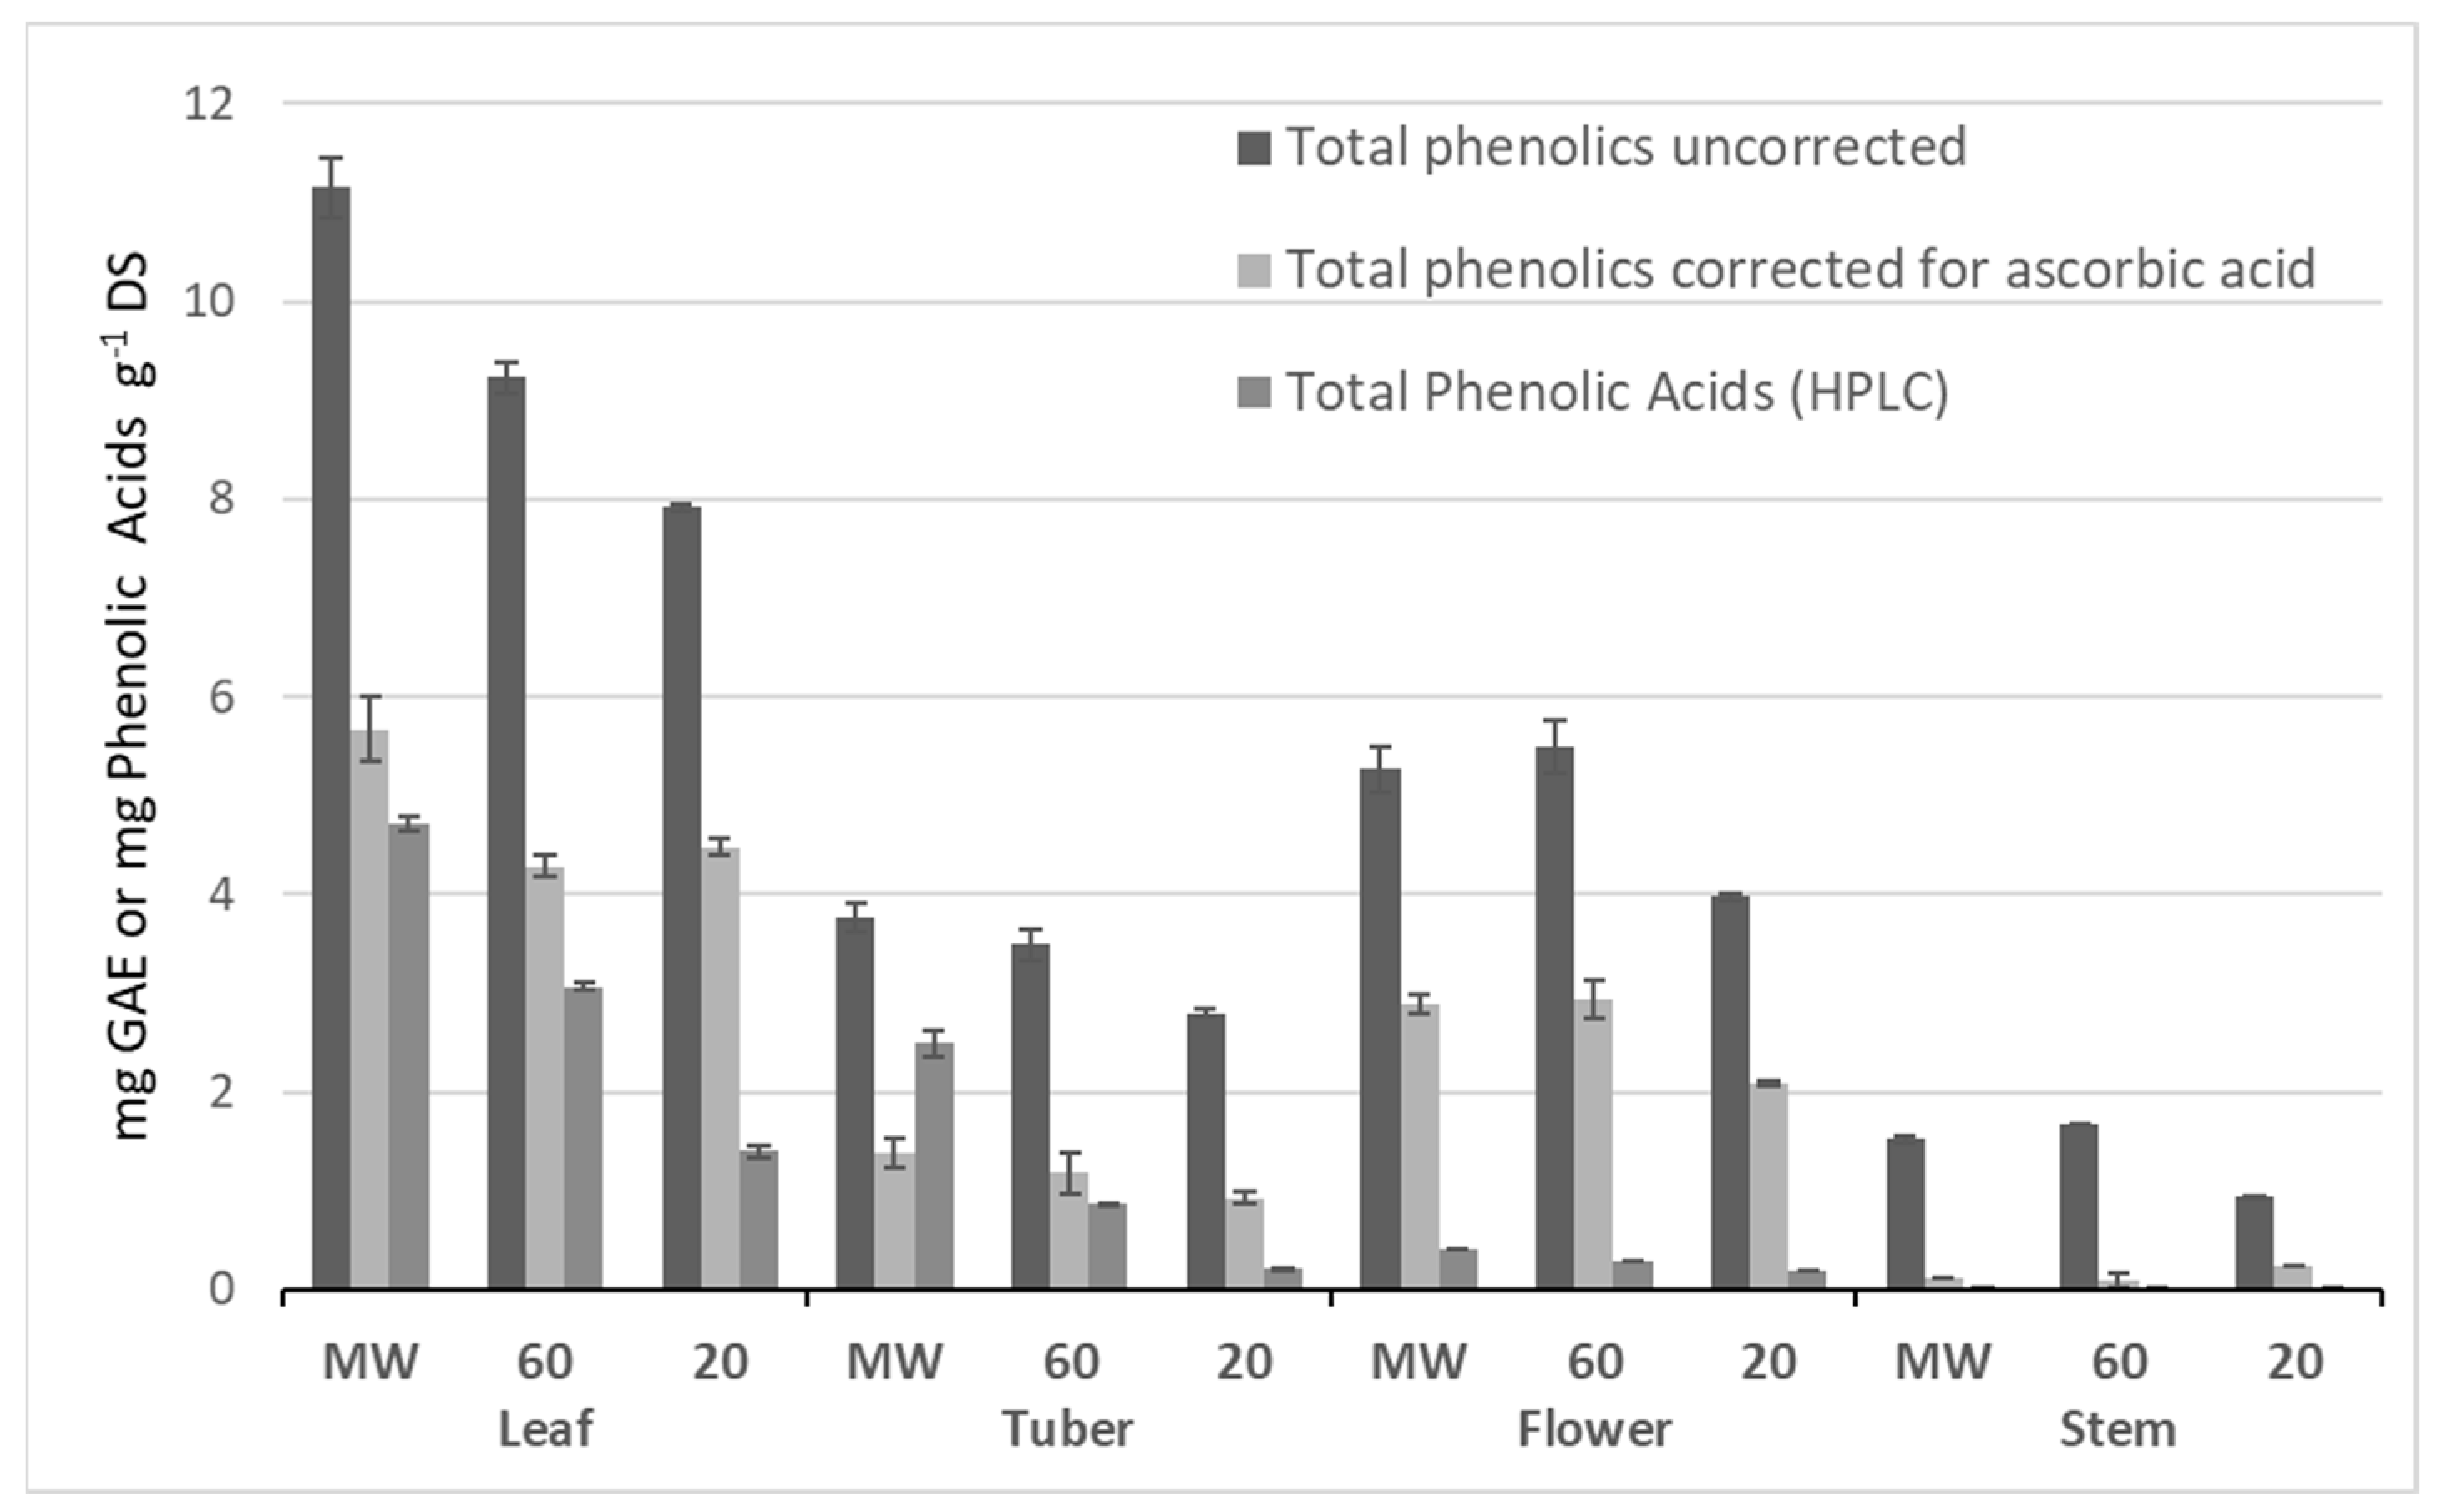
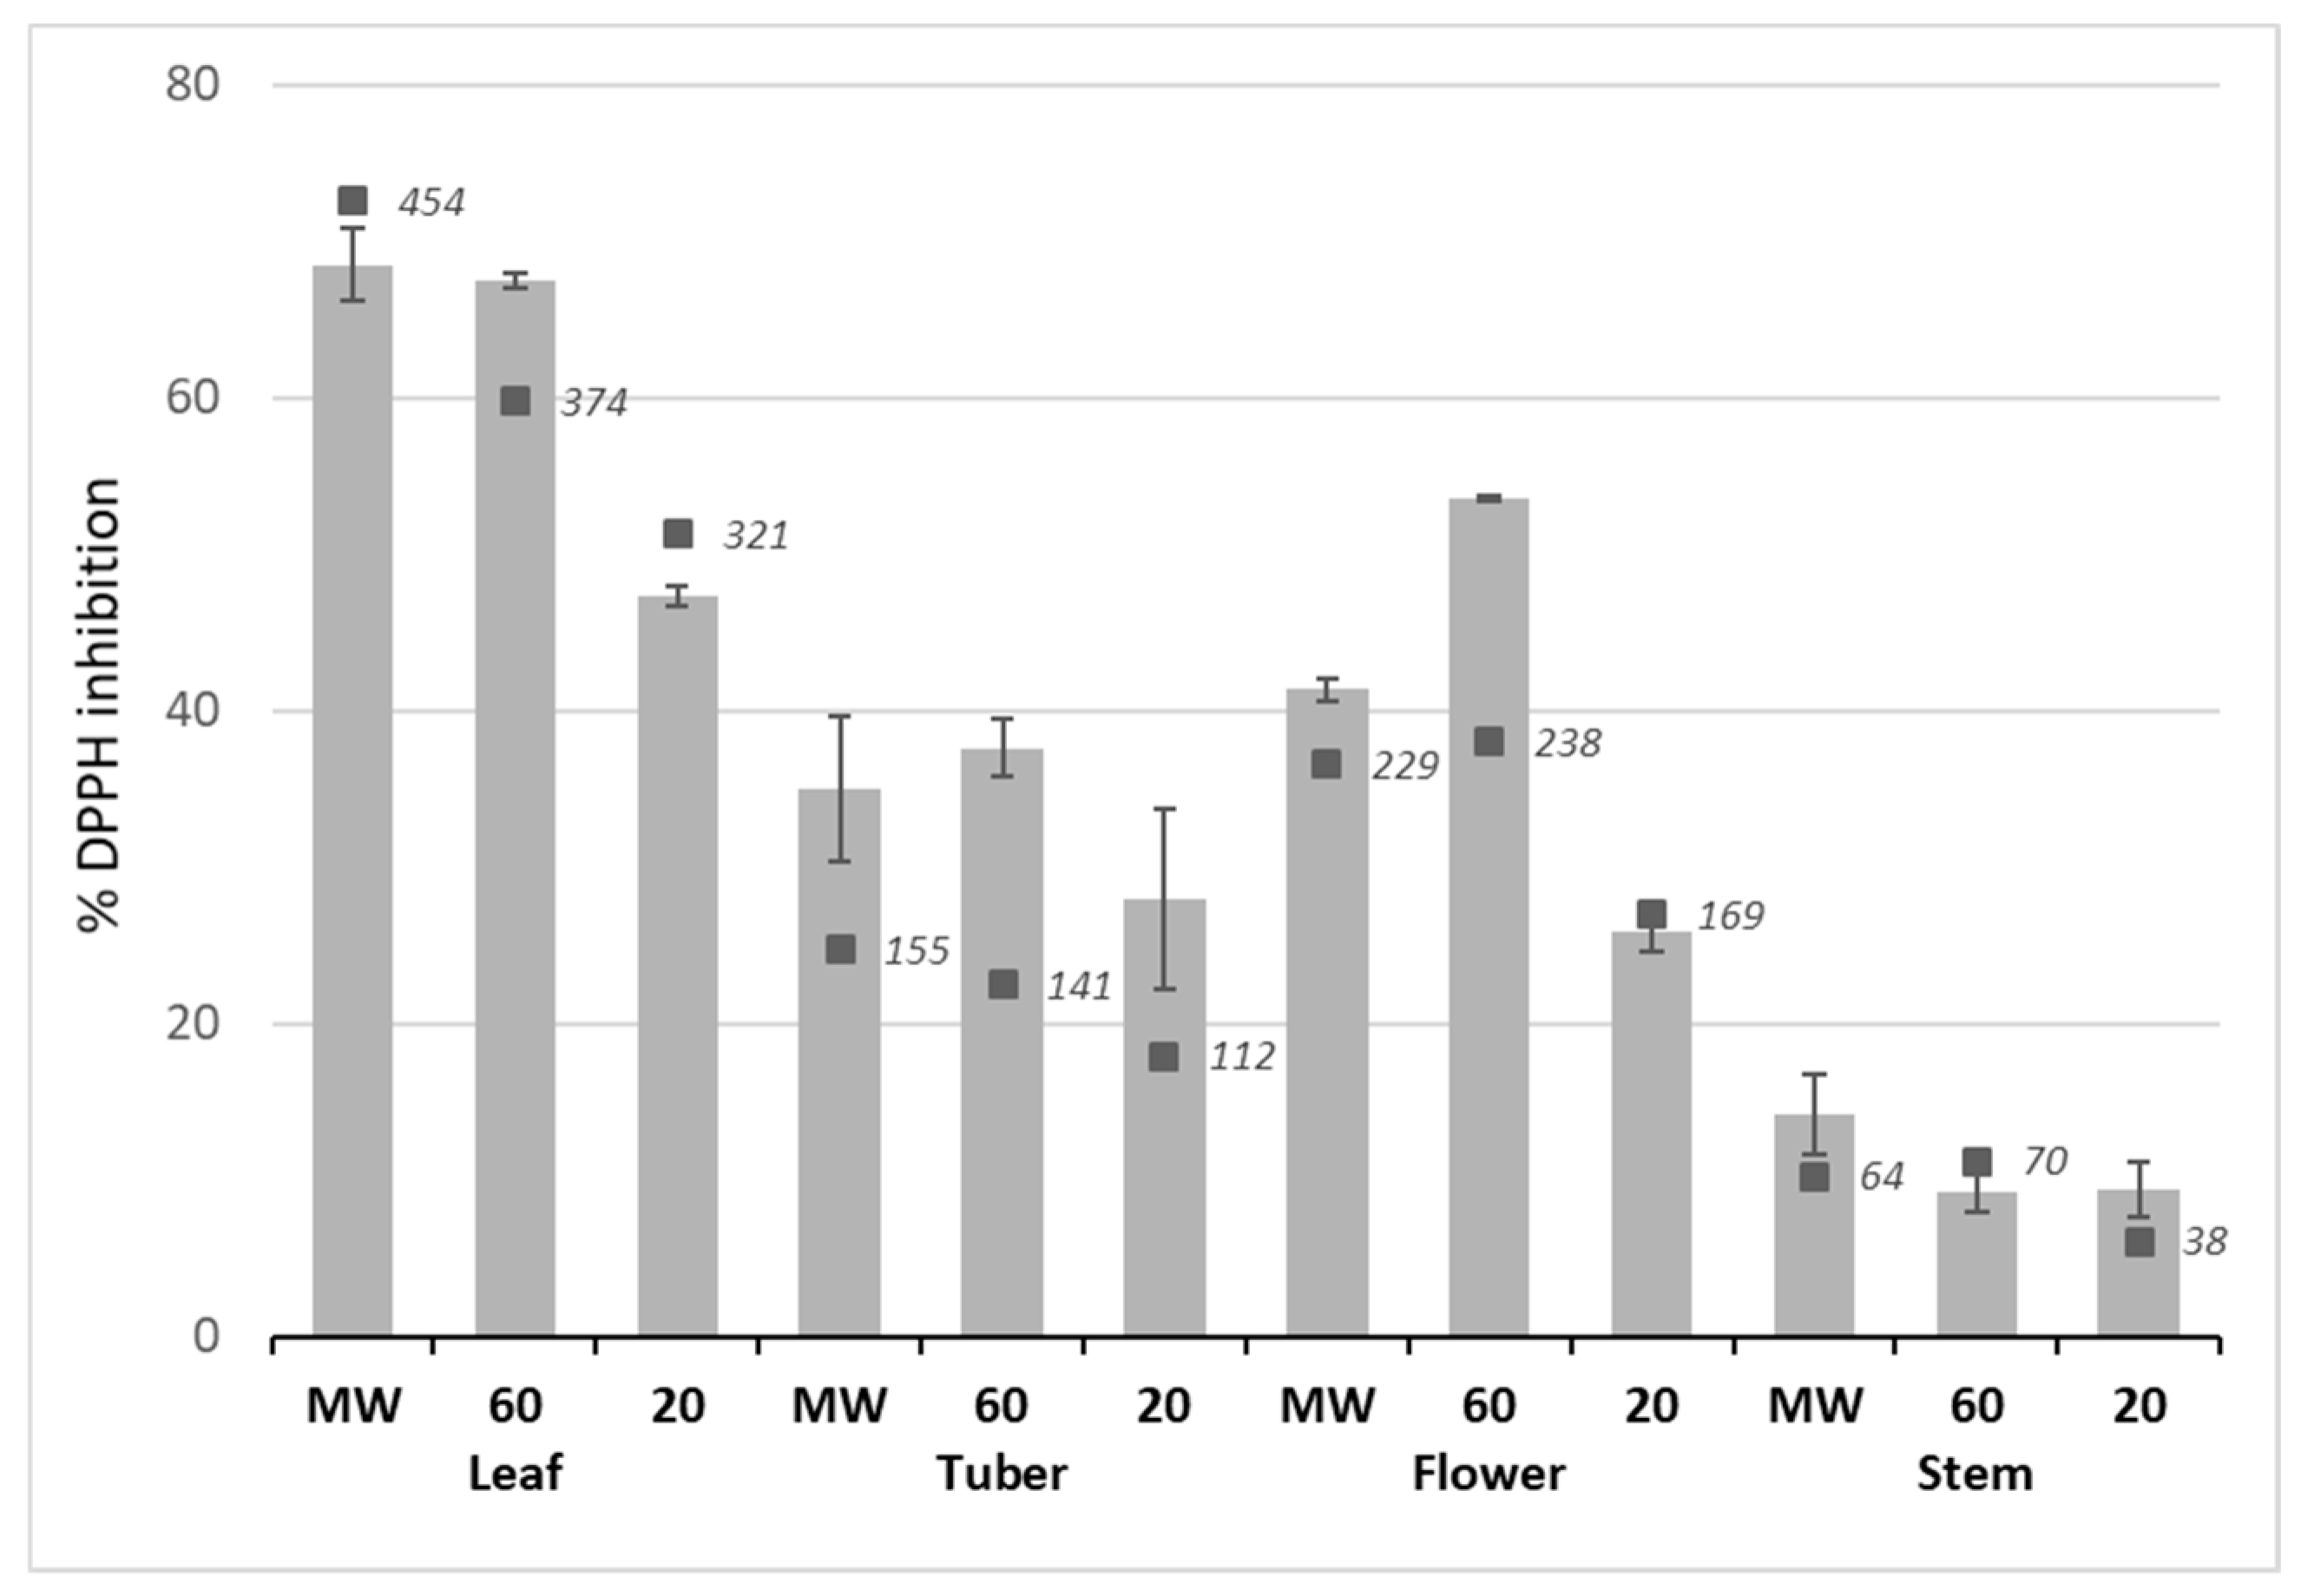
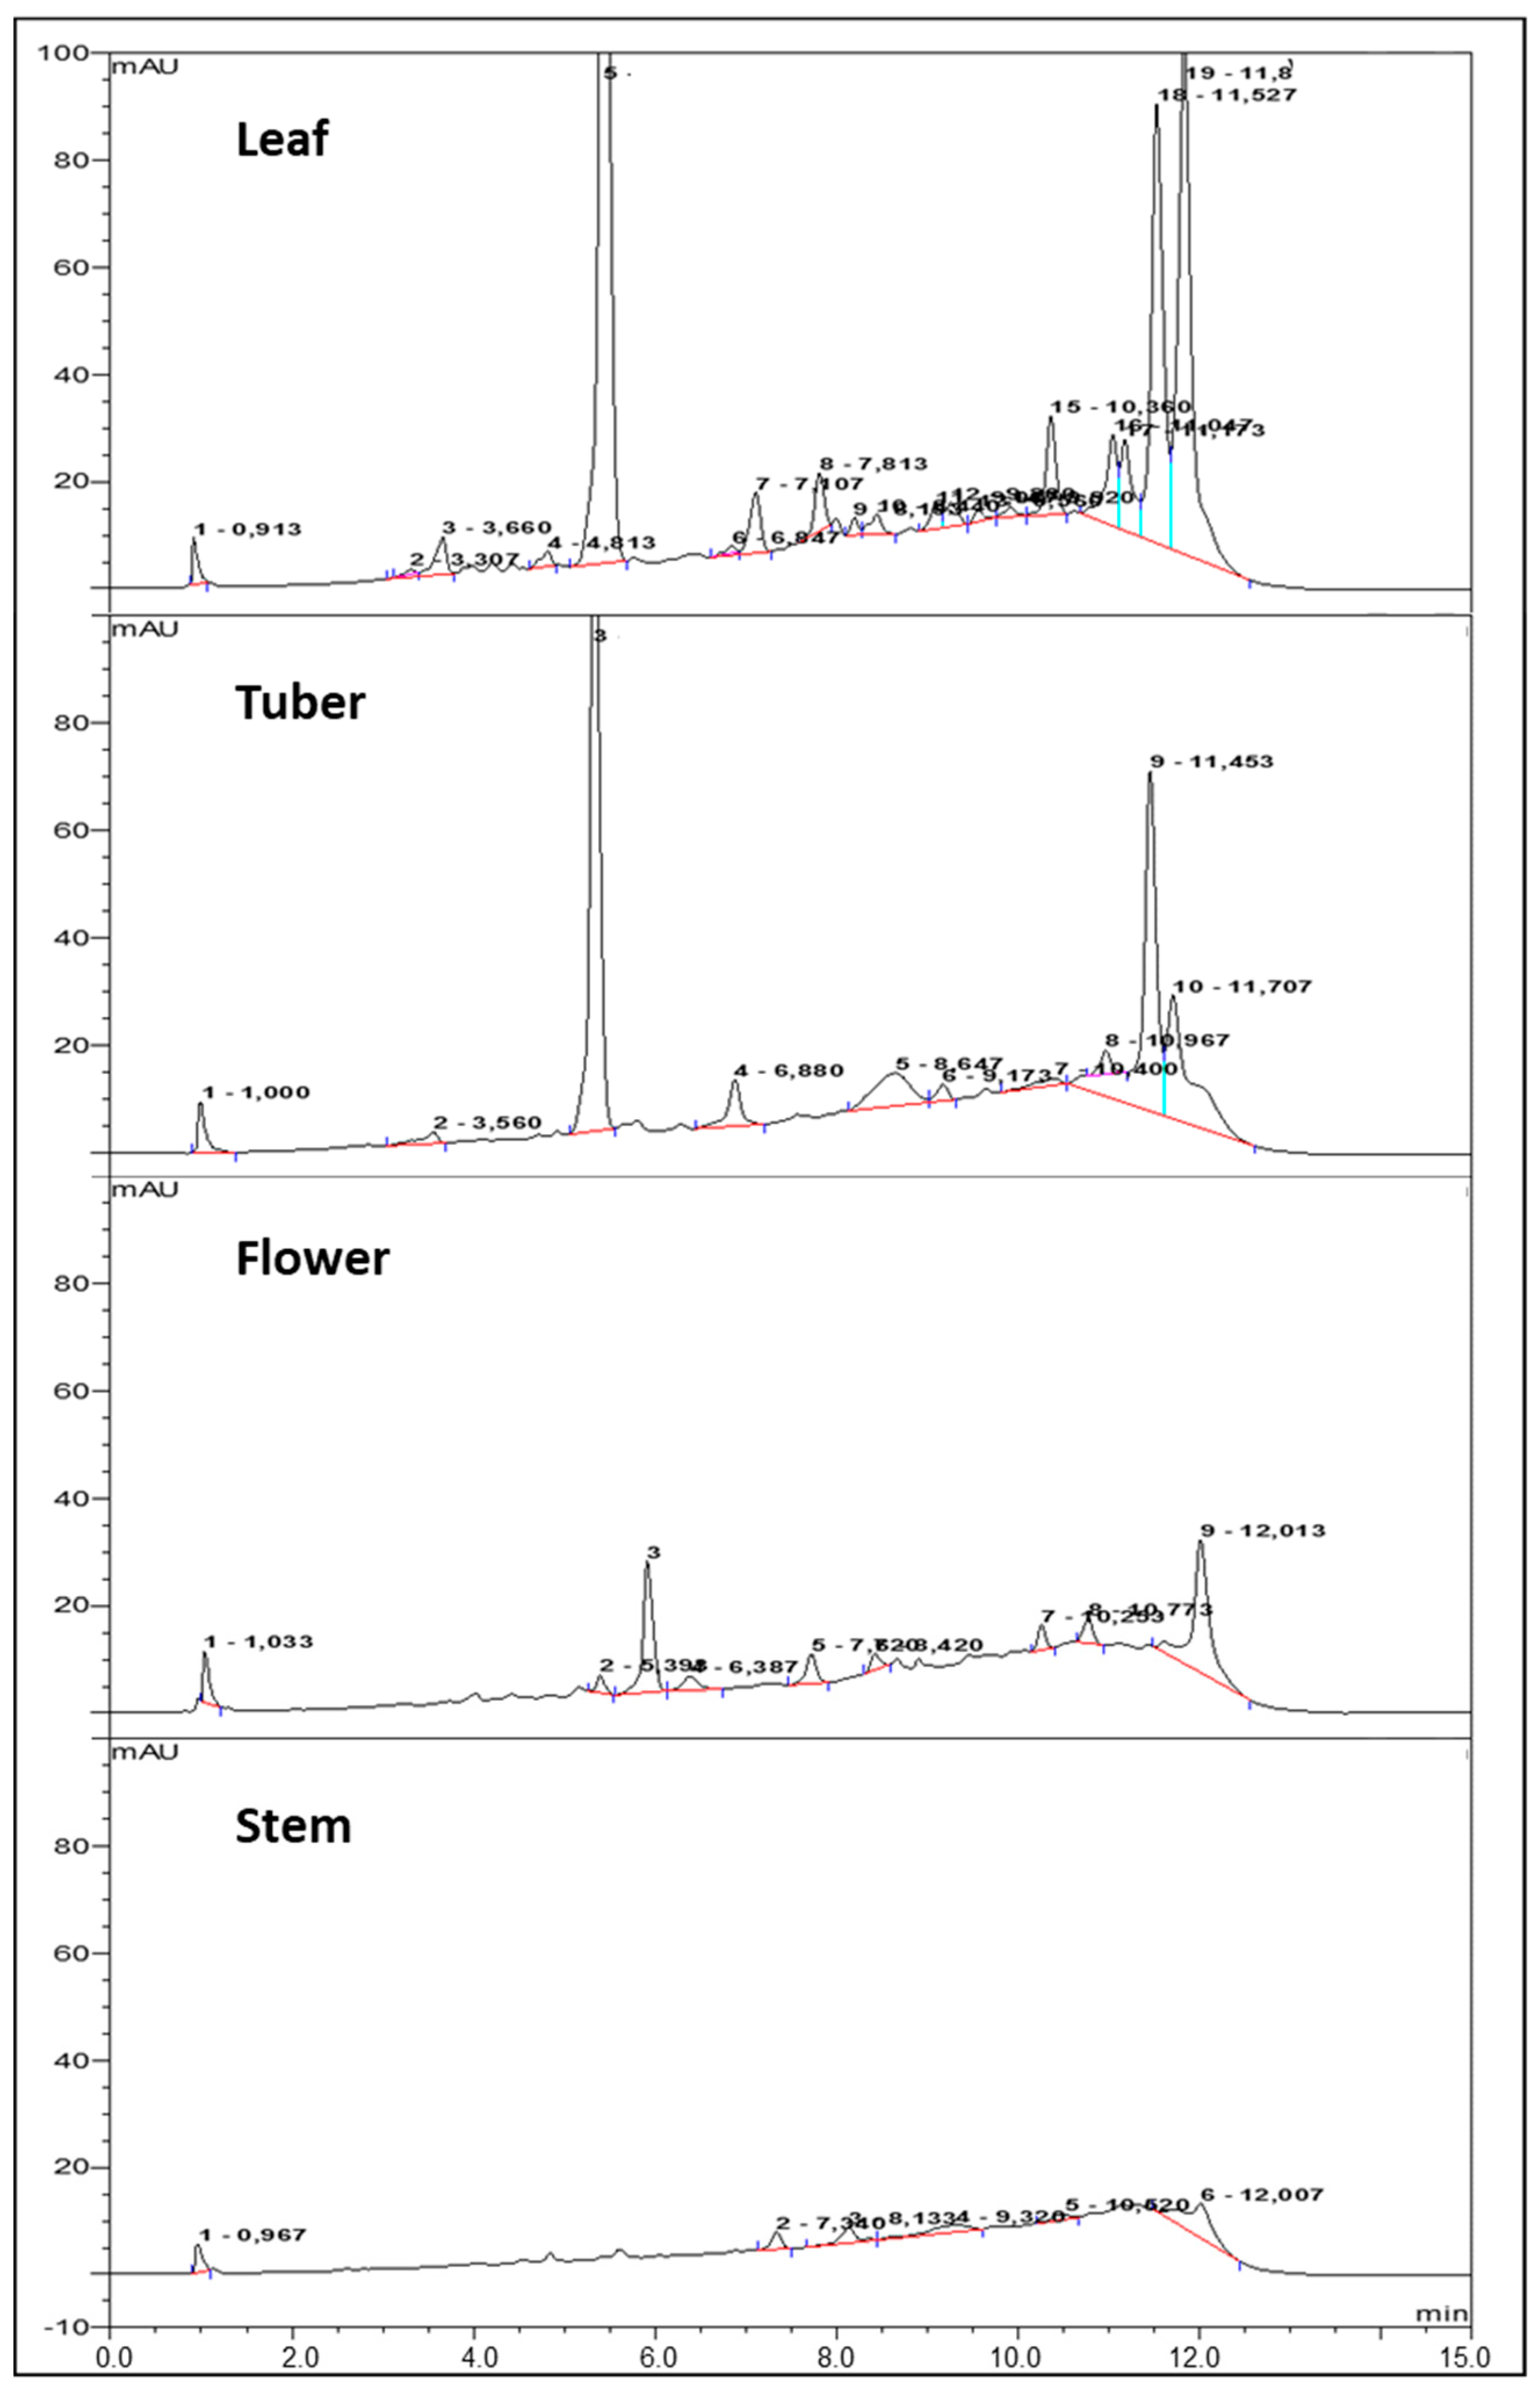
Using a polar solvent extraction from dried material, both leaves and flowers measured high in TPC, while tuber and stem extracts were low or almost absent. This distribution of protective constituents may reflect that plant surfaces most readily exposed to sunlight are prone to accumulating antioxidant compounds. However, various environmental factors and stage of maturity can affect the accumulation of phenolics in plants [
3,
21].
Similar to numerous studies on phenolic content in plant material, the Folin–Ciocalteu (F–C) assay was used for TPC analysis. But in this study, we employed the modification suggested by Isabelle and colleagues [
17] on correcting for the likely contribution from ascorbic acid (e.g., vitamin C). Ascorbic acid reacts more rapidly with the F–C reagent than the slow-reacting phenolic acids, and thus the reducing reaction of the latter can be distinguished and quantitated to obtain a more accurate total phenolic content [
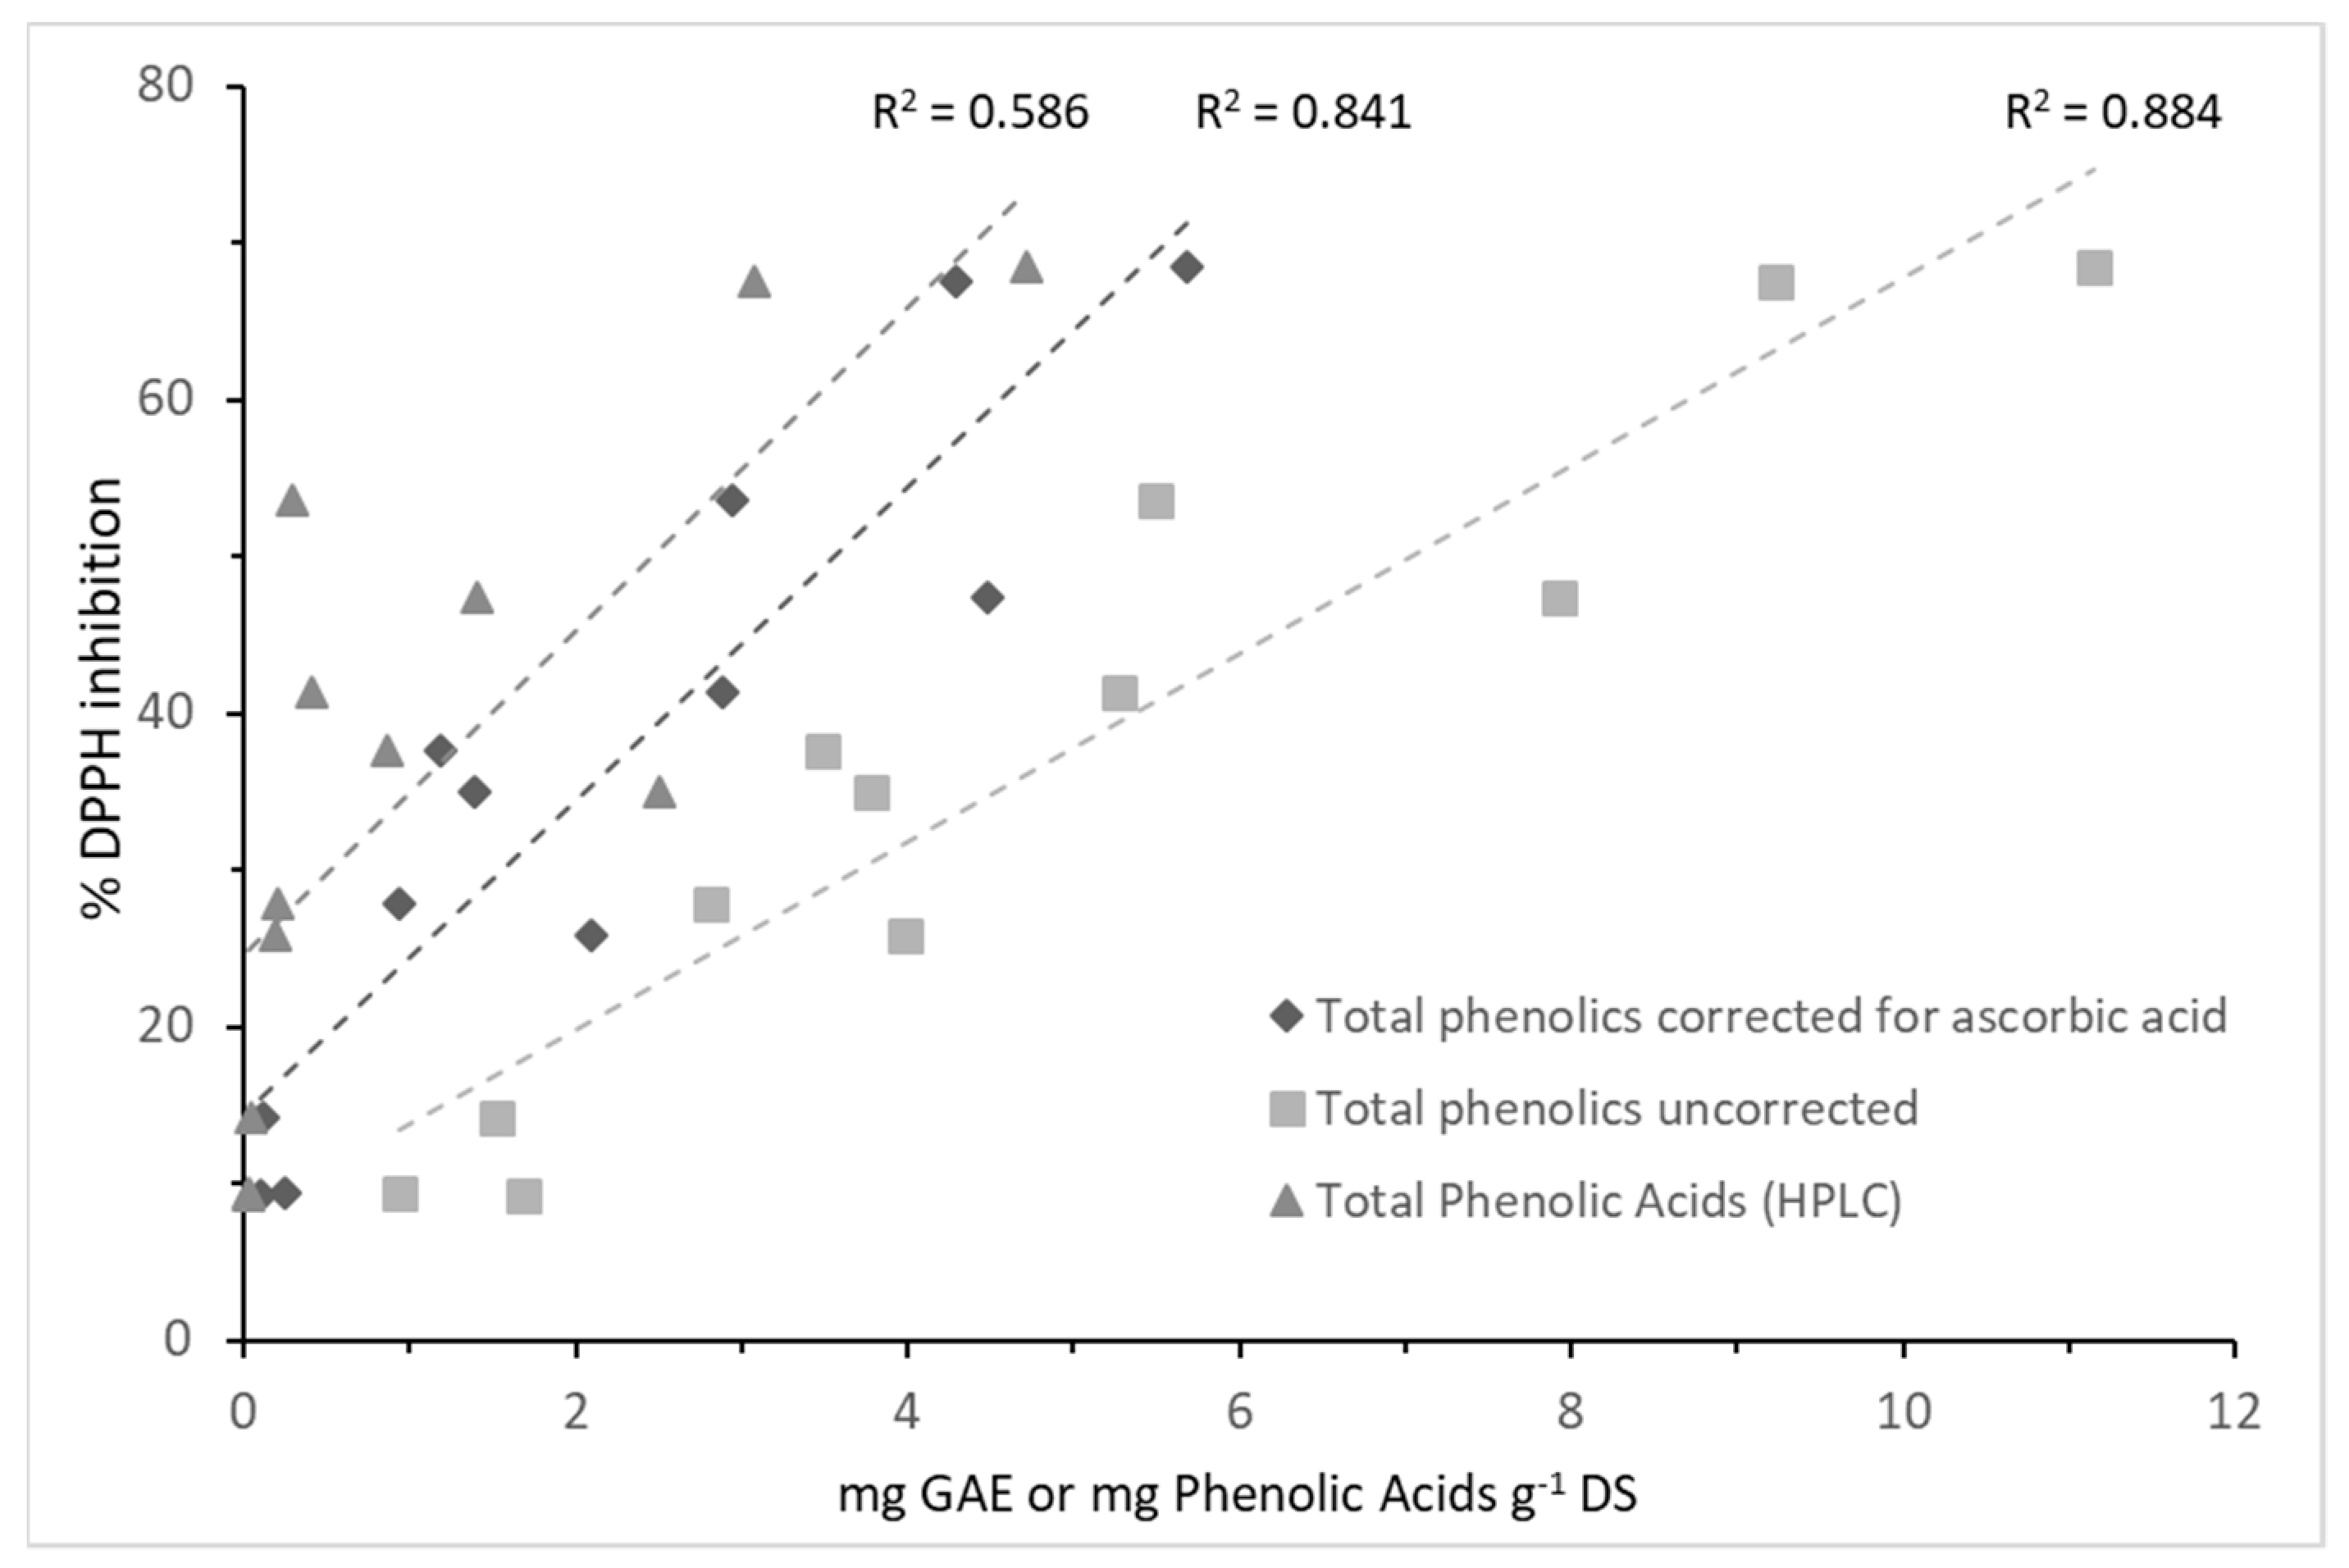
18]. This assay modification resulted in significantly lower TPC in all extract types—in some cases more than 50%. Without correcting for the ascorbic acid contribution, the total phenolic acid content will unintentionally be overestimated unless quantitated by hyphenated high-resolution methods. Despite overestimation, the correlation between the radical scavenging activity (% DPPH inhibition) and the TPC values, both raw and corrected, from all plant organs and extract types, were linear and highly significant. A similar correlation between antioxidant activity assays (DDPH and FRAP) and TPC (uncorrected) was observed in extracts of five edible flowers including those of Jerusalem artichoke. On the other hand, the flavonoid content in flowers did not correlate to the same assays [
7]. Another antioxidant assay, the oxygen radical absorbance capacity (ORAC) of acetone extracts made from 66 vegetables correlated with the same good linearity (R
2 = 0.81) to corrected TPC values [
17]. Thus, given the substantial positive correlation it is likely that the phenolic acids in our extracts are responsible for the observed antioxidant activity.
Studies reporting on the detailed composition of phenolic acids in Jerusalem artichoke leaves [
2,
3,
5], the plant organ of highest abundance, and in tubers [
4], all agree on the prevalence of 3-CQA and the various dicaffeoyl isomers (i.e., 1,5, 3,5, and 4,5). Our conditional data seem to agree with this picture. In our assessment, the reference standards for 1,5 and 3,5-dicaffeoylquinic acid corresponded well with the major twin peak (RT = 11.5–11.6 min), however the presence of additional isomers cannot be excluded. Even with minor unidentified peaks, the quantitative HPLC-UV analysis of leaf and tuber extracts accounted for the more than seventy percent of the corrected TPC. The actual amount of phenolic acids in the leaf, though, appears to vary ten-fold (24 [
3]–267 [
5] mg g
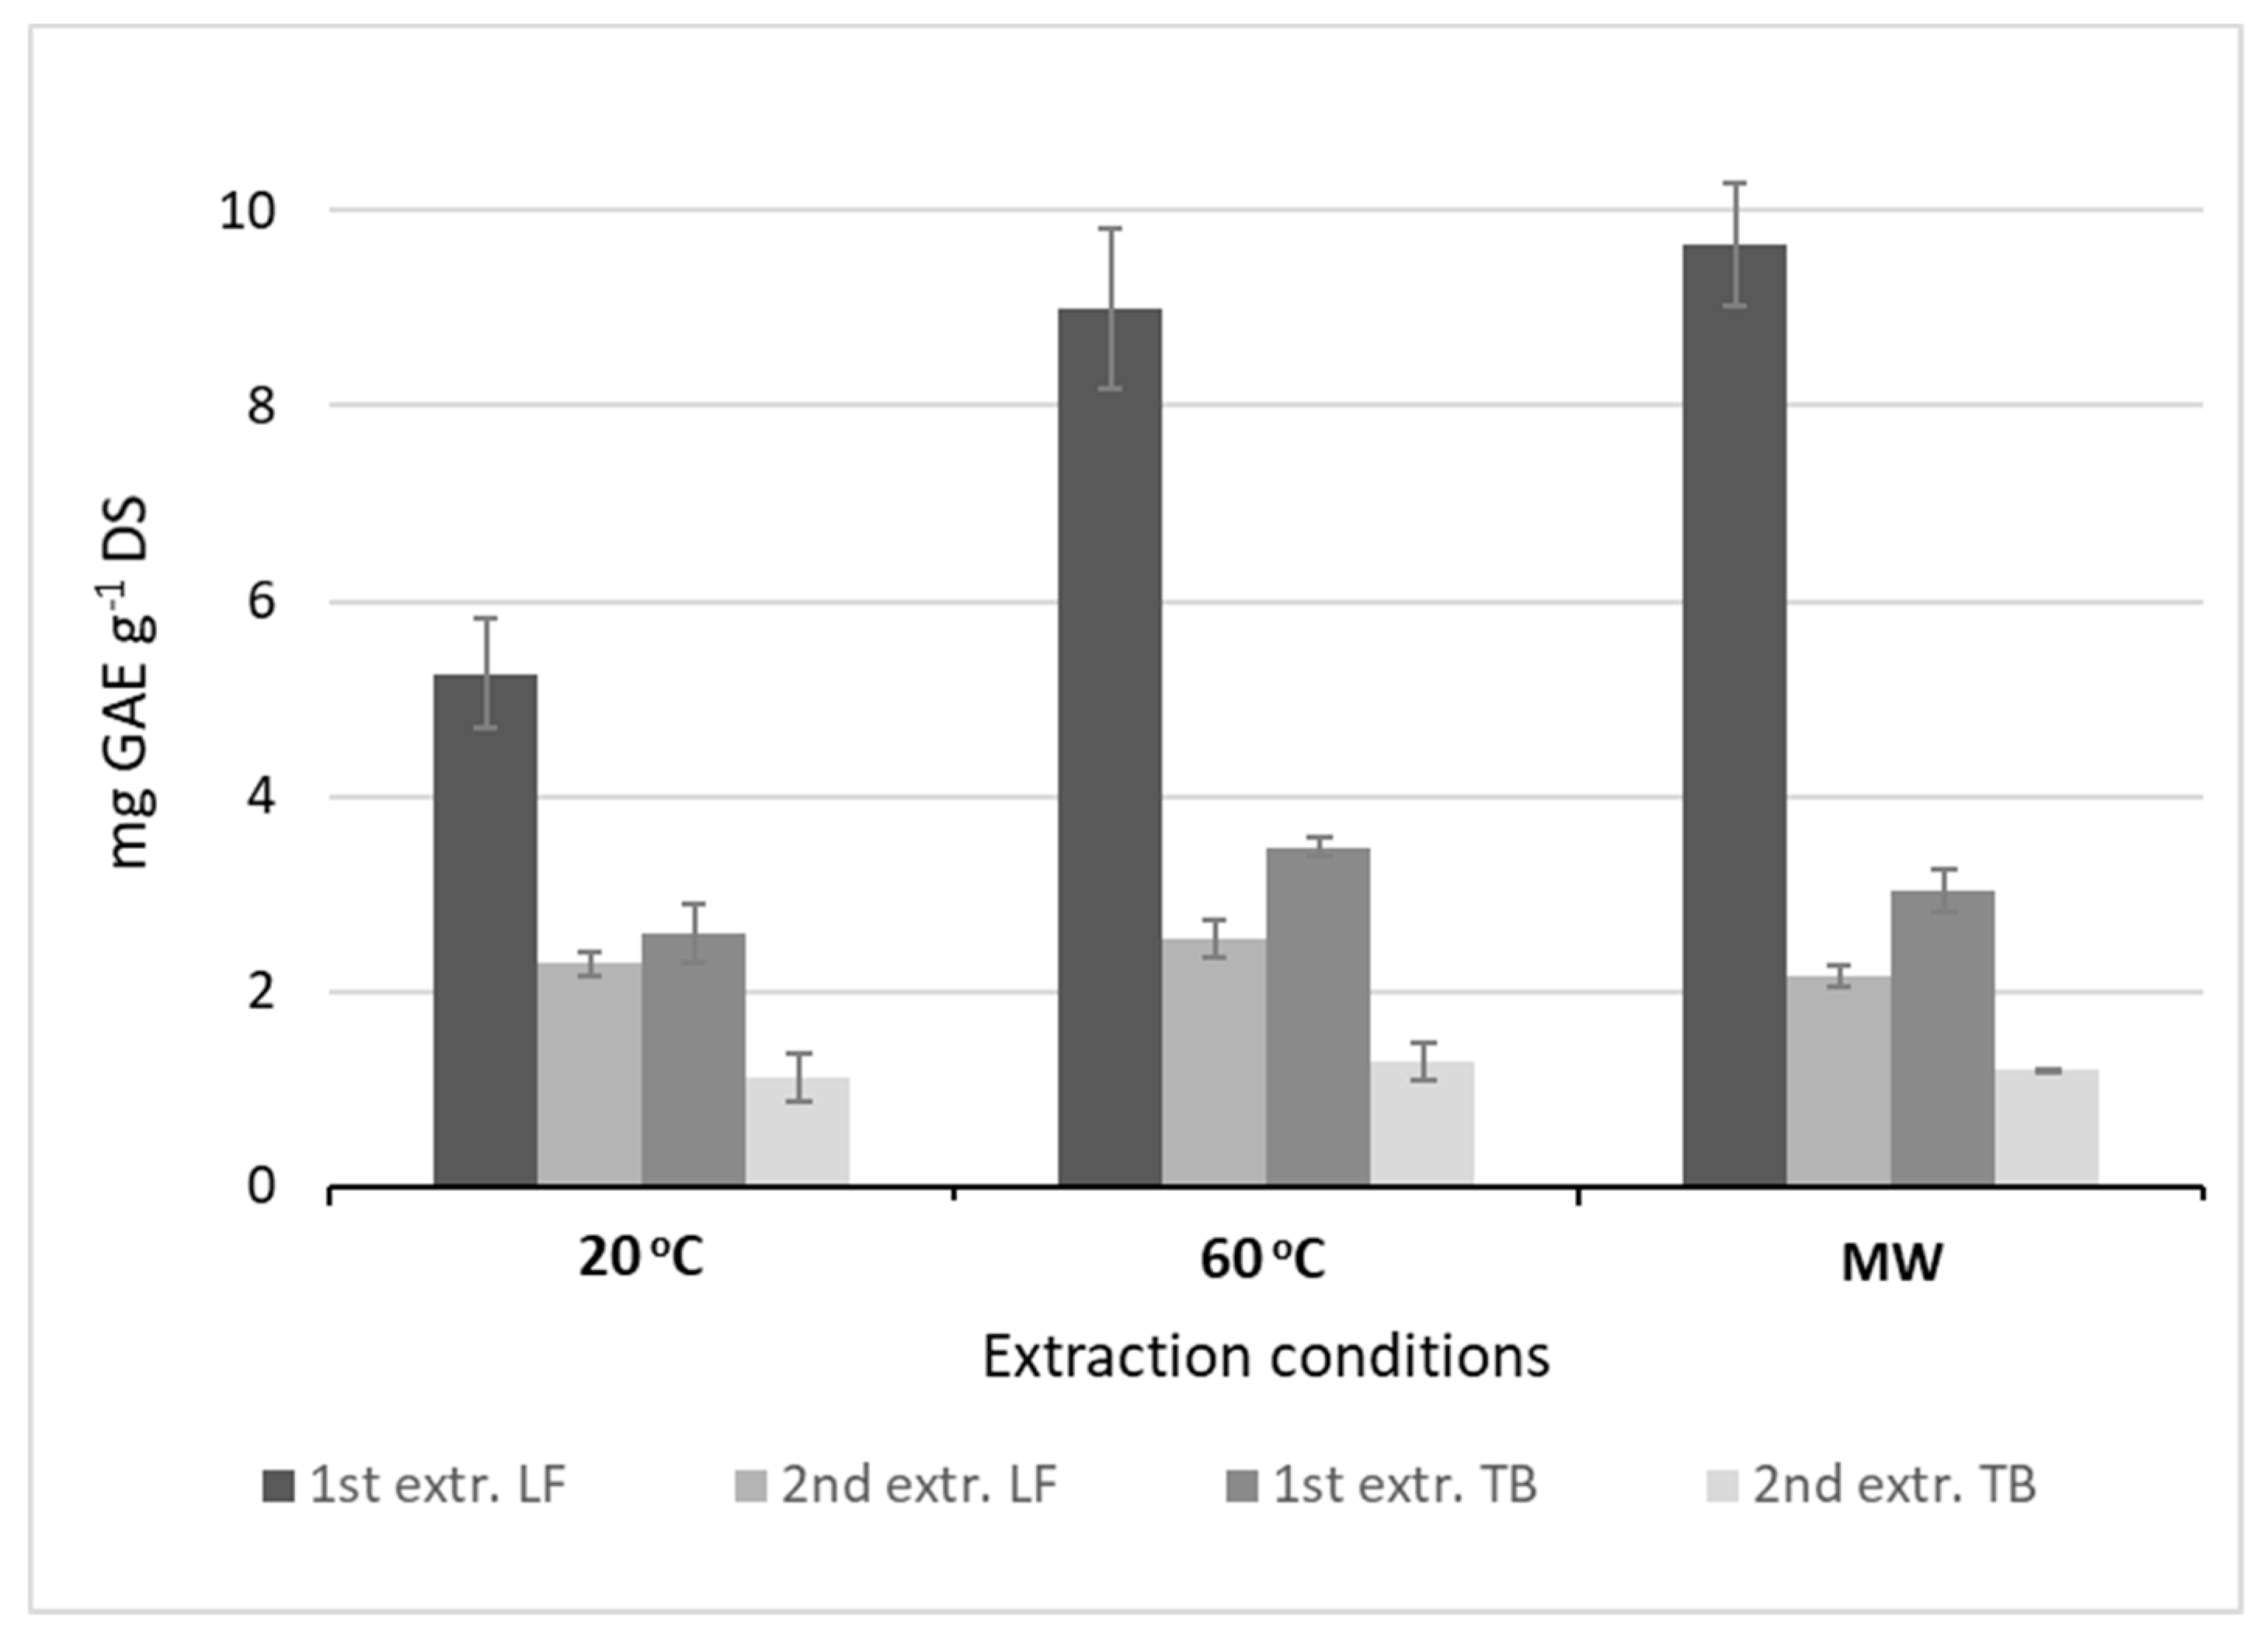
−1 DS), depending on the solvent system and extraction conditions. Growth conditions, harvest time, and plant variety may also affect the yield. With the “Dagnøytral” variety used in the current study, leaf yields (4–6 mg g
−1 DS) are modest in comparison, but re-extraction or prolonged holding time may increase yields about 20%. The overall yield of TPC increased significantly from a standard room temperature extraction under stirring via heated stirring at 60 °C, to intensified short-term microwave extraction. Solvent polarity differentiates on the extractability [
5] but phenolic acids in general dissolves well into polar solutions like aqueous alcohols (MetOH, EtOH). Taking into account the use of rational, high-yielding, and environmentally friendly extraction procedures, ethanol is a preferred solvent [
22]. This was also the conclusion of a study comparing extraction of antioxidants from herbs and spices into acetone (80%), ethanol (80%), methanol (80%), and distilled water [
23]. Water only, however, contrasts the apparent positive effects of elevated temperature and polar solvent, when used as solvent in a low-temperature high-pressure (LTHP) extraction with leaves. Compared to stirring, reflux, and autoclave extractions in water, LTHP resulted in substantial polyphenol yield (56.7 mg GAE g
−1 DS) and antioxidant activity [
24].
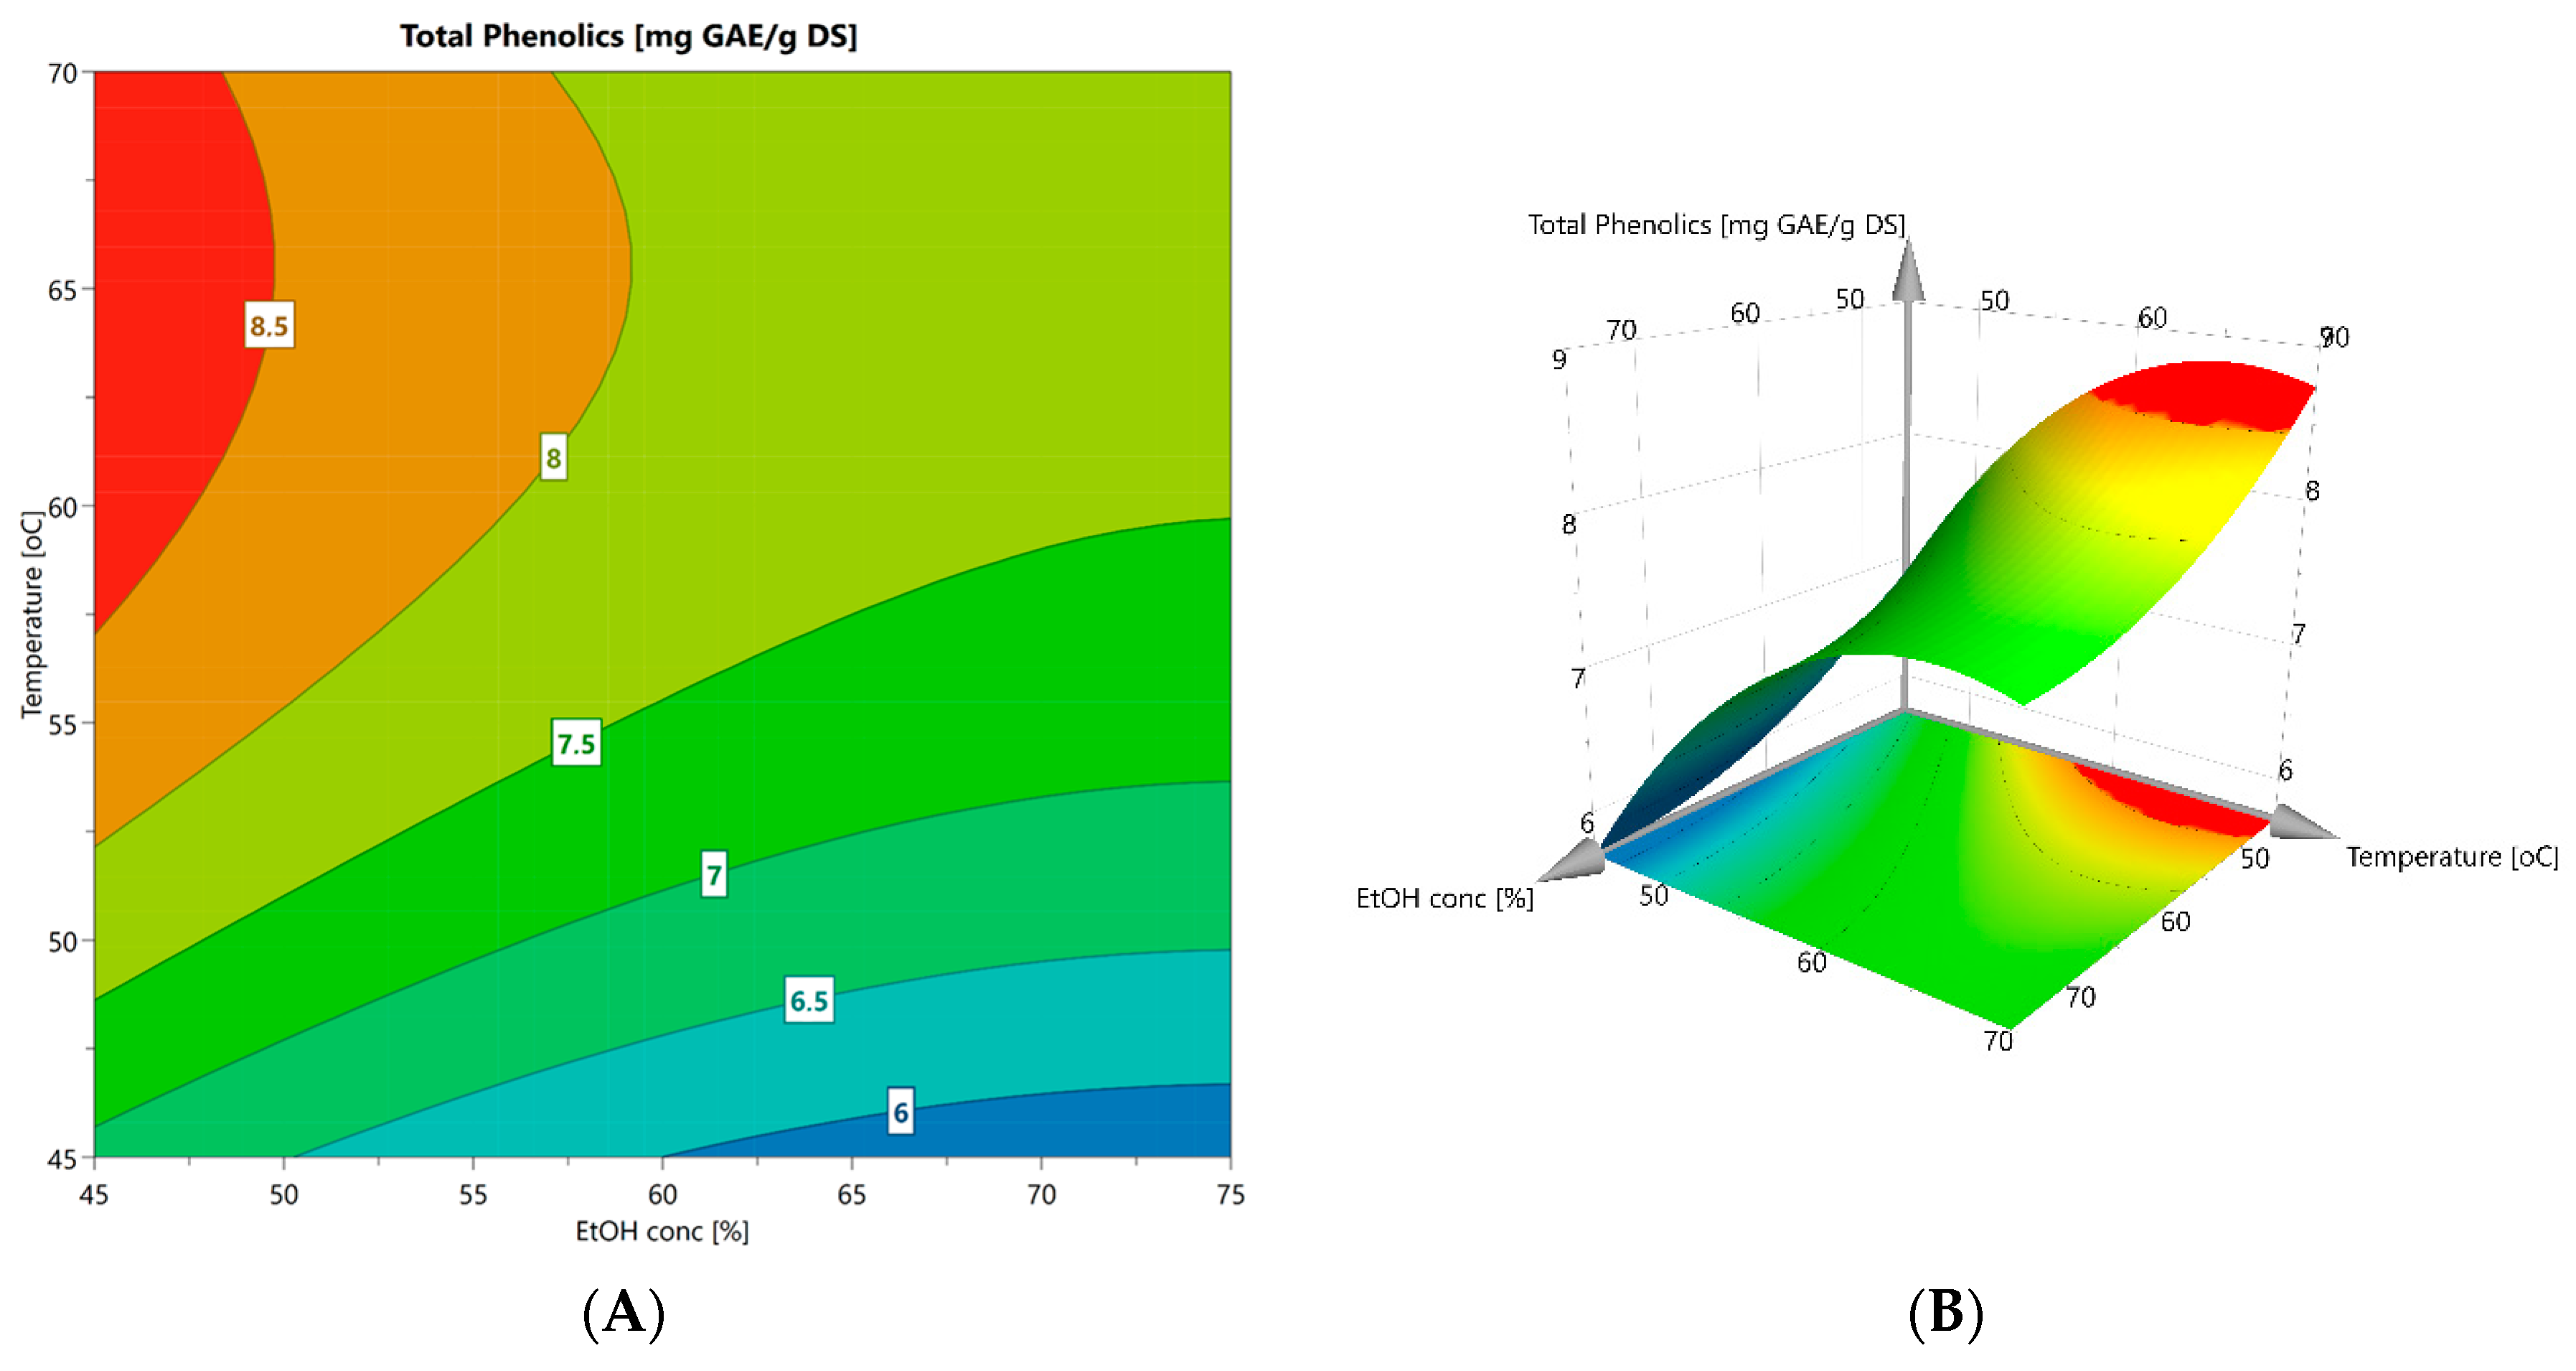
In our pursuit of simple and efficient means to obtain bioactive phenolic acids from leaf material, an optimization of extraction in aqueous EtOH and under heated stirring, appeared as the most rational approach. Thus, temperature, EtOH strength, and holding time were significant variables to test, and a CCF model allowed for curvature to the prediction surface. The outcome of the factorial design resulted in a model with a high degree of significance from which reliable predictions were made. When comparing the model set conditions (48%, 57 °C, and 60 min) to the reference conditions (60%, 60 °C, and 60 min), the corrected TPC values were undistinguishable, indicating the window of operation is quite wide and robust. Interestingly, different from several previous studies employing 70–90% aqueous EtOH, a solvent strength of 50% and below promoted the highest total phenolic yield from leaves. The high relative polarity of this solvent makes extraction of polar substances more likely, i.e., phenolic acids, leaving the less polar compounds in the leaf behind. These substances constitute bioactivities of considerable interest [
6,
10,
25]. The simple heated-stirring method has potential for scaling-up to obtain crude extracts of phenolics from bulk biomass. Further refinements of the recovered phenolic acids are possible, e.g., highly purified chlorogenic acid (3-CQA) from
H. tuberosus was successfully demonstrated by column adsorption to a macroporous polar resin, suitable for large-scale manufacturing [
9].
4. Materials and Methods
4.1. Chemicals
The chemicals including Gallic acid (G7384), ascorbic acid (20150.184), Folin–Ciocalteu phenol reagent 2N (F9252), α,α-diphenyl-β-picrylhydrazyl (DPPH) (D9132), chlorogenic acid (C3878), p-coumaric acid (C9008), caffeic acid (C0625), ferulic acid (1270311), 1,5-dicaffeoylquinic acid (16917), and 3,5-dicaffeoylquinic acid (SMB00131) were purchased from Sigma Aldrich (St. Louis, MO, USA).
All other lab chemicals not listed here were of analytical grade and obtained from general lab suppliers (i.e., VWR Norge). Absolute ethanol (96%) for assay purposes was purchased from Kemetyl Norge AS (Trollåsen, Norway). For extraction use, a technical grade, rectified fraction of ethanol (80% w/v) was obtained from a local distillery process (HOFF SA, Gjøvik).
4.2. Plant Material
Fresh tubers, stems, leaves, and flowers of Jerusalem artichoke were collected in late September from a 20 ha growth field at Fredheim farm (60.715° N, 11.127° E), Stange, Norway. The plant material was obtained from three individual full-grown plants (>2 m) spaced at least 5 m apart. The plants were of the Norwegian variety “Dagnøytral” and in their second growth season. Plant organs were sorted on site, then sealed and stored in the dark at 4 °C until treatment.
4.3. Pre-Treatment and Extraction
Plant organs were cut into pieces (<1 cm × 1 cm), or sliced (tubers, 2 mm), before freezing on plastic trays and subsequently freeze-dried (CHRIST ALPHA 1-4 freeze dryer; coil temperature −50 °C, vacuum 0.30 mbar). After freeze-drying, the material was crushed and the powder sifted manually through sieves of mesh sizes 1 and 0.5 mm. Extraction in ethanol was used for all samples and three temperature conditions were applied. A standard extraction volume was 30 mL of solvent per one gram dry solids (DS) sample.
4.3.1. Microwave-Assisted Extraction
A Teflon digestion vessel (BOLA A240-06, Bohlender GmbH, Grünsfeld, Germany) recommended for temperatures up to 150 °C was used. Sample and solvent (30 mL) were gently mixed into an inner lining before the vessel was sealed and irradiated for 2 min at 120 W in a kitchen MW unit (Samsung-ME82V). The vessel was cooled before the crude extract was recovered. The inner lining was carefully cleaned between each sample extraction.
4.3.2. Heated Stirring Extraction
Samples with solvent (30 mL) were mixed in sealed Erlenmeyer flasks (100 mL), and placed on an orbital shaker (ca. 80–100 rpm) inside a laboratory incubator set at 60 °C. Retrieved after the designated time (normally 60 min), flasks were cooled before the crude extract was recovered.
4.3.3. Room Temperature Stirring Extraction
Samples with solvent (30 mL) were mixed in sealed Erlenmeyer flasks (100 mL), placed on an orbital shaker (ca. 80–100 rpm), and left at room temperature (approximate 20 °C). After the designated holding time (normally 60 min), the crude extract was recovered.
4.3.4. Post-Extraction Treatments
The mixture of sample material and solvent was centrifuged at 5000 g for 15 min and 4 °C (Beckman Coulter Allegra TM 25R). The supernatant was carefully decanted and filtrated free of any remaining particles through a Whatman No.1 glass microfiber filter (4.7 cm) on a Büchner funnel using vacuum suction. Clarified extracts were stored cold in sealed 50 mL Falcon tubes until analysis.
4.4. Corrected Total Phenolic Content
Total phenolic content (TPC) of extracts was analyzed using the Folin–Ciocalteu (F–C) assay applying the correction for ascorbic acid (AA) as introduced by Isabelle and colleagues [
17], and Sánchez-Rangel and colleagues [
18]. Na
2CO
3 solution was prepared by dissolving 20 g of anhydrous Na
2CO
3 in 80 mL of water and bringing the mixture to a boil. After cooling, a few crystals of Na
2CO
3 were added. After 24 h, the solution was filled up to 100 mL and clarified through Whatman No.1 filter paper. For the reaction, 1.58 mL of water was added to 20 μL of the standard or sample solution, followed by addition of 100 μL of the F–C reagent. After 3 min of incubation at room temperature, the solution absorbance was read at 765 nm (UV-1601 spectrophotometer, Shimadzu Europa GmbH, Duisburg, Germany) to determine the reagent reaction with ascorbic acid. A standard curve (R
2 = 0.999) of ascorbic acid (AA) was prepared by using solutions of 0, 0.25, 0.5, 1, and 2 g mL
−1. Next, 300 μL of the Na
2CO
3 solution was added to the reaction mixture and incubated further for 2 h at room temperature. The total absorbance of the reaction including that of the phenolic content was determined at 765 nm. A standard curve (R
2 = 0.999) was prepared by using gallic acid solutions of 0, 50, 100, 150, 250, and 500 mg L
−1.
A corrected TPC value was obtained by first estimating the AA content (mg mL
−1) from the standard curve. Hence, it was established that 1 mg of AA had a reducing activity equivalent to 0.571 mg of GA, which in turn is used as a conversion factor expressing the AA reducing activity in the extract. Accordingly, the total AA content in the plant material extract was multiplied by 0.571, and the value subtracted from the TPC obtained after 2 h with the gallic acid standard curve, i.e.,:
4.5. Antioxidant Activity
The radical scavenging activity of phenolic acids was determined by the method of Sharma and Bath [
26] measuring the samples’ quenching capacity of radicals generated by the DPPH reagent. The assay was carried out in a microplate format using a FLUOstar OPTIMA microplate reader (BMG LABTECH). Standard solutions of chlorogenic acid and ascorbic acid were used at 0.1 mg mL
−1. Each microwell comprised of 100 μL of 60% EtOH, 2 μL of the standard phenolic acid solution, or an unknown sample and 100 μL of DPPH solution (50 μM). The negative control was 100 μL of DPPH solution and 100 μL of 60% EtOH. All samples were assayed in triplicate. The blank was of 200 μL 60% EtOH. Absorbance (Abs.) was measured automatically at 520 nm every minute for 30 min. The change in assay absorbance at the endpoint relative to the negative control was used to calculate the percentage of inhibition or quenching, by the sample according to the formula
4.6. Identification and Quantification of Phenolic Acids
The composition of extracts was determined by HPLC-UV comparing retention times of chlorogenic acid (CQA), caffeic acid (CA), p-coumaric acid (PQA), ferulic acid (FA), 1,5-dicaffeoylquinic acid (1.5 diCQA), and 3,5-dicaffeoylquinic acid (3,5 diCQA). The UltiMate3000 LC-UV system (Thermo Scientific) was used, fitted with a KINETEX 5µm C18 column (100 mm × 4.6 mm, Phenomenex) held at 25 °C. Peak data acquisition was made at 330 nm and 1.5 mL min−1. The mobile phase was composed of 95% trifluoroacetic acid (TFA, 0.1%) and 5% Acetonitrile (ACN). Standard curves of reference compounds were prepared by analyzing solutions at 0.01, 0.05, and 0.1 mgL−1.
4.7. Statistical Analysis
Analysis of variation (ANOVA) was performed on analytical values to test whether there was a significant difference between treatments and samples at a level of significance p < 0.05. ANOVA was applied to TPC analysis and antioxidant activity analysis.
4.8. Experimental Factorial Design in Extraction Conditions
To investigate the conditions giving the highest extraction yield of total phenolics from leaves, three experimental variables (ethanol concentration, temperature, and holding time) were screened in a 2
3-structured factorial approach using the quadratic Central Composite Face (CCF) model. The CCF design consisted of eight corner conditions (run 1–8), six star points on the cube faces (run 9–14), and a center point in triplicate (run 15–17), representing 15 unique conditions (Table 6). All extractions were carried out in technical replicates, resulting in 34 observations from the whole experiment. The MODDE 12.1 Pro (MKS Umetrics AB, Umeå, Sweden) software was used to generate the matrix, calculate regression coefficients, evaluate significance of variables, statistical analysis, and create charts for interpretation. In the statistical calculation, the real variable values were coded as dimensionless values (X
i). Center points allowed for calculation of experimental error and reproducibility. A response surface was determined by multiple linear regression (MLR) from coded table and matrix values (
Table 5 and
Table 6). Results from the MLR treatment were obtained with 95% confidence interval (
p < 0.05). A non-linear polynomial regression model was assumed according to the equation
where β
0 is the constant (intercept) term, β
i are the linear regression coefficients (main effects) of each variable x
i, β
ii are the squared coefficients, and ε is the residual term. The research hypotheses were β
i and β
ii ≠ 0. The suitability of the model was tested by analysis of variance at the 5% level using a Fischer F-test. Coefficients of determination (R
2) were evaluated for the linear and squared models.


