2.1. Method Validation
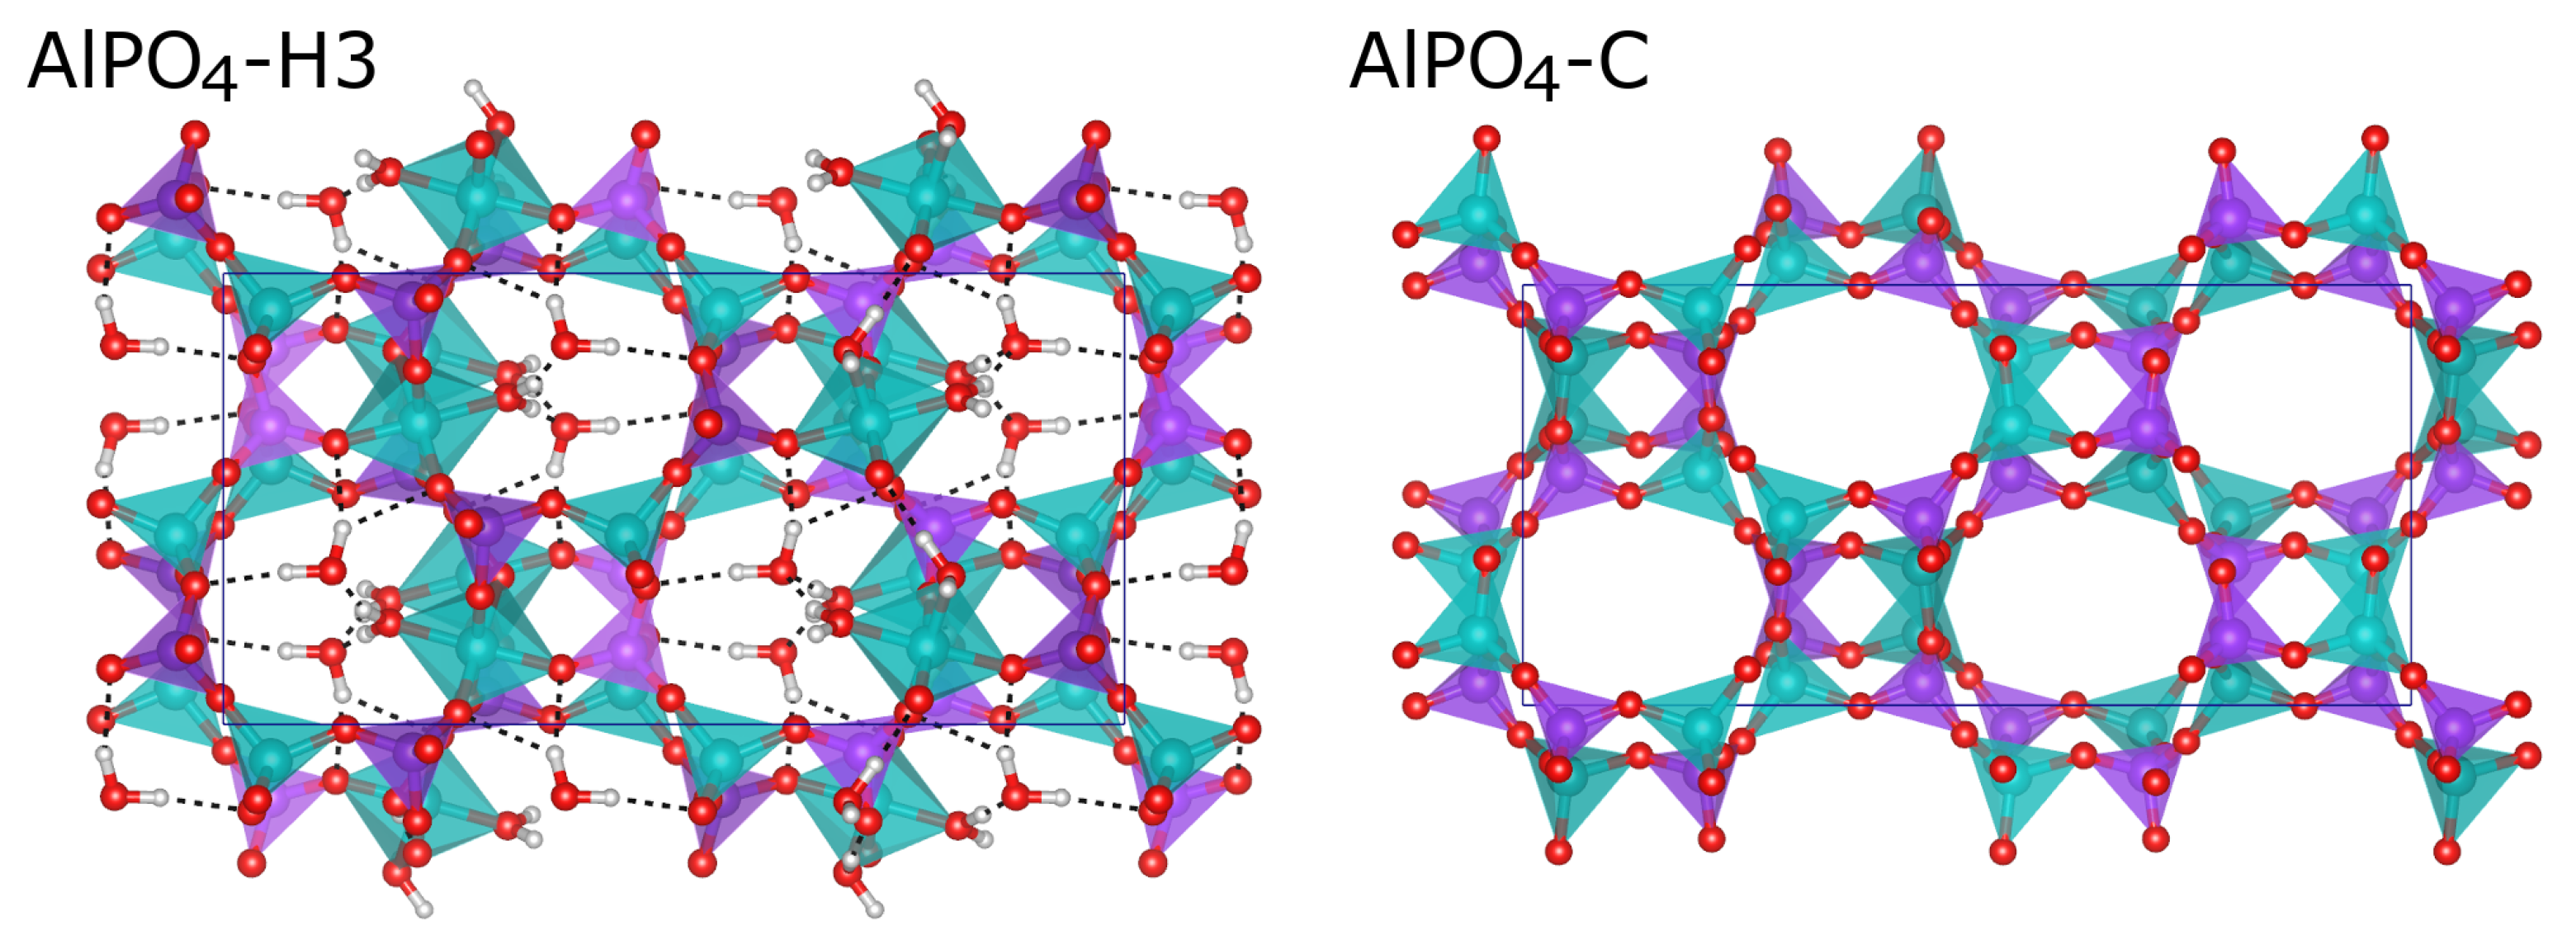
Structure optimisations of fully hydrated AlPO
4-H3 and dehydrated (calcined) AlPO
4-C were performed exploiting the symmetry of the experimentally determined structures (AlPO
4-H3: space group
, ITA No. 61, unit cell content Al
16P
16O
64·24H
2O; AlPO
4-C: space group
, ITA No. 61, unit cell content Al
16P
16O
64; in both structures, all atoms are located on general positions with multiplicity 8).
Table 1 compares the lattice parameters as well as selected average bond lengths obtained in DFT calculations using the PBE-TS functional [
22,
23] to experimental values. For the case of AlPO
4-H3, the most significant deviation in the lattice parameters is an overestimation of the length of
a by 0.15 Å (0.75%), whereas
b and
c agree to within 0.03 Å (0.3%). The lengths of the bonds between framework oxygen atoms and tetrahedrally coordinated Al and P atoms (
d(Al1-O
fw),
d(P-O
fw)) and octahedrally coordinated Al atoms (
d(Al2-O
fw)) are moderately overestimated by 0.015 to 0.025 Å. The same applies for the bonds from octahedrally coordinated aluminium to the water molecules (
d(Al2-O9),
d(Al2-O10)). With lengths of 1.981 Å and 1.965 Å, respectively, these bonds are roughly 0.1 Å longer than the average Al2-O
fw distance. The general tendency to deliver too long bonds is in line with previous work, where an overestimation of T-O bond distances (T = tetrahedrally coordinated atoms) in all-silica zeolites and aluminophosphates was observed for PBE-based approaches, independent of the presence/absence of a dispersion correction [
24]. While this is partly an inherent feature of this functional, it was also shown that the agreement between DFT and experiment can be improved if the experimental bond distances are corrected for the correlated motion of TO
4 tetrahedra [
25]. Indeed, correcting the experimental bond distances using the “simple rigid bond” (SRB) model of Downs et al. [
26] brings experimental and computed values closer together (
Table 1), but the tendency to overestimate the T-O bond lengths remains prominent.
For the case of AlPO
4-C, the agreement in lattice parameters is markedly less good than for AlPO
4-H3, as the length of
a is overestimated by almost 0.6 Å (∼3%), whereas
b is underestimated by 0.4 Å (∼4%). For the T-O bond lengths, there is a trend to overestimate these distances by roughly 0.02 Å, as for AlPO
4-H3. While the average Al-O and P-O bond lengths are essentially the same for AlPO
4-H3 and AlPO
4-C, it is worth noting that the scatter in the individual experimental values is considerably larger for the latter system (see
Table S1 of Supporting Information), where the structure was refined from powder data.
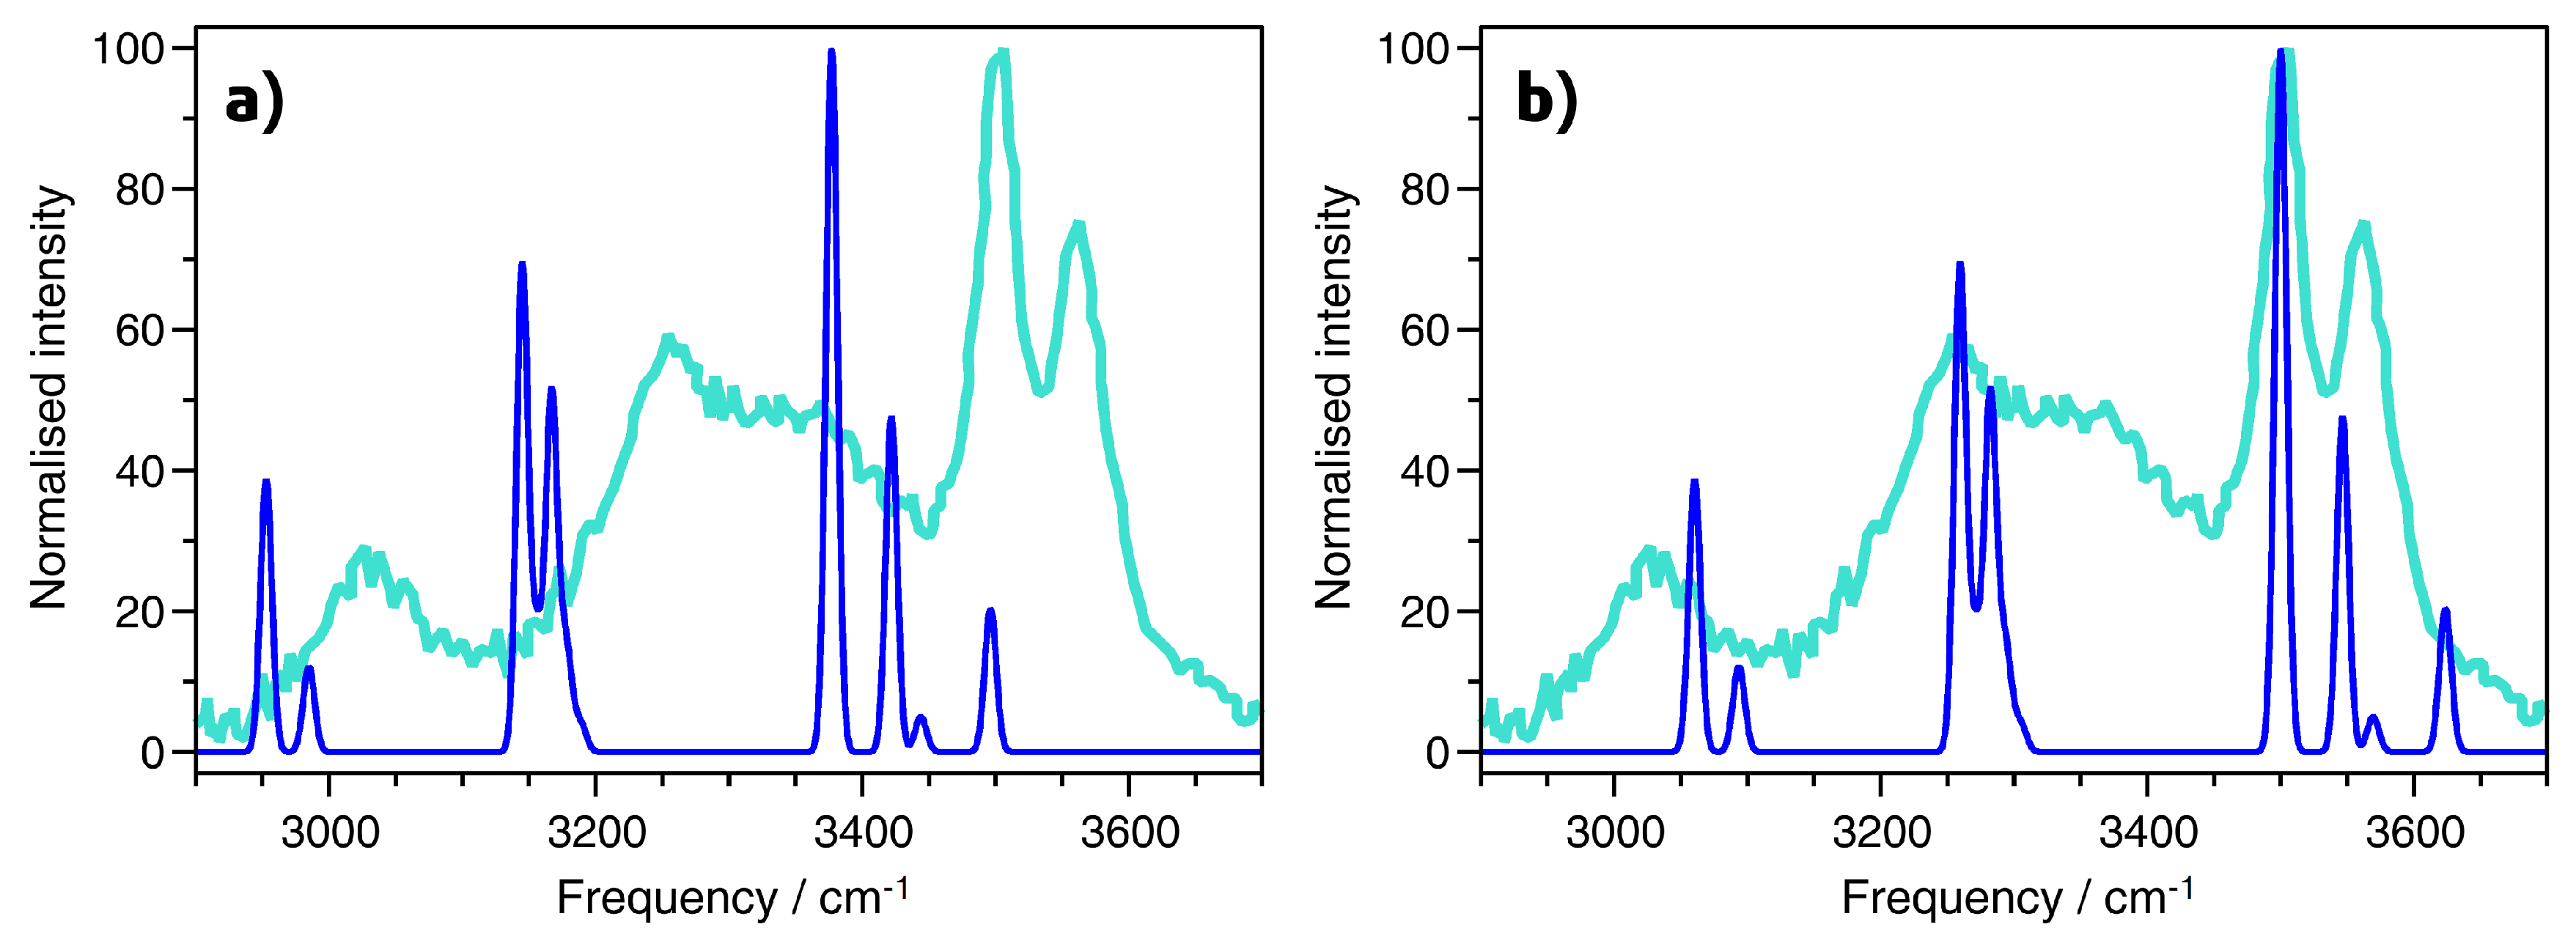
A Raman spectrum of AlPO
4-H3 for the wavenumber range from ∼2900 cm
−1 to ∼3800 cm
−1 was reported by Knops-Gerrits et al. [
7]. These authors identified a total of five bands, centered at 3012, 3255, 3379, 3505, and 3563 cm
−1.
Figure 2 presents a comparison of the experimental Raman spectrum to the spectrum obtained from PBE-TS calculations for the same wavenumber range, with
Figure 2a showing the unscaled calculated spectrum (for the purpose of visualisation, a Gaussian broadening of 10 cm
−1 was applied to all spectra). The comparison with experiment shows a systematic shift of the PBE-TS bands to lower frequencies, however, the relative positions and intensity ratios are reproduced rather well. An excellent match between the DFT-computed and experimental Raman spectrum can be obtained by scaling the frequencies by a common factor of 1.037, as shown in
Figure 2b. A scaling factor in this range does not seem completely unreasonable for a PBE-based approach [
27,
28]. For a free water molecule (H
2O placed in a large box), PBE-TS gives O-H stretching frequencies of 3584 cm
−1 and 3699 cm
−1, compared to experimental values of 3657 and 3756 cm
−1, and scaling by a slightly smaller factor of 1.018 would be necessary to give agreement to within 10 cm
−1 for both frequencies. For the H-O-H bending mode, however, the PBE-TS frequency is slightly overestimated, with 1607 cm
−1 compared to an experimental value of 1595 cm
−1. Thus, no simple scaling would lead to agreement between experiment and DFT across the whole frequency range. Since the main aim of this work is not an accurate quantitative prediction of the frequencies, but a qualitative interpretation of the modes, only unscaled IR and Raman spectra will be shown throughout.
In addition to the PBE-TS calculations, further calculations for AlPO
4-H3 and AlPO
4-C were performed using the PBEsol-D2 functional [
29]. This functional was found to give very good agreement with experimental structure data for guest-free AlPOs and all-silica zeolites in previous work [
25]. While use of PBEsol-D2 resulted in better agreement with experimental lattice parameters than found for PBE-TS, a more pronounced tendency to underestimate the length of the hydrogen bonds was observed (see following section). Moreover, the calculated Raman spectrum agreed less well with experimental data. Therefore, the PBEsol-D2 results are not discussed any further.
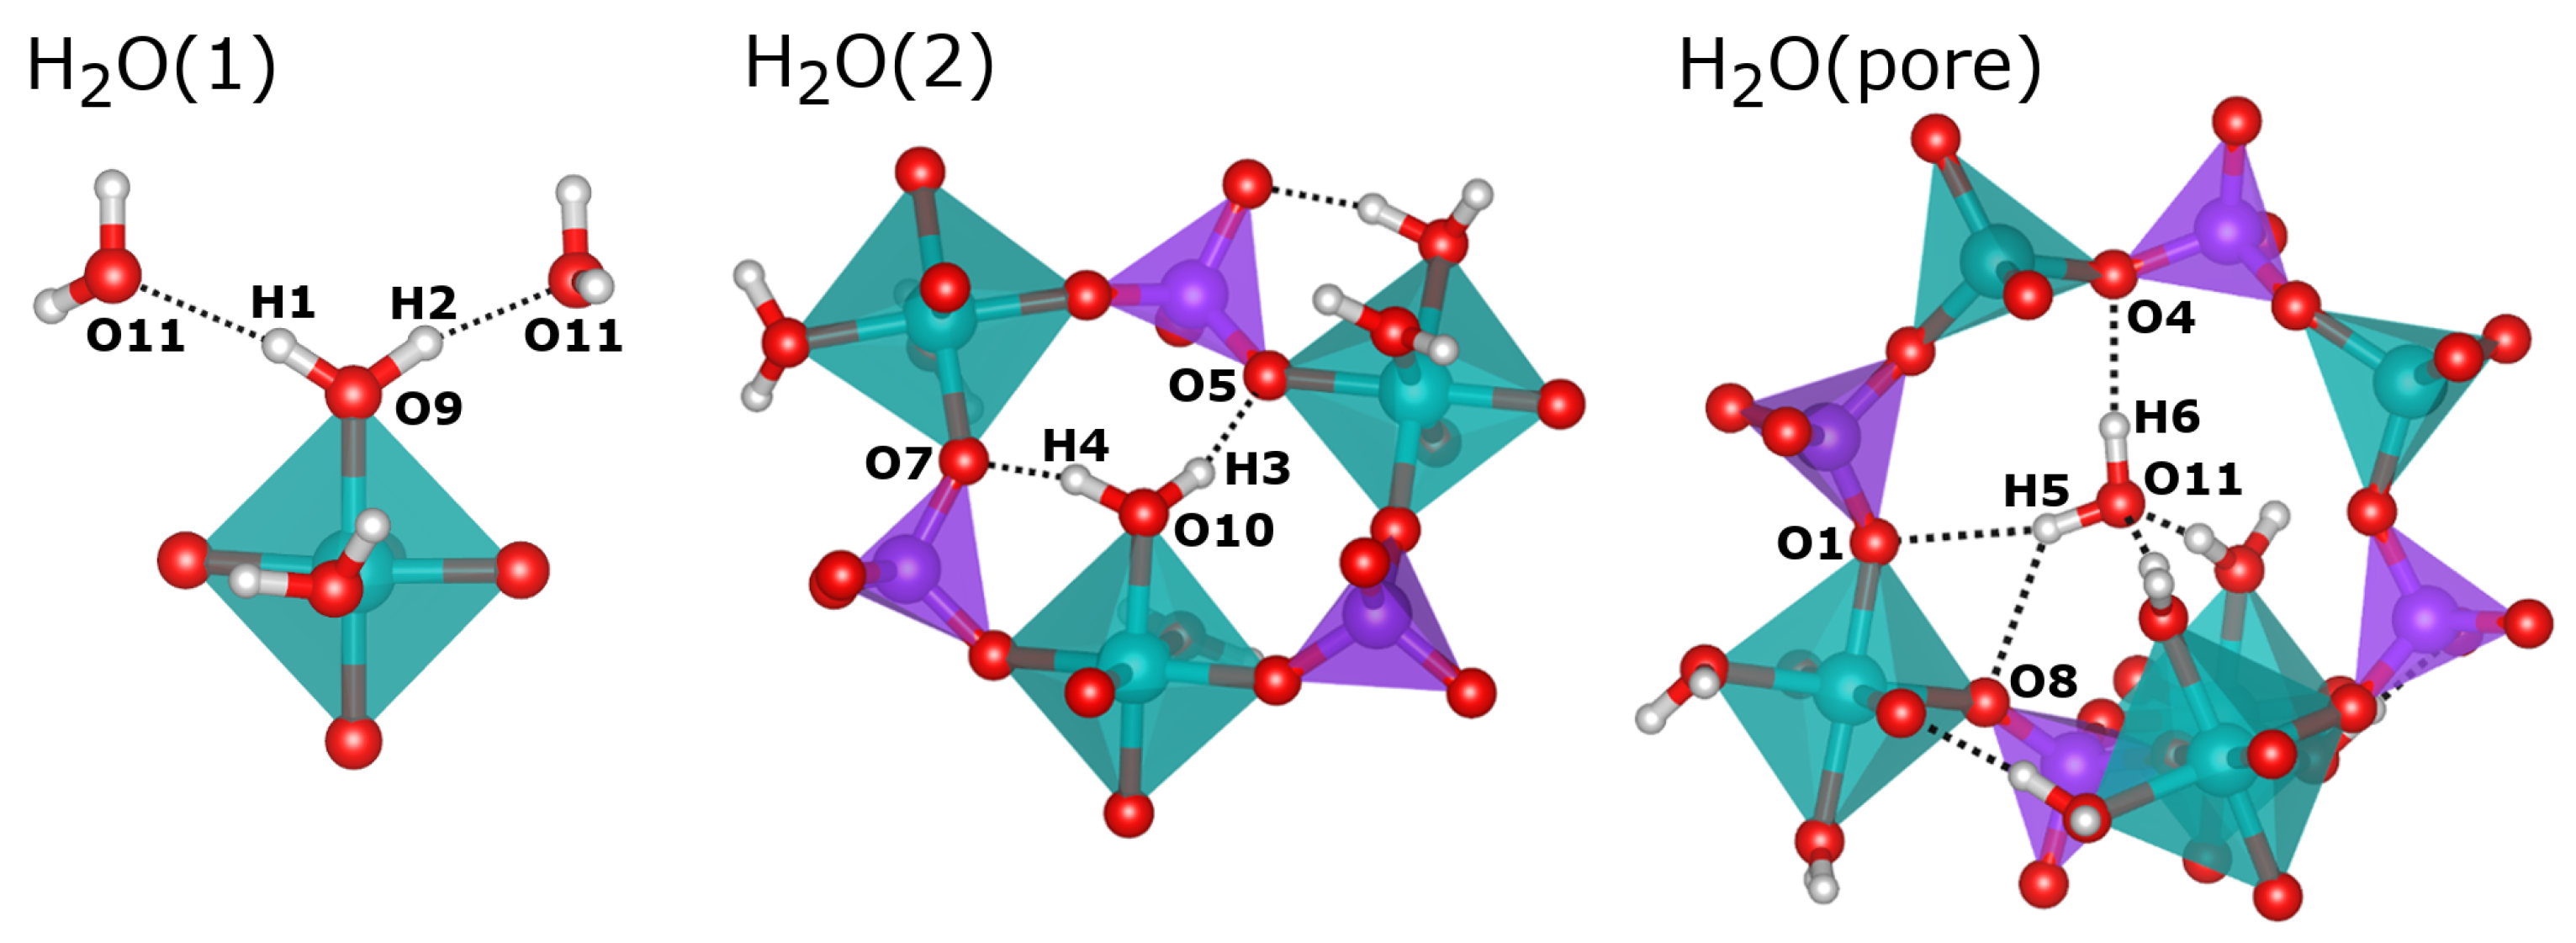
2.2. Hydrogen Bonds
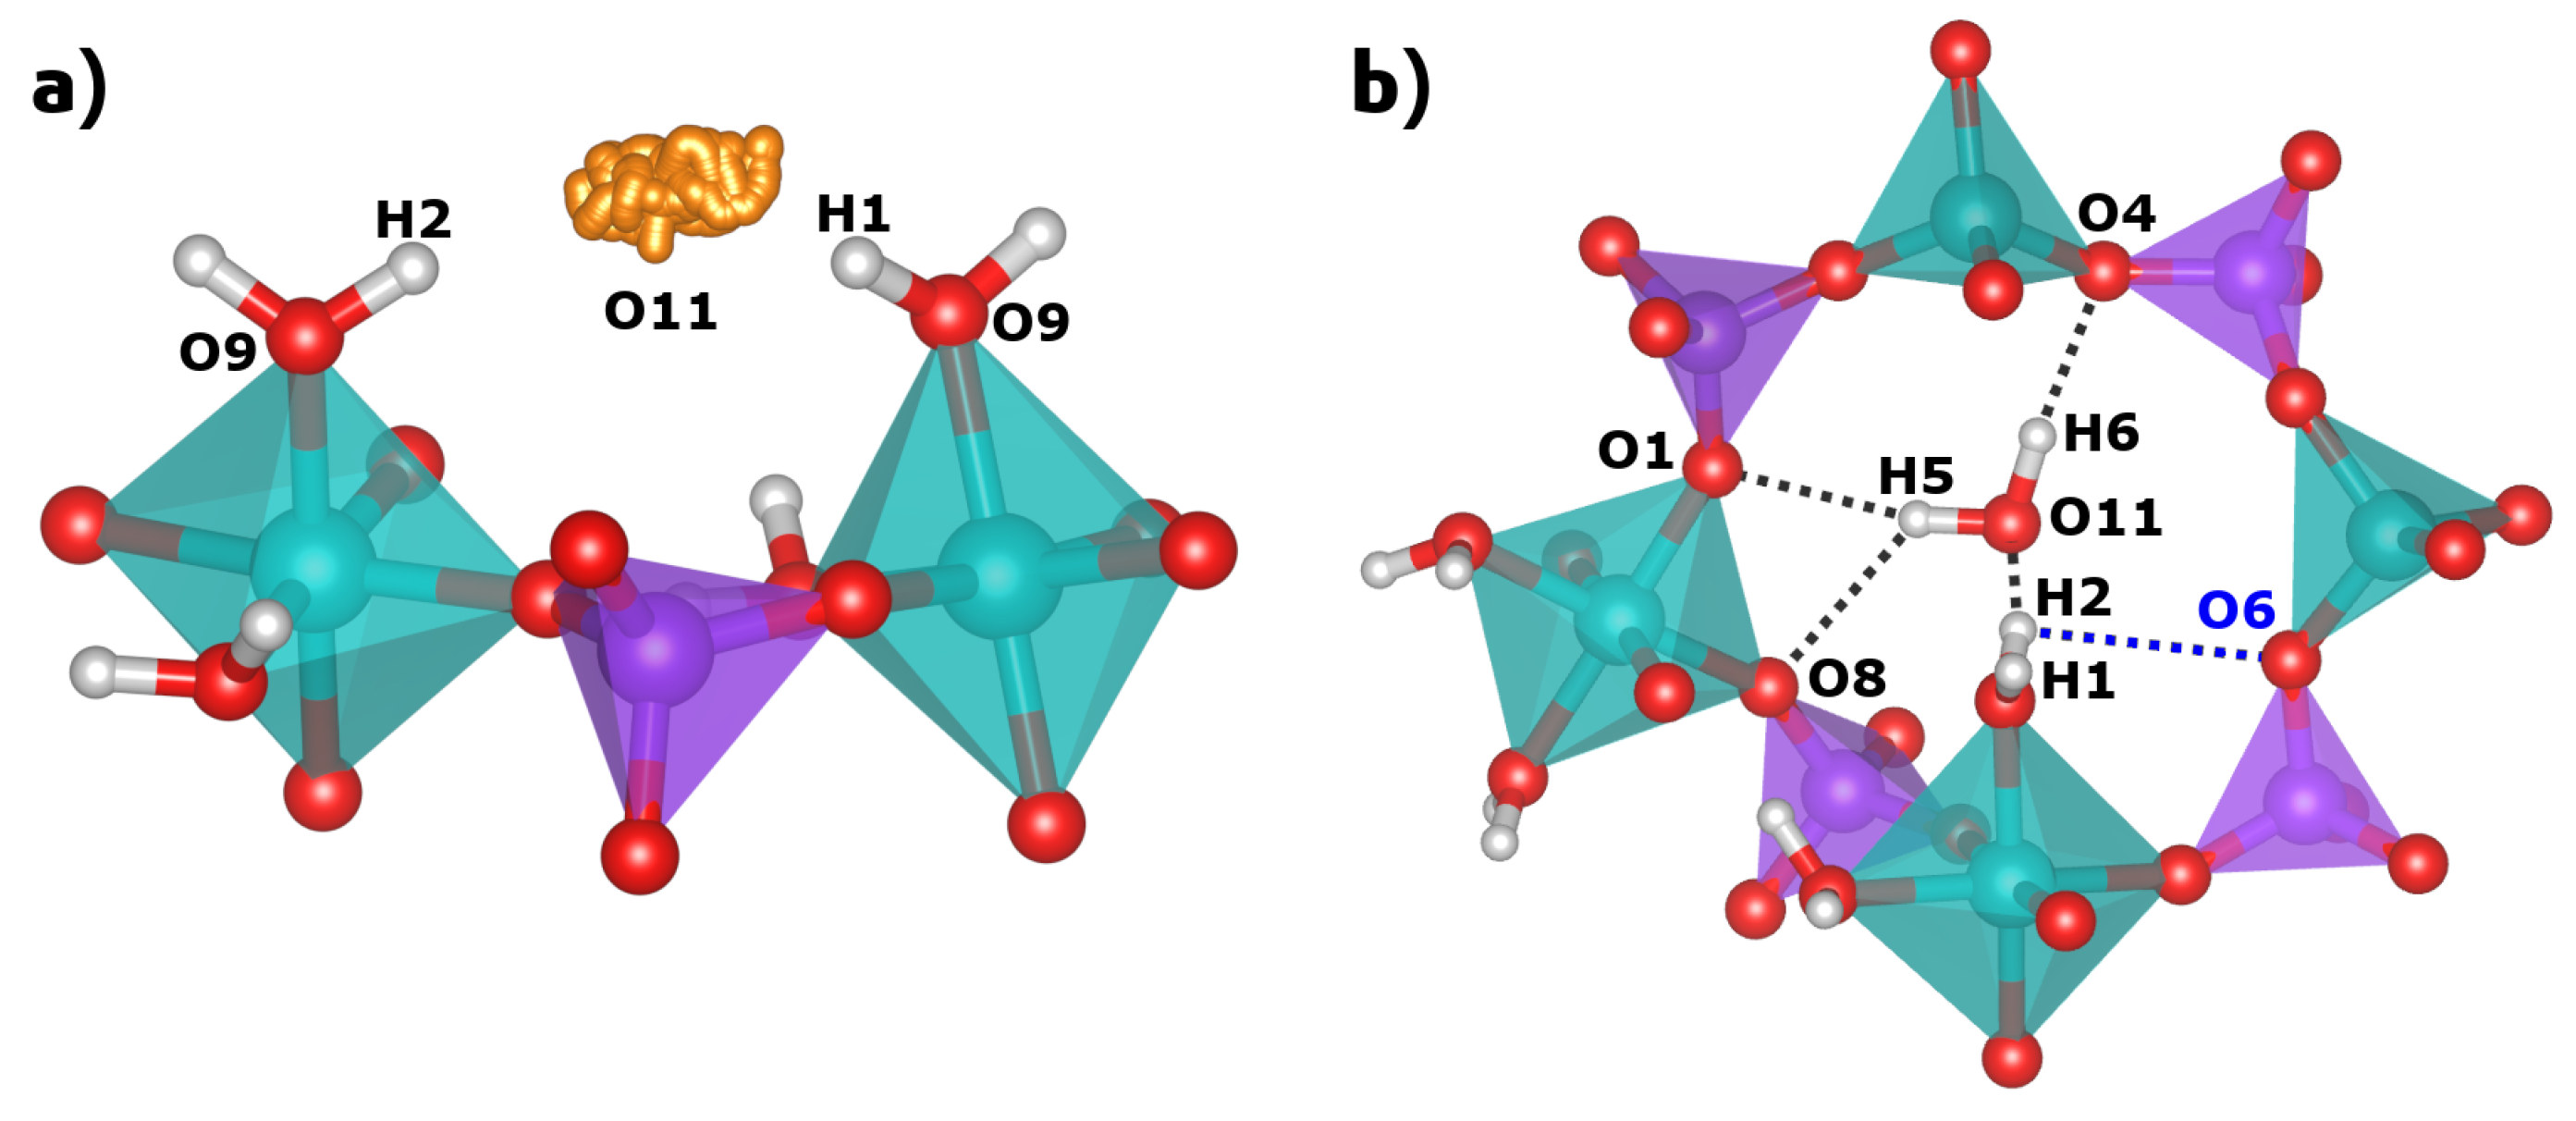
In their sc-XRD investigation, Pluth and Smith obtained an almost complete structure of AlPO
4-H3, which includes the oxygen positions of the three non-equivalent water molecules [
10]. The H
2O(1) and H
2O(2) molecules are part of the octahedral coordination environment of the Al2 atom. The oxygen atoms of these H
2O molecules are labelled O9 (H
2O(1)) and O10 (H
2O(2)) in this work to maintain consistency with the published crystal structure. The oxygen atom O11, which corresponds to the third water molecule H
2O(pore), resides near the center of the eight-ring channels. For H
2O(1) and H
2O(2), Pluth and Smith also refined the hydrogen positions (H1/H2 and H3/H4), fixing the O-H bond lengths to 0.85 Å and the H-O-H angles to the tetrahedral angle. The H
2O(1) molecule points into the eight-ring channels that run along the
c-axis. Its hydrogen atoms, H1 and H2, form relatively long hydrogen bonds (H
O distances of ∼2.1 and ∼2.2 Å) to the oxygen atom O11, i.e., the H
2O(pore) water molecule (see
Figure 3). In contrast, the H
2O(2) molecule projects into six-rings, and the attached hydrogen atoms H3 and H4 form shorter hydrogen bonds (H
O distances of ∼1.8 and ∼2.0 Å) to two framework oxygen atoms, O5 and O7. The experimental localisation of the hydrogen atoms of the H
2O(pore) molecule from sc-XRD data was not possible, so these atoms (H5 and H6) were added for the calculations.
A comparison of experimental and DFT-optimised hydrogen bond distances and O-H
O angles is given in
Table 2. While the hydrogen bonds formed by the Al-coordinated water molecules have already been described above, those of H
2O(pore) can only be assessed after the DFT optimisation: Here, the H6 hydrogen atom forms a single hydrogen bond to the framework oxygen atom O4, whereas the H5 hydrogen has similarly close contacts to O1 and O8, both in the range of 2.35 Å (
Figure 3). This bonding scenario is best described as a “bifurcated” hydrogen bond, and is reminiscent of some hydrogen bonds present in the nonporous hydrated aluminophosphate metavariscite [
15]. For the Al-coordinated water molecules, a comparison of the DFT-optimised H
O distances to experimental values shows that the hydrogen bonds are consistently shorter in the PBE-TS optimised structure, with differences up to 0.36 Å. This can be attributed to the underestimation of hydrogen bond distances by PBE-based approaches, which has been demonstrated previously [
30,
31,
32], and to the use of a fixed covalent O-H bond length of 0.85 Å in the sc-XRD structure refinement, which is considerably smaller than the (more realistic) PBE-TS equilibrium value of 0.99 Å [
31]. Indeed, if the O
O distances are compared, experimental and PBE-TS distances agree within ∼0.05 Å for hydrogen bonds from H
2O(2) and H
2O(pore) to framework oxygen atoms (this includes the bifurcated H bond). However, agreement is less good for the two hydrogen bonds from H
2O(1) to H
2O(pore): Here, one O
O distance is 0.13 Å longer in the PBE-TS structure compared to experiment, whereas the other one is 0.21 Å shorter. A closer inspection reveals that the O11 oxygen atom of H
2O(pore) moves approximately 0.2 Å along the channel during the DFT optimisation, causing the observed changes of the interatomic distances. As we will see below, when discussing the results of the AIMD simulations, H
2O(pore) does indeed exhibit a rather large mobility in the channel, and it can thus be expected that the dynamic behaviour affects the average position of this molecule in the real structure at room temperature (the sc-XRD experiment was performed at
T = 295 K).
2.3. Comparison of Fully and Partially Hydrated APC Phases
Table 3 reports the interaction energies
and adsorption enthalpies
(for
T = 298 K) obtained from the DFT calculations for fully hydrated AlPO
4-H3 and for partially hydrated forms in which either one or two of the three non-equivalent water molecules were removed. There are eight water molecules of each kind in the unit cell. In the partially hydrated structures, all symmetry-equivalent images of the respective water molecule(s) were removed, retaining the
symmetry. Optimised unit cell parameters and structure projections of these partially hydrated phases are given in the
Supporting Information. For AlPO
4-H3, the interaction energy of about −82 kJ mol
−1 is more negative (i.e., the interaction is stronger) than energies obtained in analogous PBE-TS calculations for six AlPOs with larger pores and different topologies (among them AlPO-34 and AlPO-18), which amounted to approximately −65 kJ mol
[
33]. The difference can be explained with the ordered arrangement of water molecules in the narrow channels of AlPO
4-H3, which maximises the number of hydrogen bonds per molecule. In contrast, a disordered distribution of the water molecules was assumed in the calculations for AlPOs with larger pores. It is also worth noting that the relative contribution of non-dispersive interactions is larger in AlPO
4-H3, amounting to about 70% of the total interaction energy, compared to ∼60 to 65% in other AlPOs, confirming the larger energetic contribution of hydrogen bonds (this contribution was obtained by calculating the difference of the “pure” PBE energies, without the TS dispersion energy, and dividing it by
). While no enthalpy of water adsorption has been determined experimentally for AlPO
4-H3, it should be noted that the calculated
of −67 kJ mol
−1 is considerably more negative than experimental values determined for systems like AlPO-18, which are typically in the range of −55 kJ mol
−1 [
2]. This is in line with the higher temperature of dehydration: Whereas AlPO-18 can be dehydrated below 100
C [
2,
34], dehydration of AlPO
4-H3 occurs between 80 and 130
C [
20]. Thus, both experiment and DFT calculations indicate that AlPO
4-H3 interacts more strongly with water than AlPOs with larger pores. Nevertheless, it should be emphasised that one cannot expect quantitative accuracy from the calculations, which is why the PBE-TS enthalpy of adsorption should be considered as a semi-quantitative estimate.
For the partially hydrated phases, we observe a rather large variation in the unit cell volumes. For example, the removal of H
2O(1) leads to a structure in which both the Al1 and Al2 atoms are in trigonal-bipyramidal coordination, causing a significant reduction of the unit cell volume to 1473 Å
3, whereas the other 2/3 hydrated models have volumes that are much closer to that of AlPO
4-H3 (∼1800 Å
3). Nevertheless, the interaction energy—which effectively constitutes a combination of energetic contributions from host-guest interactions and from the overall deformations of the host structure—is very similar for all three 2/3 hydrated models. This is not the case for the 1/3 hydrated phases, where the
value of −45 kJ mol
−1 obtained for the model containing only the H
2O(1) molecule differs considerably from those of the other two models, which are in the range of −70 kJ mol
−1. A closer inspection of the structures shows that the water molecules are coordinated to framework Al atoms in all three structures, and that they participate in one or two short hydrogen bonds. The local environment of the water molecule thus provides no apparent explanation for the large difference in the interaction energy. However, the host structure is deformed to a varying extent: In the models containing only H
2O(2)/H
2O(pore), pronounced elliptical distortions of eight-rings/six-rings cause a reduction of the unit cell dimensions, with the unit cell volumes being 13/10% smaller than that of AlPO
4-H3. Such a volume reduction does not happen in the model containing only H
2O(1). While we observe an inverse correlation between unit cell volume and stability for the 1/3 hydrated phases, a correlation that is well-established for guest-free tetrahedral frameworks [
35], this is not found for the 2/3 hydrated models. Altogether, these findings point to a complex interplay of the energetic contributions from hydrogen bonds, from local framework distortions (non-optimal bonding geometries/distorted coordination environments), and from global framework deformations (changes in unit cell volume).
2.4. Vibrational Spectra
An analysis of the DFT-computed IR and Raman spectra was performed with emphasis on two different aspects: On the one hand, it was analysed which water molecules are responsible for which bands in the frequency region above 1200 cm
−1 (O-H stretching, H-O-H bending) in order to test whether vibrational spectroscopy allows for a distinction between Al-coordinated molecules and water molecules adsorbed in the channels. On the other hand, it was attempted to identify lower-frequency modes (<1200 cm
−1) that could potentially be used as “fingerprint” modes indicative for the presence of six-coordinated Al atoms. The analysis proceeded as follows: After calculating IR and Raman spectra, the displacement patterns associated with all modes with significant intensity were visualised using Jmol [
36] in order to get a qualitative overview of the most prominent displacements. In the following, the magnitude of the atomic displacements was analysed in a more quantitative fashion to determine which atoms make the largest contribution to certain modes of particular interest. Clearly, any such assignment remains a simplification, because every mode is associated with the displacement of several atoms. Nevertheless, it was often possible to identify one or a few non-equivalent atom(s) that predominantly contribute to a given mode. The
Supporting Information contains the CASTEP *.phonon files of AlPO
4-H3 and AlPO
4-C, from which the atomic displacements can be visualised with Jmol.
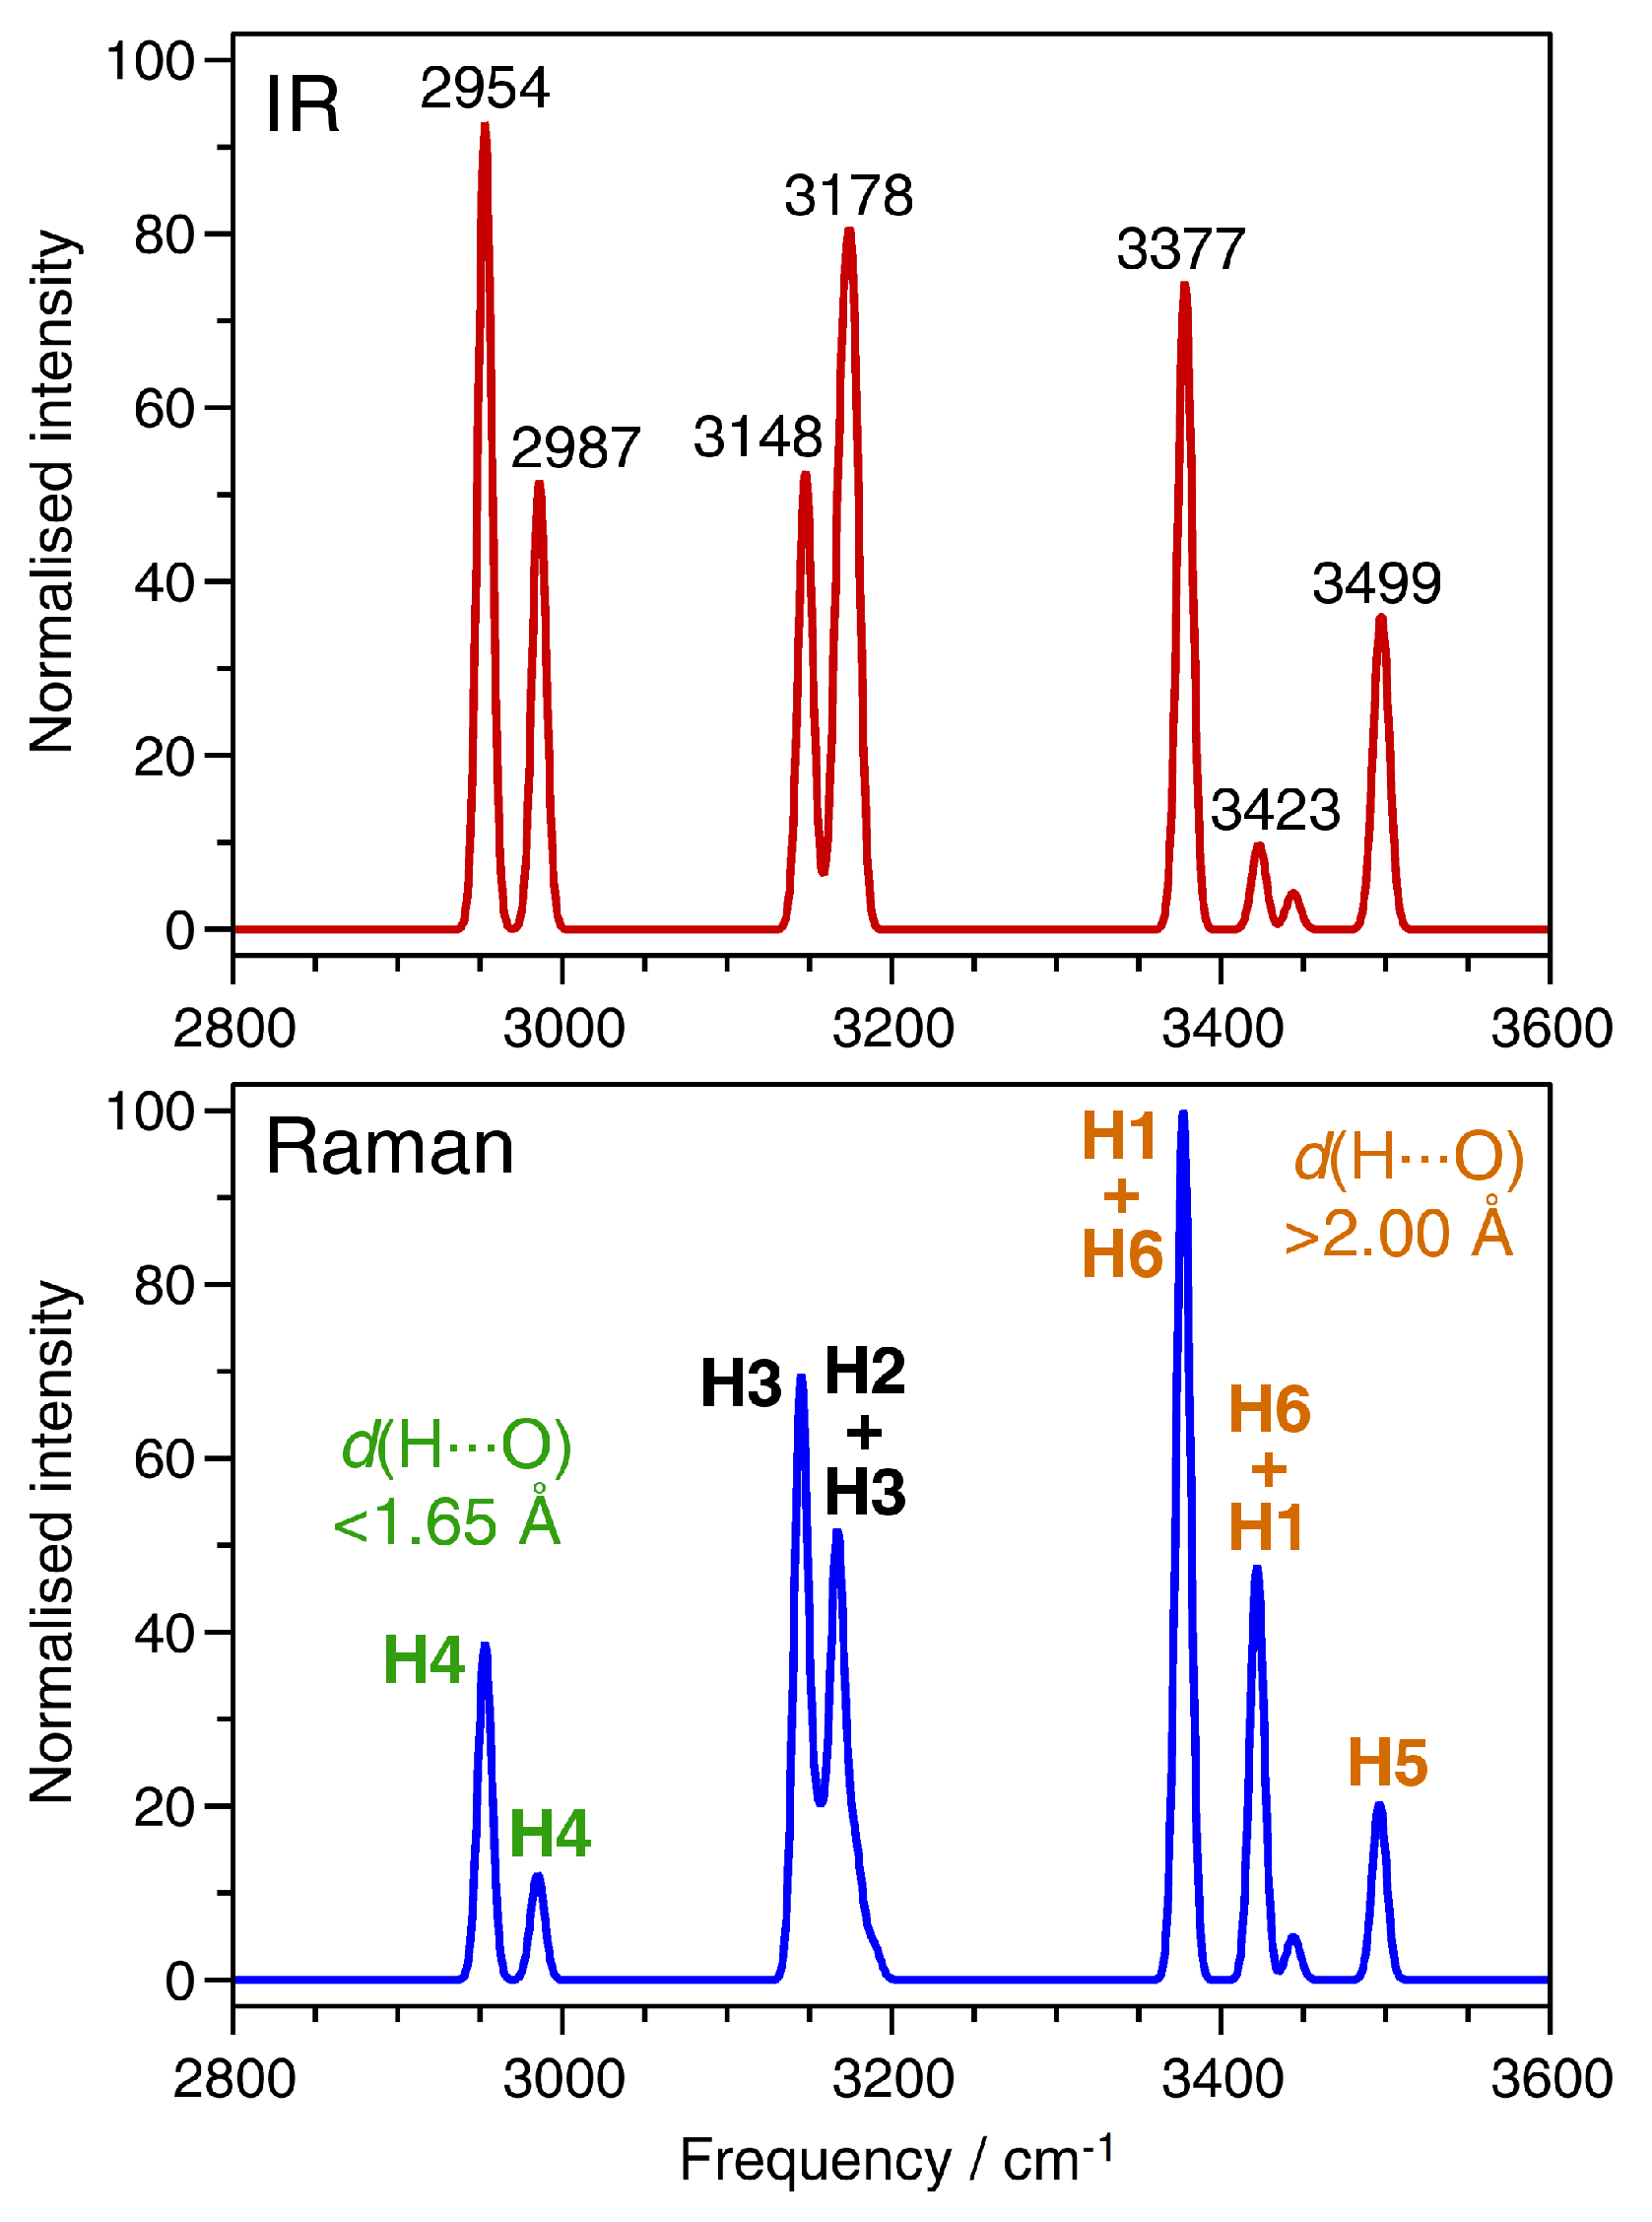
The first part of this analysis deals with the O-H stretching region between ∼2900 and 3600 cm
−1. The IR and Raman spectra calculated for this frequency region are shown in
Figure 4. All bands are shifted towards lower frequencies (red-shifted) with respect to free water. This red-shift is a consequence of the elongation of the covalent O-H bonds caused by the involvement of the water molecules in hydrogen bonds [
37]. The assignment of displacements of the non-equivalent hydrogen atoms to different modes is summarised in
Table 4, together with the O-H and H
O distances for each H atom. Starting from the high-frequency end of the spectrum, the bands at ∼3500 cm
−1 are predominantly associated with displacements of the H5 atom, which participates in the bifurcated hydrogen bond, having the shortest O-H bond length (i.e., least elongation compared to free water) and the longest H
O distances. The bands between ∼3380 and 3450 cm
−1 are primarily due to vibrations of the H1 and H6 atoms. Although these hydrogen atoms belong to different types of water molecules (H6: H
2O(pore), H1: Al-coordinated H
2O(1)), they contribute to bands in the same frequency range because of similar hydrogen bond distances and, correspondingly, almost identical O-H bond lengths. The correlation between shorter hydrogen bonds (=more elongated O-H bonds) and a red-shift of the stretching frequency also holds for the other hydrogen atoms: H2 and H3 participate in hydrogen bonds with a length of roughly 1.8 Å, and they both contribute to bands between 3140 and 3190 cm
−1, with some modes having essentially equal contribution from both hydrogen atoms. Finally, the hydrogen atom H4, which forms a very short hydrogen bond of ∼1.6 Å, gives rise to strongly red-shifted bands below 3000 cm
−1. In their experimental study, Knops-Gerrits et al. assigned the two rather diffuse bands at lower frequencies to Al-coordinated water molecules, and the sharper, intense bands at the highest frequencies to water molecules in the channels (
Figure 2 shows the experimental data) [
7]. Although this assignment is largely confirmed by the calculations, we have to note that the hydrogen atom H1, despite being part of an Al-coordinated water molecule, contributes to high-frequency bands because it participates in a relatively long hydrogen bond.
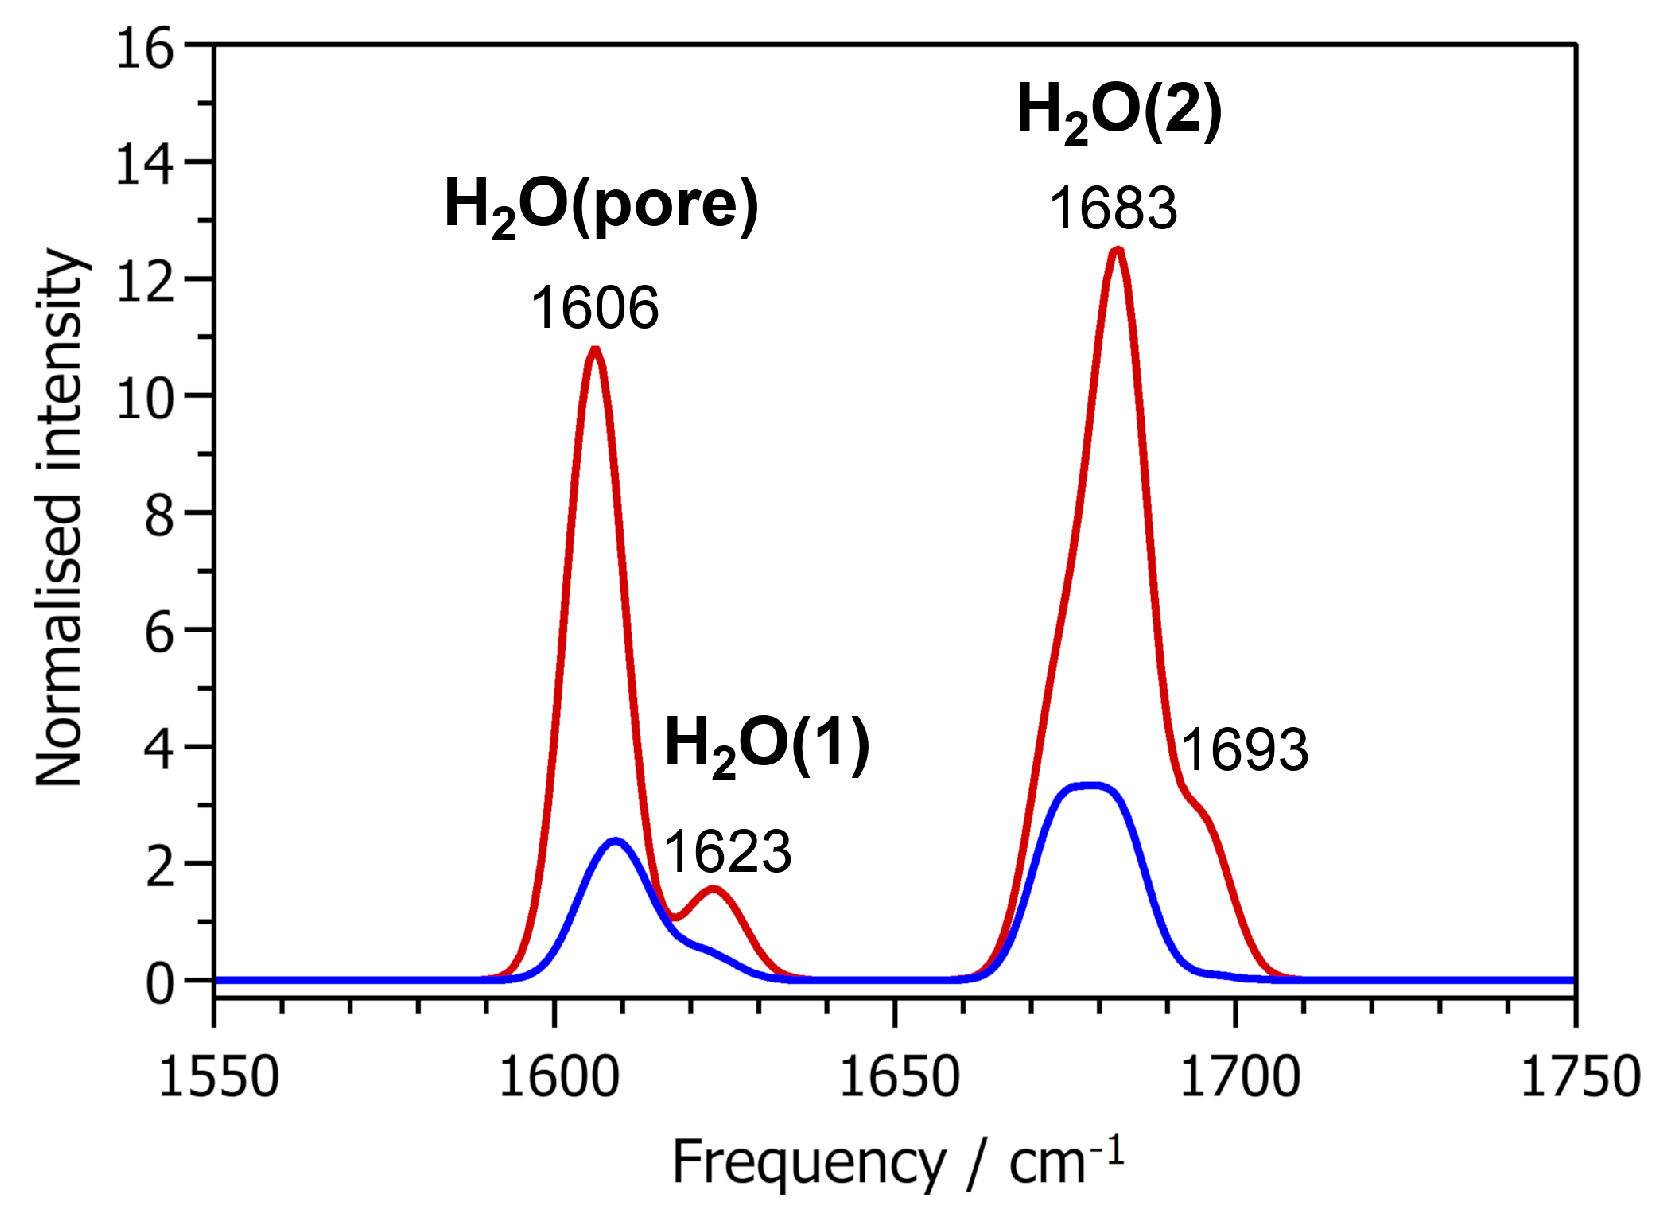
In the frequency range of H-O-H bending vibrations, two main bands are visible in the IR and Raman spectra, shown in
Figure 5. Both bands are comprised of contributions from several individual modes and are therefore relatively broad. The lower-frequency band extends from about 1600 to 1630 cm
−1, and is thus close to the frequency of the H-O-H bending mode in a free water molecule (1607 cm
−1 in PBE-TS calculations). The other band is blue-shifted with respect to free water, extending from about 1670 to 1700 cm
−1. An analysis of the atomic displacements shows that the lower-frequency band arises from both H
2O(pore) and H
2O(1): The hydrogen atoms H5 and H6 of the H
2O(pore) molecule contribute mainly to modes between 1606 and 1611 cm
−1, whereas H1 and H2 contribute to modes between 1619 and 1625 cm
−1. Consequently, the higher-frequency band is predominantly associated with displacements of the H3 and H4 atoms, which belong to the H
2O(2) molecule. As shown in
Table 5, there is no correlation between the frequency and the
(H-O-H) angle. The differences in the frequencies of the H-O-H bending modes are primarily related to the length (and thus, strength) of the hydrogen bonds in which the water molecules participate: The two strong hydrogen bonds of H
2O(2) lead to an increase in energy (and hence frequency) of the H-O-H bending deformation, whereas the longer, weaker hydrogen bonds in which H
2O(1) and H
2O(pore) participate have only a modest effect. Taking together the observations made for O-H stretching and H-O-H bending modes, we can conclude that their frequencies are determined by the hydrogen bonding environment of the water molecules. Because the hydrogen bonding patterns may be different for non-equivalent Al-coordinated water molecules (as is the case for H
2O(1) and H
2O(2)), or rather similar for Al-coordinated water molecules and molecules adsorbed in the pores, the modes in this frequency range are no reliable indicator to distinguish between water molecules in different environments.
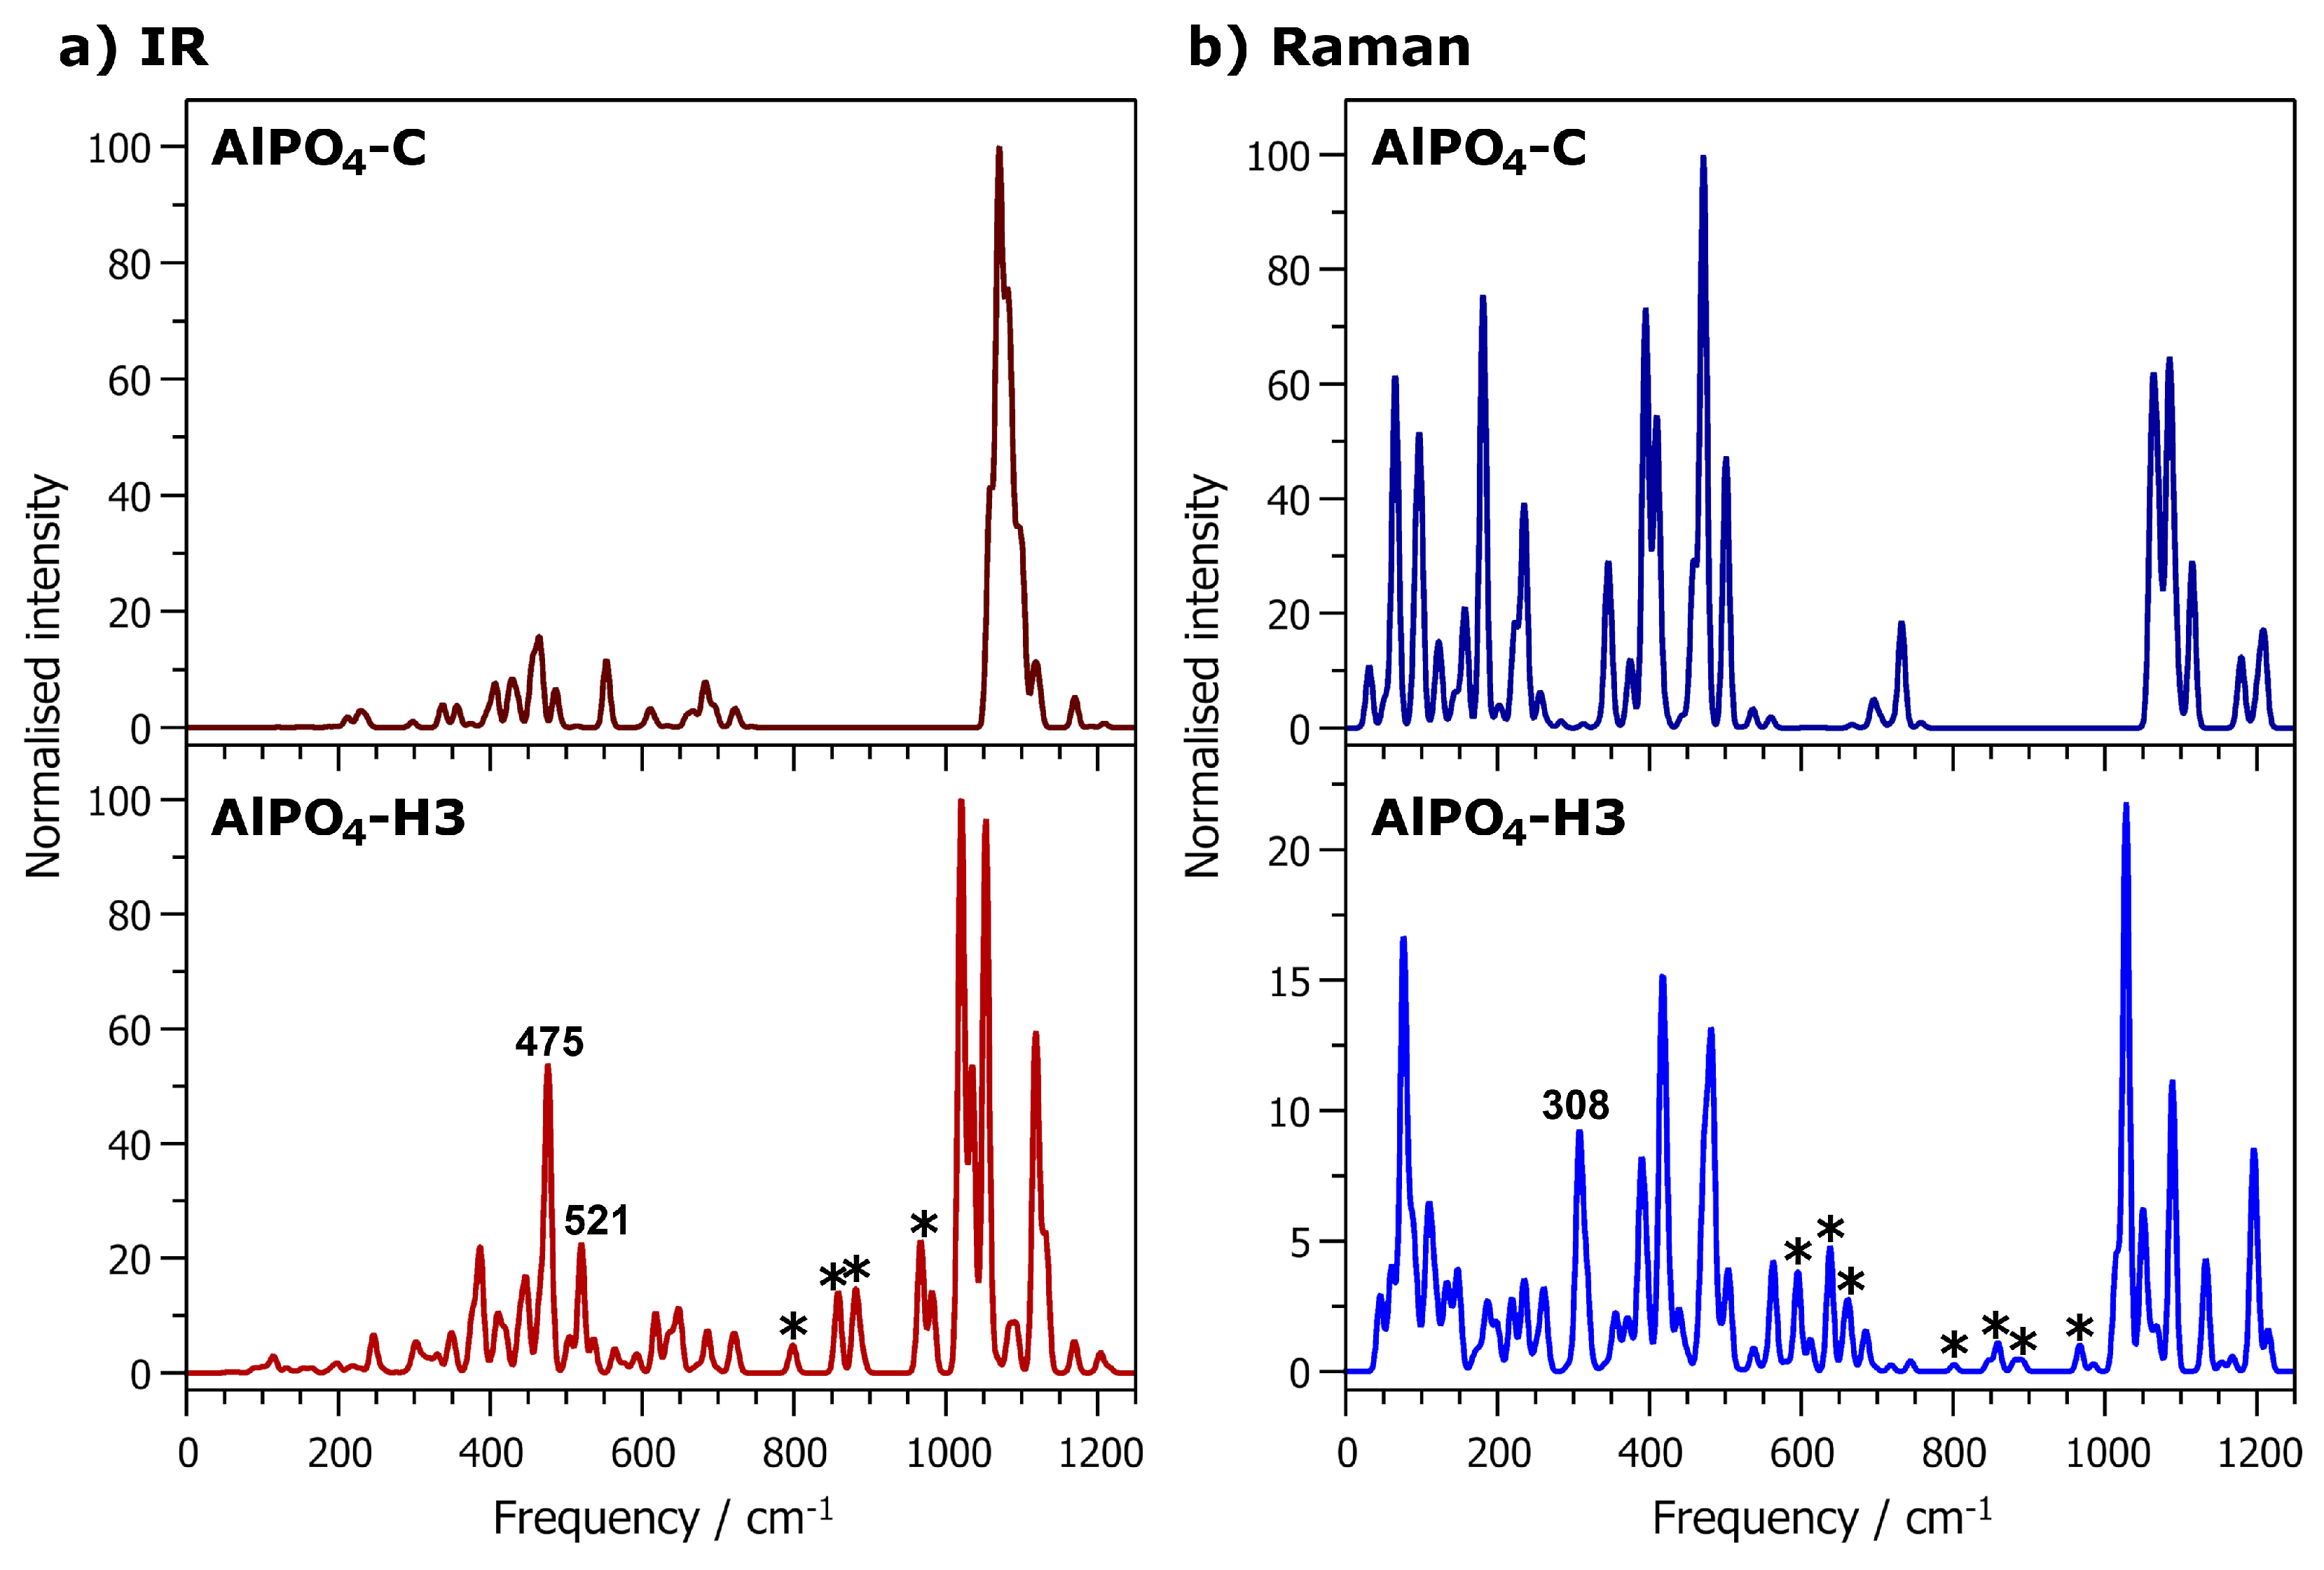
Finally, we turn our attention to the “framework modes”, i.e., all modes up to ∼1200 cm
−1. The IR and Raman spectra of fully hydrated AlPO
4-H3 and calcined AlPO
4-C are shown in
Figure 6. It is worth noting that the spectra display some common features, but also various differences, which are too numerous to discuss individually. Therefore, the present analysis focusses on a few selected bands that have significant intensity in the hydrated phase, but are absent or very weak in the calcined phase. One such band is found in the Raman spectrum at a frequency of 308 cm
−1. It is associated primarily with displacements of the octahedrally coordinated Al2 atom and the attached oxygen atoms, i.e., deformations of the AlO
6 octahedra. It is worth noting that an intense band at 326 cm
−1 in the Raman spectrum of variscite was attributed to Al-O stretching vibrations [
38]. Variscite is a hydrated aluminophosphate with composition AlPO
4·2H
2O that contains only octahedrally coordinated aluminium atoms. At frequencies around 475 cm
−1, there are a few modes that give rise to a prominent band in the IR spectrum of AlPO
4-H3 that has no direct equivalent in AlPO
4-C. These modes are associated with a displacement of Al2 from the centre of the AlO
6 octahedron, corresponding to a combination of Al-O bond stretching and O-Al-O angle bending. Another IR-active mode at 521 cm
−1 is related to an off-centre displacement of the Al2 atom within the octahedron, but also has a strong contribution from the H
2O(1) molecule.
Moving towards higher frequencies, there are several other bands in the IR and Raman spectra of AlPO
4-H3 that have no counterpart in the spectra of AlPO
4-C, e.g., Raman-active modes at 597 cm
−1, 639 cm
−1, 663 cm
−1, as well as several IR- or (weakly) Raman-active modes between 800 and 1000 cm
−1 (indicated by asterisks in
Figure 6). An analysis of the displacement patterns shows that these modes are primarily associated with librations of the H
2O molecules, sometimes coupled to internal deformations of the PO
4 tetrahedra. This is in accordance with a previous IR and Raman spectroscopic analysis of variscite and metavariscite, where modes between ∼600 and 870 cm
−1 were assigned to H
2O librations [
38]. Finally, although there are significant differences in the spectra above 1000 cm
−1, all modes in this frequency range are due to P-O bond stretching vibrations, and therefore not directly related to the presence of AlO
6 octahedra.
2.5. Displacement Parameters and Dynamic Behaviour
The root mean square displacements (RMSDs) obtained from the AIMD simulations are shown in
Table 6. For the framework atoms, we find RMSDs in the range of 0.14 Å for aluminium and phosphorus atoms, and RMSDs of 0.18 to 0.23 Å for the bridging oxygen atoms. Unsurprisingly, the variations among the non-equivalent atoms of each group are not significantly larger than the typical standard deviations, in line with the expected rigidity of the framework. When looking at the three different water molecules, a much larger variation of the RMSDs is found: For the H
2O(2) molecule, the RMSD of the O10 oxygen atom of 0.19 Å is similar to those of framework O atoms, indicating that this strongly bonded water molecule exhibits no significant mobility. The RMSDs of the two attached hydrogen atoms, H3 and H4, are only slightly larger, because the participation in strong and short hydrogen bonds limits the extent of displacements from their equilibrium positions. For the H
2O(1) molecule, the RMSD of the O9 oxygen atom is only slightly larger than that of the O10 atom and of the framework oxygens. On the other hand, the RMSDs of the H1 and H2 atoms are much larger, amounting to 0.36 and 0.51 Å, respectively. While it seems plausible that these hydrogen atoms, which participate in longer hydrogen bonds than those of the H
2O(2) molecule, undergo more pronounced oscillations, it has to be noted that the H2
O11 hydrogen bond in the PBE-TS equilibrium structure is much shorter than the H1
O11 bond. Therefore, one should expect a smaller RMSD for H2 compared to H1, contrary to the results of the AIMD calculations. We will revisit this point below, when discussing the radial distribution functions. Finally, the RMSDs for all three constituent atoms of the H
2O(pore) molecule are in the range of ∼0.55 Å, much larger than for all other atoms except H2. Apparently, this water molecule is subject to pronounced oscillations, which is straightforwardly explained with the absence of an Al-O
water bond, leading to a significant freedom of movement along the channel. A visualisation of the positions visited by a single O11 atom over the course of the whole AIMD trajectory shows the large displacement of the H
2O(pore) molecule (
Figure 7a). The individual
x,
y, and
z coordinates over the trajectory vary by 0.8/1.0/1.2 Å, corroborating that the most pronounced displacement occurs along the channel axis (
c-axis). Given the large mobility of the H
2O(pore) molecule found in the AIMD simulations, it is not surprising that the static equilibrium position of O11 obtained from the PBE-TS optimisations deviates from the experimentally observed position, which corresponds to the time-averaged position at room temperature.
Isostropic displacement parameters
can be obtained from electronic structure calculations via two different routes: On the one hand, they can be calculated from an AIMD trajectory, where they are directly related to the RMSDs. On the other hand, anisotropic displacement parameters can be routinely computed in the context of a lattice dynamical calculation, and the conversion into an equivalent isostropic value is straightforward.
Table 6 lists both types of DFT-derived
values, dubbed as
(AIMD) and
(phonon), respectively, as well as experimental values [
10]. If we compare the displacement parameters for all atoms except those belonging to the water molecules (i.e., including Al, P, and O1 to O8 atoms), a purely qualitative analysis indicates reasonably good agreement with experiment for both types of computed
values. A more quantitative assessment can be made by plotting the DFT-derived values as a function of their experimental counterparts. These two plots are shown in the
Supporting Information (Figures S2 and S3). Here, we find excellent agreement between the
(AIMD) values and experiment, with a correlation coefficient
= 0.93 and a slope of the trendline of 0.98 (perfect agreement would result in a slope of 1). The predicted values obtained from the phonon calculation are in somewhat less good agreement, with a correlation coefficient of
= 0.82 and a slope of 1.13, i.e., the calculations tend to overestimate
. However, given the likely uncertainties of both experimental and calculated values, this agreement can still be considered satisfactory.
With regard to the water molecules, we observe a rather good agreement between both kinds of calculated values and experiment for the oxygen atoms O9 and O10, which belong to the Al-coordinated water molecules. In contrast, the DFT-derived values for the hydrogen atoms are always much smaller than experimental values, which reach up to 0.20 Å. However, we have to note that the experimental values are likely to be inaccurate due to the difficulties in determining the hydrogen positions accurately (note especially that the O-H distances and H-O-H angles were fixed in the structure refinement, and that deviations in the real structure from these ideal values would translate into an increase of the displacement parameters). As such, we consider the experimental displacement parameters unreliable, and focus on a comparison of the different DFT-derived values. The values obtained for the hydrogen atoms of the H2O(2) molecule differ appreciably among the two methods, but both methods agree on their relatively modest magnitude ( < 0.03 Å). For the H2O(1) molecule, the phonon calculation delivers increased values, which are similar for both hydrogen atoms. As discussed above, a different picture arises when looking at the AIMD results, where the displacement parameter of the H2 atom is more than twice as large than that of H1. For the H2O(pore) molecule, the two computational methods give very different displacement parameters for all three atoms, with the (AIMD) values being a factor of 2 to 3 larger than those from the phonon calculations. The phonon calculations only consider harmonic oscillations around the equilibrium position, however, the significant displacements of the H2O(pore) molecule predicted by the AIMD calculations indicate that the harmonic approximation is no longer valid. As these effects are captured only by the molecular dynamics approach, we may consider the displacement parameters obtained with this method to be more reliable. Interestingly, the experimental value of the O11 atom falls between the two computed values. However, the fact that the hydrogen positions of the H2O(pore) molecule could not be determined is likely to cause a rather large inaccuracy of this displacement parameter.
The radial distribution functions (RDFs) of the H
O hydrogen bonds obtained from the AIMD calculations are visualised in
Figures S5–S7 of the Supporting Information. For the H
2O(2) molecule, both the H3
O5 and the H4
O7 RDF exhibit one sharp first maximum centered at about 1.73 Å and 1.60 Å, respectively, in excellent agreement with the equilibrium H
O distances obtained in the PBE-TS structure optimisation (
Table 2). Looking at the H
2O(1) molecule, the H1
O11 RDF has a somewhat broader maximum at a distance of ∼1.73 Å. This is significantly shorter than the PBE-TS equilibrium distance of 2.06 Å, a difference that can be attributed to the mobility of the H
2O(pore) molecule, which is not accounted for in the static calculation. For the H2 atom, there is one maximum in the H2
O11 centered at ∼1.84 Å, which agrees well with the PBE-TS distance. Additionally, a pronounced tail is observed towards longer distances, and a calculation of the RDF between H2 and different framework oxygen atoms reveals that there are also short contacts to the framework oxygen atom O6 occurring over the course of the AIMD simulation. The first maximum in the H2
O6 RDF is close to ∼2 Å, well below the PBE-TS equilibrium distance of 2.88 Å. This indicates that the hydrogen bonding situation of the H2 atom is dynamic, rather than static, with H2
O11 and H2
O6 hydrogen bonds forming and breaking over time (the environment of the H2 atom including both O11 and O6 is shown in
Figure 7b). The dynamic H-bonding of H2 also explains why its
(AIMD) value is so much larger than
(phonon). For the H
2O(pore) molecule, the RDFs for the H6
O4 hydrogen bond and the bifurcated hydrogen bond (H5
O1, H5
O8) all exhibit a single maximum centered at the respective equilibrium distances. These maxima are relatively broad due to the high mobility of the H
2O(pore) molecule.The RDFs of intramolecular O-H bonds and of Al-O bonds are also included in the
Supporting Information (Figures S4 and S8). In all cases, the position of the first maximum in the RDF hardly deviates from the equilibrium distance in the PBE-TS optimised structure. For both groups of bonds, the maxima become broader with increasing equilibrium bond length. This effect is particularly pronounced for the Al-O bonds, where bonds to water molecules are somewhat more flexible than bonds to framework oxygen atoms.


