1. Introduction
The severe habitat degradation and mass species extinctions are the most obvious evidence of the global biodiversity crisis [
1,
2]. At the same time, there are several less spectacular, but just as important signs of degradation, which are much more difficult to quantify. Among others, the decline of the intraspecific variability of a certain species has a specific negative effect on its long term survival. Therefore, this information is essential in conservation planning and in preserving the natural community structure [
3].
It has long been suspected that many species, notably those spread over a wide geographic range, can be divided into numerous more or less discrete, but phenotypically/morphologically very similar entities, the so-called cryptic or sibling species [
4]. The widespread application of molecular techniques has proven that these entities can be found in many animal groups [
5]. The importance of these cryptic entities is still insufficiently considered, despite the fact that they are required for wildlife and biodiversity conservation, as well as natural resource protection [
6,
7]. Therefore, their identification and description are critically important. Moreover, these reproductively more or less isolated groups are the basic units of evolutionary development [
8].
As the considerable proportion of intraspecific diversity of freshwater fish species is manifested rather in among groups, than in within groups differences/variability [
9], the preservation of local forms, subspecies, geographically isolated assemblages have particular importance in this species group.
In the last decades, molecular and genetic methods have become the fundamental tools of phylogenetics and taxonomy. These methods are widely used for species identification and intraspecific studies (e.g., population genetics) [
10,
11,
12,
13]. At the same time, these molecular methods are costly and time consuming, and still have substantial consumable requirements [
14,
15,
16]. Moreover, these methods also require highly skilled laboratory staff. For these reasons, it is worthwhile to examine the applicability of newly developed methods for the detection of intraspecific variability. For example Matrix Assisted Laser Desorption Ionization-Time of Flight Mass Spectrometry (MALDI-TOF MS) is an equally reproducible, accurate, fast, and affordable candidate to investigate this feature [
17,
18,
19].
Mass spectrometry based phyloproteomics (MSPP) has also been considered as an appropriate, user-friendly species identification tool for the interpretation of information encoded in genomes, complementing DNA-based approaches [
20]. Among these proteomic tools, the MALDI-TOF MS is a well-established technique for the identification of specific marker compounds and proteomic phenotyping, due to its high sensitivity, high throughput and relatively low additional cost [
21]. The first widely used application of this method was the bacterial identification for clinical microbiology [
22,
23,
24,
25,
26,
27,
28,
29], and has been recently adapted to food analysis and authentication [
30,
31,
32]. Many examples show that this method can be used, not only in clinical trials, but in conservation biology research. Occasionally, it has been used to identify microalgae [
19,
33] and even higher eukaryotes, including nematodes [
34], insects [
35,
36,
37], molluscs [
18,
38], and fish [
39,
40]. Moreover, the results of specific studies show that it can also be used for differentiating closely related, morphologically very similar species [
16,
41], and for the identification of proteomic sex markers in fishes and in arthropods [
15,
42].
Although, this method has rarely been previously tested at intraspecific levels (e.g., for population detachments) [
43,
44], the results of these studies show that its sensitivity may make it suitable for stock identification as well.
There are also many uncertainties and elusive details in the sampling methodology (field sampling, sample preparation and processing, etc.) for MALDI-TOF MS purposes. However, these features may also fundamentally affect the results of these kind of studies [
45,
46].
Therefore, our aims were to elucidate the applicability and sensitivity of an alternative (rapid MSPP) method for the determination of intraspecific diversity, in order to differentiate cryptic species and populations - in a freshwater Cyprinid superspecies complex. Parallel genetic and MALDI-TOF MS investigations were executed on the same stream-dwelling gudgeon (Gobio spp.) individuals collected from five distinct populations. We also wanted to clarify certain methodological issues of the MALDI-TOF MS investigations by conducting these investigations in parallel. Therefore, two different tissue types (brain and muscle) were analyzed to test their suitability for this purpose. Moreover, three types of field sample processing protocols were compared to reveal the effects of anaesthesia and middle term storage on the results of mass spectral analysis.
3. Discussion
In the present work, the sensitivity of mass spectrometry for separating a cryptic freshwater fish complex was tested. Moreover, some additional analyses were made to clarify certain methodological issues, which can help improve the application of MALDI-TOF MS method in fish biology.
3.1. Effect of Sample Processing on the Result of MS Analyses
Although Nebbak and coworkers [
46] stated that of the sample preservation methods, freezing has the least effect on MALDI-TOF MS results, our results suggest that the middle term sample storage, or the delayed sample preparation, fundamentally changed the results of MS analyses. Therefore, efforts should be made to process samples as quickly as possible. Moreover, this feature must be taken into consideration when evaluating and interpreting the results. Notwithstanding this, the delayed sample preparation appears to fundamentally affect the results of MS analysis; we did not find a single peak in the spectra, which would be specific/unique to this group. At the same time, several peaks were more frequent in the samples prepared after the 30 day incubation (
Table S1). Using appropriate multivariate statistical methods, these frequent peaks are also appropriate to reliably separate these groups.
Our other methodologic question was to specify the possible effect of clove oil anesthesia on the results of MS analysis. This feature may have specific importance because clove oil is often used for anesthesia in fish biology [
48,
49,
50]. The clove oil is used with preference because its active agent is eugenol (4-allyl-2-ethoxyphenol), which is a non-carcinogenic, non-mutagenic, and an “eco-friendly” substance [
51,
52]. It is also a safe material for the researcher, while having reduced negative physiological effects on fish compared with other narcotic agents [
53]. Since no considerable effect was detected on the results of MS investigations, it seems that clove oil is a reliable anaesthetic for sample collection for mass spectrometry measurements.
3.2. MALDI-TOF MS Usability of Cryptic Species and Population Differentiation
The results of the PCA analysis, performed on MALDI-TOF MS data, correspond only partially with the results of the genetic study, but the results of the classification correspond well. Therefore, the MALDI-TOF MS can be used to reveal cryptic entities and populations as well (
Figure 3). The relatively lower number of correctly classified cryptic species cases using brain samples is due to the fact that many individuals were exchanged between the Southern haplogroup and
G. obtusirostris.
The results of the MS analysis of muscle and brain samples show highly similar results at the cryptic species level, but there are many differences in the results of analyses conducted on the population level. Moreover, the many misclassified cases suggest that the applicability limit of this method is being approached here.
In this work, no single unique peak was found to be characteristic for each population. Similarly to the results of methodologic surveys, only the differential distribution of peaks intensities can help to separate the individual populations in conjunction with multivariate statistical analysis. This is not altogether surprising due to the relatively few genetic differences, and the relatively low number of investigated samples per site (11–12 individuals per population). Additionally, the uneven distribution of sexes in each population may also have had a significant effect on the results. However, evaluating the effect of sexes on the results of rapid MSPP is beyond the scope of this work.
Our findings partly contradict the results of other researchers who have successfully used the MALDI-TOF MS to isolate molluscs and insect stocks [
15,
43]. In these cases, the method was used to separate two populations only. Whereas in our case, the MSPP was employed to classify the individuals into the five populations. Moreover, their investigations covered greater spatial scale and/or presumably larger genetic differences facilitating the separability of their samples. Additionally, in our case the studied species complex showed much more difficult phylogenetic features.
Vega Rúa and coworkers [
16] stated that different body parts of arthropods may equally be used for the MALDI-TOF MS analysis. Similarly, our investigations showed both the muscle and brain samples produced usable MS profiles. The proportion of correctly classified cases was equal, or even higher among the muscle than in the brain tissue type (
Table 3;
Table 4). Therefore, it seems that muscle tissue is somewhat more appropriate for determining the intraspecific variability than brain samples. Additionally, this tissue type is much easier to be sampled by a biopsy in a living animal, therefore the tested individuals do not have to be terminated.
Due to our results, the application of MALDI-TOF MS technique could enter the service of phylogenetic and taxonomic research as a fast and cheap alternative of genetic studies to check the origin of stocked, economically important fish species. Additionally, this relatively fast and easily executable method is also be potentially usable for selecting breeding lineages in aquaculture projects. At the same time, the method limitations will need be taken into account in the cases where low number of individuals, or closely related stocks (populations) are compared.
4. Materials and Methods
4.1. Taxonomic Features of the Hungarian Stream Dwelling Gudgeons
Until the end of the 20th century, European gudgeon [
Gobio gobio (Linnaeus, 1758)], a small-bodied cyprinid fish, was known as the only stream dwelling gudgeon species in Europe [
54]. It was regarded as a wide-ranged super-species in western Eurasia, with many lotic, lentic, and intermediate forms. The European gudgeon was considered a common species in the Carpathian Basin as well, where it was noted as an indicator fish species of hilly streams [
55]. The results of novel investigations [
56,
57] altered the taxonomy of this group. From the Carpathian basin, five genetically distinct groups were discovered [
47,
57,
58]. From the valid species the
Gobio carpathicus Vladykov, 1925,
G. gobio are sporadic in Hungarian streams, the
Gobio obtusirostris Cuvier and Valenciennes, 1842 is the dominant gudgeon species in the NW region of the Carpathian basin. In the SW area of the basin, and in the drainage system of Tisza River (eastern part of the basin) two, allopatric “cryptic” entities) are the dominant
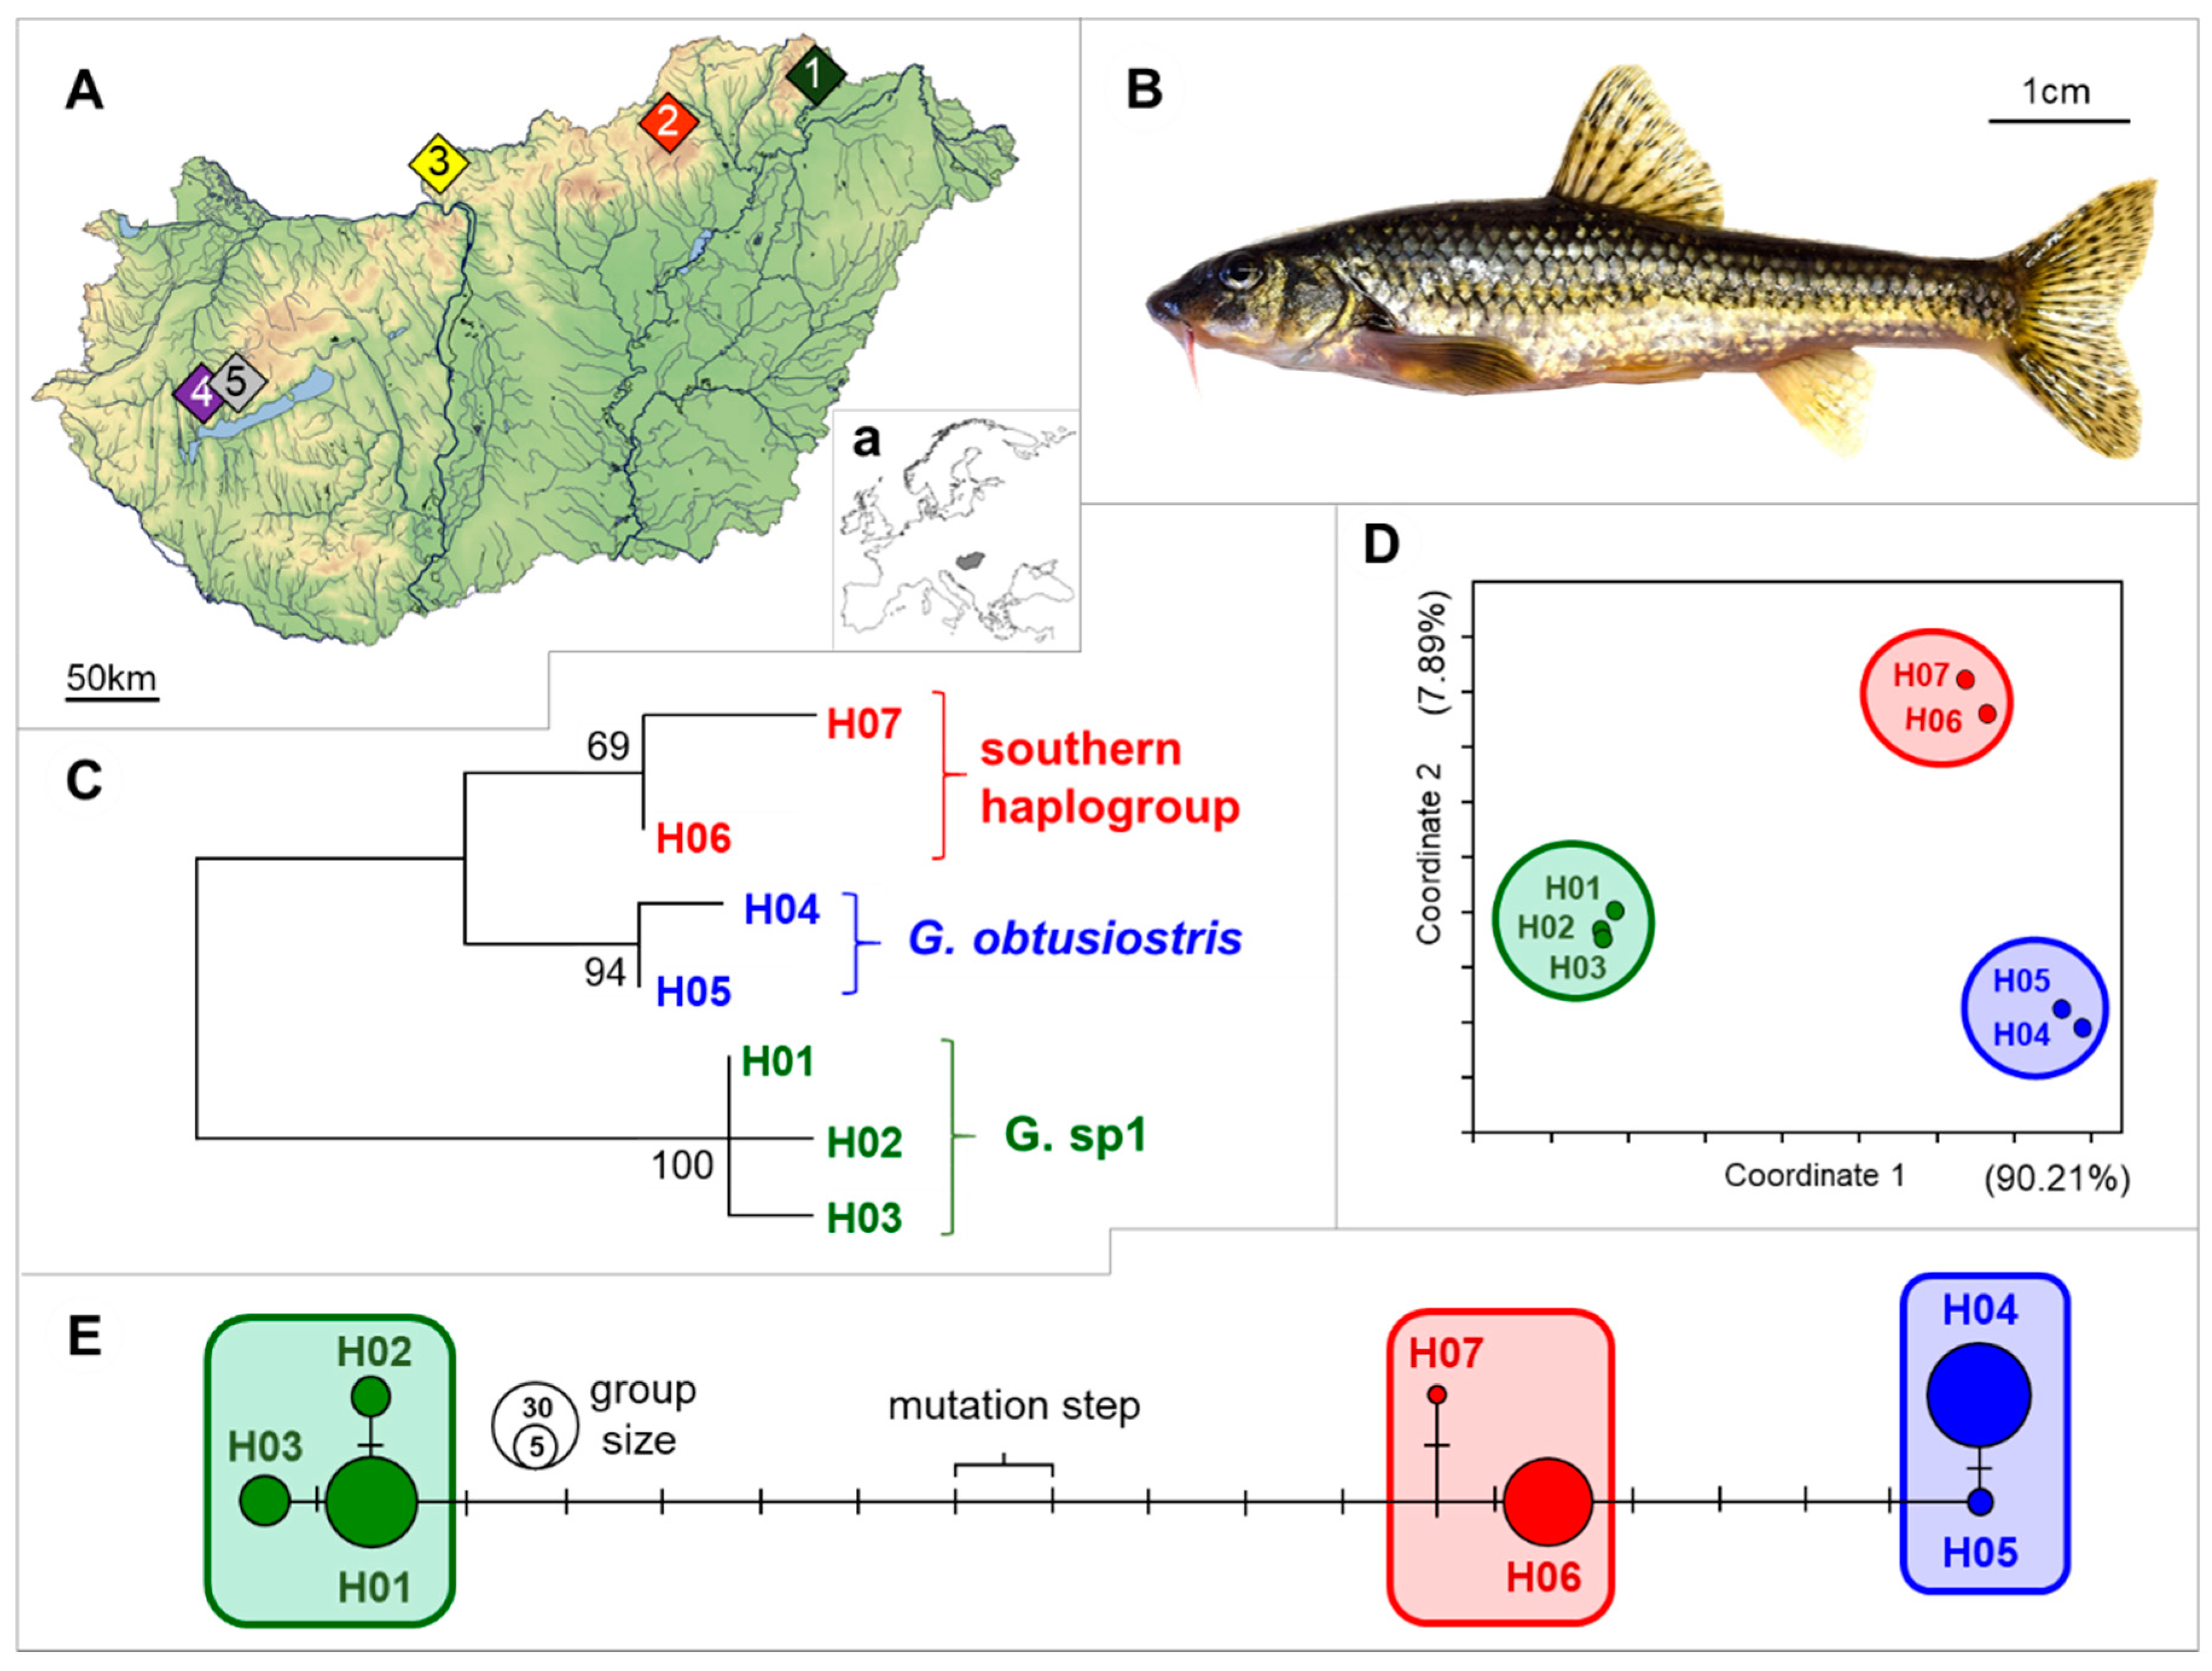
Gobio taxa. The taxonomic position of these two later mentioned haplogroups—the Southern and G. sp1—is still not clear. The above-mentioned features made this species complex suitable to be the target of our study. For more details see: Takács et al. 2014 [
47].
4.2. Field, Sampling, and Preparation
Carpathian stream dwelling gudgeons (
Gobio sp.
n = 90) were used to the study. 18 individuals were collected (collection permits: PE-KTF/659-15/2017) from each of the five streams located to different areas of Hungary by electrofishing in the spring of 2017 (
Figure 1A, and
Table 1). Then fin clips were sampled for genetic investigations and stored in 96% ethanol at −20 °C until DNA extraction. To test the effect of sample procession methods on the result of MALDI-TOF MS analyses, three different sample preparation protocols were applied; (1) six from the collected 18 individuals per site were terminated by decapitation; (2) six additional individuals per site were euthanized by a lethal dose of clove oil and then decapitated. In the first two cases, after termination the whole brains and ~1 g skeletal muscles were dissected and kept at −80 °C until sample preparation. (3) The final six individuals were terminated by freezing whole animals. And in this case the sample preparation (whole brains and ~1 g skeletal muscles were dissected and kept at −80 °C) was made after 30 days of incubation at −30 °C.
4.3. Genetic Methods
Fin clips of the collected gudgeon specimens were sampled and stored in 96% ethanol at −20 °C until DNA sample collection. DNA was isolated with a DNeasy Blood and Tissue kit (Qiagen, Hilden, Germany), using 10–20 mg of fin tissue per the manufacturer’s instructions. Quality and quantity of the extracted DNA were checked using a NanoDrop 2000 c Spectrophotometer (Thermo Scientific, Waltham, MA, USA).
DNA of the 90 individuals was used for the amplification of the mitochondrial control region (mtCR). The sequences of mtCR were amplified by polymerase chain reaction (PCR) using the primers CR159 (CCCAAAGCAAGTACTAACGTC) and CR851 (TGCGATGGCTAACTCATAC) [
57]. PCR was carried out using 0.2 mL of 5 U/mL Taq DNA polymerase (Fermentas), 2.5 mL of 10× Taq buffer, 1.7 mL MgCl2 (25 mM), 0.2 mL dNTPs (10 mM), 0.3 mL of each primer (20 mM), 2.0 mL template DNA, and 17.8 mL purified and distilled water in a final volume of 25 mL. The reactions were performed in a MJ Research PTC-200 Peltier Thermal Cycler under the following conditions: 95 °C for 1 min, followed by 37 cycles of 94 °C for 45 s, annealing at 52 °C for 30 s, and an extension temperature of 72 °C for 45 s, followed by a final extension at 72 °C for 8 min. PCR products were purified using the NucleoSpin
® Gel (Düren, Germany) and PCR Clean-up (Macherey Nagel GmbH, Düren, Germany) extraction kit. The subsequent determination of the nucleotide sequence of the PCR amplicons were performed using nucleotide sequencing by capillary electrophoresis (ABI 3130 Genetic Analyzer Device, ABI, Crosswall, London). This method applied bidirectional sequencing with the BigDye Terminator v3.1 Cycle Sequencing Kit, Performance Optimal Polimer 7 (ABI, Crosswall, London) and 50 cm capillary array according the recommendation of the producer. Sequences were trimmed manually using FinchTV 1.4.0 (Geospiza Inc, Seattle, WA, USA) and aligned using the ClustalX 2.0.11 software (Conway Institute UCD, Dublin, Ireland) [
59]. Calculation of sequence polymorphism and haplotype detachment was performed using FaBox online software (Aarhus University, Aarhus, Denmark) [
60]. The obtained sequences were compared with the ones uploaded to the GenBank using Blast online software (U.S. National Library of Medicine, Bethesda, MD, USA) [
61]. Sequence divergence was calculated with net nucleotide substitution in MEGA5 [
62], and a tree was constructed with the Maximum likelihood method using 2000 as the bootstrap value. A network was constructed using the median-joining algorithm in Network v. 4.6. [
63] software (Fluxus Technology Ltd., Colchester, England). Similar haplotypes were classified arbitrarily into haplogroups (see ‘‘enframings’’ in
Figure 1C–E).
4.4. Sample Preparation, Proteomic Analysis and Data Processing for MALDI-TOF MS
Frozen fish tissues were homogenized using a TissueLyser LT (QIAGEN) after the addition of 300 µL/g extraction solution (50% acetonitrile and 2.5% aqueous trifluoro-acetic acid) and were prepared with a high-energy ultrasonicator UI250 V (Hielsher Ultrasound Technology, Teltow, Germany) for 6 × 10 s, applying ice-cooling between cycles. The homogenates were then vortexed and centrifuged (Heraeus Biofuge Pico, Thermo Fisher Scientific, Waltham, MA, USA) at 10,000 rpm for 5 min. The clear supernatant was moved into a new sample tube. One μL of each supernatant protein sample was deposited onto a 96-position MALDI-TOF target plate (Bruker Daltonics, Bremen, Germany) in three replicates, allowed to dry at room temperature, and overlaid with 1 μL of the matrix solution, containing saturated α-cyano-4-hydroxycin-namic acid (α-CHCA) (Sigma-Aldrich, St Louis, MO, USA) in 50% acetonitrile and 2.5% aqueous trifluoro-acetic acid (TFA). The matrix sample spots were crystallized by air drying. After drying, the plate was inserted into the instrument for MALDI-TOF MS analysis.
MALDI-TOF measurements were carried out using a MALDI Microflex LT (Bruker Daltonics, Bremen, Germany), equipped with a nitrogen laser (337 nm). Mass spectra were acquired using the Flex Control 3.0 software (Bruker Daltonics, Bremen, Germany) in automatic and linear mode within a mass range between 2 and 20 kDa. Each spectrum was collected in the positive ion mode after an average of 240 laser shots. Bacterial Test Standard (Bruker Daltonics, Bremen, Germany) was used for calibration of the instrument. One spectrum per sample (
n = 3 replicates) was obtained to assess the suitability of mass spectrometric approach for identification of cryptic species. Mass data files were then exported from the FlexAnalysis 3.0 software (Bruker Daltonics, Bremen, Germany) and transformed to mzXML-files (
m/
z-intensity lists). The mzXML files were then imported in the free statistical software Mass-Up (Mass-Up, Vigo, Spain), for management of MALDI-TOF mass spectra data [
64,
65]. This software allows the detection of potential biomarkers, enabling the construction of models for automatic classification based on differences in the mass spectra. Data processing and analyses were executed following the suggestions of Fernandez-Alvarez and coworkers, and Yolanda and coworkers [
65,
66]. Therefore, each spectrum was smoothed by the moving average method, baseline corrected by the top hat method, and peak detection was carried out using the MassSpecWavelet method with a signal-to-noise ratio 6. The spectra from fish belonging to different cryptic species were compared using the forward method to obtain inter-sample matching, requiring a peak match score of 300 ppm. Result reports, which characterize the accuracy of the classification procedure executed on a population, cryptic species and preparation type levels are available in
Table S2. Confusion matrices were computed using NaiveBayes model. Principal component analysis (PCA) was performed using intensity values of the detected peaks converted into binary file by Past 2.12 statistical software [
67]. For the clarity and visibility of our results only the group centroids and the standard deviations of the individual PC1 and PC2 coordinates were indicated. To characterise the group separations the PCA plot coordinates of the studied individuals were revealed using non-parametric pairwise Kruskal-Wallis (KW) tests in all cases.


 ,
, 


