
Vibrational Spectroscopy Saliva Profiling as Biometric Tool for Disease Diagnostics: A Systematic Literature Review

 ,
,  , ,
, ,  and
and
Abstract

1. Introduction
2. Results
2.1. Cancer
2.1.1. Oral Cancer
2.1.2. Nasopharyngeal Cancer
2.1.3. Lung Cancer
2.1.4. Esophageal Cancer
2.1.5. Gastric Cancer
2.1.6. Breast Cancer
2.2. Other Diseases
2.2.1. Periodontitis
2.2.2. Sjögren’s Syndrome
2.2.3. Diabetes
2.2.4. Acute Myocardial Infarction
3. Discussion
4. Material and Methods
4.1. Research Question/Focused Question
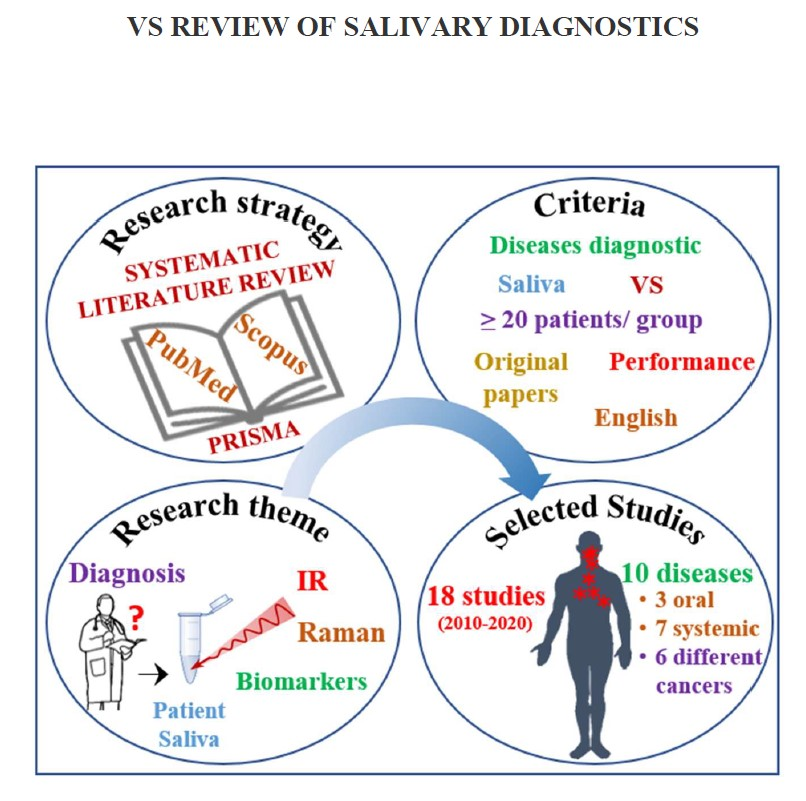
4.2. Search Strategy
4.3. Inclusion and Exclusion Criteria/Eligibility Criteria/Study Selection Criteria
4.4. Screening for Eligibility/Inclusion
4.5. Outcomes and Data Extraction
5. Conclusions
Author Contributions
Funding
Acknowledgments
Conflicts of Interest
References
- Hood, L.; Friend, S.H. Predictive, personalized, preventive, participatory (P4) cancer medicine. Nat. Rev. Clin. Oncol. 2011, 8, 184–187. [Google Scholar] [CrossRef]
- Delli, K.; Villa, A.; Farah, C.S.; Celentano, A.; Ojeda, D.; Peterson, D.E.; Jensen, S.B.; Glurich, I.; Vissink, A. World Workshop on Oral Medicine VII: Biomarkers predicting lymphoma in the salivary glands of patients with Sjögren’s syndrome—A systematic review. Oral Dis. 2019, 25, 49–63. [Google Scholar] [CrossRef]
- Hodson, R. Precision medicine. Nature 2016, 537, S49. [Google Scholar] [CrossRef]
- Baker, M.J.; Hussain, S.R.; Lovergne, L.; Untereiner, V.; Hughes, C.; Lukaszewski, R.A.; Thiéfin, G.; Sockalingum, G.D. Developing and understanding biofluid vibrational spectroscopy: A critical review. Chem. Soc. Rev. 2016, 45, 1803–1818. [Google Scholar] [CrossRef]
- Untereiner, V.; Dhruvananda Sockalingum, G.; Garnotel, R.; Gobinet, C.; Ramaholimihaso, F.; Ehrhard, F.; Diebold, M.-D.; Thiéfin, G. Bile analysis using high-throughput FTIR spectroscopy for the diagnosis of malignant biliary strictures: A pilot study in 57 patients: Spectral diagnosis of malignant biliary strictures. J. Biophotonics 2014, 7, 241–253. [Google Scholar] [CrossRef]
- Gaydou, V.; Polette, M.; Gobinet, C.; Kileztky, C.; Angiboust, J.-F.; Manfait, M.; Birembaut, P.; Piot, O. Vibrational Analysis of Lung Tumor Cell Lines: Implementation of an Invasiveness Scale Based on the Cell Infrared Signatures. Anal. Chem. 2016, 88, 8459–8467. [Google Scholar] [CrossRef]
- Nallala, J.; Piot, O.; Diebold, M.-D.; Gobinet, C.; Bouché, O.; Manfait, M.; Sockalingum, G.D. Infrared imaging as a cancer diagnostic tool: Introducing a new concept of spectral barcodes for identifying molecular changes in colon tumors. Cytometry A 2013, 83, 294–300. [Google Scholar] [CrossRef]
- Leal, L.B.; Nogueira, M.S.; Canevari, R.A.; Carvalho, L.F.C.S. Vibration spectroscopy and body biofluids: Literature review for clinical applications. Photodiagn. Photodyn. Ther. 2018, 24, 237–244. [Google Scholar] [CrossRef] [PubMed]
- Kaczor-Urbanowicz, K.E.; Martin Carreras-Presas, C.; Aro, K.; Tu, M.; Garcia-Godoy, F.; Wong, D.T. Saliva diagnostics – Current views and directions. Exp. Biol. Med. 2017, 242, 459–472. [Google Scholar] [CrossRef] [PubMed]
- Schafer, C.A.; Schafer, J.J.; Yakob, M.; Lima, P.; Camargo, P.; Wong, D.T.W. Saliva diagnostics: Utilizing oral fluids to determine health status. Monogr. Oral Sci. 2014, 24, 88–98. [Google Scholar] [PubMed]
- Derruau, S.; Gobinet, C.; Mateu, A.; Untereiner, V.; Lorimier, S.; Piot, O. Shedding light on confounding factors likely to affect salivary infrared biosignatures. Anal. Bioanal. Chem. 2019, 411, 2283–2290. [Google Scholar] [CrossRef] [PubMed]
- Streckfus, C.F. Advances in Salivary Diagnostics; Springer-Verlag: Berlin Heidelberg, 2015; pp. 1–204. [Google Scholar]
- Wang, A.; Wang, C.P.; Tu, M.; Wong, D.T.W. Oral Biofluid Biomarker Research: Current Status and Emerging Frontiers. Diagnostics 2016, 6, 45. [Google Scholar] [CrossRef] [PubMed]
- Jaychandran, S.; Meenapriya, P.; Ganesan, S. Raman Spectroscopic Analysis of Blood, Urine, Saliva and Tissue of Oral Potentially Malignant Disorders and Malignancy-A Diagnostic Study. Int. J. Oral Craniofac. Sci. 2016, 2, 011–014. [Google Scholar]
- Rekha, P.; Aruna, P.; Brindha, E.; Koteeswaran, D.; Baludavid, M.; Ganesan, S. Near-infrared Raman spectroscopic characterization of salivary metabolites in the discrimination of normal from oral premalignant and malignant conditions: Near-infrared Raman spectroscopic characterization of salivary metabolites. J. Raman Spectrosc. 2016, 47, 763–772. [Google Scholar] [CrossRef]
- Feng, S.; Lin, D.; Lin, J.; Huang, Z.; Chen, G.; Li, Y.; Huang, S.; Zhao, J.; Chen, R.; Zeng, H. Saliva analysis combining membrane protein purification with surface-enhanced Raman spectroscopy for nasopharyngeal cancer detection. Appl. Phys. Lett. 2014, 104, 073702. [Google Scholar] [CrossRef]
- Qiu, S.; Xu, Y.; Huang, L.; Zheng, W.; Huang, C.; Huang, S.; Lin, J.; Lin, D.; Feng, S.; Chen, R.; et al. Non-invasive detection of nasopharyngeal carcinoma using saliva surface-enhanced Raman spectroscopy. Oncol. Lett. 2016, 11, 884–890. [Google Scholar] [CrossRef]
- Lin, X.; Lin, D.; Ge, X.; Qiu, S.; Feng, S.; Chen, R. Noninvasive detection of nasopharyngeal carcinoma based on saliva proteins using surface-enhanced Raman spectroscopy. J. Biomed. Opt. 2017, 22, 1–6. [Google Scholar] [CrossRef]
- Li, X.; Yang, T.; Lin, J. Spectral analysis of human saliva for detection of lung cancer using surface-enhanced Raman spectroscopy. J. Biomed. Opt. 2012, 17, 037003. [Google Scholar] [CrossRef]
- Qian, K.; Wang, Y.; Hua, L.; Chen, A.; Zhang, Y. New method of lung cancer detection by saliva test using surface-enhanced Raman spectroscopy. Thorac. Cancer 2018, 9, 1556–1561. [Google Scholar] [CrossRef]
- Maitra, I.; Morais, C.L.M.; Lima, K.M.G.; Ashton, K.M.; Date, R.S.; Martin, F.L. Attenuated total reflection Fourier-transform infrared spectral discrimination in human bodily fluids of oesophageal transformation to adenocarcinoma. Analyst 2019, 144, 7447–7456. [Google Scholar] [CrossRef]
- Maitra, I.; Morais, C.L.M.; Lima, K.M.G.; Ashton, K.M.; Date, R.S.; Martin, F.L. Raman spectral discrimination in human liquid biopsies of oesophageal transformation to adenocarcinoma. J. Biophotonics 2020, 13, e201960132. [Google Scholar] [CrossRef] [PubMed]
- Chen, Y.; Cheng, S.; Zhang, A.; Song, J.; Chang, J.; Wang, K.; Gao, G.; Zhang, Y.; Li, S.; Liu, H.; et al. Salivary analysis based on surface enhanced Raman scattering sensors distinguishes early and advanced gastric cancer patients from healthy persons. J. Biomed. Opt. 2018, 14, 1773–1784. [Google Scholar] [CrossRef] [PubMed]
- Feng, S.; Huang, S.; Lin, D.; Chen, G.; Xu, Y.; Li, Y.; Huang, Z.; Pan, J.; Chen, R.; Zeng, H. Surface-enhanced Raman spectroscopy of saliva proteins for the noninvasive differentiation of benign and malignant breast tumors. Int. J. Nanomed. 2015, 10, 537–547. [Google Scholar] [CrossRef] [PubMed]
- Hernández-Arteaga, A.; de Jesús Zermeño Nava, J.; Kolosovas-Machuca, E.S.; Velázquez-Salazar, J.J.; Vinogradova, E.; José-Yacamán, M.; Navarro-Contreras, H.R. Diagnosis of breast cancer by analysis of sialic acid concentrations in human saliva by surface-enhanced Raman spectroscopy of silver nanoparticles. Nano Res. 2017, 10, 3662–3670. [Google Scholar] [CrossRef]
- Hernández-Arteaga, A.C.; de Jesús Zermeño-Nava, J.; Martínez-Martínez, M.U.; Hernández-Cedillo, A.; Ojeda-Galván, H.J.; José-Yacamán, M.; Navarro-Contreras, H.R. Determination of salivary sialic acid through nanotechnology: A useful biomarker for the screening of breast cancer. Arch. Med. Res. 2019, 50, 105–110. [Google Scholar] [CrossRef]
- Hernández-Cedillo, A.; García-Valdivieso, M.G.; Hernández-Arteaga, A.C.; Patiño-Marín, N.; Vértiz-Hernández, Á.A.; José-Yacamán, M.; Navarro-Contreras, H.R. Determination of sialic acid levels by using surface-enhanced Raman spectroscopy in periodontitis and gingivitis. Oral Dis. 2019, 25, 1627–1633. [Google Scholar] [CrossRef]
- Stefancu, A.; Badarinza, M.; Moisoiu, V.; Iancu, S.D.; Serban, O.; Leopold, N.; Fodor, D. SERS-based liquid biopsy of saliva and serum from patients with Sjögren’s syndrome. Anal. Bioanal. Chem. 2019, 411, 5877–5883. [Google Scholar] [CrossRef]
- Moisoiu, V.; Badarinza, M.; Stefancu, A.; Iancu, S.D.; Serban, O.; Leopold, N.; Fodor, D. Combining surface-enhanced Raman scattering (SERS) of saliva and two-dimensional shear wave elastography (2D-SWE) of the parotid glands in the diagnosis of Sjögren’s syndrome. Spectrochim. Acta A Mol. Biomol. Spectrosc. 2020, 235, 118267. [Google Scholar] [CrossRef]
- Scott, D.A.; Renaud, D.E.; Krishnasamy, S.; Meriç, P.; Buduneli, N.; Çetinkalp, Ş.; Liu, K.-Z. Diabetes-related molecular signatures in infrared spectra of human saliva. Diabetol. Metab. Syndr. 2010, 2, 48–57. [Google Scholar] [CrossRef]
- Cao, G.; Chen, M.; Chen, Y.; Huang, Z.; Lin, J.; Lin, J.; Xu, Z.; Wu, S.; Huang, W.; Weng, G.; et al. A potential method for non-invasive acute myocardial infarction detection based on saliva Raman spectroscopy and multivariate analysis. Laser Phys. Lett. 2015, 12, 125702. [Google Scholar] [CrossRef]
- Bray, F.; Ferlay, J.; Soerjomataram, I.; Siegel, R.L.; Torre, L.A.; Jemal, A. Global cancer statistics 2018: GLOBOCAN estimates of incidence and mortality worldwide for 36 cancers in 185 countries. CA Cancer J. Clin. 2018, 68, 394–424. [Google Scholar] [CrossRef] [PubMed]
- Chen, Y.; Zhang, J.; Guo, L.; Liu, L.; Wen, J.; Xu, L.; Yan, M.; Li, Z.; Zhang, X.; Nan, P.; et al. A characteristic biosignature for discrimination of gastric cancer from healthy population by high throughput GC-MS analysis. Oncotarget 2016, 7, 87496–87510. [Google Scholar] [CrossRef] [PubMed]
- Abate-Shen, C.; Shen, M.M. The prostate-cancer metabolome. Nature 2009, 457, 799–800. [Google Scholar] [CrossRef] [PubMed]
- Ozturk, L.K.; Emekli-Alturfan, E.; Kasikci, E.; Demir, G.; Yarat, A. Salivary Total Sialic Acid Levels Increase in Breast Cancer Patients: A Preliminary Study. Med. Chem. 2011, 7, 443–447. [Google Scholar] [CrossRef] [PubMed]
- Caton, J.G.; Armitage, G.; Berglundh, T.; Chapple, I.L.C.; Jepsen, S.; Kornman, K.S.; Mealey, B.L.; Papapanou, P.N.; Sanz, M.; Tonetti, M.S. A new classification scheme for periodontal and peri-implant diseases and conditions – Introduction and key changes from the 1999 classification. J. Clin. Periodontol. 2018, 45, S1–S8. [Google Scholar] [CrossRef]
- Xiang, X.; Duarte, P.M.; Lima, J.A.; Santos, V.R.; Gonçalves, T.D.; Miranda, T.S.; Liu, K.-Z. Diabetes-Associated Periodontitis Molecular Features in Infrared Spectra of Gingival Crevicular Fluid. J. Periodontol 2013, 84, 1792–1800. [Google Scholar] [CrossRef]
- Baeza, M.; Morales, A.; Cisterna, C.; Cavalla, F.; Jara, G.; Isamitt, Y.; Pino, P.; Gamonal, J. Effect of periodontal treatment in patients with periodontitis and diabetes: Systematic review and meta-analysis. J. Appl. Oral Sci. 2020, 28, e20190248. [Google Scholar] [CrossRef]
- Reed, G.W.; Rossi, J.E.; Cannon, C.P. Acute myocardial infarction. Lancet 2017, 389, 197–210. [Google Scholar] [CrossRef]
- Bell, M.L.; Whitehead, A.L.; Julious, S.A. Guidance for using pilot studies to inform the design of intervention trials with continuous outcomes. Clin. Epidemiol. 2018, 10, 153–157. [Google Scholar] [CrossRef]
- Rodrigues, L.M.; Magrini Alva, T.D.; da Silva Martinho, H.; Almeida, J.D. Analysis of saliva composition in patients with burning mouth syndrome (BMS) by FTIR spectroscopy. Vib. Spectrosc. 2019, 100, 195–201. [Google Scholar] [CrossRef]
- Zamora-Mendoza, B.N.; Espinosa-Tanguma, R.; Ramírez-Elías, M.G.; Cabrera-Alonso, R.; Montero-Moran, G.; Portales-Pérez, D.; Rosales-Romo, J.A.; Gonzalez, J.F.; Gonzalez, C. Surface-enhanced raman spectroscopy: A non invasive alternative procedure for early detection in childhood asthma biomarkers in saliva. Photodiagn. Photodyn. Ther. 2019, 27, 85–91. [Google Scholar] [CrossRef] [PubMed]
- Ralbovsky, N.M.; Halámková, L.; Wall, K.; Anderson-Hanley, C.; Lednev, I.K. Screening for Alzheimer’s Disease Using Saliva: A New Approach Based on Machine Learning and Raman Hyperspectroscopy. J. Alzheimers Dis. 2019, 71, 1351–1359. [Google Scholar] [CrossRef] [PubMed]
- Rodrigues, R.P.; Aguiar, E.M.; Cardoso-Sousa, L.; Caixeta, D.C.; Guedes, C.C.; Siqueira, W.L.; Maia, Y.C.P.; Cardoso, S.V.; Sabino-Silva, R. Differential Molecular Signature of Human Saliva Using ATR-FTIR Spectroscopy for Chronic Kidney Disease Diagnosis. Braz. Dent. J. 2019, 30, 437–445. [Google Scholar] [CrossRef] [PubMed]
- Zermeño-Nava, J.d.J.; Martínez-Martínez, M.U.; Rámirez-de-Ávila, A.L.; Hernández-Arteaga, A.C.; García-Valdivieso, M.G.; Hernández-Cedillo, A.; José-Yacamán, M.; Navarro-Contreras, H.R. Determination of sialic acid in saliva by means of surface-enhanced Raman spectroscopy as a marker in adnexal mass patients: Ovarian cancer vs. benign cases. J. Ovarian Res. 2018, 11, 61. [Google Scholar]
- Eom, G.; Hwang, A.; Kim, H.; Yang, S.; Lee, D.K.; Song, S.; Ha, K.; Jeong, J.; Jung, J.; Lim, E.-K.; et al. Diagnosis of Tamiflu-Resistant Influenza Virus in Human Nasal Fluid and Saliva Using Surface-Enhanced Raman Scattering. ACS Sens. 2019, 4, 2282–2287. [Google Scholar] [CrossRef] [PubMed]
- Žukovskaja, O.; Jahn, I.J.; Weber, K.; Cialla-May, D.; Popp, J. Detection of Pseudomonas aeruginosa metabolite pyocyanin in water and saliva by employing the SERS technique. Sensors 2017, 17, 1704. [Google Scholar] [CrossRef]
- Malkovskiy, A.V.; Yacob, A.A.; Dunn, C.E.; Zirbes, J.M.; Ryan, S.P.; Bollyky, P.L.; Rajadas, J.; Milla, C.E. Salivary Thiocyanate as a Biomarker of Cystic Fibrosis Transmembrane Regulator Function. Anal. Chem. 2019, 91, 7929–7934. [Google Scholar] [CrossRef]
- Lovergne, L.; Lovergne, J.; Bouzy, P.; Untereiner, V.; Offroy, M.; Garnotel, R.; Thiéfin, G.; Baker, M.J.; Sockalingum, G.D. Investigating pre-analytical requirements for serum and plasma based infrared spectro-diagnostic. J. Biophotonics 2019, 12, e201900177. [Google Scholar] [CrossRef]
- Calado, G.; Behl, I.; Daniel, A.; Byrne, H.J.; Lyng, F.M. Raman spectroscopic analysis of saliva for the diagnosis of oral cancer: A systematic review. Translational Biophotonics 2019, 1, e201900001. [Google Scholar] [CrossRef]
- Dorling, K.M.; Baker, M.J. Rapid FTIR chemical imaging: Highlighting FPA detectors. Trends Biotechnol. 2013, 31, 437–438. [Google Scholar] [CrossRef]
- Patel, I.I.; Trevisan, J.; Evans, G.; Llabjani, V.; Martin-Hirsch, P.L.; Stringfellow, H.F.; Martin, F.L. High contrast images of uterine tissue derived using Raman microspectroscopy with the empty modelling approach of multivariate curve resolution-alternating least squares. Analyst 2011, 136, 4950–4959. [Google Scholar] [CrossRef]
- Baker, M.J.; Byrne, H.J.; Chalmers, J.; Gardner, P.; Goodacre, R.; Henderson, A.; Kazarian, S.G.; Martin, F.L.; Moger, J.; Stone, N.; et al. Clinical applications of infrared and Raman spectroscopy: State of play and future challenges. Analyst 2018, 143, 1735–1757. [Google Scholar] [CrossRef]
- Filik, J.; Stone, N. Analysis of human tear fluid by Raman spectroscopy. Anal. Chim. Acta 2008, 616, 177–184. [Google Scholar] [CrossRef] [PubMed]
- Filik, J.; Stone, N. Drop coating deposition Raman spectroscopy of protein mixtures. Analyst 2007, 132, 544–550. [Google Scholar] [CrossRef] [PubMed]
- Caixeta, D.C.; Aguiar, E.M.G.; Cardoso-Sousa, L.; Coelho, L.M.D.; Oliveira, S.W.; Espindola, F.S.; Raniero, L.; Crosara, K.T.B.; Baker, M.J.; Siqueira, W.L.; et al. Salivary molecular spectroscopy: A sustainable, rapid and non-invasive monitoring tool for diabetes mellitus during insulin treatment. PLoS ONE 2020, 15, e0223461. [Google Scholar] [CrossRef] [PubMed]
- Parachalil, D.R.; Brankin, B.; McIntyre, J.; Byrne, H.J. Raman spectroscopic analysis of high molecular weight proteins in solution–considerations for sample analysis and data pre-processing. Analyst 2018, 143, 5987–5998. [Google Scholar] [CrossRef] [PubMed]
- Kong, K.; Kendall, C.; Stone, N.; Notingher, I. Raman spectroscopy for medical diagnostics—From in-vitro biofluid assays to in-vivo cancer detection. Adv. Drug Deliv. Rev. 2015, 89, 121–134. [Google Scholar] [CrossRef] [PubMed]
- Achalli, S.; Madi, M.; Babu, S.G.; Shetty, S.R.; Kumari, S.; Bhat, S. Sialic acid as a biomarker of oral potentially malignant disorders and oral cancer. Indian J. Dent. Res. 2017, 28, 395–399. [Google Scholar] [CrossRef]
- Stefenelli, N.; Klotz, H.; Engel, A.; Bauer, P. Serum sialic acid in malignant tumors, bacterial infections, and chronic liver diseases. J. Cancer Res. Clin. Oncol. 1985, 109, 55–59. [Google Scholar] [CrossRef]
- Reddy, I.; Sherlin, H.J.; Ramani, P.; Premkumar, P.; Natesan, A.; Chandrasekar, T. Amino acid profile of saliva from patients with oral squamous cell carcinoma using high performance liquid chromatography. J. Oral Sci 2012, 54, 279–283. [Google Scholar] [CrossRef]
- Sugimoto, M.; Wong, D.T.; Hirayama, A.; Soga, T.; Tomita, M. Capillary electrophoresis mass spectrometry-based saliva metabolomics identified oral, breast and pancreatic cancer-specific profiles. Metabolomics 2010, 6, 78–95. [Google Scholar] [CrossRef] [PubMed]
- Chen, S.; Forman, M.; Sadow, P.M.; August, M. The Diagnostic Accuracy of Incisional Biopsy in the Oral Cavity. J. Oral Maxillofac. Surg. 2016, 74, 959–964. [Google Scholar] [CrossRef] [PubMed]
- Pentenero, M.; Carrozzo, M.; Pagano, M.; Galliano, D.; Broccoletti, R.; Scully, C.; Gandolfo, S. Oral mucosal dysplastic lesions and early squamous cell carcinomas: Underdiagnosis from incisional biopsy. Oral Dis. 2003, 9, 68–72. [Google Scholar] [CrossRef] [PubMed]
- Giovelli, R.A.; Santos, M.C.S.; Serrano, É.V.; Valim, V. Clinical characteristics and biopsy accuracy in suspected cases of Sjögren’s syndrome referred to labial salivary gland biopsy. BMC Musculoskelet. Disord. 2015, 16, 30. [Google Scholar] [CrossRef] [PubMed]
- Unertl, K.M.; Fair, A.M.; Favours, J.S.; Dolor, R.J.; Smoot, D.; Wilkins, C.H. Clinicians’ perspectives on and interest in participating in a clinical data research network across the Southeastern United States. BMC Health Serv. Res. 2018, 18, 568. [Google Scholar] [CrossRef]
- Moher, D.; Liberati, A.; Tetzlaff, J.; Altman, D.G. PRISMA Group Preferred reporting items for systematic reviews and meta-analyses: The PRISMA statement. BMJ 2009, 339, b2535. [Google Scholar] [CrossRef]
- Hertzog, M.A. Considerations in determining sample size for pilot studies. Res. Nurs. Health 2008, 31, 180–191. [Google Scholar] [CrossRef]


| Diseases | VS Technique | Authors | Year | Number of Patients Included | Algorithm | Spectral Range (in cm−1) | Sensibility | Specificity | Accuracy |
|---|---|---|---|---|---|---|---|---|---|
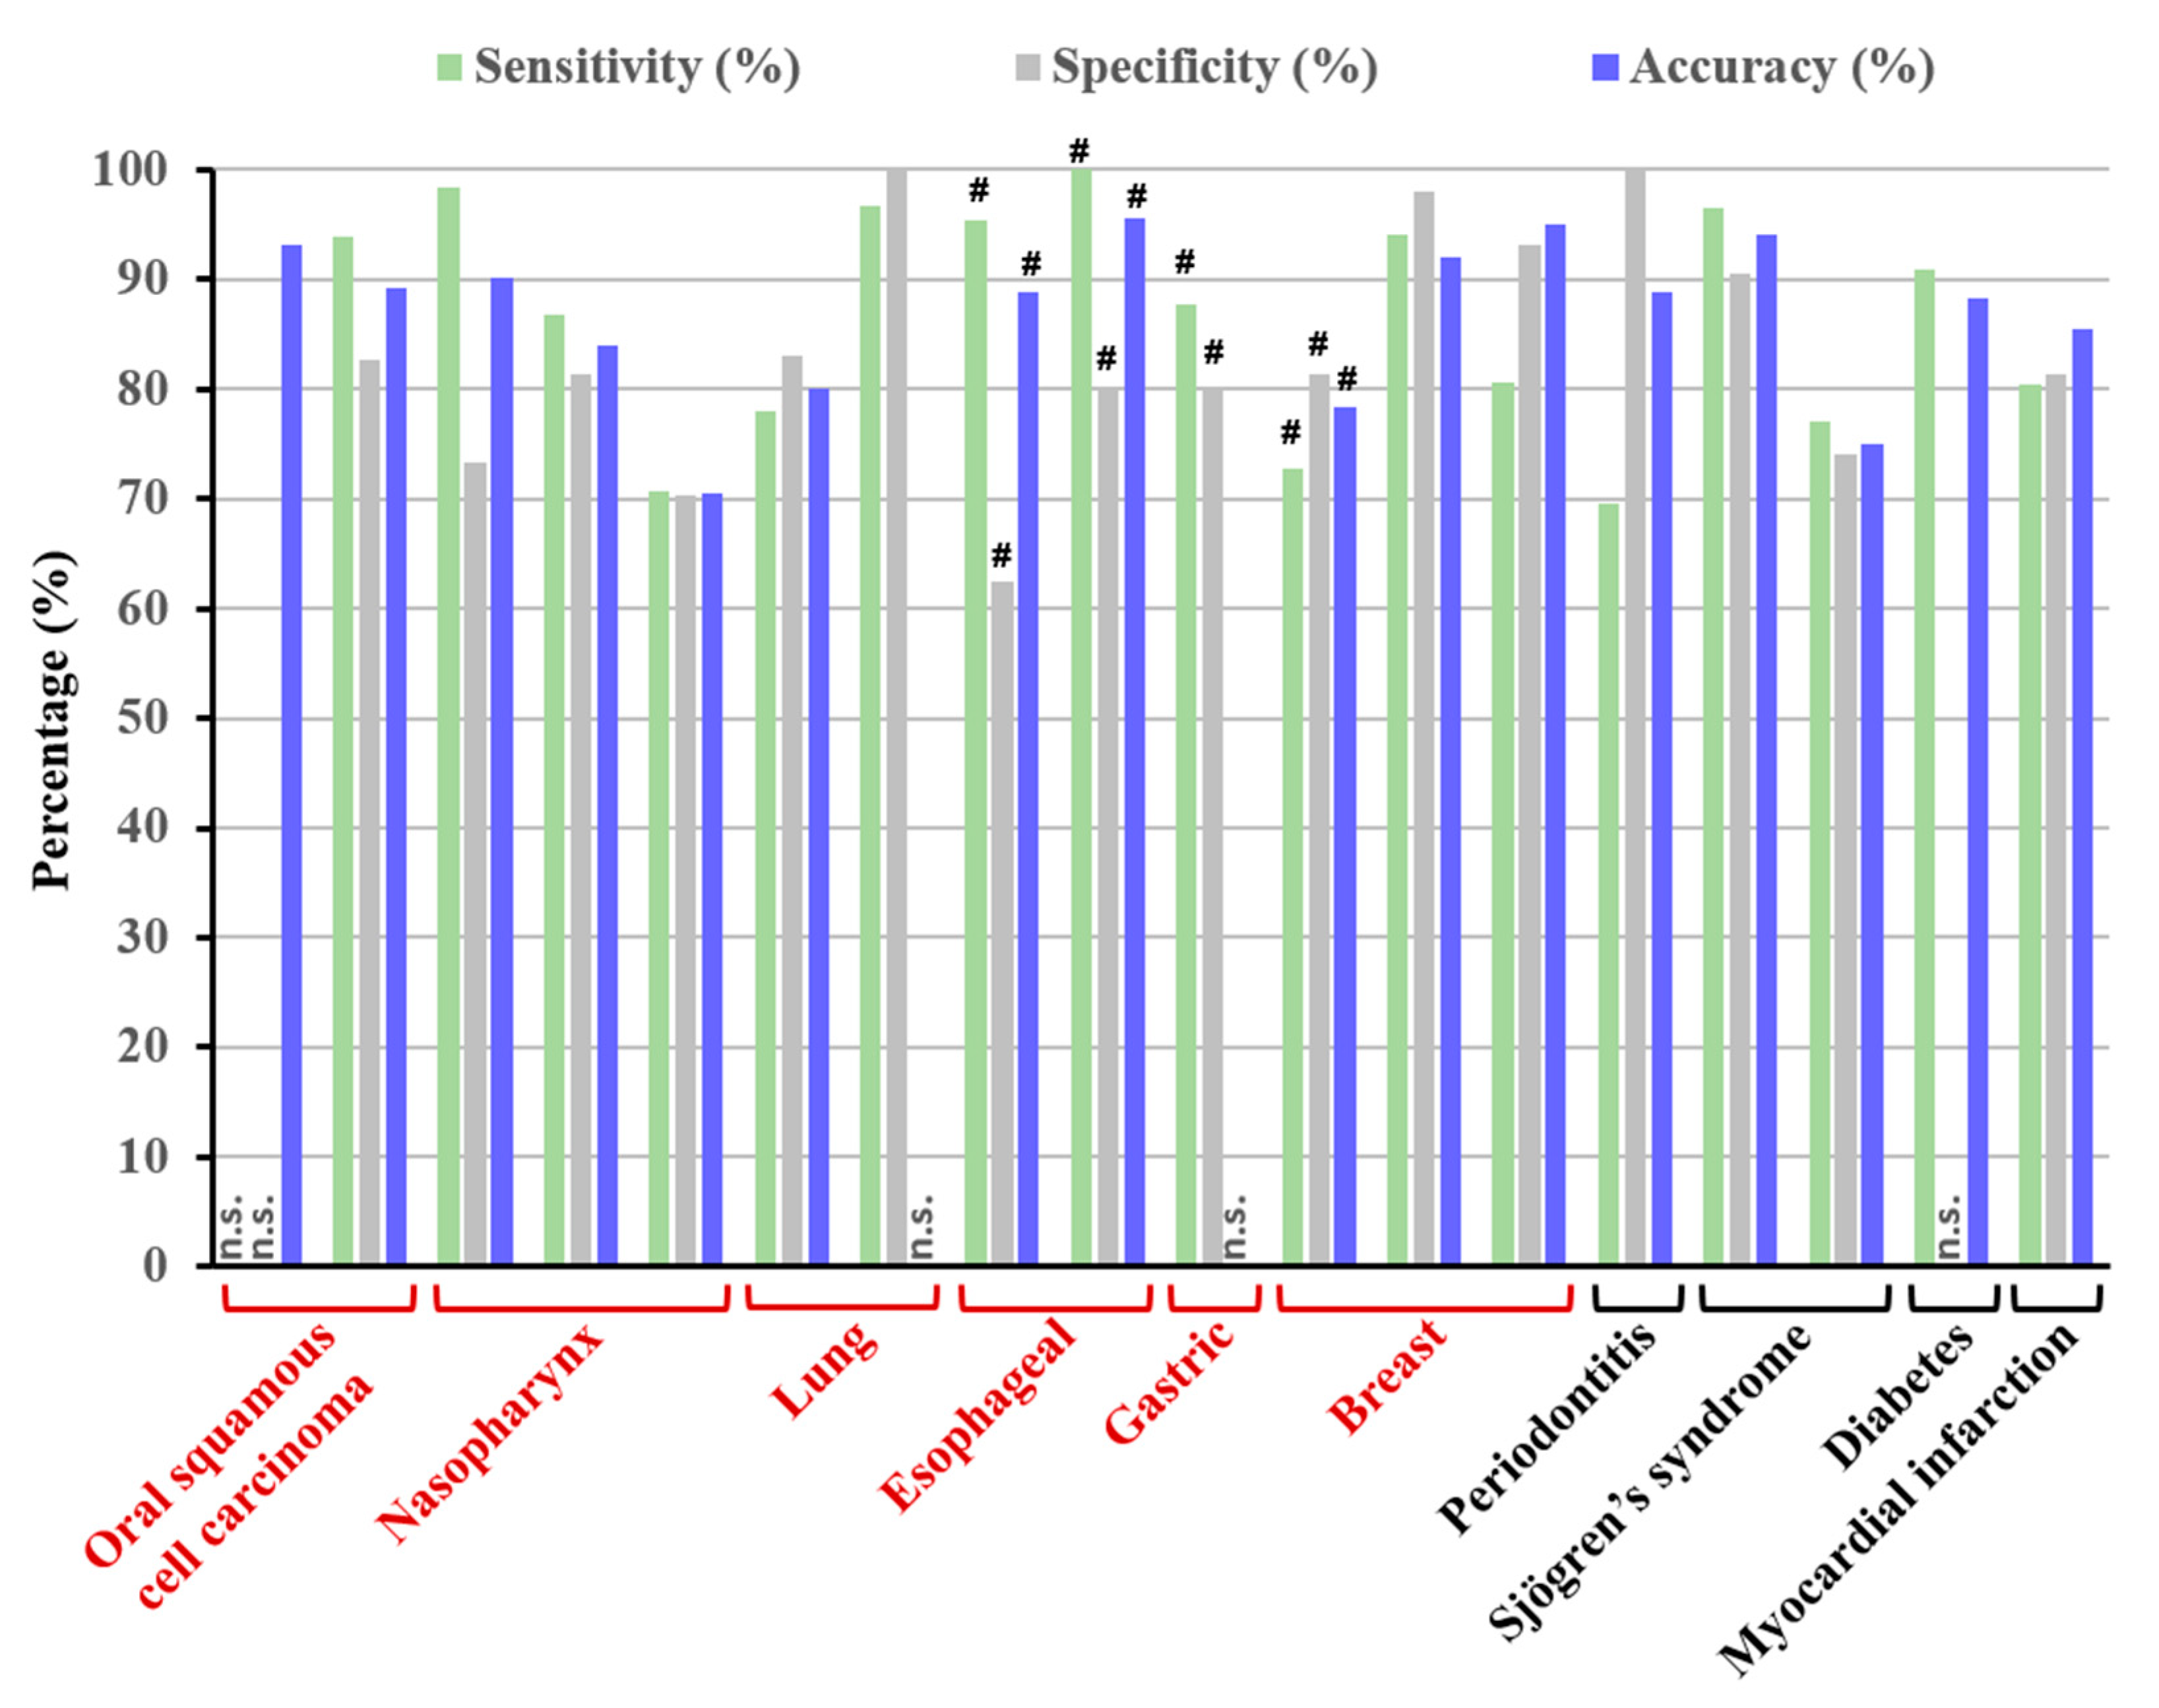
| Oral squamous cell carcinoma | Raman | Jaychandran S. et al. [14] | 2016 | 50 Cancers/87 Premalignant lesions/21 Healthy | PCA-LDA | 600 to 1800 | - | - | 93.1% |
| Raman | Rekha P. et al. [15] | 2016 | 32 Cancers/28 Premalignant lesions/23 Healthy | PCA-LDA-LOOCV | 800 to 1800 | 93.8% | 82.6% | 89.1% | |
| Nasopharynx cancer | SERS | Feng S. et al. [16] | 2014 | 62 Cancers/30 Healthy | PCA-LDA-LOOCV + ROC curve | 500 to 1750 | 98.4% | 73.3% | 90.2% |
| SERS | Qiu S. et al. [17] | 2016 | 32 Cancers/30 Healthy | PCA-LDA-LOOCV + ROC curve | 400 to 1750 | 86.7% | 81.3% | 83.9% | |
| SERS | Lin X. et al. [18] | 2017 | 170 Cancers/71 Healthy | PCA-LDA-LOOCV + ROC curve | 600 to 1750 | 70.7% | 70.3% | 70.5% | |
| Lung cancer | SERS | Li X. et al. [19] | 2012 | 21 Cancers/20 Healthy | PCA-LDA | 500 to 2000 | 78% | 83% | 80% |
| SERS | Qian K. et al. [20] | 2018 | 61 Cancers/66 Healthy | Random Forest * (SVM -LOOCV) | 400 to 1800 | 96.7% | 100% | - | |
| Œsophagal cancer | ATR-FTIR | Maitra I. et al. [21] | 2019 | 25 OAC/12 HGD/6 LGD/27 Barrett’s/19 Esophageal inflammatory/38 Healthy 24 OAC/10 HGD/5 LGD/26 Barrett’s/18 Esophageal inflammatory/35 Healthy | SPA-QDA * (PCA-QDA, GA-QDA) | 900 to 1800 | 95.4% # | 62.5% # | 88.8% # |
| Raman | Maitra I. et al. [22] | 2020 | SPA-QDA * (PCA-QDA, GA-QDA) | 800 to 1800 | 100% # | 80% # | 95.6% # | ||
| Gastric cancer | SERS | Chen Y. et al. [23] | 2018 | 84 Late cancer/20 Early cancer/116 Healthy | PCA | Amino acids (400–2000) | 87.7% # | 80% # | - |
| Breast cancer | SERS | Feng S. et al. [24] | 2015 | 31 Cancers/33 Benign tumor/33 Healthy | PLS-DA-LOOCV + ROC curve | 500 to 1780 | 72.7% # | 81.3% # | 78.4% # |
| SERS | Hernández-Arteaga A. et al. [25] | 2017 | 100 Cancers/106 Healthy | ROC curve analysis | Sialic acid (400–1800) | 94% | 98% | 92% | |
| SERS | Hernández-Arteaga A. et al. [26] | 2019 | 35 Cancers/129 Healthy | ROC curve analysis | Sialic acid (400–1800) | 80.6% | 93.1% | - | |
| Periodontitis | SERS | Hernandez-Cedillo A. et al. [27] | 2019 | 33 Periodontitis/30 Gingivitis/30 Healthy | ROC curve analysis | Sialic acid (400–1800) | 69.6% | 100% | - |
| Sjögren’s syndrome (SjS) | SERS | Stefancu A. et al. [28] | 2019 | 29 SjS/21 Healthy | PCA-LDA-LOOCV | 500 to 1750 | 96.5% | 90.5% | 94% |
| SERS | Moisoiu V. et al. [29] | 2020 | 31 SjS/22 Healthy | PCA-LDA-LOOCV | 600 to 1700 | 77% | 74% | 75% | |
| Diabetes | FTIR | Scott D.A. et al. [30] | 2010 | 39 Diabetes/22 Healthy | LDA-cross validation | 900 to 1800 | 90.9% | - | 88.2% |
| Myocardial infarction (AMI) | Raman | Cao G. et al. [31] | 2015 | 46 AMI/43 Healthy | PCA-LDA-LOOCV + ROC curve | 400 to 1800 | 80.4% | 81.4% | - |
| Diseases | Authors | Year | VS Technique | Nature of Substrate (for SERS only) | Peak Wavenumbers (in cm−1) | Major Assignments |
|---|---|---|---|---|---|---|
| Oral squamous cell carcinoma | Jaychandran S. et al. [14] | 2016 | Raman | - | 767, 1236, 1330, 1662, 1688 | Pyrimidine |
| 1652 | Amide | |||||
| 1444 | Mucine | |||||
| 752 | Hemocyanine | |||||
| Rekha P. et al. [15] | 2016 | Raman | - | 806, 1460, 1485 | DNA (O-P-O symmetric stretch, Pentose sugar CH2 deformation vibration, Purine base vibration) | |
| 829, 1142, 1169, 1660 | Glutathione | |||||
| 870, 896, 986 | Proline (C-C stretch, na, na) | |||||
| 918 | Histidine | |||||
| 935, 948, 964, 969 | Valine (C-C stretch, na, na, na) | |||||
| 1015, 1338, 1360, 1424, 1556 | Tryptophan (benzene and pyrrole ring breathe out of | |||||
| 1050, 1090 | phase, Fermi resonance doublet, na, na) | |||||
| 1066, 1128, 1302, 1735 | Lactic acid (C–CH3 stretch, C–O stretch) | |||||
| 1509 | Lipid (na, C-C stretch, CH2 twisting and wagging, C=O stretch) | |||||
| 1180 | Phenylalanine | |||||
| 1238, 1258, 1276 | Tyrosine, cytosine, guanine, adenine | |||||
| 1636 | Amide III (C-N stretch) | |||||
| 806, 1460, 1485 | Amide I (C=O stretch) | |||||
| Nasopharynx cancer | Feng S. et al. [16] | 2014 | SERS | Ag-Colloids | 621, 1004, 1031 | Phenylalanine (C-C twisting mode, νs(C-C), δ(C-C)) |
| 642, 1173 | Tyrosine (ν(C-S)) | |||||
| 760 | Tryptophan (ring breathing mode) | |||||
| 933 | Proline (ν(C-C)) | |||||
| 1123 | Proteins (ν(C-N)) | |||||
| 1337 | Collagen (CH3CH2 wagging) | |||||
| 1445 | Collagen, phospholipids (δ(C-H)) | |||||
| Qiu S. et al. [17] | 2016 | SERS | Ag-Colloids | 447, 1003 | Phenylalanine (Ring torsion, νs(C-C)) | |
| 496 | Glycogen | |||||
| 590 | Ascorbic acid, Amide VI | |||||
| 635 | L-Tyrosine, Lactose (ν(C-S)) | |||||
| 725 | Adenine, Coenzyme A (δ(C-H)) | |||||
| 812 | L-Serine (ν(C-C-O)) | |||||
| 888 | D-Galactosamine (δ(C-O-H)) | |||||
| 1052 | Protein (C-O/C-N stretching) | |||||
| 1134 | D-Mannose (ν(C-N)) | |||||
| 1204 | L-Tryptophane, Phenylalanine (Ring vibration) | |||||
| 1270 | Unsaturated fatty acids (ν(C-H)) | |||||
| 1336 | Nucleic acid bases (ν(C-H)) | |||||
| 1448 | Collagen, phospholipids (δ(CH2)) | |||||
| 1619 | Tryptophan (ν(C=C)) | |||||
| 1662 | Nucleic acid | |||||
| Lin X. et al. [18] | 2017 | SERS | Ag-Colloids | 621, 1004, 1031 | Phenylalanine (C-C twisting mode, νs(C-C), δ(C-H)) | |
| 642, 854, 1175 | Tyrosine (ν(C-S), Ring breathing mode, δ(C-H)) | |||||
| 760, 1208, 1552 | Tryptophan (Ring breathing mode, ν(C-C6H5), ν(C=C)) | |||||
| 878 | Hydroxyproline (ν(C-C)) | |||||
| 935 | Proline (ν(C-C)) | |||||
| 959 | α-helix Proline, Valine (ν(C-C)) | |||||
| 1049, 1123 | Proteins (ν(C-O) ν(C-N), ν(C-N)) | |||||
| 1265 | Amide III, collagen (ν(CN), δ(NH)) | |||||
| 1337 | Collagen (CH3CH2 wagging) | |||||
| 1445 | Collagen, lipids | |||||
| 1684 | Amide I (ν(C=C)) | |||||
| Lung cancer | Li X. et al. [19] | 2012 | SERS | Ag-Colloids | 523 | Lysozymes, proteins, guanine, thymine |
| 622 | Proteins, phenylalanine, adenine | |||||
| 696 | Methionine, cytosine | |||||
| 735 | Tryptophan, coenzyme A, adenine, cytosine, thymine, guanine | |||||
| 789 | Cytosine, uracil, thymine | |||||
| 822 | - | |||||
| 884 | Proline, valine, glycine, tryptophan, glutamic acid, hydroxyproline | |||||
| 909 | Tyrosine | |||||
| 925 | Proline, glucose | |||||
| 1009 | Tryptophan, lysine, phenylalanine | |||||
| 1077 | Lipids, nucleic acids, proteins, carbohydrates | |||||
| 1280 | Phospholipid, amide III, proteins, lipids | |||||
| 1369 | Tryptohan, porphyrins, lipids, guanine, thymine, proteins | |||||
| 1393 | - | |||||
| 1722 | Ester group | |||||
| Qian K. et al. [20] | 2018 | SERS | Gold nano-modified chip (OptoTrace Technologies) | 423 | Glucose, deuterated glucose | |
| 643 | (C-H torsion, COO- wag; O-C=O in plane deformation; C-C-C in phase deformation) | |||||
| 672 | Cytosine, guanine (C–S stretch) | |||||
| 732 | Adenine (C–S (protein)/CH2 rocking) | |||||
| 852 | Tyrosine (Ring breathing mode), Proline Ring (C–C stretch) | |||||
| 923 | Proline Ring (C-C stretch), Lactic Acid, glucose | |||||
| 999 | Phenylalanine (symmetric ring breathing mode) | |||||
| 1030 | (Stretching vibration of the ring, deformation in plane C-H) | |||||
| 1046 | N-acetyl glucosamine | |||||
| 1268 | Amide III (C–N stretching mode of proteins, indicating mainly a-helix conformation) | |||||
| 1449 | Phenylalanine, Proteins (CH2 bending mode), Bending mode (C=C) | |||||
| 1600 | Phenylalanine, Tyrosine (C=C in-plane bending mode) | |||||
| Œsophagal cancer | Maitra I. et al. [21] | 2019 | ATR-FTIR | 902 | Phosphodiester region | |
| 991 | Ribose (C-O), (C-C) | |||||
| 1003 | (Ring stretching vibrations mixed strongly with CH in-plane bending) | |||||
| 1014, 1107 | Polysaccharides, pectin (ν(CO), ν(CC), δ(OCH), ring) | |||||
| 1068 | Ribose (Stretching C-O) | |||||
| 1099 | Phosphate II (Stretching PO2- symmetric) | |||||
| 1431 | Polysaccharides, cellulose (δ(CH2)) | |||||
| 1558 | (Ring base) | |||||
| 1589 | Phenyl (Ring C-C stretch) | |||||
| 1604 | Adenine (DNA) | |||||
| 1624, 1689 | Nucleic acids (base carbonyl stretching, ring breathing mode) | |||||
| 1643 | Amide I (C=O stretching vibrations) | |||||
| 1697, 1701 | Guanine (C2=O, C5=O) | |||||
| 1716 | Thymine (C=O) | |||||
| 1743 | Lipids (C=O stretching mode) | |||||
| 1778, 1786 | Lipids (ν(C=C), ν(C=C)), fatty acids | |||||
| Maitra I. et al. [22] | 2020 | Raman | 902 | Phosphodiester region | ||
| 991, 1068 | Ribose (C-O), (C-C) | |||||
| 1003 | (Ring stretching vibrations mixed strongly with CH in-plane bending) | |||||
| 1014, 1107 | Polysaccharides, pectin (ν(CO), ν(CC), δ(OCH), ring) | |||||
| 1068 | Ribose (Stretching C-O) | |||||
| 1099 | Phosphate II (Stretching PO2- symmetric) | |||||
| 1431 | Polysaccharides, cellulose (δ(CH2)) | |||||
| 1558 | (Ring base) | |||||
| 1589 | Phenyl (Ring C-C stretch) | |||||
| 1604 | Adenine (DNA) | |||||
| 1624, 1689 | Nucleic acids (base carbonyl stretching, ring breathing mode) | |||||
| 1643 | Amide I (C=O stretching vibrations) | |||||
| 1697, 1701 | Guanine (C2=O, C5=O) | |||||
| 1716 | Thymine (C=O) | |||||
| 1743 | Lipids (C=O stretching mode) | |||||
| 1778, 1786 | Lipids (ν(C=C), ν(C=C)), fatty acids | |||||
| Gastric cancer | Chen Y. et al. [23] | 2018 | SERS | A/GO NSs | 435 | Glutamine, hydroxylysine, proline, tyrosine |
| 488 | Taurine, glycine, ethanolamine, hydroxylysine, tyrosine | |||||
| 530 | Taurine, glutamine, histidine, alanine, glutamic acid | |||||
| 642 | Histidine, alanine, proline, tyrosine | |||||
| 725 | Taurine, glutamine, histidine, glutamic acid | |||||
| 781 | Glycine, glutamic acid, proline, tyrosine | |||||
| 843 | Taurine, ethanolamine, histidine, alanine, hydroxylysine, proline, tyrosine | |||||
| 869 | Glycine, glutamine, ethanolamine, glutamic acid | |||||
| 917 | Glutamine, alanine, glutamic acid, proline | |||||
| 933 | Histidine, glutamic acid, proline | |||||
| 961 | Histidine, glutamic acid, proline, tyrosine | |||||
| 1037 | Taurine, ethanolamine, alanine, proline, tyrosine | |||||
| 1053 | Taurine, glutamine, ethanolamine, hydroxylysine | |||||
| 1109 | Taurine, glutamine, ethanolamine, histidine, alanine | |||||
| 1197 | Histidine, hydroxylysine, proline, tyrosine | |||||
| 1222 | Hydroxylysine, proline, tyrosine | |||||
| 1450 | Taurine, glycine, glutamine, ethanolamine, alanine, glutamic acid, hydroxylysine, proline | |||||
| 1500 | Histidine | |||||
| 1710 | Glutamine | |||||
| Breast cancer | Feng S. et al. [24] | 2015 | SERS | Ag-Colloids | 621, 643, 1004, 1033 | Phenylalanine (C-C twisting mode, C-C twisting mode, νs(C-C), δ(C-H)) |
| 760, 1208, 1552 | Tryptophan (Ring breathing mode, ν(C-C6H5), ν(C=C)) | |||||
| 854, 1176 | Tyrosine (Ring breathing mode, δ(C-H)) | |||||
| 876 | Hydroxyproline (ν(C-C)) | |||||
| 935 | Proline (ν(C-C)) | |||||
| 1049, 1084 | Proteins (ν(C-O) ν(C-N), ν(C-N)) | |||||
| 1265 | Amide III, collagen (ν(CN), δ(NH)) | |||||
| 1340 | Collagen (CH3CH2 wagging) | |||||
| 1447 | Collagen, Lipids (δ(C-H)) | |||||
| 1684 | Amide I (ν(C=C)) | |||||
| Hernández-Arteaga A. et al. [25] | 2017 | SERS | Cit-Ag-NP | 1002 | Pyranose (Ring breathing mode) | |
| 1237 | Amide III (C-N stretching) | |||||
| 1391 | Carboxyl (stretching mode) | |||||
| Hernández-Arteaga A. et al. [26] | 2019 | SERS | Cit-Ag-NP | 1002 | Pyranose (Ring breathing mode) | |
| 1237 | Amide III (C-N stretching) | |||||
| 1391 | Carboxyl (stretching mode) | |||||
| Periodontitis | Hernandez-Cedillo A. et al. [27] | 2019 | SERS | Cit-Ag-NP | 1002 | Pyranose (Ring breathing mode) |
| 1237 | Amide III (C-N stretching) | |||||
| 1391 | Carboxyl (stretching mode) | |||||
| Sjögren’s syndrome (SjS) | Stefancu A. et al. [28] | 2019 | SERS | Ag-NP | 724, 1095, 1323, 1450, 1570 | Hypoxanthine (na, R2trigd or bC-H (in-plane), C-O, C-N or C-C, C-N) |
| 956, 1134, 1245, 1323 | Xanthine (bN-H, R2trigd, C-N, Ring vibrations, C-N, bC-H, C-N) | |||||
| 884, 1130, 1370 | Uric acid (na, na, na, C-N, C-H bending) | |||||
| Moisoiu V. et al. [29] | 2020 | SERS | Cl-Ag-NP | 724, 1097, 1324, 1449, 1581 | Hypoxanthine (na, Ring vibrations, C-O, C-N or C-C, C-N) | |
| 957, 1132, 1245, 1324 | Xanthine (na, Ring vibrations, C-N, Mixed ring vibrations/C-N) | |||||
| 812, 886, 1132, 1369 | Uric acid (na, na, C-N, C-N, C-H bending) | |||||
| 1002, 1032, 1205, 1651 | Proteins (Phe, Phe, Try/Phe, Amide I) | |||||
| Diabetes | Scott DA. Et al. [30] | 2010 | FTIR | ≈970 | (C-C/C-O stretching vibrations in sugar moieties) | |
| ≈1150 | (C-C/C-O stretching vibrations in sugar moieties, C-O-C symmetric and asymmetric vibrations of sugar moieties and phospholipids) | |||||
| ≈1410 | (vs(COO−1), symmetric and asymmetric carboxyl radical stretching vibrations of carboxylate groups) | |||||
| ≈1470 | (bending vibration of CH2 group of amino acids in protein side chains) | |||||
| ≈1695 | (α-helix component in the amide I region, intermolecular antiparallel b-sheets) | |||||
| ≈1745 | (lipid ester band) | |||||
| Myocardial infarction (IMA) | Cao G. et al. [31] | 2015 | Raman | 442 | (N-C-S stretch) | |
| 509 | Cystein (ν(S–S) gauche–gauche–gauche) | |||||
| 621, 1002, 1031 | Phenylalanine (C–C twisting mode of phenylalanine, δ(C–H)) | |||||
| 643, 828, 853 | Tyrosine (C–C twisting, Ring breathing tyrosine, Ring breathing mode of tyrosine) | |||||
| 755 | Tryptophan (ν(C–C)) | |||||
| 876 | Hydroxyproline | |||||
| 925 | (C–H bending) | |||||
| 1047 | (C–CH3 vibration) | |||||
| 1210 | Hydroxyproline, Tyrosine | |||||
| 1330 | Nucleic Acids | |||||
| 1449 | Proteins (C–H vibration) | |||||
| 1555 | Amide II | |||||
| 1670 | Amide I |
| MeSH Terms Used for MEDLINE Search | Keywords Used for Scopus Search |
|---|---|
| (“saliva”[MeSH Terms] OR saliva[Title/Abstract]) AND (“diagnosis”[MeSH Terms] OR diagnosis[Title/Abstract] OR “biomarkers”[MeSH Terms] OR biomarkers[Title/Abstract] OR diagnostic[Title/Abstract]) AND (“spectroscopy, fourier transform infrared”[MeSH Terms] OR “infrared spectroscopy”[Title/Abstract] OR “spectrum analysis, Raman”[MeSH Terms] OR “Raman”[Title/Abstract]) | (saliva) AND (diagnosis OR biomarkers OR diagnostic) AND (“infrared spectroscopy” OR Raman) |
| Item | Criteria of Inclusion | Criteria of Exclusion |
|---|---|---|
| population and conditions of interest | human population with clinical signs of disease with or without histopathologically confirmed disease diagnosis | non-human study |
| intervention/exposure/investigation | application of vs. to the analysis of human saliva with the specific aim of disease diagnosis | method other than vs. used as the main method of analysis |
| comparison | diseased population versus healthy population as the control group | no control group |
| outcomes of interest | performance of diagnostic tool (sensitivity, specificity, accuracy) | n.s. |
| study design | any study design fitting the above criteria | study with less than 20 participants in each group (diseased and control) |
| type of paper | original paper. manuscript is written in English | review article, opinion, commentary abstract from a conference, or not a peer-reviewed article. |
© 2020 by the authors. Licensee MDPI, Basel, Switzerland. This article is an open access article distributed under the terms and conditions of the Creative Commons Attribution (CC BY) license (http://creativecommons.org/licenses/by/4.0/).
Share and Cite
Derruau, S.; Robinet, J.; Untereiner, V.; Piot, O.; Sockalingum, G.D.; Lorimier, S. Vibrational Spectroscopy Saliva Profiling as Biometric Tool for Disease Diagnostics: A Systematic Literature Review. Molecules 2020, 25, 4142. https://doi.org/10.3390/molecules25184142
Derruau S, Robinet J, Untereiner V, Piot O, Sockalingum GD, Lorimier S. Vibrational Spectroscopy Saliva Profiling as Biometric Tool for Disease Diagnostics: A Systematic Literature Review. Molecules. 2020; 25(18):4142. https://doi.org/10.3390/molecules25184142
Chicago/Turabian StyleDerruau, Stéphane, Julien Robinet, Valérie Untereiner, Olivier Piot, Ganesh D. Sockalingum, and Sandrine Lorimier. 2020. "Vibrational Spectroscopy Saliva Profiling as Biometric Tool for Disease Diagnostics: A Systematic Literature Review" Molecules 25, no. 18: 4142. https://doi.org/10.3390/molecules25184142
APA StyleDerruau, S., Robinet, J., Untereiner, V., Piot, O., Sockalingum, G. D., & Lorimier, S. (2020). Vibrational Spectroscopy Saliva Profiling as Biometric Tool for Disease Diagnostics: A Systematic Literature Review. Molecules, 25(18), 4142. https://doi.org/10.3390/molecules25184142