Article

Condition-Dependent Coordination and Peroxidase Activity of Hemin-Aβ Complexes

by
Chiara Bacchella
1,†,
James T. Brewster II
2,†,
Steffen Bähring
3,*,
Simone Dell’Acqua
1,
Harrison D. Root
2,
Gregory D. Thiabaud
2,
James F. Reuther
2,4,
Enrico Monzani
1,
Jonathan L. Sessler
2,* and
Luigi Casella
1,*
1
Department of Chemistry, University of Pavia, Via Taramelli 12, 27100 Pavia, Italy
2
Department of Chemistry, The University of Texas at Austin, 105 East 24th, Street-Stop A5300, Austin, TX 78712-1224, USA
3
Department of Physics, Chemistry, and Pharmacy, University of Southern Denmark, Campusvej 55, DK-5230 Odense, Denmark
4
Department of Chemistry, University of Massachusetts Lowell, Lowell, MA 01854, USA
*
Authors to whom correspondence should be addressed.
These authors contributed equally.
Molecules 2020, 25(21), 5044; https://doi.org/10.3390/molecules25215044
Submission received: 29 September 2020 / Revised: 24 October 2020 / Accepted: 26 October 2020 / Published: 30 October 2020
(This article belongs to the Special Issue Phthalocyanines and Porphyrins)

Abstract

:
The peroxidase activity of hemin-peptide complexes remains a potential factor in oxidative damage relevant to neurodegeneration. Here, we present the effect of temperature, ionic strength, and pH relevant to pathophysiological conditions on the dynamic equilibrium between high-spin and low-spin hemin-Aβ40 constructs. This influence on peroxidase activity was also demonstrated using 2,2′-azino-bis(3-ethylbenzothiazoline-6-sulfonic acid) (ABTS) and dopamine (DA) oxidation rate analyses with increasing ratios of Aβ16 and Aβ40 (up to 100 equivalents). Interaction and reactivity studies of aggregated Aβ40-hemin revealed enhanced peroxidase activity versus hemin alone. Comparison of the results obtained using Aβ16 and Aβ40 amyloid beta peptides revealed marked differences and provide insight into the potential effects of hemin-Aβ on neurological disease progression.

1. Introduction

Central nervous system (CNS) neurodegeneration is characterized by the dysfunction and death of neurons in the brain and spinal cord. Recent efforts focused on elucidating the pathophysiological origins of CNS neurodegeneration, coupled with clinical failures on clearing amyloid beta constructs, suggests the need for an in-depth understanding of the etiology in order to design better treatment protocols [1,2,3]. Within this paradigm considerable effort remains focused on determining the roles that metal ions may play in the structural modification of protein aggregates, as well as aberrant oxidative and nitrative modification of various cellular components (e.g., DNA, cell membrane, proteins, and small molecules) [4,5,6,7].
The dysfunction of regulatory ferric heme (hemin) pathways present in neurodegenerative diseases, compounded by the interaction of hemin with amyloid beta (Aβ) and attendant peroxidase activity, has led to the proposal that hemin plays a role in disease progression [8,9,10]. Hemin has also been found to suppress Aβ-induced inflammatory activation of astrocytes and may retard other amyloid clearance pathways, further complicating etiological analyses [11,12]. A number of elegant studies by the groups of Casella [13], Atamna [14,15,16] Gao [17], Ghosh and Dey [18,19,20], Flemmig [21], Lu and Peng [22] and Imhof [23,24] have demonstrated the interaction between hemin and Aβ peptides (i.e., Aβ16, Aβ40, Aβ42, and mutant Aβ) with an increase in peroxidase activity [9]. Previous work has also led to the suggestion that at high concentrations of Aβ and hemin or high ratios (ca. 8 equivalents) of Aβ to hemin, a cytochrome b-type species predominates and can attenuate reactivity [20]. However, yet to be catalogued fully are the precise differences in coordination and peroxidase activity observed with Aβ40, a major amyloid species in diseased brains [25], at physiological temperature (37 °C), pH relevant to neuroinflammation (acidic pH), at high Aβ (i.e., 20 to 100 equivalents) to hemin ratios, and with aggregated Aβ. Here, we report a detailed condition-dependent modulation of the coordination environment and reactivity of hemin-Aβ constructs. As described below, under conditions designed to mimic those associated with neuroinflammation, such as at acidic pH (i.e., pH 6.3) [26,27] and at high ratios of Aβ-to-hemin that are potentially reflective of local concentrations in neuroinflammation or after traumatic brain injury (TBI) [21,28,29,30], the peroxidase activity of hemin-Aβ40 and Aβ16 complexes were significantly enhanced, as demonstrated via the oxidation of 2,2′-azino-bis(3-ethylbenzothiazoline-6-sulfonic acid) (ABTS) to ABTS radical cation and the oxidation of dopamine to dopaminochrome.

2. Results and Discussion

The interaction between hemin (5 μM), which is present as a mixture of dimeric and monomeric species in aqueous media [31,32], and Aβ40 was studied at physiologically relevant pH 7.4 in low ionic strength (5 mM) phosphate buffer at 23 °C. Upon adding up to two equivalents of Aβ40, the hemin Soret band (λmax = 390 nm) was observed to undergo a decrease in molar absorptivity along with a bathochromic shift in the maximum to λmax = 394 nm (Figure 1).
These changes in the optical signature are ascribed to the formation of an intermediate species recognized as containing a high-spin, five coordinate 1:1 Aβ40: hemin species [13]. In fact, Aβ40 can coordinate both the monomeric and dimeric forms of hemin giving two species that are not spectrophotometrically distinguishable (Supplementary Materials, Scheme S1). As the concentrations of Aβ40 are raised, a progressive increase in the molar absorptivity is seen in the UV-vis spectrum with an attendant bathochromic shift to λmax = 414 nm and the appearance of peaks at λ = 532 and 560 nm also being seen. At such concentrations, the low-spin, six coordinated 2:1 Aβ40: hemin species predominates [13,18]. The calculated binding constant for the 2:1 Aβ40: hemin complex is log β2 = 10.84 ± 0.02 (Table 1). By increasing the ionic strength (50 mM phosphate buffer), again at pH 7.4 and 23 °C, similar spectral features were observed (Supplementary Materials, Figure S1). Under these conditions, the calculated binding constant for the 1:1 complex was higher (log K1 = 7.30 ± 0.02) while that of the 2:1 complex was lower, log β2 = 9.77 ± 0.04 (Δlog β2 = 1.07).
Neuroinflammation with attendant acidosis is an established biomarker in neurodegenerative disease [26,27]. Titrations of Aβ40 at 23 °C in pH 6.89 and 6.3 phosphate buffer (5 mM) resulted in decreased binding constants of log β2 = 9.80 ± 0.01 and 9.05 ± 0.01, respectively (Supplementary Materials, Figure S2). Notably, a significant increase in the formation of the 1:1 Aβ40: hemin complex, Δlog K1 = 1.22, and 2:1 Aβ40: hemin complex, Δlog β2 = 0.48, was seen upon increasing the temperature of the standard conditions (pH 7.4, 5 mM phosphate buffer) to 37 °C (K1 = 7.30 ± 0.02, log β2 = 11.32 ± 0.16; Supplementary Materials, Figure S3). In relation to other axial ligands, the log β2 value for 50 mM phosphate buffer (pH 7.4) at ambient temperature is still larger than Aβ16 (8.82 ± 0.02) [13], L-histidine (2.95) and other histidine-containing peptides (3.91 to 7.67) [33], or the tau repeat peptide I (log K1 = 4.96 ± 0.01 [34]; log β2 could not be determined due to small log K2 values) studied under comparable conditions. This data is also in agreement with previously reported values for Aβ40/42 [14,15,16,17,18,35].
The dynamic equilibrium between low-spin, six coordinate hemin(Aβ40)2 (1:2) and high-spin, five coordinate hemin-Aβ40 (1:1) was also probed qualitatively by decreasing the temperature from 37 to 5 °C at 5, 10, 20, and 50 equiv. of Aβ40 (Supplementary Materials, Figure S4). Analogous to the previous work on Aβ16-hemin complexes at various temperatures by our group, upon decreasing the temperature, the equilibrium increasingly favours the 2:1 Aβ40: hemin complex [13]. At 5 and 10 equiv., upon decreasing the temperature from 37 °C to 4 °C, reversion from the 2:1 Aβ40: hemin to a mixed 1:1 and 2:1 Aβ40: hemin complex was observed. However, at 20 and 50 equiv., the equilibrium still favored the 2:1 Aβ40: hemin complex with a minor 1:1 Aβ40: hemin component, as inferred from the observation of the λmax at 414 nm signal with a reduced absorption intensity. The partial reversibility of this equilibrium was also demonstrated in the presence of 5 and 10 equivalents of Aβ40 by increasing the temperature to 37 °C (ESI Figure S4).
The peroxidase activity of Aβ40-hemin constructs typically reflect the coordination environment [13,14,15,16,17,18,19,20,21,22,23,24]. We thus sought to investigate how extending the pH and Aβ40 concentration ranges, up to 100 equivalents, affected peroxidase activity (Table 2). With such an objective in mind, the peroxidase activity of hemin was measured by monitoring the oxidation of ABTS by hydrogen peroxide at increasing ratios of Aβ40: hemin at pH 7.4 in phosphate buffer (50 mM) at 37 °C (Figure 2). The reaction rates were obtained by dividing the slope of the trace in the initial seconds of the reaction by the product of hemin concentration multiplied by the molar extinction coefficient of the ABTS radical cation multiplied by a factor of two to account for the two ABTS radical cations produced during each reaction cycle (cf. Materials and Methods). In this regime, pseudo-first order rate behavior was observed. It was concluded that at higher Aβ40 concentrations, where the six-coordinate Aβ40: hemin (2:1) species is reported as the predominant species [13], a greater than 2.5- and 3-fold increase in rate was observed at pH 7.4 and 6.3, respectively.
As can be seen from an inspection of Table 2 (first entry), the catalytic activity of free hemin for the oxidation of ABTS was higher at pH 6.3 (kobs = 0.016 s−1) than at 7.4 (kobs = 0.013 s−1). The addition of Aβ40 to hemin further enhanced the peroxidase activity at both pH values, with kobs always larger at pH 6.3 as compared to 7.4 (Figure 2). Previous studies detailing the oxidative reactivity of Aβ40-hemin complexes have failed to explore high concentrations of Aβ40 (i.e., more than 20 equivalents) [24].
Similar to the trend observed with Aβ16 by Flemmig and co-workers [21], in comparison to free hemin, at 100 equiv. of Aβ40, the initial rate increased by 2.5- and 3-times at pH 7.4 (0.032 s−1) and 6.3 (0.049 s−1), respectively. Notably, over the course of the reaction, the rate of peroxidase activity decreased, this is attributed to hemin degradation. The two conditions also showed different rates for decomposition with the larger drop in rate at pH 7.4. At pH 6.3, the peroxidase activity remained high even at longer reaction times, allowing for increased product formation (Figure 2).
Previous work by Ghosh, Dey, and co-workers has shown that Au electrode immobilized hemin-Aβ aggregates can produce partially reduced oxygen species (PROS) [37]. We thus sought to further elaborate on the peroxidase activity of aggregated Aβ-hemin at different pH. Qualitative reactivity experiments utilizing ABTS with hemin and a suspension of mixed soluble and insoluble aggregated Aβ40 revealed a rate enhancement versus hemin alone (Supplementary Materials, Figure S5). A faster rate was also again seen at pH 6.3 versus pH 7.4 and when higher levels of Aβ40 were present (Supplementary Materials, Figure S6). In order to explore the nature of this activity, hemin-uptake experiments, as measured by following the hemin Soret-band (λmax = 390 nm), revealed that at pH 6.3, less hemin was absorbed within the aggregate and at a slower rate (Supplementary Materials, Figure S7). Based on these spectroscopic studies, it was inferred that at pH 6.3 some hemin also leached back into solution after the initial inclusion event.
In line with previous work by the groups of Atamna [14] and Xu [35], studies involving the use of circular dichroism (CD) spectroscopy and scanning electron microscopy (SEM) provided support for the inference that hemin can disrupt the Aβ40 aggregate architecture (Figure 3). Briefly, upon addition of hemin (5 μM) to Aβ40 aggregates (40 μM, 8 equivalents, aged 30 days), the negative CD minimum underwent a slight decrease in intensity with the λmax shifting from 218 nm to 220 nm. Over the course of 24 h, a further reduction in the CD intensity was seen with a shift in the minimum to ca. 217 nm.
SEM analyses of the aggregated Aβ40 (aged 30 days plus 24 h) sample showed fibrillar constructs, observable at 5 μm. The Aβ40 sample (aged 30 days) incubated with hemin (5 μM) for 24 h displayed a more globular like structure, observable at 3 μm. A control experiment involving freshly dissolved Aβ40 showed amorphous species, observable at 2 μm. We thus propose that the reactivity of aggregated Aβ40-hemin complexes may operate under a mechanism wherein both hemin exposed on the aggregate surface and newly formed soluble oligomeric Aβ40-hemin complexes contribute to the peroxidase activity. The ability of acidic pH to disrupt the β sheet architecture is also expected to enhance formation of soluble oligomeric Aβ40-hemin complexes with increased peroxidase activity [37,38,39].
The monoamine neurotransmitter, dopamine (DA), plays a key role in proper neuronal function [40]. Recent studies have also demonstrated that DA and oligomeric melanin help maintain standard physiological functions and have a pathological relevance in neurodegenerative conditions [41]. We thus sought to determine how the enhanced peroxidase activity of Aβ40-hemin complexes might oxidatively modify DA. The DA modifying activity of these Aβ40-hemin complexes was evaluated by monitoring the formation of dopaminochrome, an intermediate during DA oxidation to melanin [42]. Notably, DA oxidation mediated by hemin and Aβ40-hemin complexes did not exhibit a simple Michaelis-Menten behavior, but instead showed evidence of a substrate inhibition effect (ESI Figure S8). The kinetic constants (pseudo-first order approach) (Table 3) were obtained by dividing the slope of the trace in the initial seconds of the reaction by the product of hemin concentration multiplied by the molar extinction coefficient of dopamine (cf. Materials and Methods).
At pH 7.4 in phosphate buffer (50 mM), Aβ40 increases the peroxidase activity of hemin in terms of DA oxidation, albeit the rate at 100 equivalents of Aβ40 is only 1.5-times greater than hemin alone (Figure 4). At pH 6.3, DA oxidation becomes more difficult due to the proton-dependent increase in the substrate E° value [44]. This difference is reflected in the hemin-mediated oxidation of DA that proceeds at a 3-times slower rate of 0.018 s−1 at pH 6.3 vs. 0.053 s−1 at pH 7.4 (Figure 4). However, at pH 6.3, the presence of Aβ40 (100 equivalents) increased the rate almost two-fold.
Similar studies utilizing the Aβ16 model system showed marked differences versus Aβ40. At both pH 7.4 and 6.3, Aβ16 proved more effective at increasing the rate of hemin-catalyzed oxidation of ABTS and DA in the presence of H2O2 (Table 2 and Table 3, Figures S9–S12). In particular, Aβ16 showed a significant rate enhancement with a 4-fold and almost 6-fold increase of ABTS oxidation (hemin vs. 100 equiv. Aβ16) at pH 7.4 and 6.3, respectively. In the case of DA oxidation, Aβ16 displayed a 3-fold and 4-fold increase at pH 7.4 and 6.3, respectively.
These findings may be rationalized by assuming mechanistically that the peroxidase-like activity of hemin resembles that of the peroxidase enzyme [45]. Briefly, there is an initial activation of H2O2 with attendant formation of a high valent P•+FeIV=O species (Compound I), where P•+ indicates the porphyrin π-radical cation (Equation (1)). The involvement of compound I-like oxidant for heme-Aβ peptides complexes has been recently characterized [46]. The formation of this active species is followed by two one-electron oxidations of two substrate molecules (SH) (Equations (2) and (3)). The rate-determining step (rds) of the catalytic cycle depends on the relative concentrations of H2O2 and SH. The experiments reported here were performed under conditions where the H2O2 concentration has reached kinetic saturation, making step 3 the rds. The data supports the conclusion that the rate increase seen with a large excess of Aβ40 is due to faster electron transfer from SH to the FeIV=O species (Equation (3)).
PFeIII + H2O2 ⇄ [PFeIII-H2O2] → P•+FeIV = O + H2O
P•+FeIV = O +SH → PFeIV = O + S + H+
PFeIV = O + SH + H+ → PFeIII + S + H2O
The effect of Aβ peptides in promoting a marked rate increase may be ascribed to the following three hypotheses: (i) axial coordination of the FeIII center to enhance oxidative reactivity, (ii) acid/ base catalysis facilitating the release of the oxo group as water, and (iii) enhancing substrate approach to the iron-oxo porphyrin. In order to assess the relative contributions of the previous hypotheses, analogous DA oxidation experiments were carried out using hemin-glycyl-L-histidine methyl ester (hemin-GH) [47]. The appended histidine residue is strongly bound to the iron(III) centre via an intramolecular coordination, leading to a five-coordinate iron(III) species with enhanced peroxidase activity. Not surprisingly, the rate of DA oxidation was more than one order of magnitude larger (0.785 s−1) than that of free hemin under the same conditions (0.053 s−1) (Supplementary Materials, Table S1). The addition of 1 or 5 equivalents Aβ16 failed to modify the reaction rate significantly, with values of 0.819 s−1 and 0.824 s−1, respectively, being observed (Supplementary Materials, Figure S13). However, addition of 20 and 100 equivalents Aβ16 caused a rate decrease, with values of 0.773 s−1 and 0.591 s−1, respectively, now being obtained (Table S1). This leads us to suggest that the unstructured organization of the Aβ16 peptide chain around the hemin centre (hypotheses ii and iii) has little effect, if any, on the reaction rates. High levels of peptide are believed to introduce some steric hindrance, but the principal effect leading to the increase in activity is ascribed by default to iron chelation by the Aβ peptide (hypothesis i).
To the extent such considerations are correct, the mechanism of substrate oxidation by hemin in the presence of Aβ peptides must include a pre-equilibrium step leading to a mixture of hemin, hemin-Aβ, and hemin(Aβ)2, defined by binding constants K1 and K2 (Supplementary Materials, Scheme S2). Upon reacting with H2O2, hemin is transformed into the iron-oxo species through pathway a. Hemin-Aβ and hemin(Aβ)2 are transformed into the same active iron-oxo species through pathways b and c. The reversible disassociation of six-coordinated hemin(Aβ)2 in the pre-equilibrium prevents reaction inhibition and ultimately yields the same active intermediate formed by hemin-Aβ (1:1). At saturating levels of H2O2, the distal histidine of the second Aβ peptide is also readily displaced by H2O2. The first Aβ peptide has been shown to coordinate the iron center strongly via one of the three histidine residues (preferably His13) [18]. This, in turn, increases the electron density at iron and favours electron transfer from the substrate to the iron-oxo species (hypothesis i).
A comparison between the two amyloid peptide species considered in the present study reveals that hemin has a higher affinity (K1) for Aβ40 over Aβ16 (Table 1). However, analysis of the kobs values reported in Table 2 and Table 3 indicate a higher activating effect (peroxidase activity) in the case of Aβ16. This phenomenon is attributed to increased steric bulk around the metal center caused by the larger Aβ40 peptide, something that prevents substrate approach and electron transfer. It should also be noted that a larger concentration of the Aβ is required for complete binding to hemin under conditions of catalysis than might be expected based on the value for log K1. This is rationalized in terms of a high substrate concentration that competitively prevents binding the second hemin axial site. This, in turn, precludes catalyst activation with H2O2 and is also reflected in the inhibitory effect of excess DA.
Finally, we evaluated the competitive self-oxidation of Aβ in the presence of DA and H2O2. Previous work by our group [13,48], as well as others [49], has demonstrated that the Aβ peptide is a substrate for metal-catalyzed oxidation. Briefly, a reaction mixture of hemin (6 μM), Aβ16 (30 μM), H2O2 (1 mM) and DA (3 mM) in phosphate buffer (50 mM, pH 7.4) was incubated at 37 °C for 30 and 120 min, followed by HPLC-MS analysis. As shown in Table S2 and Figure S14, the peptide remains mostly unmodified (79% intact) at both 30 and 120 min. Control experiments without DA showed that the modification pattern is similar, 85% unmodified Aβ16, indicating that the oxidation is mainly mediated by the oxidative hemin-Aβ16-H2O2 system (Table S3). The similar amounts of modified peptide seen for the two reaction times leads us to suggest rapid modification of Aβ16 followed by catalyst decomposition or inhibition in the case of added DA.

3. Materials and Methods

3.1. General Procedures

Hemin, 2,2′-azino-bis(3-ethylbenzothiazoline-6-sulphonic acid) (ABTS), and dopamine hydrochloride were purchased from Sigma Aldrich and used as received. Hemin stock solutions were prepared by dissolving hemin in 0.5 M NaOH in Milli Q water and centrifuging at 14,000 rpm for 2 min. The supernatant was decanted and diluted in Milli Q water to yield an approximately 3 mM stock solution. The phosphate buffer solution was prepared by dissolving the appropriate amounts of Na2HPO4 and NaH2PO4 then adjusting the pH with concentrated NaOH (aq.). Aβ16 was prepared as previously reported [48]. Aβ40 was prepared via Fmoc amino solid-phase peptide synthesis using a Liberty Blue™ microwave peptide synthesizer [50]. Preparative RP-HPLC purification of peptides was performed using an Agilent Zorbax SB-C18 Prep HT column 21.2 × 250 mm. Analytical RP-HPLC characterization of peptides was performed using an Agilent Zorbax column 4.6 × 250 mm. An Agilent Technologies 6530 Accurate Mass QT of LC/MS was used for high-resolution mass spectra of purified peptides. Solvents used were HPLC grade. Aβ40 stock solutions for UV-vis titrations were prepared by dissolving the peptide in Milli Q water. The solution was sonicated and vortex mixed until the peptide was dissolved. This mixture was filtered through a 0.22 micron PTFE filter. Concentration of the Aβ40 peptide was measured by UV-vis spectroscopy using a molar extinction coefficient ε280 = 1480 M−1 cm−1 [51]. Concentration of hemin solution was measured by UV-vis spectroscopy using a molar extinction coefficient ε390 = 66,000 M−1 cm−1 [52]. UV-vis spectra and kinetic experiments were recorded on a Hewlett Packard HP 8453A diode array spectrophotometer equipped with a thermostated, magnetically stirred cuvette holder. The peptides were studied by direct LC-MS/MS analysis. LC-MS and LC-MS/MS data were obtained by using an LCQ DECA ion-trap mass spectrometer with an ESI ion source, coupled with an automatic injector Surveyor HPLC system and controlled by the Xcalibur 1.3 software (Thermo-Finnigan, San Jose, CA, USA). The system was run in an automated LC-MS/MS mode and by using a Surveyor HPLC system (Thermo-Finnigan, San Jose, CA, USA) equipped with a BIOBASIC C18 column (5 µM), 150 × 2.1 mm). For analysis of oxidation studies, the acquired MS/MS spectra were automatically searched against the human Aβ16 sequence by using the SEQUEST algorithm to identify the modified residues. This algorithm was incorporated into the Bioworks 3.1 software (Thermo-Finnigan, San Jose, CA, USA). SEM analyses were prepared by drop-casting samples onto silica wafers (University Wafers) then gently drying with nitrogen. Images were taken on a FEI Quanta 650 ESEM instrument in The University of Texas at Austin–Texas Materials Institute. Circular dichroism (CD) analyses were carried out using a Jasco J-815 CD spectrometer acquired through The University of Texas at Austin Texas Institute for Drug Discovery & Development (Ti3D). Titration data were processed with the Hyperquad package [53] using a range of wavelengths centered around the two absorption maxima. The fittings allowed the determination of the equilibrium constants for the two-step binding processes:
Step 1:   [hemin(H2O)2] + Aβ40 ⇄ [hemin(Aβ40)(H2O)] + H2O  (K1)
Step 2:   [hemin(Aβ40)(H2O)] + Aβ40 ⇄ [hemin(Aβ40)2] + H2O  (K2)
Global:   [hemin(H2O)2] + 2 Aβ40 ⇄ [hemin(Aβ40)2] + 2 H2O  (β2)

3.2. Kinetics of ABTS Oxidation

The catalytic oxidation of ABTS by a hemin-hydrogen peroxide mixture was studied at 37 °C in 50 mM phosphate solution at pH 7.4 or 6.3. ABTS (3 mm) oxidation was initiated by the addition of hemin (3 µM), H2O2 (2.5 mM) and amyloid-β fragments 1–16 and 1–40 (0–200 µM). Each mixture containing hemin and buffer solution was equilibrated at 37 °C for 5 min before the addition of the substrate and peptide; hydrogen peroxide was added to the reaction solution as the last reagent. The reactions were followed through the development of the optical band of ABTS radical cation at 660 nm (ε660 = 14,700 M−1 cm−1) [36]. Reaction rates in Δ(absorbance/s) units were calculated from the slope of the trace in the initial 30 s, with the first few seconds discarded to allow stabilization of the readings, and were then converted into the observed kinetic constant (s−1) by dividing the calculated value over the product of catalyst concentration multiplied by the molar extinction coefficient of ABTS·+ multiplied by a factor of two (each catalytic cycle involves formation of two ABTS·+ molecules).

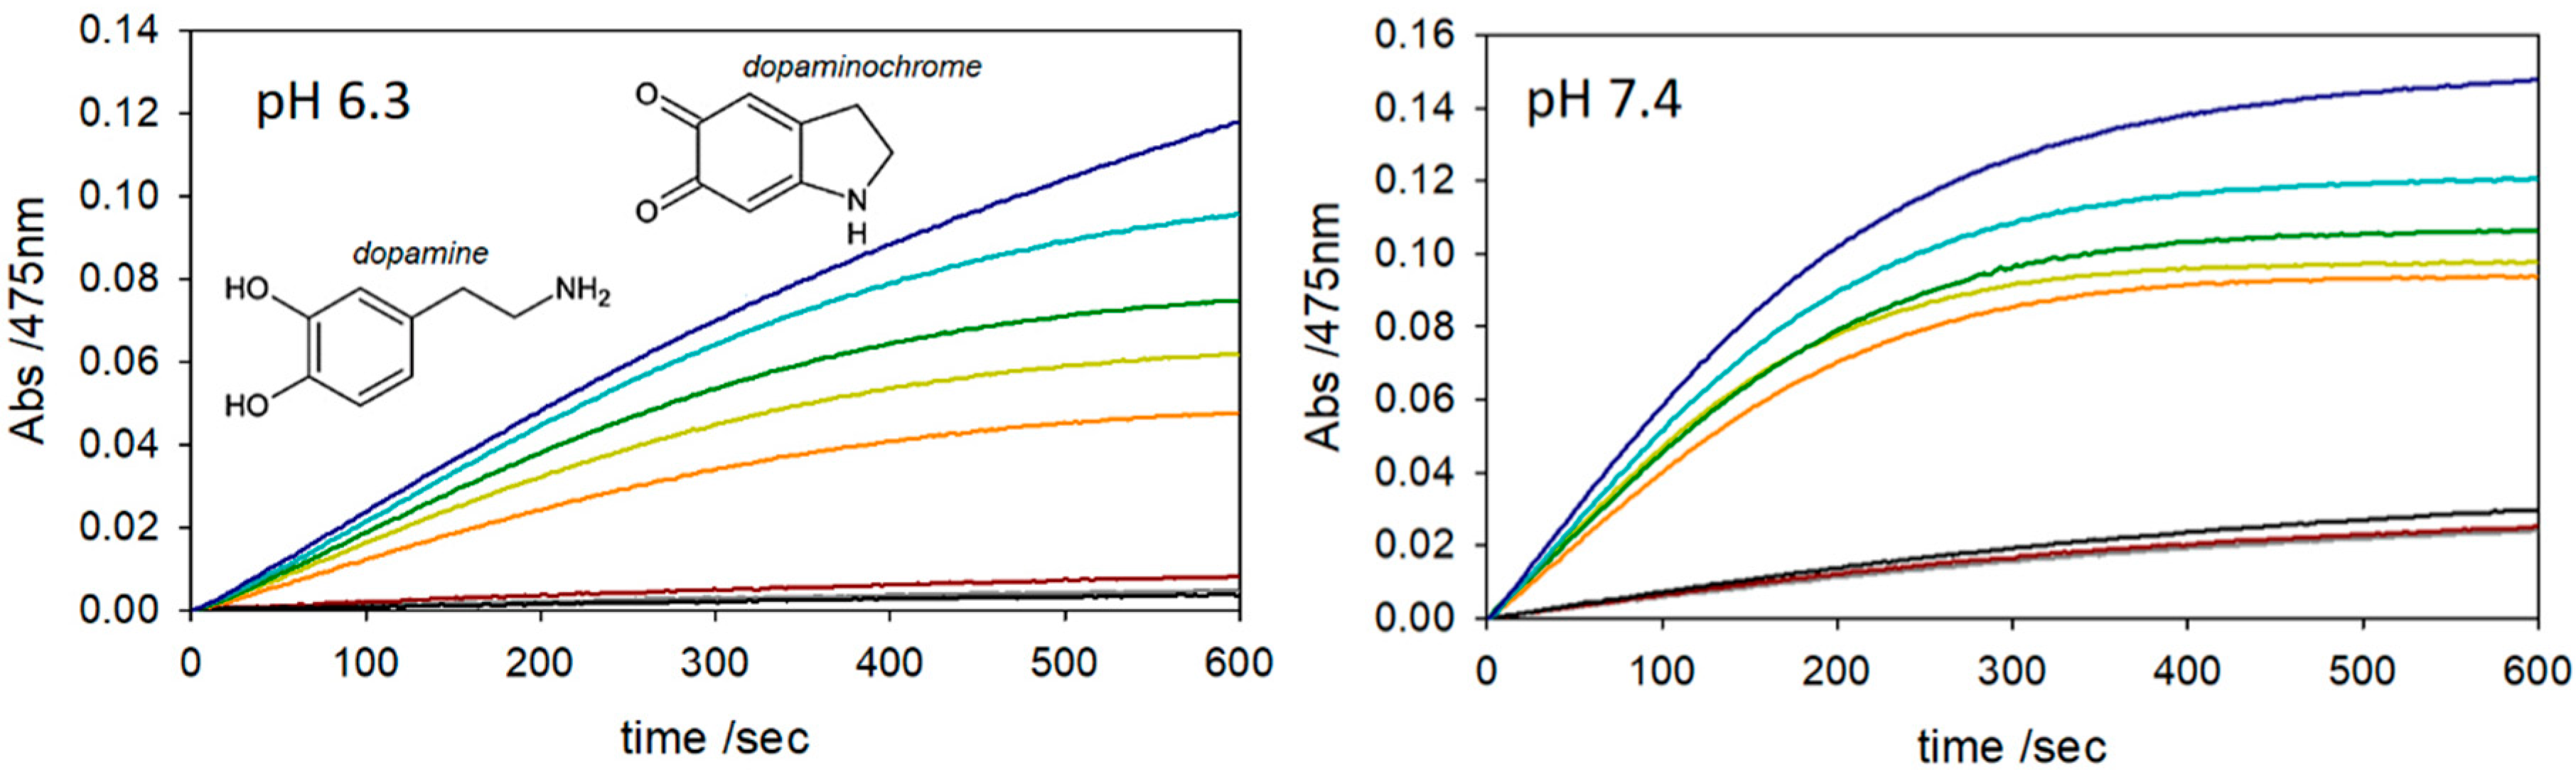
3.3. Kinetics of Dopamine (DA) Oxidation

The catalytic oxidation of DA by a hemin-hydrogen peroxide mixture was studied at 37 °C in 50 mM phosphate solution at pH 7.4 or 6.3. DA (3 mm) oxidation was initiated by the addition of hemin (3 µM), H2O2 (2.5 mM) and amyloid-β fragments 1–16 and 1–40 (0–200 µM). Each mixture containing hemin and buffer solution was equilibrated at 37 °C for 5 min before the addition of the substrate and peptide; hydrogen peroxide was added to the reaction solution as the last reagent. The reactions were followed via the development of the optical band of dopaminochrome at 470 nm (ε470 = 3300 M−1 cm−1) [43]. Reaction rates in Δ(absorbance/s) units were calculated from the slope of the trace in the initial 30 s, with the first few seconds discarded to allow stabilization of the readings, and were then converted into the observed kinetic constant (s−1) by dividing by the product of the catalyst concentration multiplied by the molar extinction coefficient of dopaminochrome.

3.4. Aggregate Formation

The aggregated form of Aβ40 was prepared as follows: a stock solution of Aβ40 was prepared by dissolving Aβ40 in DMSO (ca. 700 µM). The mixture was sonicated and vortex mixed until the peptide was solubilized. This solution was diluted with 20 mM phosphate buffer solution (pH 7.5), to give a final concentration of <2% DMSO, and incubated at 37 °C for 7 days. The formation of insoluble aggregate species was observed, as seen by the appearance of insoluble Aβ40 species. The mixed soluble and insoluble Aβ40 aggregate solution was split into Eppendorf tubes and centrifuged down. The supernatant was decanted and the solid was washed three times with Milli Q water (1 mL) to remove any salt and DMSO. The aggregate was resuspended in a UV-vis vial and utilized for the peroxidase activity studies. Two sample concentrations were prepared by varying the level of dilution.

3.5. Aβ16 Modification in the presence of Hydrogen Peroxide and Hemin by LC-MS

Competitive peptide modification was studied using HPLC-ESI/MS. Samples were prepared by mixing hemin (6 μM), H2O2 (1 mM), Aβ16 (30 μM), and DA (3 mM) in phosphate buffer solution (50 mM) pH 7.4 and incubating at 37 °C. HPLC-ESI/MS analysis were performed at different reaction times. LC-MS data were obtained by using a LCQ ADV MAX ion-trap mass spectrometer. The elution of Aβ16 was carried out by using 0.1% HCOOH in distilled water (solvent A) and 0.1% HCOOH in acetonitrile (solvent B), with a flow rate of 0.2 mL/ min. The solvent gradient started with 98% solvent A for 5 min followed by a linear gradient from 98 to 55% A over 65 min.

4. Conclusions

In conclusion, we have demonstrated that the amyloid peptide Aβ40 displays an environmental dependence on the dynamic equilibrium between high-spin five-coordinate hemin-Aβ40 and low-spin six-coordinate hemin(Aβ40)2 species and that this affects the peroxidase activity of these species. Hemin was also shown to disrupt Aβ40 aggregated structures and display enhanced peroxidase activity in the presence of Aβ40 aggregates versus hemin alone. This work thus sets the stage for understanding in greater detail the role of aberrant metal-ions (e.g., Fe, Cu, and Zn) in relationship to both full length and smaller hydrolyzed Aβ peptides found in Alzheimer’s disease brains and the role of the associated complexes in enhancing reactive oxygen (ROS) and nitrogen species (RNS) that are considered causal in CNS neurodegeneration [54]. Furthermore, within the context of this and related studies, the enhanced peroxidase activity of hemin-peptide constructs are counterproductive to normal healthy activity, wherein cells maintain an array of corrective mechanisms to prevent cellular and organismal death. New studies designed to understand the specific processes resulting in these phenomena (i.e., the release of amyloid beta peptides and dysregulation of hemin pathways resulting in hemin-amyloid beta species) may uncover key processes related to the origins of Alzheimer’s and related neurodegenerative diseases.

Supplementary Materials

The following are available online. Figure S1. Hemin-Ab40 spectroscopic titrations carried out in 5 mM phosphate buffer solution (left) and 50 mM phosphate buffer solution (right), Figure S2. Hemin-Ab40 spectroscopic titrations carried out at pH 6.3 (left) and 6.89 (right) phosphate buffer solution (5 mM), Figure S3. Hemin-Ab40 spectroscopic titrations carried out at (left) room temperature and (right) 37 °C in 5 mM phosphate buffer solution, Figure S4. Temperature dependent reversibility of the hemin-Ab40 complex formation as inferred from UV-vis spectroscopic studies in 5 mM phosphate buffer solution, Figure S5. Reactivity (ABTS oxidation) of the Ab40 aggregate at pH 6.3 (red) versus pH 7.4 (grey) phosphate buffer solution (50 mM) as determined by monitoring the absorption intensity at 660 nm as a function of time, Figure S6. Reactivity (ABTS oxidation) of the Ab40 aggregate (red) versus diluted aggregate (grey) and hemin (black) as determined by monitoring the absorption intensity at 660 nm as a function of time in pH 7.4 phosphate buffer solution (50 mM), Figure S7. (top) Hemin uptake within Ab40 aggregates at pH 6.3 (red) and 7.4 (grey) phosphate buffer solution (50 mM) at 660 nm and (bottom) UV-vis traces following the change absorption within the Ab40 aggregate as a function of time starting at t = 0 (black) and ending at t = 900 s (purple), Figure S8. (Left) Kinetic profile of DA oxidation with time in 50 mM phosphate buffer solution at pH 7.5 and 37 °C in presence of hemin (2 μM), hydrogen peroxide (2.5 mM), Ab16 (10 μM), and varying concentration of DA (0.2 mM, blue trace; 0.5 mM, brown; 1 mM, green; 2 mM, orange and 3 mM, light green) as determined by monitoring the absorption intensity at 475 nm as a function of time. (Right) Dependence of the reaction rate of dopaminochrome formation on the concentration of DA, Figure S9. Kinetic profile of ABTS (3 mM) oxidation with time in 50 mM phosphate buffer solution at pH 7.4 and 37 °C in presence of hydrogen peroxide (2.5 mM) (brown trace) and hemin (2 μM, orange) and upon the addition of 2 μM (light green), 10 μM (green), 40 μM (light blue) and 200 μM Aβ16 (blue) as determined by monitoring the absorption intensity at 660 nm as a function of time, Figure S10. Kinetic profile of ABTS (3 mM) oxidation with time in 50 mM phosphate buffer solution at pH 6.3 and 37 °C in presence of hydrogen peroxide (2.5 mM) (brown trace) and hemin (2 μM, orange) and upon the addition of 2 μM (light green), 10 μM (green), 40 μM (light blue) and 200 μM Aβ16 (blue) as determined by monitoring the absorption intensity at 660 nm as a function of time, Figure S11. Kinetic profile of DA (3 mM) oxidation with time in 50 mM phosphate buffer solution at pH 7.4 and 37 °C in presence of hemin (2 μM) (brown trace) or hydrogen peroxide (2.5 mM, black), after the addition of both hemin and peroxide (orange) and upon the addition of Aβ16 at 2 μM (light green), 10 μM (green), 40 μM (light blue) and 200 μM (blue) as determined by monitoring the absorption intensity at 475 nm as a function of time. The autoxidation trace is shown as grey curve, Figure S12. Kinetic profile of DA (3 mM) oxidation with time in 50 mM phosphate buffer solution at pH 6.3 and 37 °C in presence of hemin (2 μM) (brown trace) or hydrogen peroxide (2.5 mM, black), after the addition of both hemin and peroxide (orange) and upon the addition of Aβ16 2 μM (light green), 10 μM (green), 40 μM (light blue) and 200 μM (blue) as determined by monitoring the absorption intensity at 475 nm as a function of time. The autoxidation trace is shown as grey curve, Figure S13. Kinetic profile of DA (3 mM) oxidation with time in 50 mM phosphate buffer solution at pH 6.3 and 37 °C in presence of hemin-glycyl-L-histidine methyl ester (hemin-GH) (2 μM) (brown trace) or hydrogen peroxide (2.5 mM, black), after the addition of both hemin-GH and hydrogen peroxide (orange) and upon the addition of 2 μM (light green), 10 μM (green), 40 μM (light blue) and 200 μM Aβ16 (blue) as determined by monitoring the absorption intensity at 475 nm as a function of time. The autoxidation trace is shown as a grey curve, Figure S14. HPLC-MS elution profiles of Aβ16 (30 μM) in phosphate buffer solution (50 mM) pH 7.4 in the presence of hemin (6 μM), H2O2 (1 mM) and DA (3 mM) after 30 min (left panel) and 120 min (right panel) reaction time at 37 °C; Table S1. Kinetic constants for the oxidation of DA (l = 470 nm; e = 3300 M-1cm-1)d by hydrogen peroxide and hemin-glycyl-L-histidine methyl ester (hemin-GH) with varying amounts of Ab16 according to the following conditions: hemin-GH (2 μM), DA (3 mM), H2O2 (2.5 mM) in pH 6.3 phosphate buffer solution (50 mM) at 37 °C. The calculated variability for all cases was equal to or less than 0.001 s-1 as based on at least 2 repeat measurements, Table S2. Modification of Aβ16 peptide as inferred from HPLC-MS analysis observed upon reaction of hemin (6 μM), Aβ16 (30 μM), hydrogen peroxide (1 mM) and DA (3 mM) in pH 7.4 phosphate buffer solution (50 mM) at 37 °C, Table S3. Modification of Aβ16 peptide as inferred from HPLC-MS analysis upon reaction of hemin (6 μM), Aβ16 (30 μM) and hydrogen peroxide (1 mM) in phosphate buffer solution (50 mM) pH 7.4 at 37 °C; Scheme S1. Proposed equilibria between hemin, dimeric [hemin]2, dimeric [hemin]2-Aβ40 (2:1), hemin-Aβ40 (1:1), and hemin(Aβ40)2 (1:2), Scheme S2. Proposed reaction mechanism explaining the observed peroxidase-like reactivity of hemin-Aβ40 complexes. K1 and K2 are the equilibrium constants for heme binding to one and two equivalents of Ab40 or Ab16, respectively, and SH is a generic substrate. Path a, path b, and path c indicate the reaction mechanism of H2O2 with free hemin, [hemin(Ab)] complex and [hemin(Ab)2] complex, respectively.

Author Contributions

Conceptualization J.T.B.II, G.D.T., S.D., E.M. and L.C.; methodology C.B., J.F.R., J.T.B.II, H.D.R., S.B., and G.D.T.; formal analysis, S.B., S.D. and E.M.; writing—original draft preparation, C.B., J.T.B.II and S.D.; writing—review and editing, E.M., J.L.S., and L.C.; funding acquisition, L.C. and J.L.S. All authors have read and agreed to the published version of the manuscript.

Funding

Italian Ministry of Education, University and Research (MIUR) for a Research Project of National Interest (PRIN) 2015, Prot. 2015T778JW; National Institutes of Health (grant no. RO1 68682) (in part); Robert A. Welch Foundation (F-0018); Danish Council for Independent Research, Technology and Production Sciences (FTP, Project 5054-00052); Global Research Fellowship at The University of Pavia funded by The University of Texas at Austin.

Acknowledgments

L.C., S.D., C.B., and E.M (Pavia, Italy) would like to thank the Italian Ministry of Education, University and Research (MIUR) for a Research Project of National Interest (PRIN) 2015, Prot. 2015T778JW. The work in UT Austin (USA) was supported by the National Institutes of Health (grant no. RO1 68682) and the Robert A. Welch Foundation (F-0018) to J.L.S. The work in University of Southern Denmark (Denmark) was supported by Danish Council for Independent Research, Technology and Production Sciences (FTP, Project 5054-00052 to S.F.B.). J.T.B.II would like to thank The University of Texas at Austin for a Global Research Fellowship at The University of Pavia, Italy.

Conflicts of Interest

There are no conflicts to declare.

References

  1. Gitler, D.; Dhillon, P.; Shorter, J. Neurodegenerative disease: Models, mechanisms, and a new hope. Dis. Model Mech. 2017, 10, 499–502. [Google Scholar] [CrossRef] [PubMed] [Green Version]
  2. Wyss-Coray, T. Ageing, neurodegeneration and brain rejuvenation. Nature 2016, 539, 180–186. [Google Scholar] [CrossRef] [PubMed]
  3. Pievani, M.; Filippini, N.; van den Heuvel, P.M.; Cappa, S.F.; Frisoni, G.B. Brain connectivity in neurodegenerative diseases--from phenotype to proteinopathy. Nat. Rev. Neurol. 2014, 10, 620–633. [Google Scholar] [CrossRef] [PubMed]
  4. Gaeta, A.; Hider, R.C. The crucial role of metal ions in neurodegeneration: The basis for a promising therapeutic strategy. Br. J. Pharmacol. 2005, 146, 1041–1059. [Google Scholar] [CrossRef] [Green Version]
  5. Aizenman, E.; Mastroberardino, P.G. Metals and neurodegeneration. Neurobiol. Dis. 2015, 81, 1–3. [Google Scholar] [CrossRef] [Green Version]
  6. Cicero, E.; Mostile, G.; Vasta, R.; Rapisarda, V.; Signorelli, S.S.; Ferrante, M.; Zappia, M.; Nicoletti, A. Metals and neurodegenerative diseases. A systematic review. Environ. Res. 2017, 159, 82–94. [Google Scholar] [CrossRef]
  7. Smith, G.; Cappai, R.; Barnahm, K.J. The redox chemistry of the Alzheimer’s disease amyloid beta peptide. Biochim. Biophys. Acta 2007, 1768, 1976–1990. [Google Scholar] [CrossRef] [Green Version]
  8. Arimon, M.; Takeda, S.; Post, K.L.; Svirsky, S.; Hyman, B.T.; Berezovska, O. Oxidative stress and lipid peroxidation are upstream of amyloid pathology. Neurobiol. Dis. 2015, 84, 109–119. [Google Scholar] [CrossRef] [Green Version]
  9. Khodarahmi, R.; Ashrafi-Kooshk, M.R. Is there correlation between Aβ-heme peroxidase activity and the peptide aggregation state? A literature review combined with hypothesis. Int. J. Biol. Macromol. 2017, 100, 18–36. [Google Scholar] [CrossRef]
  10. Pramanik, D.; Ghosh, C.; Mukherjee, S.; Dey, S.G. Interaction of amyloid β peptides with redox active heme cofactor: Relevance to Alzheimer’s disease. Coord. Chem. Rev. 2013, 257, 81–92. [Google Scholar] [CrossRef]
  11. Chuang, J.-Y.; Lee, C.-W.; Shih, Y.-H.; Yang, T.; Yu, L.; Kuo, Y.-M. Interactions between amyloid-β and hemoglobin: Implications for amyloid plaque formation in Alzheimer’s disease. PLoS ONE 2012, 7, e33120. [Google Scholar] [CrossRef] [PubMed] [Green Version]
  12. Bao, Q.; Luo, Y.; Li, W.; Sun, X.; Zhu, C.; Li, P.; Huang, Z.-X.; Tan, X. The mechanism for heme to prevent Aβ1–40 aggregation and its cytotoxicity. J. Biol. Inorg. Chem. 2011, 16, 809–816. [Google Scholar] [CrossRef] [PubMed]
  13. Thiabaud, G.; Pizzocaro, S.; Garcia-Serres, R.; Latour, J.-M.; Monzani, E.; Casella, L. Heme binding induces dimerization and nitration of truncated β-amyloid peptide Aβ16 under oxidative stress. Angew. Chem. Int. Ed. 2013, 52, 8041–8044. [Google Scholar] [CrossRef] [PubMed]
  14. Atamna, H.; Boyle, K. Amyloid-β peptide binds with heme to form a peroxidase: Relationship to the cytopathologies of Alzheimer’s disease. Proc. Natl. Acad. Sci. USA 2006, 103, 3381–3386. [Google Scholar] [CrossRef] [PubMed] [Green Version]
  15. Atamna, H.; Frey, W.H., II. A role for heme in Alzheimer’s disease: Heme binds amyloid β and has altered metabolism. Proc. Natl. Acad. Sci. USA 2004, 101, 11153–11158. [Google Scholar] [CrossRef] [Green Version]
  16. Atamna, H.; Frey, W.H., II; Ko, N. Human and rodent amyloid-beta peptides differentially bind heme: Relevance to the human susceptibility to Alzheimer’s disease. Arc. Biochem. Biophys. 2009, 487, 59–65. [Google Scholar] [CrossRef]
  17. Yuan, C.; Yu, L.; Yang, Z.; Deng, Q.; Huang, Y.; Li, H.; Gao, Z. Amyloid beta-heme peroxidase promoted protein nitrotyrosination: Relevance to widespread protein nitration in Alzheimer’s disease. J. Biol. Inorg. Chem. 2012, 17, 197–207. [Google Scholar] [CrossRef]
  18. Ghosh, C.; Mukherjee, S.; Seal, M.; Dey, S.G. Peroxidase to cytochrome b type transition in the active site of heme-bound amyloid β peptides relevant to Alzheimer’s Disease. Inorg. Chem. 2016, 55, 1748–1757. [Google Scholar] [CrossRef]
  19. Seal, M.; Ghosh, C.; Basu, O.; Dey, S.G. Cytochrome c peroxidase activity of heme bound amyloid β peptides. J. Biol. Inorg. Chem. 2016, 21, 683–690. [Google Scholar] [CrossRef]
  20. Pramanik, D.; Dey, S.G. Active site environment of heme-bound amyloid β peptide associated with Alzheimer’s Disease. J. Am. Chem. Soc. 2011, 133, 81–87. [Google Scholar] [CrossRef]
  21. Chiziane, E.; Telemann, H.; Krueger, M.; Adler, J.; Arnhold, J.; Alia, A.; Flemmig, J. Free heme and Amyloid-β: A fatal liaison in Alzheimer’s Disease. J. Alzheimer’s Dis. 2018, 61, 963–984. [Google Scholar] [CrossRef] [PubMed]
  22. Lu, N.; Li, J.; Tian, R.; Peng, Y.-Y. Key roles of Arg(5), Tyr(10) and His residues in Aβ-heme peroxidase: Relevance to Alzheimer’s Disease. Biochem. Biophys. Res. Commun. 2014, 452, 676–681. [Google Scholar] [CrossRef]
  23. Wißbrock, A.; Kuhl, T.; Silbermann, K.; Becker, A.J.; Ohlenschlager, O.; Imhof, D. Synthesis and evaluation of amyloid β derived and amyloid β independent enhancers of the peroxidase-like activity of heme. J. Med. Chem. 2017, 60, 373–385. [Google Scholar] [CrossRef] [PubMed]
  24. Kuhl, T.; Imhof, D. Regulatory FeII/III Heme: The reconstruction of a molecule’s biography. ChemBioChem 2014, 15, 2024–2035. [Google Scholar] [CrossRef] [PubMed]
  25. Gregory, C.; Halliday, G.M. What is the dominant Abeta species in human brain tissue? A review. Neuro. Res. 2005, 7, 29–41. [Google Scholar] [CrossRef]
  26. Chesler, M. Regulation and Modulation of pH in the Brain. Physiol. Rev. 2003, 83, 1183–1221. [Google Scholar] [CrossRef]
  27. Steen, K.H.; Steen, A.E.; Reeh, P.W. A dominant role of acid pH in inflammatory excitation and sensitization of nociceptors in rat skin, in vitro. J. Neurosci. 1995, 15, 3982–3989. [Google Scholar] [CrossRef]
  28. Johnson, V.E.; Stewart, W.; Smith, D.H. Traumatic brain injury and amyloid-β pathology: A link to Alzheimer’s disease? Nat. Rev. Neurosci. 2010, 11, 361–370. [Google Scholar] [CrossRef] [Green Version]
  29. Zhang, F.; Jiang, L. Neuroinflammation in Alzheimer’s disease. Neuropsychiatr. Dis. Treat. 2015, 11, 243–256. [Google Scholar] [CrossRef] [Green Version]
  30. Hickman, S.E.; Allison, E.K.; El Khoury, J. Microglial dysfunction and defective β-Amyloid clearance pathways in aging Alzheimer’s Disease mice. J. Neurosci. 2008, 28, 8354–8360. [Google Scholar] [CrossRef]
  31. De Villiers, K.A.; Kaschula, C.H.; Egan, T.J.; Marques, H.M. Speciation and structure of ferriprotoporphyrin IX in aqueous solution: Spectroscopic and diffusion measurements demonstrate dimerization, but not mu-oxo dimer formation. J. Biol. Inorg. Chem. 2007, 12, 101–117. [Google Scholar] [CrossRef] [PubMed]
  32. Asher, C.; De Villiers, K.A.; Egan, T.J. Speciation of ferriprotoporphyrin IX in aqueous and mixed aqueous solution is controlled by solvent identity, pH, and salt concentration. Inorg. Chem. 2009, 48, 7994–8003. [Google Scholar] [CrossRef] [PubMed]
  33. Huffman, D.L.; Rosenblatt, M.M.; Suslick, K.S. Synthetic heme-peptide complexes. J. Am. Chem. Soc. 1998, 120, 6183–6184. [Google Scholar] [CrossRef]
  34. Pirota, V.; Monzani, E.; Dell’Acqua, S.; Casella, L. Interactions between heme and tau-derived R1 peptides: Binding and oxidative reactivity. Dalton Trans. 2016, 45, 14343–14351. [Google Scholar] [CrossRef]
  35. Zhou, Y.; Wang, J.; Liu, L.; Wang, R.; La, X.; Xu, M. Interaction between amyloid-β peptide and heme probed by electrochemistry and atomic force microscopy. ACS Chem. Neurosci. 2013, 4, 535–539. [Google Scholar] [CrossRef] [PubMed] [Green Version]
  36. Adams, P.A. The peroxidasic activity of the haem octapeptide microperoxidase-8 (MP-8): The kinetic mechanism of the catalytic reduction of H2O2 by MP-8 using 2,2′-azinobis-(3-ethylbenzothiazoline-6-sulphonate)(ABTS) as reducing substrate. J. Chem. Soc. Perkin Trans 2 1990, 1407–1414. [Google Scholar] [CrossRef]
  37. Sengupta, K.; Chatterjee, S.; Pramanik, D.; Dey, S.G.; Dey, A. Self-assembly of stable oligomeric and fibrillar aggregates of Aβ peptides relevant to Alzheimer’s disease: Morphology dependent Cu/heme toxicity and inhibition of PROS generation. Dalton Trans. 2014, 43, 13377–13383. [Google Scholar] [CrossRef]
  38. Resende, R.; Ferreiro, E.; Pereira, C.; Resende de Oliveira, C. Neurotoxic effect of oligomeric and fibrillar species of amyloid-beta peptide 1-42: Involvement of endoplasmic reticulum calcium release in oligomer-induced cell death. Neuroscience 2008, 155, 725–737. [Google Scholar] [CrossRef]
  39. Syme, C.D.; Nadal, R.C.; Rigby, S.E.J.; Viles, J.H. Copper binding to the amyloid-β (Aβ) peptide associated with Alzheimer’s Disease. Folding, coordination geometry, pH dependence, stoichiometry, and affinity of Aβ-(1–28): Insights from range of complementary spectroscopic techniques. J. Biol. Chem. 2004, 279, 18169–18177. [Google Scholar] [CrossRef] [Green Version]
  40. Meiser, J.; Weindl, D.; Hiller, K. Complexity of dopamine metabolism. Cell Commun. Signal. 2013, 11, 34. [Google Scholar] [CrossRef] [Green Version]
  41. Monzani, E.; Nicolis, S.; Dell’Acqua, S.; Cappucciati, A.; Bacchella, C.; Zucca, F.A.; Mosharov, E.V.; Sulzer, D.; Zecca, L.; Casella, L. Dopamine, oxidative stress and protein-quinone modifications in Parkinson’s and other neurodegenerative diseases. Angew. Chem. Int. Ed. 2019, 58, 6512–6527. [Google Scholar] [CrossRef] [PubMed]
  42. Herlinger, E.; Jameson, R.F.; Linert, W. Spontaneous autoxidation of dopamine. J. Chem. Soc. Perkin Trans. 2 1995, 259–263. [Google Scholar] [CrossRef]
  43. Ros, J.R.; Rodriguez-Lopez, J.N.; Garcia-Canovas, F. Tyrosinase: Kinetic analysis of the transient phase and the steady state. Biochim. Biophys. Acta Protein Struct. Mol. Enzymol. 1994, 1204, 33–42. [Google Scholar] [CrossRef]
  44. Mohammad-Shiri, H.; Ghaemi, M.; Riahi, S.; Akbari-Sehat, A. Computational and electrochemical studies on the redox reaction of dopamine in aqueous solution. Int. J. Electrochem. Sci. 2011, 6, 317–336. [Google Scholar]
  45. Dunford, B. Peroxidases in Chemistry and Biology; Everse, K.E., Grisham, M.B., Eds.; CRC: Boca Raton, FL, USA, 1991; Volume 2, p. 1. [Google Scholar]
  46. Pal, I.; Nath, A.K.; Roy, M.; Seal, M.; Ghosh, C.; Dey, A.; Dey, S.G. Formation of compound I in heme bound Aβ-peptides relevant to Alzheimer’s disease. Chem. Sci. 2019, 10, 8405–8410. [Google Scholar] [CrossRef] [PubMed]
  47. Casella, L.; Monzani, E.; Fantucci, P.; Gullotti, M.; De Gioia, L.; Strini, A.; Chillemi, F. Axial imidazole distortion effects on the catalytic and binding properties of chelated deuterohemin complexes. Inorg. Chem. 1996, 35, 439–444. [Google Scholar] [CrossRef]
  48. Pirota, V.; Dell’Acqua, S.; Monzani, E.; Nicolis, S.; Casella, L. Copper-Aβ peptides and oxidation of catecholic substrates: Reactivity and endogenous peptide damage. Chem. Eur. J. 2016, 22, 16964. [Google Scholar] [CrossRef]
  49. Cassagnes, L.-E.; Herve, V.; Nepveu, F.; Hureau, C.; Faller, P.; Collin, F. The catalytically active copper-amyloid-Beta state: Coordination site responsible for reactive oxygen species production. Angew. Chem. Int. Ed. 2013, 52, 11110–11113. [Google Scholar] [CrossRef]
  50. Choi, J.W.; Kim, H.Y.; Jeon, M.J.; Kim, D.J.; Kim, Y.S. Efficient access to highly pure β-amyloid peptide by optimized solid-phase synthesis. Amyloid 2012, 19, 133–137. [Google Scholar] [CrossRef]
  51. Mach, H.; Middaugh, C.R.; Lewis, R.V. Statistical determination of the average values of the extinction coefficients of tryptophan and tyrosine in native proteins. Anal. Biochem. 1992, 200, 74–80. [Google Scholar] [CrossRef]
  52. Fuhrhop, J.H.; Smith, K.M. Laboratory Methods in Porphyrins and Metalloporphyrins Research; Elsevier: Amsterdam, The Netherlands, 1977. [Google Scholar]
  53. Gans, P.; Sabatini, A.; Vacca, A. Investigation of equilibria in solution. Determination of equilibrium constants with the HYPERQUAD suite of programs. Talanta 1996, 43, 1739–1753. [Google Scholar] [CrossRef]
  54. Wildburger, N.C.; Esparza, T.J.; LeDuc, R.D.; Fellers, R.T.; Thomas, P.M.; Cairns, N.J.; Kelleher, N.L.; Bateman, R.J.; Brody, D.L. Diversity of amyloid-beta proteoforms in the Alzheimer’s Disease brain. Sci. Rep. 2017, 7, 9520. [Google Scholar] [CrossRef] [PubMed] [Green Version]
Figure 1. UV-vis spectrum of hemin (5 μM) upon addition of Aβ40 (0–100 equiv; black to pink) in phosphate buffer (5 mM, pH 7.4) at 23 °C. The insert shows changes to the hemin Soret band.
Molecules 25 05044 g001
Figure 2. Kinetic profile of ABTS (3 mM) oxidation (λ = 660 nm; ε = 14700 M−1 cm−1) [36] with time (0 to 600 s) in phosphate buffer (50 mM, 37 °C) at (left) pH 6.3 and (right) pH 7.4 as studied in the presence of 2.5 mM H2O2 (brown) and 2 μM hemin (orange) upon the addition of 2 μM (light green), 10 μM (green), 40 μM (light blue), and 200 μM (blue) Aβ40.
Molecules 25 05044 g002
Figure 3. Time-dependent circular dichroism (left) of Aβ40 aggregates (black) and after addition of hemin at 0.5 h (blue) and 24 h (purple). SEM analysis (right) of the same (A) Aβ40 (40 μM) aggregates at pH 7.4 in PBS, (B) Aβ40 (40 μM) aggregates incubated with hemin (5 μM) for 24 h, and (C) freshly dissolved Aβ40.
Molecules 25 05044 g003
Figure 4. Kinetic profile of DA (3 mM) oxidation (λ = 470 nm; ε = 3300 M−1 cm−1) [43] with time (0 to 600 s) in phosphate buffer (50 mM, 37 °C) at (left) pH 6.3 and (right) pH 7.4 in the presence of hemin (2 μM) (brown trace) or hydrogen peroxide (2.5 mM, black). Traces were recorded after the addition of both hemin and hydrogen peroxide (orange) and upon the addition of 2 µM (light green), 10 µM (green), 40 µM (light blue) and 200 µM Aβ40 (blue). The autoxidation trace is shown as a grey line.
Molecules 25 05044 g004
Table 1. Equilibrium constants for hemin binding to Aβ40.
Complex alog K1log K2 blog β2
[hemin(Aβ40)2]6.08 ± 0.024.7710.84 ± 0.02
[hemin(Aβ40)2] c5.60 ± 0.014.209.80 ± 0.01
[hemin(Aβ40)2] d4.76 ± 0.034.309.05 ± 0.01
[hemin(Aβ40)2] e5.30 ± 0.024.479.77 ± 0.04
[hemin(Aβ40)2] f7.30 ± 0.024.0211.32 ± 0.16
[hemin(Aβ16)2] g4.80 ± 0.024.038.82 ± 0.02
a Standard conditions: hemin (5 μM) in pH 7.4 phosphate buffer (5 mM) at 23 °C. b Obtained as the difference between log β2 and log K1. c pH 6.89. d pH 6.3. e 50 mM phosphate buffer pH 7.4. f 37 °C. g 50 mM PBS, pH 7.5, 27 °C; [13].
Table 2. Kinetic constants for the oxidation of ABTS (λ = 660 nm; ε = 14,700 M−1 cm−1) [36] by H2O2 (2.5 mM) and hemin (2 μM) at 37 °C in the presence of varying amounts of Aβ40 or Aβ16 at pH 7.4 or 6.3. The calculated variability based on 2 independent measurements was equal to or less than 0.001 s−1.
SpeciespH 7.4−Aβ16 kobs (s−1)pH 7.4−Aβ40 kobs (s−1)pH 6.3−Aβ16 kobs (s−1)pH 6.3−Aβ40 kobs (s−1)
Hemin0.0130.0130.0160.016
Aβ (1 equiv.)0.0220.0180.0340.027
Aβ (5 equiv.)0.0220.0210.0420.033
Aβ (20 equiv.)0.0320.0270.0530.038
Aβ (100 equiv.)0.0540.0320.0920.049
Table 3. Kinetic constants for the oxidation of DA (3 mM, λ = 470 nm; ε = 3300 M−1 cm−1) [43] by H2O2 (2.5 mM) and hemin (2 μM) at 37 °C with varying amounts of Aβ40 or Aβ16 in phosphate buffer (50 mM) at pH 7.4 or 6.3. The calculated variability, based on at least 2 independent measurements, was in all cases ≤ 0.001 s−1.
SpeciespH 7.4−Aβ16 kobs (s−1)pH 7.4−Aβ40 kobs (s−1)pH 6.3−Aβ16 kobs (s−1)pH 6.3−Aβ40 kobs (s−1)
Hemin0.0530.0520.0180.018
Aβ (1 equiv.)0.0490.0580.0240.023
Aβ (5 equiv.)0.0560.0600.0230.027
Aβ (20 equiv.)0.0770.0680.0370.031
Aβ (100 equiv.)0.1710.0760.0760.034
Sample Availability: Samples of the compounds are not available from the authors.
Publisher’s Note: MDPI stays neutral with regard to jurisdictional claims in published maps and institutional affiliations.

