Liquid Chromatography-Tandem Mass Spectrometry for the Simultaneous Analysis of 353 Pesticides in the Edible Insect Tenebrio molitor Larvae (Mealworms)

 , and
, and
Abstract
:1. Introduction
2. Results and Discussion
2.1. Optimization of Sample Preparation
2.1.1. Determination of the Number of Acetonitrile-Hexane Partitioning Rounds
2.1.2. Comparison of Sample Extract Conditions
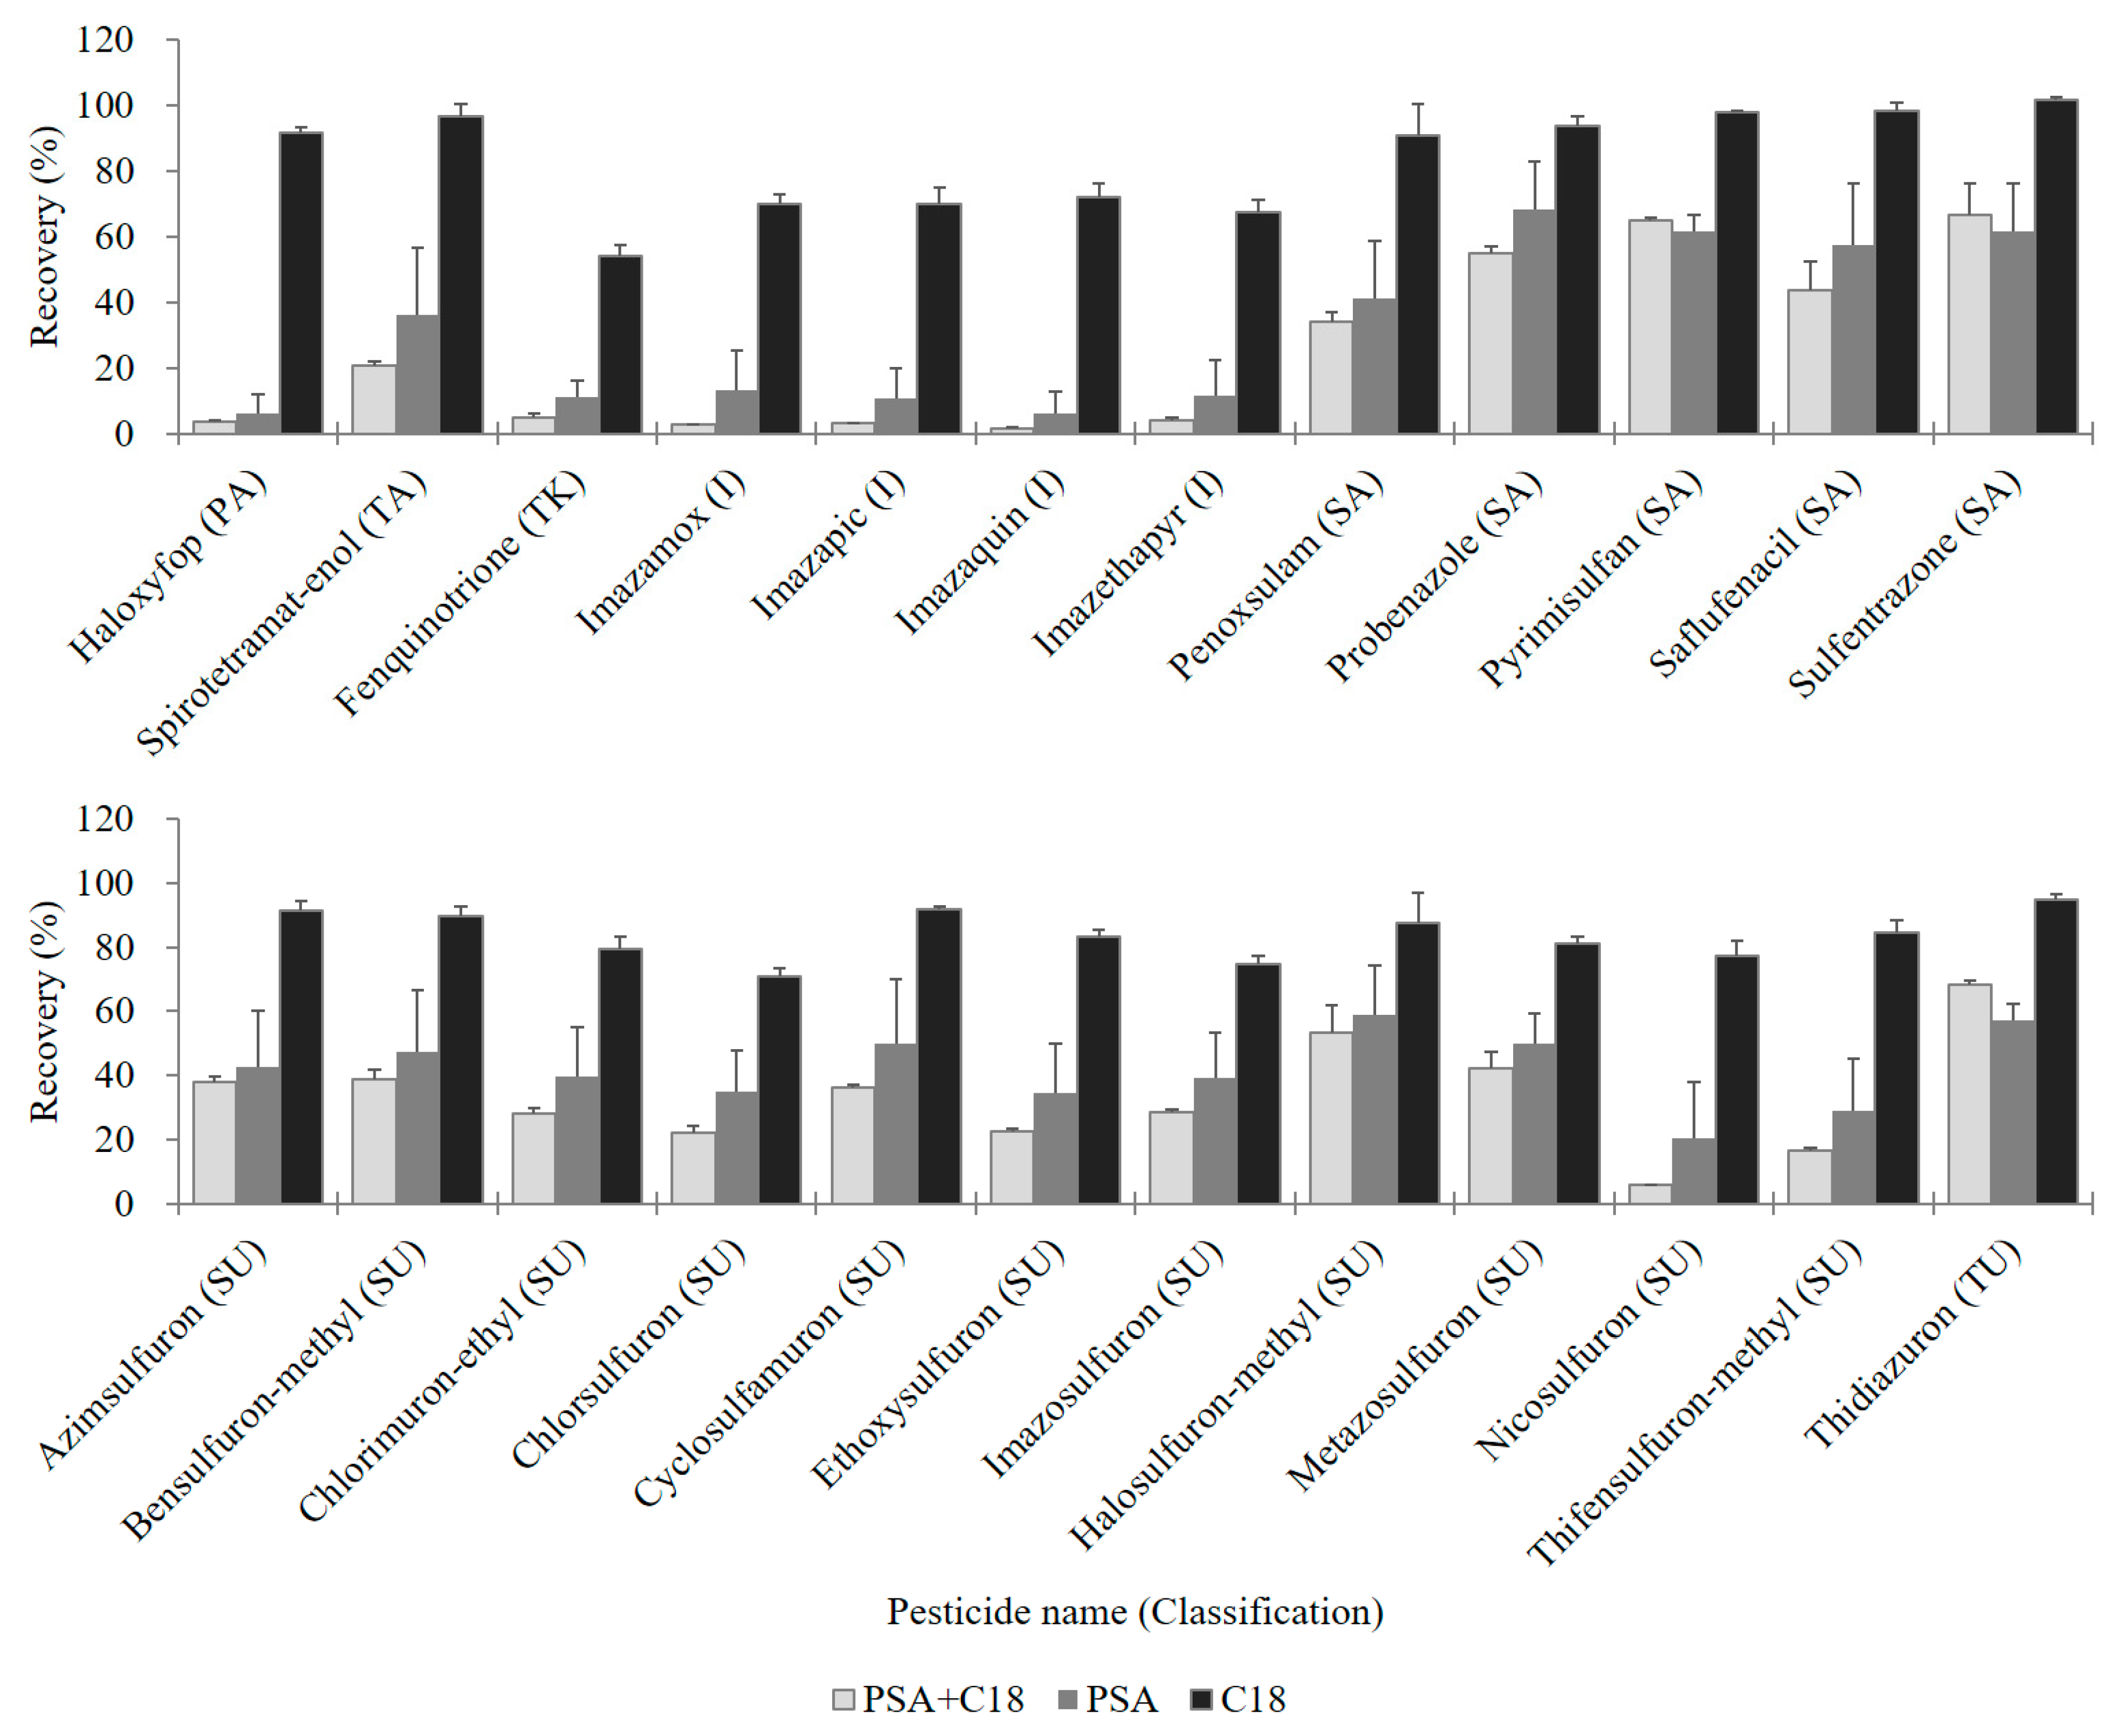
2.1.3. Comparison of Sample Cleanup with dSPE Sorbents
2.2. Validation of the Analytical Method
2.2.1. LOQ
2.2.2. Linearity of Calibration
2.2.3. Recovery
2.2.4. Matrix Effect
2.3. Application
3. Materials and Methods
3.1. Reagents
3.2. Mealworm Samples
3.3. Working Solutions and Matrix-Matched Standard Solutions
3.4. LC-MS/MS Instrumental Conditions
3.5. Comparison of Preparation Procedures
3.6. Established Sample Preparation Procedures
3.7. Method Validation and Matrix Effect
4. Conclusions
Supplementary Materials
Author Contributions
Funding
Conflicts of Interest
References
- Henchion, M.; McCarthy, M.; Resconi, V.C.; Troy, D. Meat consumption: Trends and quality matters. Meat Sci. 2014, 98, 561–568. [Google Scholar] [CrossRef] [PubMed] [Green Version]
- Sans, P.; Combris, P. World meat consumption patterns: An overview of the last fifty years (1961–2011). Meat Sci. 2015, 109, 106–111. [Google Scholar] [CrossRef] [PubMed] [Green Version]
- Zhang, W.; Bai, C.; Liu, G. A longer-term forecast on global supply and demand of food products. J. Food Agric. Environ. 2007, 5, 105–110. [Google Scholar]
- Bhat, Z.F.; Kumar, S.; Fayaz, H. In vitro meat production: Challenges and benefits over conventional meat production. J. Integr. Agric. 2015, 14, 241–248. [Google Scholar] [CrossRef]
- van Huis, A.; van Itterbeeck, J.; Klunder, H.; Mertens, E.; Halloran, A.; Muir, G.; Vantomme, P. Edible Insects: Future Prospects for Food and Feed Security; Food and Agriculture Organization of the United Nations: Rome, Italy, 2013. [Google Scholar]
- Hanboonsong, Y.; Jamjanya, T.; Durst, P.B. Six-Legged Livestock: Edible Insect Farming, Collection and Marketing in Thailand; Food and Agriculture Organization of the United Nations: Bangkok, Thailand, 2013. [Google Scholar]
- Han, R.; Shin, J.T.; Kim, J.; Choi, Y.S.; Kim, Y.W. An overview of the South Korean edible insect food industry: Challenges and future pricing/promotion strategies. Entomol. Res. 2017, 47, 141–151. [Google Scholar] [CrossRef]
- Siemianowska, E.; Kosewska, A.; Aljewicz, M.; Skibniewska, K.A.; Polak-Juszczak, L.; Jarocki, A.; Jędras, M. Larvae of mealworm (Tenebrio molitor L.) as European novel food. Agric. Sci. 2013, 4, 287–291. [Google Scholar]
- Imathiu, S. Benefits and food safety concerns associated with consumption of edible insects. NFS J. 2020, 18, 1–11. [Google Scholar] [CrossRef]
- Lv, X.; Liu, C.; Li, Y.; Gao, Y.; Wang, H.; Li, J.; Guo, B. Stereoselectivity in bioaccumulation and excretion of epoxiconazole by mealworm beetle (Tenebrio molitor) larvae. Ecotoxicol. Environ. Saf. 2014, 107, 71–76. [Google Scholar] [CrossRef]
- Houbraken, M.; Spranghers, T.; De Clercq, P.; Cooreman-Algoed, M.; Couchement, T.; De Clercq, G.; Verbeke, S.; Spanoghe, P. Pesticide contamination of Tenebrio molitor (Coleoptera: Tenebrionidae) for human consumption. Food Chem. 2016, 201, 264–269. [Google Scholar] [CrossRef]
- Daisley, B.A.; Pitek, A.P.; Chmiel, J.A.; Gibbons, S.; Chernyshova, A.M.; Al, K.F.; Faragalla, K.M.; Burton, J.P.; Thompson, G.J.; Reid, G. Lactobacillus spp. attenuate antibiotic-induced immune and microbiota dysregulation in honey bees. Commun. Biol. 2020, 3, 534. [Google Scholar] [CrossRef]
- European Commission. EU–Pesticides Database: Regulation (EC) No 396/2005 (Files Updated on 23/07/2020). Available online: https://ec.europa.eu/food/plant/pesticides/eu-pesticides-database/public/?event=homepage&language=EN (accessed on 26 November 2020).
- De Paepe, E.; Wauters, J.; Van Der Borght, M.; Claes, J.; Huysman, S.; Croubels, S.; Vanhaecke, L. Ultra-high-performance liquid chromatography coupled to quadrupole orbitrap high-resolution mass spectrometry for multi-residue screening of pesticides, (veterinary) drugs and mycotoxins in edible insects. Food Chem. 2019, 293, 187–196. [Google Scholar] [CrossRef]
- Kim, L.; Baek, S.; Son, K.; Kim, E.; Noh, H.H.; Kim, D.; Oh, M.-s.; Moon, B.-c.; Ro, J.-H. Optimization of a simplified and effective analytical method of pesticide residues in mealworms (Tenebrio molitor larvae) combined with GC–MS/MS and LC–MS/MS. Molecules 2020, 25, 3518. [Google Scholar] [CrossRef] [PubMed]
- Lee, J.; Shin, Y.; Lee, J.; Lee, J.; Kim, B.J.; Kim, J.-H. Simultaneous analysis of 310 pesticide multiresidues using UHPLC-MS/MS in brown rice, orange, and spinach. Chemosphere 2018, 207, 519–526. [Google Scholar] [CrossRef] [PubMed]
- Jadhav, M.R.; Pudale, A.; Raut, P.; Utture, S.; Ahammed Shabeer, T.P.; Banerjee, K. A unified approach for high-throughput quantitative analysis of the residues of multi-class veterinary drugs and pesticides in bovine milk using LC-MS/MS and GC–MS/MS. Food Chem. 2019, 272, 292–305. [Google Scholar] [CrossRef]
- Zhu, B.; Xu, X.; Luo, J.; Jin, S.; Chen, W.; Liu, Z.; Tian, C. Simultaneous determination of 131 pesticides in tea by on-line GPC-GC–MS/MS using graphitized multi-walled carbon nanotubes as dispersive solid phase extraction sorbent. Food Chem. 2019, 276, 202–208. [Google Scholar] [CrossRef]
- Han, L.; Sapozhnikova, Y. Semi-automated high-throughput method for residual analysis of 302 pesticides and environmental contaminants in catfish by fast low-pressure GC–MS/MS and UHPLC-MS/MS. Food Chem. 2020, 319, 126592. [Google Scholar] [CrossRef] [PubMed]
- Dale, W.E.; Miles, J.W.; Gaixes, T.B. Quantitative method for determination of DDT and DDT metabolites in blood serum. J. Assoc. Off. Anal. Chem. 1970, 53, 1287–1292. [Google Scholar] [CrossRef]
- Bull, H.B.; Breese, K. Interaction of alcohols with proteins. Biopolymers 1978, 17, 2121–2131. [Google Scholar] [CrossRef]
- Li, H.; Yin, J.; Liu, Y.; Shang, J. Effect of protein on the detection of fluoroquinolone residues in fish meat. J. Agric. Food Chem. 2012, 60, 1722–1727. [Google Scholar] [CrossRef]
- Vázquez, P.P.; Lozano, A.; Uclés, S.; Ramos, M.M.G.; Fernández-Alba, A.R. A sensitive and efficient method for routine pesticide multiresidue analysis in bee pollen samples using gas and liquid chromatography coupled to tandem mass spectrometry. J. Chromatogr. A 2015, 1426, 161–173. [Google Scholar] [CrossRef]
- Anastassiades, M.; Lehotay, S.J.; Štajnbaher, D.; Schenck, F.J. Fast and easy multiresidue method employing acetonitrile extraction/partitioning and “dispersive solid-phase extraction” for the determination of pesticide residues in produce. J. AOAC Int. 2003, 86, 412–431. [Google Scholar] [CrossRef] [Green Version]
- Han, Y.; Song, L.; Zou, N.; Chen, R.; Qin, Y.; Pan, C. Multi-residue determination of 171 pesticides in cowpea using modified QuEChERS method with multi-walled carbon nanotubes as reversed-dispersive solid-phase extraction materials. J. Chromatogr. B 2016, 1031, 99–108. [Google Scholar] [CrossRef] [PubMed]
- Oliveira, F.A.d.S.; Pereira, E.N.C.; Gobbi, J.M.; Soto-Blanco, B.; Melo, M.M. Multiresidue method for detection of pesticides in beef meat using liquid chromatography coupled to mass spectrometry detection (LC-MS) after QuEChERS extraction. Food Addit. Contam. Part A Chem. Anal. Control. Expo. Risk. Assess. 2018, 35, 94–109. [Google Scholar] [CrossRef] [PubMed]
- Sapozhnikova, Y. High-throughput analytical method for 265 pesticides and environmental contaminants in meats and poultry by fast low pressure gas chromatography and ultrahigh-performance liquid chromatography tandem mass spectrometry. J. Chromatogr. A 2018, 1572, 203–211. [Google Scholar] [CrossRef] [PubMed]
- Barbieri, M.V.; Postigo, C.; Guillem-Argiles, N.; Monllor-Alcaraz, L.S.; Simionato, J.I.; Stella, E.; Barceló, D.; López de Alda, M. Analysis of 52 pesticides in fresh fish muscle by QuEChERS extraction followed by LC-MS/MS determination. Sci. Total Environ. 2019, 653, 958–967. [Google Scholar] [CrossRef] [PubMed]
- Pauwels, A.; Wells, D.A.; Covaci, A.; Schepens, P.J.C. Improved sample preparation method for selected persistent organochlorine pollutants in human serum using solid-phase disk extraction with gas chromatographic analysis. J. Chromatogr. B Biomed. Sci. Appl. 1999, 723, 117–125. [Google Scholar] [CrossRef]
- Shin, Y.; Lee, J.; Kim, J.-H. A simultaneous multiresidue analysis for 203 pesticides in soybean using florisil solid-phase extraction and gas chromatography–tandem mass spectrometry. Appl. Biol. Chem. 2018, 61, 543–548. [Google Scholar] [CrossRef] [Green Version]
- Brosnan, B.; Coffey, A.; Arendt, E.K.; Furey, A. The QuEChERS approach in a novel application for the identification of antifungal compounds produced by lactic acid bacteria cultures. Talanta 2014, 129, 364–373. [Google Scholar] [CrossRef]
- Lehotay, S.J.; Maštovská, K.; Yun, S.J. Evaluation of two fast and easy methods for pesticide residue analysis in fatty food matrixes. J. AOAC Int. 2005, 88, 630–638. [Google Scholar] [CrossRef] [Green Version]
- Koesukwiwat, U.; Lehotay, S.J.; Mastovska, K.; Dorweiler, K.J.; Leepipatpiboon, N. Extension of the QuEChERS method for pesticide residues in cereals to flaxseeds, peanuts, and doughs. J. Agric. Food Chem. 2010, 58, 5950–5958. [Google Scholar] [CrossRef]
- Jeon, Y.-H.; Hwang, J.-I.; Ahn, J.-W.; Kim, H.-Y.; Do, J.-A.; Oh, J.-H.; Hwang, I.-G.; Im, M.-H.; Lee, J.-K.; Lee, Y.-D.; et al. Multiresidue analysis method for determination of unregistered organophosphorus pesticides in Korea for imported Agri-Food. Kor. J. Environ. Agric. 2012, 31, 277–285. [Google Scholar] [CrossRef]
- Turner, J.A. The Pesticide Manual: A World Compendium, 17th ed.; British Crop Production Council: Alton, Hampshire, UK, 2015. [Google Scholar]
- Foods of plant origin—Determination of Pesticide Residues Using GC-MS and/or LC-MS/MS Following Acetonitrile Extraction/Partitioning and Clean-Up by Dispersive SPE—QuEChERS-Method. Available online: https://www.en-standard.eu/csn-en-15662-foods-of-plant-origin-multimethod-for-the-determination-of-pesticide-residues-using-gc-and-lc-based-analysis-following-acetonitrile-extraction/partitioning-and-clean-up-by-dispersive-spe-modular-quechers-method/ (accessed on 26 November 2020).
- Lee, J.; Kim, L.; Shin, Y.; Lee, J.; Lee, J.; Kim, E.; Moon, J.-K.; Kim, J.-H. Rapid and simultaneous analysis of 360 pesticides in brown rice, spinach, orange, and potato using microbore GC-MS/MS. J. Agric. Food Chem. 2017, 65, 3387–3395. [Google Scholar] [CrossRef] [PubMed]
- MarvinSketch; Version 20.20; Calculation Module Developed by ChemAxon: Budapest, Hungary, 2020.
- Lee, Y.-J.; Rahman, M.M.; Abd El-Aty, A.M.; Choi, J.-H.; Chung, H.S.; Kim, S.-W.; Abdel-Aty, A.M.; Shin, H.-C.; Shim, J.-H. Detection of three herbicide, and one metabolite, residues in brown rice and rice straw using various versions of the QuEChERS method and liquid chromatography-tandem mass spectrometry. Food Chem. 2016, 210, 442–450. [Google Scholar] [CrossRef] [PubMed]
- Kaczyński, P.; Łozowicka, B. One-step QuEChERS-based approach to extraction and cleanup in multiresidue analysis of sulfonylurea herbicides in cereals by liquid chromatography–tandem mass spectrometry. Food Anal. Method 2017, 10, 147–160. [Google Scholar] [CrossRef] [Green Version]
- Martins, G.L.; Friggi, C.A.; Prestes, O.D.; Vicari, M.C.; Friggi, D.A.; Adaime, M.B.; Zanella, R. Simultaneous LC–MS/MS determination of imidazolinone herbicides together with other multiclass pesticide residues in soil. CLEAN–Soil Air Water 2014, 42, 1441–1449. [Google Scholar] [CrossRef]
- Shida, S.S.; Nemoto, S.; Matsuda, R. Simultaneous determination of acidic pesticides in vegetables and fruits by liquid chromatography—Tandem mass spectrometry. J. Environ. Sci. Health Part B 2015, 50, 151–162. [Google Scholar] [CrossRef]
- Koesukwiwat, U.; Vaclavik, L.; Mastovska, K. Method development and validation for total haloxyfop analysis in infant formulas and related ingredient matrices using liquid chromatography-tandem mass spectrometry. Anal. Bioanal. Chem. 2018, 410, 5521–5528. [Google Scholar] [CrossRef]
- European Commission. Analytical Quality Control and Method Validation Procedures for Pesticide Residues Analysis in Food and Feed (SANTE/12682/2019). Available online: https://www.eurl-pesticides.eu/userfiles/file/EurlALL/AqcGuidance_SANTE_2019_12682.pdf (accessed on 26 November 2020).
- Seok, J.H.; Kim, G. Impact of the positive list system (PLS) on the banana market in Korea. J. Asia Pacific Econ. 2020, 25, 718–732. [Google Scholar] [CrossRef]
- Li, Y.-F.; Qiao, L.-Q.; Li, F.-W.; Ding, Y.; Yang, Z.-J.; Wang, M.-L. Determination of multiple pesticides in fruits and vegetables using a modified quick, easy, cheap, effective, rugged and safe method with magnetic nanoparticles and gas chromatography tandem mass spectrometry. J. Chromatogr. A 2014, 1361, 77–87. [Google Scholar] [CrossRef]
- Shin, Y.; Lee, J.; Park, E.; Lee, J.; Lee, S.H.; Kim, J.-H. A Quantitative tandem mass spectrometry and scaled-down QuEChERS approach for simultaneous analysis of pesticide multiresidues in human urine. Molecules 2019, 24, 1330. [Google Scholar] [CrossRef] [Green Version]
- Gosetti, F.; Mazzucco, E.; Zampieri, D.; Gennaro, M.C. Signal suppression/enhancement in high-performance liquid chromatography tandem mass spectrometry. J. Chromatogr. A 2010, 1217, 3929–3937. [Google Scholar] [CrossRef] [PubMed]
- Rutkowska, E.; Łozowicka, B.; Kaczyński, P. Three approaches to minimize matrix effects in residue analysis of multiclass pesticides in dried complex matrices using gas chromatography tandem mass spectrometry. Food Chem. 2019, 279, 20–29. [Google Scholar] [CrossRef] [PubMed]
- Kmellár, B.; Fodor, P.; Pareja, L.; Ferrer, C.; Martínez-Uroz, M.A.; Valverde, A.; Fernandez-Alba, A.R. Validation and uncertainty study of a comprehensive list of 160 pesticide residues in multi-class vegetables by liquid chromatography–tandem mass spectrometry. J. Chromatogr. A 2008, 1215, 37–50. [Google Scholar] [CrossRef] [PubMed]
- Ferrer, C.; Lozano, A.; Agüera, A.; Girón, A.J.; Fernández-Alba, A.R. Overcoming matrix effects using the dilution approach in multiresidue methods for fruits and vegetables. J. Chromatogr. A 2011, 1218, 7634–7639. [Google Scholar] [CrossRef] [PubMed]


| Recovery (%) at 25 μg/kg | RSD (%) n = 3 | No. of Pesticides (%) | ||
|---|---|---|---|---|
| N = 1 | N = 2 | N = 3 | ||
| <10 | >0 | 6 (1.7) | 6 (1.7) | 7 (2.0) |
| 10 to 30 | ≤20 | 12 (3.4) | 13 (3.7) | 9 (2.5) |
| >20 | 1 (0.3) | 0 (0.0) | 1 (0.3) | |
| 30 to 70 | ≤20 | 55 (15.6) | 31 (8.8) | 30 (8.5) |
| >20 | 3 (0.8) | 3 (0.8) | 1 (0.3) | |
| 70 to 120 | ≤20 | 264 (74.8) | 290 (82.2) | 294 (83.3) |
| >20 | 9 (2.5) | 7 (2.0) | 8 (2.3) | |
| >120 | ≤20 | 2 (0.6) | 2 (0.6) | 3 (0.8) |
| >20 | 0 (0.0) | 0 (0.0) | 0 (0.0) | |
| nd 1 | 1 (0.3) | 1 (0.3) | 0 (0.0) | |
| Sum | 353 (100) | 353 (100) | 353 (100) | |
| Recovery (%) at 25 μg/kg | RSD (%) n = 3 | No. of Pesticides (%) under Detailed Sample Preparation Conditions | |||||
|---|---|---|---|---|---|---|---|
| 0.1% Formic Acid in Acetonitrile (12.5 mL) QuEChERS Original Salts 1 | Acetonitrile (12.5 mL) QuEChERS EN 15662 Salts 2 | ||||||
| PSA + C18 | PSA | C18 | PSA + C18 | PSA | C18 | ||
| <10 | >0 | 7 (2.0) | 6 (1.7) | 0 (0.0) | 7 (2.0) | 2 (0.6) | 0 (0.0) |
| 10 to 30 | ≤20 | 12 (3.4) | 5 (1.4) | 1 (0.3) | 7 (2.0) | 1 (0.3) | 0 (0.0) |
| >20 | 0 (0.0) | 5 (1.4) | 1 (0.3) | 1 (0.3) | 6 (1.7) | 1 (0.3) | |
| 30 to 70 | ≤20 | 21 (5.9) | 20 (5.7) | 26 (7.4) | 23 (6.5) | 17 (4.8) | 21 (5.9) |
| >20 | 1 (0.3) | 3 (0.8) | 0 (0.0) | 1 (0.3) | 15 (4.2) | 0 (0.0) | |
| 70 to 120 | ≤20 | 305 (86.4) | 295 (83.6) | 318 (90.1) | 309 (87.5) | 300 (85.0) | 325 (92.1) |
| >20 | 2 (0.6) | 12 (3.4) | 0 (0.0) | 1 (0.3) | 10 (2.8) | 0 (0.0) | |
| >120 | ≤20 | 5 (1.4) | 6 (1.7) | 7 (2.0) | 4 (1.1) | 2 (0.6) | 6 (1.7) |
| >20 | 0 (0.0) | 0 (0.0) | 0 (0.0) | 0 (0.0) | 0 (0.0) | 0 (0.0) | |
| nd 3 | 0 (0.0) | 1 (0.3) | 0 (0.0) | 0 (0.0) | 0 (0.0) | 0 (0.0) | |
| Sum | 353 (100) | 353 (100) | 353 (100) | 353 (100) | 353 (100) | 353 (100) | |
| No. | Compound Name | LOQ (μg/kg) | r2 | Linear Range (μg/kg) | Recovery | ME 2 (%) | |||||
|---|---|---|---|---|---|---|---|---|---|---|---|
| Low | High | ||||||||||
| Conc. 1 (μg/kg) | Value (%) | RSD (%) | Conc. (μg/kg) | Value (%) | RSD (%) | ||||||
| 1 | Abamectin | 10 | 0.9923 | 10–200 | 10 | 108.1 | 13.9 | 50 | 112.5 | 8.3 | 11.8 |
| 2 | Acetamiprid | 1 | 0.9975 | 1–200 | 1 | 90.2 | 12.2 | 50 | 103.8 | 3.2 | 5.8 |
| 3 | Acibenzolar-S-methyl | 5 | 0.9991 | 5–200 | 5 | 100.5 | 15.8 | 50 | 83.3 | 4.8 | 4.9 |
| 4 | Alachlor | 5 | 0.9993 | 5–200 | 5 | 90.2 | 14.1 | 50 | 93.5 | 2.7 | −6.8 |
| 5 | Aldicarb sulfone | 1 | 0.9993 | 1–200 | 1 | 87.4 | 18.7 | 50 | 101.5 | 2.0 | −0.7 |
| 6 | Aldicarb sulfoxide | 1 | 0.9999 | 1–200 | 1 | 82.8 | 12.2 | 50 | 94.7 | 1.4 | −11.3 |
| 7 | Allethrin | 10 | 0.9971 | 10–200 | 10 | 85.5 | 13.2 | 50 | 84.7 | 3.2 | −9.2 |
| 8 | Ametoctradin | 2.5 | 0.9996 | 2.5–200 | 2.5 | 80.4 | 8.9 | 50 | 80.5 | 3.2 | −4.7 |
| 9 | Ametryn | 10 | 0.9982 | 10–200 | 10 | 65.8 | 4.4 | 50 | 75.0 | 7.1 | −6.5 |
| 10 | Anilofos | 1 | 0.9980 | 1–200 | 1 | 102.9 | 16.5 | 50 | 94.2 | 10.2 | −6.5 |
| 11 | Aramite | 1 | 0.9997 | 1–200 | 1 | 89.1 | 15.9 | 50 | 94.4 | 4.7 | −24.0 |
| 12 | Aspon | 1 | 0.9998 | 1–200 | 1 | 87.7 | 4.2 | 50 | 89.5 | 1.9 | −10.6 |
| 13 | Atrazine | 1 | 0.9999 | 1–200 | 1 | 89.5 | 6.6 | 50 | 85.6 | 1.2 | 1.9 |
| 14 | Azaconazole | 1 | 0.9983 | 1–200 | 1 | 76.9 | 8.3 | 50 | 87.6 | 3.5 | 5.3 |
| 15 | Azimsulfuron | 2.5 | 0.9992 | 2.5–200 | 2.5 | 84.9 | 14.1 | 50 | 92.8 | 4.2 | 2.9 |
| 16 | Azinphos-ethyl | 2.5 | 0.9925 | 2.5–200 | 2.5 | 106.2 | 8.6 | 50 | 113.7 | 9.8 | −21.3 |
| 17 | Azinphos-methyl | 2.5 | 0.9931 | 2.5–200 | 2.5 | 95.3 | 14.5 | 50 | 107.8 | 8.1 | −17.8 |
| 18 | Azoxystrobin | 1 | 0.9950 | 1–200 | 1 | 93.5 | 9.8 | 50 | 105.6 | 3.6 | −2.6 |
| 19 | Benalaxyl | 1 | 0.9980 | 1–200 | 1 | 91.5 | 11.3 | 50 | 97.5 | 5.1 | −13.5 |
| 20 | Bendiocarb | 2.5 | 0.9982 | 2.5–200 | 2.5 | 95.4 | 5.8 | 50 | 95.4 | 4.5 | 3.3 |
| 21 | Benodanil | 1 | 0.9997 | 1–200 | 1 | 92.4 | 7.3 | 50 | 96.8 | 2.8 | 1.7 |
| 22 | Benoxacor | 2.5 | 0.9988 | 2.5–200 | 2.5 | 96.7 | 14.8 | 50 | 96.6 | 3.8 | 3.2 |
| 23 | Bensulfuron-methyl | 1 | 0.9994 | 1–200 | 1 | 88.7 | 15.6 | 50 | 94.6 | 4.5 | 7.7 |
| 24 | Bensulide | 2.5 | 0.9942 | 2.5–200 | 2.5 | 73.0 | 16.4 | 50 | 111.4 | 6.9 | −22.6 |
| 25 | Benthiavalicarb-isopropyl | 1 | 0.9994 | 1–200 | 1 | 107.1 | 11.8 | 50 | 95.6 | 2.7 | 1.8 |
| 26 | Benzobicyclon | 1 | 0.9993 | 1–200 | 1 | 118.0 | 9.1 | 50 | 94.6 | 3.4 | 15.6 |
| 27 | Benzoximate | 5 | 0.9959 | 5–200 | 5 | 69.1 | 9.5 | 50 | 87.5 | 9.3 | −6.9 |
| 28 | Benzoylprop-ethyl | 2.5 | 0.9997 | 2.5–200 | 2.5 | 103.7 | 8.7 | 50 | 96.3 | 7.2 | −4.5 |
| 29 | Bitertanol | 5 | 0.9976 | 5–200 | 5 | 96.4 | 13.3 | 50 | 95.7 | 7.2 | 10.4 |
| 30 | Bixafen | 1 | 0.9974 | 1–200 | 1 | 109.6 | 18.1 | 50 | 97.1 | 9.4 | −8.0 |
| 31 | Boscalid | 5 | 0.9992 | 5–200 | 5 | 89.0 | 7.3 | 50 | 96.1 | 3.1 | 5.6 |
| 32 | Broflanilide | 10 | 0.9965 | 10–200 | 10 | 111.6 | 16.9 | 50 | 103.7 | 5.7 | 11.5 |
| 33 | Broflanilide_DM-8007 | 1 | 0.9994 | 1–200 | 1 | 114.8 | 14.9 | 50 | 97.1 | 6.9 | −0.2 |
| 34 | Broflanilide_S(PFP-OH)-8007 | 10 | 0.9977 | 10–200 | 10 | 97.6 | 14.5 | 50 | 106.1 | 7.6 | −4.7 |
| 35 | Bromacil | 2.5 | 0.9978 | 2.5–200 | 2.5 | 91.6 | 9.4 | 50 | 96.7 | 5.2 | 4.4 |
| 36 | Bromobutide | 2.5 | 0.9983 | 2.5–200 | 2.5 | 99.1 | 15.8 | 50 | 99.0 | 9.2 | −7.1 |
| 37 | Bromuconazole | 5 | 0.9977 | 5–200 | 5 | 78.1 | 12.5 | 50 | 85.2 | 7.9 | 6.1 |
| 38 | Bupirimate | 1 | 0.9969 | 1–200 | 1 | 86.5 | 18.1 | 50 | 91.4 | 10.7 | −3.4 |
| 39 | Buprofezin | 2.5 | 0.9998 | 2.5–200 | 2.5 | 73.2 | 8.5 | 50 | 72.1 | 6.4 | −26.5 |
| 40 | Butocarboxim | 10 | 0.9958 | 10–200 | 10 | 116.8 | 8.4 | 50 | 106.4 | 6.9 | −4.5 |
| 41 | Cadusafos | 1 | 0.9989 | 1–200 | 1 | 73.5 | 6.8 | 50 | 88.1 | 2.0 | 2.8 |
| 42 | Cafenstrole | 2.5 | 0.9997 | 2.5–200 | 2.5 | 99.2 | 13.1 | 50 | 106.7 | 8.6 | 0.4 |
| 43 | Carbaryl | 1 | 0.9988 | 1–200 | 1 | 83.3 | 19.2 | 50 | 89.8 | 4.3 | 4.1 |
| 44 | Carbendazim | 1 | 0.9999 | 1–25 | 1 | 46.6 | 14.7 | 10 | 47.5 | 6.6 | −2.3 |
| 45 | Carbetamide | 2.5 | 0.9958 | 2.5–200 | 2.5 | 75.2 | 10.0 | 50 | 95.4 | 5.0 | 12.6 |
| 46 | Carbofuran | 10 | 0.9902 | 10–200 | 10 | 79.4 | 7.3 | 50 | 115.6 | 4.7 | −25.4 |
| 47 | Carbofuran-3-hydroxy | 5 | 0.9989 | 5–200 | 5 | 84.7 | 17.8 | 50 | 95.6 | 8.3 | 10.5 |
| 48 | Carboxin | 1 | 0.9986 | 1–200 | 1 | 88.9 | 11.4 | 50 | 88.3 | 3.4 | −8.6 |
| 49 | Carfentrazone-ethyl | 10 | 0.9994 | 10–200 | 10 | 91.8 | 19.9 | 50 | 93.6 | 4.7 | 1.0 |
| 50 | Carpropamid | 5 | 0.9976 | 5–200 | 5 | 86.9 | 14.8 | 50 | 98.4 | 3.7 | −1.4 |
| 51 | Chlorantraniliprole | 1 | 0.9994 | 1–200 | 1 | 100.6 | 17.1 | 50 | 96.8 | 4.2 | 9.1 |
| 52 | Chlorbenzuron | 10 | 0.9950 | 10–200 | 10 | 84.9 | 19.7 | 50 | 95.0 | 9.1 | 5.6 |
| 53 | Chlorfenvinphos | 2.5 | 0.9989 | 2.5–200 | 2.5 | 90.3 | 8.0 | 50 | 96.0 | 6.2 | −18.2 |
| 54 | Chlorimuron-ethyl | 1 | 0.9995 | 1–200 | 1 | 89.8 | 11.1 | 50 | 92.3 | 3.5 | 8.4 |
| 55 | Chlorotoluron | 1 | 0.9998 | 1–200 | 1 | 94.3 | 8.5 | 50 | 92.7 | 3.2 | −7.2 |
| 56 | Chloroxuron | 1 | 0.9966 | 1–200 | 1 | 103.3 | 16.9 | 50 | 97.0 | 6.8 | −2.1 |
| 57 | Chlorpyrifos | 2.5 | 0.9997 | 2.5–200 | 2.5 | 86.6 | 12.8 | 50 | 83.9 | 3.9 | −14.9 |
| 58 | Chlorsulfuron | 5 | 0.9965 | 5–200 | 5 | 61.5 | 10.9 | 50 | 88.9 | 15.9 | −2.4 |
| 59 | Chromafenozide | 1 | 0.9970 | 1–200 | 1 | 96.5 | 9.7 | 50 | 97.3 | 8.1 | −2.0 |
| 60 | Clethodim | 1 | 0.9975 | 1–200 | 1 | 93.8 | 19.2 | 50 | 82.3 | 7.1 | 2.1 |
| 61 | Clofentezine | 1 | 0.9985 | 1–200 | 1 | 64.9 | 18.1 | 50 | 55.0 | 7.9 | 4.7 |
| 62 | Clomazone | 2.5 | 0.9980 | 2.5–200 | 2.5 | 94.1 | 8.0 | 50 | 91.4 | 5.0 | 14.7 |
| 63 | Clothianidin | 5 | 0.9979 | 5–200 | 5 | 83.3 | 14.3 | 50 | 88.8 | 7.1 | 9.5 |
| 64 | Coumaphos | 1 | 0.9982 | 1–200 | 1 | 82.1 | 8.4 | 50 | 92.5 | 2.7 | 4.6 |
| 65 | Crotoxyphos | 10 | 0.9991 | 10–200 | 10 | 42.9 | 11.4 | 50 | 68.2 | 8.5 | 2.6 |
| 66 | Crufomate | 2.5 | 0.9989 | 2.5–200 | 2.5 | 92.3 | 5.2 | 50 | 98.0 | 4.9 | −9.7 |
| 67 | Cyanazine | 2.5 | 0.9993 | 2.5–200 | 2.5 | 100.1 | 11.1 | 50 | 99.1 | 4.1 | 10.5 |
| 68 | Cyazofamid | 1 | 0.9978 | 1–200 | 1 | 99.3 | 7.3 | 50 | 97.7 | 4.4 | 8.8 |
| 69 | Cyclosulfamuron | 1 | 0.9950 | 1–200 | 1 | 92.1 | 15.6 | 50 | 100.5 | 2.7 | −2.8 |
| 70 | Cyflufenamid | 1 | 0.9966 | 1–200 | 1 | 100.5 | 18.8 | 50 | 103.6 | 3.2 | −14.3 |
| 71 | Cyhalofop-butyl | 10 | 0.9980 | 10–200 | 10 | 90.9 | 11.1 | 50 | 90.2 | 13.3 | 8.5 |
| 72 | Cymoxanil | 2.5 | 0.9988 | 2.5–200 | 2.5 | 89.0 | 13.0 | 50 | 94.9 | 5.3 | 13.0 |
| 73 | Cyprazine | 1 | 0.9998 | 1–200 | 1 | 95.2 | 6.3 | 50 | 86.6 | 4.2 | −3.3 |
| 74 | Cyprodinil | 10 | 0.9995 | 10–200 | 10 | 43.5 | 7.1 | 50 | 55.2 | 5.7 | −4.1 |
| 75 | Daimuron | 1 | 0.9993 | 1–200 | 1 | 83.5 | 11.3 | 50 | 97.2 | 4.4 | 7.9 |
| 76 | Demeton-S | 1 | 0.9961 | 1–200 | 1 | 91.3 | 13.3 | 50 | 99.6 | 6.6 | 5.7 |
| 77 | Demeton-S-methyl | 5 | 0.9976 | 5–200 | 5 | 81.2 | 9.3 | 50 | 98.6 | 8.3 | 8.9 |
| 78 | Demeton-S-methyl sulfone | 2.5 | 0.9987 | 2.5–200 | 2.5 | 71.2 | 11.0 | 50 | 94.5 | 7.0 | 7.5 |
| 79 | Demeton-S-methyl sulfoxide | 2.5 | 0.9995 | 2.5–200 | 2.5 | 79.9 | 7.9 | 50 | 87.5 | 3.8 | −1.2 |
| 80 | Desmetryn | 10 | 0.9990 | 10–200 | 10 | 70.1 | 3.4 | 50 | 74.0 | 2.7 | 0.8 |
| 81 | Diazinon | 2.5 | 0.9993 | 2.5–200 | 2.5 | 89.3 | 10.4 | 50 | 88.4 | 3.7 | −3.2 |
| 82 | Diclobutrazol | 10 | 0.9987 | 10–200 | 10 | 86.6 | 7.0 | 50 | 88.2 | 6.5 | −9.1 |
| 83 | Dicrotophos | 5 | 0.9999 | 5–200 | 5 | 52.6 | 18.4 | 50 | 73.8 | 8.7 | −0.2 |
| 84 | Diethatyl-ethyl | 1 | 0.9992 | 1–200 | 1 | 107.5 | 9.8 | 50 | 97.8 | 7.2 | 0.7 |
| 85 | Diethofencarb | 1 | 0.9993 | 1–200 | 1 | 111.9 | 10.9 | 50 | 97.6 | 5.2 | 16.6 |
| 86 | Difenoconazole | 1 | 0.9996 | 1–200 | 1 | 108.5 | 17.4 | 50 | 88.5 | 2.1 | −1.7 |
| 87 | Diflubenzuron | 1 | 0.9993 | 1–200 | 1 | 103.9 | 18.7 | 50 | 98.5 | 4.5 | 2.6 |
| 88 | Diflufenican | 1 | 0.9996 | 1–200 | 1 | 86.3 | 11.9 | 50 | 94.1 | 3.6 | 10.1 |
| 89 | Dimepiperate | 5 | 0.9937 | 5–200 | 5 | 97.1 | 9.1 | 50 | 91.1 | 11.5 | −9.7 |
| 90 | Dimethachlor | 2.5 | 0.9996 | 2.5–200 | 2.5 | 91.2 | 14.4 | 50 | 97.6 | 2.6 | 1.9 |
| 91 | Dimethametryn | 1 | 0.9990 | 1–200 | 1 | 62.0 | 8.6 | 50 | 69.1 | 3.6 | −2.9 |
| 92 | Dimethenamide | 2.5 | 0.9987 | 2.5–200 | 2.5 | 83.2 | 10.8 | 50 | 96.1 | 3.2 | −1.7 |
| 93 | Dimethoate | 1 | 0.9979 | 1–200 | 1 | 98.3 | 16.7 | 50 | 100.4 | 7.3 | 4.4 |
| 94 | Dimethomorph | 1 | 0.9993 | 1–200 | 1 | 95.1 | 18.7 | 50 | 101.2 | 2.4 | 7.5 |
| 95 | Dimethylaminosulfotoluidide (DMST) | 1 | 0.9989 | 1–25 | 1 | 94.2 | 15.3 | 10 | 88.9 | 4.7 | 6.0 |
| 96 | Dimethylvinphos (E) | 2.5 | 0.9989 | 2.5–200 | 2.5 | 100.6 | 15.7 | 50 | 95.9 | 6.0 | 2.3 |
| 97 | Dimethylvinphos (Z) | 10 | 0.9996 | 10–200 | 10 | 63.3 | 6.2 | 50 | 84.0 | 4.3 | −0.2 |
| 98 | Diniconazole | 5 | 0.9997 | 5–200 | 5 | 57.0 | 16.7 | 50 | 90.6 | 4.2 | −19.3 |
| 99 | Dinotefuran | 5 | 0.9987 | 5–200 | 5 | 104.8 | 16.4 | 50 | 103.1 | 5.8 | −21.9 |
| 100 | Diphenamid | 1 | 0.9958 | 1–200 | 1 | 86.0 | 6.2 | 50 | 103.8 | 3.7 | 0.7 |
| 101 | Dithiopyr | 1 | 0.9997 | 1–200 | 1 | 86.5 | 12.3 | 50 | 98.2 | 3.7 | 4.8 |
| 102 | Diuron | 1 | 0.9996 | 1–200 | 1 | 94.2 | 11.6 | 50 | 92.2 | 3.0 | 4.5 |
| 103 | Edifenphos | 10 | 0.9932 | 10–200 | 10 | 71.4 | 6.3 | 50 | 85.7 | 7.9 | −6.9 |
| 104 | Esprocarb | 2.5 | 0.9992 | 2.5–200 | 2.5 | 83.4 | 10.3 | 50 | 83.1 | 5.9 | −24.4 |
| 105 | Etaconazole | 2.5 | 0.9981 | 2.5–200 | 2.5 | 92.5 | 18.1 | 50 | 94.6 | 5.0 | −4.1 |
| 106 | Ethaboxam | 2.5 | 0.9978 | 2.5–200 | 2.5 | 119.8 | 7.3 | 50 | 99.7 | 2.1 | 12.0 |
| 107 | Ethiofencarb | 1 | 0.9992 | 1–200 | 1 | 92.3 | 15.4 | 50 | 93.6 | 5.1 | 3.3 |
| 108 | Ethoprophos | 1 | 0.9933 | 1–200 | 1 | 83.7 | 16.1 | 50 | 100.6 | 6.3 | 0.2 |
| 109 | Ethoxysulfuron | 2.5 | 0.9973 | 2.5–200 | 2.5 | 76.3 | 14.8 | 50 | 87.9 | 4.4 | −10.4 |
| 110 | Etofenprox | 1 | 0.9996 | 1–200 | 1 | 81.5 | 13.3 | 50 | 75.2 | 1.4 | −10.8 |
| 111 | Etoxazole | 1 | 0.9968 | 1–200 | 1 | 74.9 | 2.3 | 50 | 88.9 | 2.0 | −12.5 |
| 112 | Etrimfos | 2.5 | 0.9994 | 2.5–200 | 2.5 | 95.0 | 11.7 | 50 | 94.8 | 3.7 | −4.3 |
| 113 | Famoxadone | 5 | 0.9959 | 5–200 | 5 | 95.4 | 18.7 | 50 | 102.7 | 5.6 | 0.4 |
| 114 | Fenamiphos | 1 | 0.9997 | 1–200 | 1 | 97.8 | 13.4 | 50 | 93.0 | 6.1 | −1.7 |
| 115 | Fenamiphos sulfone | 2.5 | 0.9949 | 2.5–200 | 2.5 | 102.9 | 19.6 | 50 | 86.4 | 7.4 | 6.5 |
| 116 | Fenamiphos sulfoxide | 1 | 0.9994 | 1–200 | 1 | 79.9 | 15.1 | 50 | 85.1 | 5.3 | 12.3 |
| 117 | Fenazaquin | 1 | 0.9999 | 1–200 | 1 | 57.2 | 8.3 | 50 | 61.2 | 2.8 | –39.7 |
| 118 | Fenbuconazole | 2.5 | 0.9979 | 2.5–200 | 2.5 | 95.9 | 17.0 | 50 | 98.4 | 5.8 | 2.2 |
| 119 | Fenfuram | 1 | 0.9982 | 1–200 | 1 | 89.8 | 14.3 | 50 | 105.1 | 4.6 | –2.1 |
| 120 | Fenhexamid | 10 | 0.9991 | 10–200 | 10 | 71.3 | 12.7 | 50 | 93.1 | 5.1 | 5.8 |
| 121 | Fenobucarb | 1 | 0.9997 | 1–200 | 1 | 94.0 | 7.2 | 50 | 92.8 | 5.1 | –3.2 |
| 122 | Fenothiocarb | 1 | 0.9996 | 1–200 | 1 | 100.4 | 15.0 | 50 | 92.8 | 2.7 | –0.1 |
| 123 | Fenoxanil | 2.5 | 0.9994 | 2.5–200 | 2.5 | 108.5 | 17.4 | 50 | 97.1 | 5.0 | –1.1 |
| 124 | Fenoxaprop-ethyl | 1 | 0.9988 | 1–200 | 1 | 84.8 | 7.6 | 50 | 91.4 | 3.7 | 1.0 |
| 125 | Fenoxycarb | 5 | 0.9996 | 5–200 | 5 | 87.4 | 7.5 | 50 | 100.5 | 5.9 | –1.6 |
| 126 | Fenpropathrin | 1 | 0.9997 | 1–200 | 1 | 71.4 | 15.8 | 50 | 90.7 | 2.7 | 13.6 |
| 127 | Fenpropimorph | 1 | 0.9989 | 1–200 | 1 | 88.6 | 16.3 | 50 | 83.6 | 5.6 | –0.4 |
| 128 | Fenpyroximate | 1 | 0.9999 | 1–200 | 1 | 84.0 | 6.3 | 50 | 85.0 | 1.4 | 16.4 |
| 129 | Fenquinotrione | 10 | 0.9998 | 10–200 | 10 | 47.3 | 18.6 | 50 | 49.7 | 8.1 | 7.3 |
| 130 | Fenthion | 2.5 | 0.9972 | 2.5–200 | 2.5 | 75.7 | 12.3 | 50 | 91.6 | 4.0 | 2.3 |
| 131 | Fenthion oxon | 1 | 0.9977 | 1–200 | 1 | 97.2 | 2.9 | 50 | 93.0 | 4.5 | 2.7 |
| 132 | Fenthion oxon sulfoxide | 2.5 | 0.9994 | 2.5–200 | 2.5 | 73.5 | 15.8 | 50 | 81.3 | 2.4 | 3.2 |
| 133 | Fenthion sulfone | 1 | 0.9974 | 1–200 | 1 | 105.9 | 19.2 | 50 | 101.6 | 3.6 | 17.8 |
| 134 | Fenthion sulfoxide | 1 | 0.9988 | 1–200 | 1 | 72.5 | 19.5 | 50 | 100.1 | 5.0 | 4.3 |
| 135 | Fentrazamide | 1 | 0.9980 | 1–200 | 1 | 103.2 | 11.8 | 50 | 99.2 | 8.3 | 12.4 |
| 136 | Ferimzone | 5 | 0.9991 | 5–200 | 5 | 41.0 | 18.3 | 50 | 67.0 | 1.4 | –1.9 |
| 137 | Fipronil | 1 | 0.9995 | 1–200 | 1 | 99.9 | 5.1 | 50 | 97.8 | 1.2 | 24.7 |
| 138 | Fipronil sulfone | 1 | 0.9998 | 1–200 | 1 | 97.2 | 3.5 | 50 | 100.7 | 2.8 | 4.8 |
| 139 | Flamprop-isopropyl | 1 | 0.9989 | 1–200 | 1 | 89.8 | 16.0 | 50 | 99.9 | 5.8 | –1.3 |
| 140 | Flonicamid | 2.5 | 0.9982 | 2.5–200 | 2.5 | 89.6 | 12.0 | 50 | 100.3 | 5.0 | –11.2 |
| 141 | Fluacrypyrim | 1 | 0.9983 | 1–200 | 1 | 85.1 | 18.9 | 50 | 99.9 | 6.6 | –9.6 |
| 142 | Fluazinam | 1 | 0.9999 | 1–200 | 1 | 80.3 | 2.5 | 50 | 86.1 | 0.8 | 12.8 |
| 143 | Flucetosulfuron | 10 | 0.9957 | 10–200 | 10 | 59.0 | 8.9 | 50 | 75.2 | 6.9 | 0.7 |
| 144 | Fludioxonil | 1 | 0.9997 | 1–200 | 1 | 90.4 | 8.1 | 50 | 95.3 | 2.9 | 16.5 |
| 145 | Flufenacet | 1 | 0.9944 | 1–200 | 1 | 101.3 | 11.2 | 50 | 105.6 | 10.9 | 1.8 |
| 146 | Flufenoxuron | 1 | 0.9999 | 1–200 | 1 | 88.9 | 5.8 | 50 | 93.0 | 3.9 | 11.0 |
| 147 | Fluometuron | 5 | 0.9994 | 5–200 | 5 | 87.2 | 19.4 | 50 | 96.2 | 3.9 | 5.5 |
| 148 | Fluopicolide | 1 | 0.9974 | 1–200 | 1 | 86.7 | 9.7 | 50 | 99.0 | 3.4 | 3.6 |
| 149 | Fluopyram | 1 | 0.9983 | 1–200 | 1 | 99.6 | 11.5 | 50 | 101.7 | 9.0 | –0.3 |
| 150 | Flupyradifuron | 1 | 0.9944 | 1–200 | 1 | 95.6 | 16.0 | 50 | 104.2 | 3.2 | 9.9 |
| 151 | Fluquinconazole | 2.5 | 0.9983 | 2.5–200 | 2.5 | 101.8 | 14.9 | 50 | 93.0 | 4.0 | –4.5 |
| 152 | Fluridone | 1 | 0.9982 | 1–200 | 1 | 86.5 | 9.6 | 50 | 98.6 | 6.9 | –3.1 |
| 153 | Flurochloridone | 2.5 | 0.9940 | 2.5–200 | 2.5 | 88.5 | 17.6 | 50 | 96.8 | 7.9 | 1.0 |
| 154 | Flurtamone | 1 | 0.9932 | 1–200 | 1 | 98.7 | 11.0 | 50 | 101.6 | 7.7 | –4.2 |
| 155 | Flusilazole | 1 | 0.9994 | 1–200 | 1 | 92.8 | 17.2 | 50 | 92.7 | 5.5 | –8.6 |
| 156 | Fluthiacet-methyl | 10 | 0.9964 | 10–200 | 10 | 71.6 | 12.4 | 50 | 76.7 | 15.6 | 6.6 |
| 157 | Flutianil | 1 | 0.9983 | 1–200 | 1 | 95.7 | 15.3 | 50 | 95.7 | 5.2 | 5.6 |
| 158 | Flutolanil | 1 | 0.9943 | 1–200 | 1 | 90.8 | 11.1 | 50 | 102.2 | 4.8 | –0.8 |
| 159 | Flutriafol | 1 | 0.9990 | 1–200 | 1 | 101.2 | 13.0 | 50 | 98.0 | 3.8 | –0.4 |
| 160 | Fluxapyroxad | 1 | 0.9977 | 1–200 | 1 | 97.3 | 12.6 | 50 | 104.5 | 4.7 | –5.3 |
| 161 | Forchlorfenuron | 1 | 0.9979 | 1–200 | 1 | 81.0 | 17.3 | 50 | 87.9 | 3.0 | 2.6 |
| 162 | Fosthiazate | 1 | 0.9979 | 1–200 | 1 | 88.0 | 7.8 | 50 | 99.6 | 1.9 | –1.5 |
| 163 | Halosulfuron-methyl | 2.5 | 0.9959 | 2.5–200 | 2.5 | 88.1 | 13.9 | 50 | 90.4 | 8.7 | –2.7 |
| 164 | Haloxyfop | 2.5 | 0.9991 | 2.5–200 | 2.5 | 94.8 | 11.5 | 50 | 84.9 | 2.9 | 11.4 |
| 165 | Heptenophos | 10 | 0.9997 | 10–200 | 10 | 69.0 | 5.2 | 50 | 83.8 | 5.4 | –7.2 |
| 166 | Hexaconazole | 10 | 0.9954 | 10–200 | 10 | 80.6 | 12.6 | 50 | 87.6 | 3.3 | –14.8 |
| 167 | Hexazinone | 1 | 0.9948 | 1–200 | 1 | 77.8 | 8.6 | 50 | 99.7 | 6.9 | 1.1 |
| 168 | Hexythiazox | 1 | 0.9990 | 1–200 | 1 | 81.5 | 17.9 | 50 | 80.6 | 3.1 | –0.4 |
| 169 | Imazalil | 5 | 0.9997 | 5–200 | 5 | 78.1 | 7.0 | 50 | 87.7 | 2.6 | –15.8 |
| 170 | Imazamox | 10 | 0.9988 | 10–200 | 10 | 62.9 | 7.9 | 50 | 68.2 | 6.4 | 8.3 |
| 171 | Imazapic | 2.5 | 0.9987 | 2.5–200 | 2.5 | 72.5 | 7.2 | 50 | 69.1 | 3.6 | 5.3 |
| 172 | Imazaquin | 2.5 | 0.9988 | 2.5–200 | 2.5 | 84.8 | 12.9 | 50 | 70.7 | 4.5 | 6.5 |
| 173 | Imazethapyr | 1 | 0.9993 | 1–200 | 1 | 100.6 | 10.5 | 50 | 73.2 | 3.3 | 8.9 |
| 174 | Imazosulfuron | 2.5 | 0.9989 | 2.5–200 | 2.5 | 92.1 | 10.1 | 50 | 82.7 | 3.8 | 7.4 |
| 175 | Imicyafos | 10 | 0.9918 | 10–200 | 10 | 102.7 | 9.9 | 50 | 95.1 | 7.0 | –4.2 |
| 176 | Imidacloprid | 1 | 0.9994 | 1–200 | 1 | 94.4 | 19.7 | 50 | 94.3 | 9.6 | 5.9 |
| 177 | Inabenfide | 1 | 0.9991 | 1–200 | 1 | 105.8 | 6.2 | 50 | 86.9 | 2.1 | 80.9 |
| 178 | Indanofan | 5 | 0.9996 | 5–200 | 5 | 95.9 | 13.7 | 50 | 92.9 | 4.1 | 4.6 |
| 179 | Ipconazole | 1 | 0.9992 | 1–200 | 1 | 104.6 | 19.8 | 50 | 85.9 | 3.4 | –11.5 |
| 180 | Iprobenfos | 1 | 0.9993 | 1–200 | 1 | 76.8 | 17.5 | 50 | 95.0 | 4.4 | –0.7 |
| 181 | Iprovalicarb | 1 | 0.9998 | 1–200 | 1 | 90.9 | 14.3 | 50 | 99.3 | 5.3 | 1.1 |
| 182 | Isoprocarb | 1 | 0.9999 | 1–200 | 1 | 97.7 | 12.5 | 50 | 93.8 | 4.7 | 3.7 |
| 183 | Isoprothiolane | 2.5 | 0.9989 | 2.5–200 | 2.5 | 94.0 | 14.6 | 50 | 89.1 | 11.7 | 32.2 |
| 184 | Isoproturon | 1 | 0.9998 | 1–200 | 1 | 97.0 | 7.2 | 50 | 93.0 | 2.2 | 1.8 |
| 185 | Isopyrazam | 2.5 | 0.9992 | 2.5–200 | 2.5 | 101.3 | 6.7 | 50 | 95.5 | 2.2 | –0.7 |
| 186 | Isoxaben | 1 | 0.9987 | 1–200 | 1 | 99.5 | 10.8 | 50 | 101.9 | 4.3 | 10.5 |
| 187 | Isoxathion | 5 | 0.9980 | 5–200 | 5 | 74.9 | 4.2 | 50 | 93.3 | 5.0 | –14.0 |
| 188 | Kresoxim-methyl | 10 | 0.9983 | 10–200 | 10 | 77.2 | 15.5 | 50 | 93.1 | 15.8 | –13.9 |
| 189 | Lenacil | 1 | 0.9998 | 1–200 | 1 | 86.4 | 16.8 | 50 | 85.3 | 2.8 | 3.9 |
| 190 | Linuron | 2.5 | 0.9985 | 2.5–200 | 2.5 | 86.5 | 11.6 | 50 | 94.6 | 3.8 | –0.7 |
| 191 | Lufenuron | 2.5 | 0.9993 | 2.5–200 | 2.5 | 105.9 | 15.0 | 50 | 95.8 | 5.2 | –35.5 |
| 192 | Malaoxon | 10 | 0.9991 | 10–200 | 10 | 40.6 | 14.7 | 50 | 65.4 | 12.9 | 1.6 |
| 193 | Malathion | 1 | 0.9915 | 1–200 | 1 | 94.8 | 16.0 | 50 | 94.0 | 4.6 | –0.1 |
| 194 | Mandipropamid | 1 | 0.9992 | 1–200 | 1 | 97.8 | 9.9 | 50 | 106.7 | 4.1 | 7.7 |
| 195 | Mecarbam | 1 | 0.9919 | 1–200 | 1 | 94.9 | 6.1 | 50 | 100.9 | 4.9 | –4.3 |
| 196 | Mefenacet | 1 | 0.9965 | 1–200 | 1 | 76.4 | 12.6 | 50 | 96.8 | 4.6 | –0.9 |
| 197 | Mepanipyrim | 1 | 0.9997 | 1–200 | 1 | 77.8 | 16.2 | 50 | 81.9 | 7.3 | 0.3 |
| 198 | Mephosfolan | 1 | 0.9992 | 1–200 | 1 | 96.1 | 9.8 | 50 | 96.1 | 3.6 | 6.5 |
| 199 | Mepronil | 1 | 0.9914 | 1–200 | 1 | 85.7 | 9.6 | 50 | 99.6 | 2.1 | 3.2 |
| 200 | Metaflumizone | 5 | 0.9991 | 5–200 | 5 | 90.2 | 11.6 | 50 | 93.6 | 3.4 | –1.7 |
| 201 | Metalaxyl | 1 | 0.9998 | 1–200 | 1 | 97.2 | 9.0 | 50 | 97.0 | 5.4 | 0.2 |
| 202 | Metamifop | 1 | 0.9995 | 1–200 | 1 | 115.5 | 19.0 | 50 | 98.3 | 5.0 | –3.4 |
| 203 | Metamitron | 5 | 0.9994 | 5–200 | 5 | 84.2 | 13.2 | 50 | 95.5 | 4.7 | –14.1 |
| 204 | Metazosulfuron | 10 | 0.9985 | 10–200 | 10 | 88.2 | 5.3 | 50 | 91.8 | 5.4 | 0.1 |
| 205 | Metconazole | 1 | 0.9993 | 1–200 | 1 | 103.7 | 8.8 | 50 | 86.5 | 5.5 | –9.2 |
| 206 | Methabenzthiazuron | 1 | 0.9996 | 1–200 | 1 | 87.0 | 11.9 | 50 | 89.4 | 4.3 | 1.9 |
| 207 | Methamidophos | 1 | 0.9977 | 1–200 | 1 | 58.6 | 17.1 | 50 | 62.8 | 6.2 | 13.8 |
| 208 | Methiocarb | 5 | 0.9939 | 5–200 | 5 | 81.9 | 13.0 | 50 | 92.8 | 4.6 | 24.6 |
| 209 | Methiocarb sulfone | 2.5 | 0.9985 | 2.5–200 | 2.5 | 92.4 | 13.3 | 50 | 97.1 | 7.5 | 15.8 |
| 210 | Methiocarb sulfoxide | 1 | 0.9973 | 1–200 | 1 | 79.9 | 7.1 | 50 | 90.9 | 6.2 | 5.5 |
| 211 | Methomyl | 1 | 0.9971 | 1–25 | 1 | 102.1 | 15.8 | 10 | 91.1 | 6.3 | 11.8 |
| 212 | Methoprotryne | 2.5 | 0.9964 | 2.5–200 | 2.5 | 73.1 | 7.3 | 50 | 81.2 | 3.0 | –3.0 |
| 213 | Methoxyfenozide | 1 | 0.9981 | 1–200 | 1 | 85.6 | 19.1 | 50 | 96.2 | 8.1 | –1.1 |
| 214 | Metobromuron | 1 | 0.9999 | 1–200 | 1 | 98.3 | 4.8 | 50 | 91.9 | 3.4 | 3.3 |
| 215 | Metolcarb | 5 | 0.9996 | 5–200 | 5 | 77.4 | 17.7 | 50 | 93.0 | 7.5 | 7.9 |
| 216 | Metominostrboin (Z) | 1 | 0.9989 | 1–200 | 1 | 94.1 | 8.6 | 50 | 100.7 | 2.4 | –0.6 |
| 217 | Metominostrobin (E) | 1 | 0.9985 | 1–200 | 1 | 92.9 | 9.8 | 50 | 99.4 | 3.8 | 1.8 |
| 218 | Metrafenon | 1 | 0.9999 | 1–200 | 1 | 89.1 | 17.9 | 50 | 90.3 | 4.5 | 2.5 |
| 219 | Mevinphos | 5 | 0.9979 | 5–200 | 5 | 33.9 | 19.3 | 50 | 56.7 | 12.4 | 1.8 |
| 220 | Monocrotophos | 5 | 0.9989 | 5–200 | 5 | 49.7 | 13.5 | 50 | 72.5 | 9.3 | –4.9 |
| 221 | Monolinuron | 1 | 0.9991 | 1–200 | 1 | 112.6 | 3.4 | 50 | 93.0 | 3.0 | 2.3 |
| 222 | Myclobutanil | 2.5 | 0.9979 | 2.5–200 | 2.5 | 109.7 | 16.3 | 50 | 96.8 | 4.7 | –5.4 |
| 223 | Napropamide | 1 | 0.9991 | 1–200 | 1 | 72.8 | 7.8 | 50 | 98.9 | 5.5 | –7.6 |
| 224 | Neburon | 2.5 | 0.9960 | 2.5–200 | 2.5 | 89.3 | 16.5 | 50 | 93.7 | 5.3 | –2.0 |
| 225 | Nicosulfuron | 2.5 | 0.9996 | 2.5–200 | 2.5 | 89.9 | 7.3 | 50 | 77.5 | 5.4 | 25.4 |
| 226 | Nitenpyram | 10 | 0.9996 | 10–200 | 10 | 76.6 | 10.9 | 50 | 86.6 | 2.8 | –16.1 |
| 227 | Norflurazon | 1 | 0.9980 | 1–200 | 1 | 97.9 | 6.8 | 50 | 103.4 | 2.6 | –1.6 |
| 228 | Noruron (Norea) | 2.5 | 0.9990 | 2.5–200 | 2.5 | 81.2 | 10.3 | 50 | 84.6 | 5.2 | 2.7 |
| 229 | Novaluron | 5 | 0.9980 | 5–200 | 5 | 95.7 | 13.6 | 50 | 100.8 | 5.0 | 0.5 |
| 230 | Nuarimol | 2.5 | 0.9997 | 2.5–200 | 2.5 | 71.8 | 16.8 | 50 | 86.8 | 4.6 | 8.5 |
| 231 | Ofurace | 1 | 0.9997 | 1–200 | 1 | 88.9 | 5.1 | 50 | 92.9 | 4.6 | 11.0 |
| 232 | Omethoate | 1 | 0.9997 | 1–200 | 1 | 77.2 | 5.9 | 50 | 89.6 | 3.7 | –10.4 |
| 233 | Oxadiazon | 2.5 | 0.9984 | 2.5–200 | 2.5 | 116.7 | 14.0 | 50 | 87.7 | 5.7 | –0.4 |
| 234 | Oxadixyl | 1 | 0.9993 | 1–200 | 1 | 100.9 | 14.4 | 50 | 99.0 | 5.1 | 6.5 |
| 235 | Oxamyl | 1 | 0.9984 | 1–200 | 1 | 89.3 | 12.1 | 50 | 96.2 | 2.6 | 4.1 |
| 236 | Oxaziclomefone | 1 | 0.9998 | 1–200 | 1 | 85.4 | 10.6 | 50 | 89.3 | 3.6 | –7.0 |
| 237 | Paclobutrazole | 2.5 | 0.9983 | 2.5–200 | 2.5 | 110.4 | 17.5 | 50 | 97.8 | 2.9 | –11.1 |
| 238 | Penconazole | 2.5 | 0.9996 | 2.5–200 | 2.5 | 73.7 | 13.2 | 50 | 89.2 | 3.3 | –7.4 |
| 239 | Pencycuron | 1 | 0.9975 | 1–200 | 1 | 78.6 | 15.9 | 50 | 93.2 | 2.7 | –0.3 |
| 240 | Penoxsulam | 2.5 | 0.9982 | 2.5–200 | 2.5 | 84.9 | 4.1 | 50 | 98.3 | 4.0 | 0.2 |
| 241 | Pentoxaone | 10 | 0.9933 | 10–200 | 10 | 76.2 | 13.4 | 50 | 78.4 | 4.8 | 1.1 |
| 242 | Phenthoate | 2.5 | 0.9976 | 2.5–200 | 2.5 | 99.9 | 11.6 | 50 | 98.3 | 6.2 | –0.2 |
| 243 | Phosalone | 2.5 | 0.9973 | 2.5–200 | 2.5 | 86.0 | 10.2 | 50 | 89.6 | 6.0 | 2.9 |
| 244 | Phosfolan | 1 | 0.9995 | 1–200 | 1 | 84.9 | 17.3 | 50 | 92.6 | 6.0 | 6.1 |
| 245 | Phosphamidon | 1 | 0.9997 | 1–200 | 1 | 104.4 | 6.9 | 50 | 90.5 | 7.3 | –1.9 |
| 246 | Phoxim | 1 | 0.9978 | 1–200 | 1 | 83.7 | 19.4 | 50 | 94.5 | 3.4 | –10.3 |
| 247 | Picolinafen | 1 | 0.9997 | 1–200 | 1 | 80.0 | 19.5 | 50 | 84.2 | 1.6 | –33.5 |
| 248 | Picoxystrobin | 2.5 | 0.9995 | 2.5–200 | 2.5 | 102.0 | 7.6 | 50 | 102.6 | 4.9 | –12.6 |
| 249 | Piperonyl butoxide | 1 | 0.9995 | 1–200 | 1 | 90.3 | 14.4 | 50 | 93.7 | 6.4 | –11.9 |
| 250 | Piperophos | 1 | 0.9992 | 1–200 | 1 | 92.2 | 8.9 | 50 | 96.2 | 6.3 | –1.4 |
| 251 | Pirimicarb | 1 | 0.9968 | 1–200 | 1 | 71.2 | 7.0 | 50 | 77.2 | 3.2 | 3.3 |
| 252 | Pirimicarb-desmethyl | 5 | 0.9996 | 5–200 | 5 | 68.1 | 11.4 | 50 | 80.1 | 10.6 | 0.4 |
| 253 | Pirimiphos-ethyl | 1 | 0.9971 | 1–200 | 1 | 86.1 | 12.1 | 50 | 89.4 | 5.0 | –17.9 |
| 254 | Pirimiphos-methyl | 1 | 0.9989 | 1–200 | 1 | 89.7 | 8.5 | 50 | 87.2 | 2.9 | –4.0 |
| 255 | Probenazole | 10 | 0.9962 | 10–200 | 10 | 101.6 | 10.4 | 50 | 103.0 | 4.8 | 3.9 |
| 256 | Prochloraz | 10 | 0.9996 | 10–200 | 10 | 74.8 | 5.5 | 50 | 78.5 | 2.1 | –2.0 |
| 257 | Profenofos | 2.5 | 0.9994 | 2.5–200 | 2.5 | 75.6 | 5.1 | 50 | 88.3 | 2.5 | –2.0 |
| 258 | Promecarb | 1 | 0.9993 | 1–200 | 1 | 90.9 | 12.2 | 50 | 92.7 | 5.1 | 1.7 |
| 259 | Prometryn | 1 | 0.9969 | 1–200 | 1 | 68.7 | 4.5 | 50 | 74.2 | 7.7 | 0.5 |
| 260 | Pronamide (Propyzamide) | 2.5 | 0.9977 | 2.5–200 | 2.5 | 98.1 | 13.0 | 50 | 95.1 | 3.4 | 4.5 |
| 261 | Propachlor | 1 | 0.9996 | 1–200 | 1 | 81.9 | 8.4 | 50 | 84.4 | 2.6 | –0.3 |
| 262 | Propamocarb | 1 | 0.9996 | 1–200 | 1 | 83.2 | 6.0 | 50 | 91.5 | 2.6 | –3.8 |
| 263 | Propanil | 5 | 0.9987 | 5–200 | 5 | 91.3 | 8.5 | 50 | 87.3 | 3.4 | –8.4 |
| 264 | Propaquizafop | 5 | 0.9996 | 5–200 | 5 | 85.2 | 7.8 | 50 | 93.1 | 1.2 | –19.8 |
| 265 | Propargite | 1 | 1.0000 | 1–200 | 1 | 88.6 | 3.9 | 50 | 90.0 | 1.9 | –9.9 |
| 266 | Propazine | 1 | 0.9993 | 1–200 | 1 | 86.1 | 16.4 | 50 | 79.9 | 9.0 | –14.8 |
| 267 | Propiconazole | 2.5 | 0.9995 | 2.5–200 | 2.5 | 92.1 | 19.6 | 50 | 89.6 | 6.1 | –5.3 |
| 268 | Propoxur | 1 | 0.9943 | 1–200 | 1 | 91.1 | 11.7 | 50 | 99.9 | 7.7 | –4.5 |
| 269 | Proqunazid | 1 | 0.9998 | 1–200 | 1 | 55.3 | 3.0 | 50 | 57.1 | 1.1 | –5.8 |
| 270 | Prosulfocarb | 1 | 0.9990 | 1–200 | 1 | 89.8 | 13.0 | 50 | 81.1 | 2.6 | 13.2 |
| 271 | Prothioconazole-desthio | 5 | 0.9992 | 5–200 | 5 | 86.7 | 14.8 | 50 | 84.4 | 5.4 | −18.4 |
| 272 | Pydiflumetofen | 2.5 | 0.9984 | 2.5–200 | 2.5 | 93.4 | 9.7 | 50 | 93.8 | 4.4 | −3.6 |
| 273 | Pyracarbolid | 1 | 0.9935 | 1–200 | 1 | 86.6 | 5.4 | 50 | 100.6 | 4.8 | 0.8 |
| 274 | Pyraclofos | 1 | 0.9993 | 1–200 | 1 | 85.8 | 8.7 | 50 | 97.8 | 4.5 | 9.3 |
| 275 | Pyraclonil | 1 | 0.9972 | 1–200 | 1 | 98.3 | 6.8 | 50 | 96.2 | 6.0 | 7.7 |
| 276 | Pyraclostrobin | 2.5 | 0.9988 | 2.5–200 | 2.5 | 103.8 | 14.7 | 50 | 97.4 | 3.6 | −15.3 |
| 277 | Pyraflufen-ethyl | 1 | 0.9974 | 1–200 | 1 | 78.4 | 16.7 | 50 | 93.6 | 6.7 | 7.3 |
| 278 | Pyraziflumid | 1 | 0.9990 | 1–200 | 1 | 115.8 | 13.9 | 50 | 97.3 | 5.4 | 9.6 |
| 279 | Pyrazolate | 5 | 0.9991 | 5–200 | 5 | 95.9 | 8.5 | 50 | 95.2 | 3.2 | 2.2 |
| 280 | Pyrazophos | 1 | 0.9972 | 1–200 | 1 | 87.5 | 7.7 | 50 | 96.4 | 3.1 | 31.6 |
| 281 | Pyribenzoxim | 2.5 | 0.9900 | 2.5–200 | 2.5 | 103.9 | 19.0 | 50 | 97.4 | 14.3 | −16.0 |
| 282 | Pyributicarb | 1 | 0.9993 | 1–200 | 1 | 87.5 | 4.3 | 50 | 84.1 | 4.4 | −14.1 |
| 283 | Pyridaben | 1 | 0.9996 | 1–200 | 1 | 74.9 | 4.0 | 50 | 77.9 | 1.9 | 1.0 |
| 284 | Pyridalyl | 10 | 0.9997 | 10–200 | 10 | 55.3 | 15.6 | 50 | 58.3 | 3.0 | −17.2 |
| 285 | Pyridaphenthion | 1 | 0.9993 | 1–200 | 1 | 91.5 | 8.2 | 50 | 101.9 | 11.6 | −0.6 |
| 286 | Pyridate | 2.5 | 0.9964 | 2.5–200 | 2.5 | 105.4 | 3.7 | 50 | 73.9 | 1.2 | 4.5 |
| 287 | Pyrifluquinazon | 2.5 | 0.9968 | 2.5–200 | 2.5 | 75.3 | 8.0 | 50 | 87.6 | 3.1 | −4.6 |
| 288 | Pyriftalid | 1 | 0.9976 | 1–200 | 1 | 86.2 | 12.0 | 50 | 97.2 | 6.4 | −4.0 |
| 289 | Pyrimethanil | 2.5 | 0.9993 | 2.5–200 | 2.5 | 64.6 | 6.7 | 50 | 58.9 | 9.5 | −1.8 |
| 290 | Pyrimidifen | 1 | 0.9993 | 1–200 | 1 | 54.6 | 16.4 | 50 | 67.0 | 3.1 | −46.0 |
| 291 | Pyriminobac (E) | 1 | 0.9975 | 1–200 | 1 | 100.2 | 8.9 | 50 | 112.6 | 5.2 | −7.9 |
| 292 | Pyriminobac (Z) | 1 | 0.9939 | 1–200 | 1 | 90.4 | 5.1 | 50 | 106.9 | 6.7 | −4.9 |
| 293 | Pyrimisulfan | 1 | 0.9998 | 1–200 | 1 | 95.1 | 11.8 | 50 | 95.2 | 6.0 | 7.4 |
| 294 | Pyriproxyfen | 1 | 0.9994 | 1–200 | 1 | 79.2 | 7.0 | 50 | 82.8 | 5.4 | −6.2 |
| 295 | Pyroquilon | 1 | 0.9994 | 1–200 | 1 | 79.2 | 19.7 | 50 | 91.3 | 5.4 | 2.6 |
| 296 | Quinalphos | 5 | 0.9964 | 5–200 | 5 | 87.5 | 11.8 | 50 | 89.8 | 2.0 | 2.0 |
| 297 | Quinoclamine | 10 | 0.9979 | 10–200 | 10 | 74.1 | 13.1 | 50 | 84.5 | 5.7 | −4.1 |
| 298 | Quizalofop-ethyl | 1 | 0.9985 | 1–200 | 1 | 70.6 | 15.1 | 50 | 88.3 | 3.0 | −3.4 |
| 299 | Saflufenacil | 2.5 | 0.9980 | 2.5–200 | 2.5 | 100.9 | 12.7 | 50 | 99.9 | 6.2 | 13.2 |
| 300 | Sethoxydim A | 2.5 | 0.9998 | 2.5–200 | 2.5 | 77.8 | 3.2 | 50 | 80.5 | 2.2 | −3.3 |
| 301 | Simazine | 1 | 0.9993 | 1–200 | 1 | 87.4 | 17.9 | 50 | 90.0 | 2.9 | 1.6 |
| 302 | Simeconazole | 2.5 | 0.9988 | 2.5–200 | 2.5 | 108.9 | 10.3 | 50 | 95.8 | 4.5 | −2.8 |
| 303 | Simetryn | 1 | 0.9998 | 1–200 | 1 | 75.6 | 9.7 | 50 | 74.2 | 4.5 | −5.4 |
| 304 | Spinetoram (J) | 1 | 0.9986 | 1–200 | 1 | 87.9 | 18.7 | 50 | 101.7 | 17.8 | −10.6 |
| 305 | Spinetoram (L) | 1 | 0.9993 | 1–200 | 1 | 90.4 | 11.5 | 50 | 102.0 | 4.0 | −7.3 |
| 306 | Spinosyn A | 1 | 0.9978 | 1–200 | 1 | 96.1 | 14.4 | 50 | 87.4 | 4.1 | −6.6 |
| 307 | Spinosyn D | 5 | 0.9995 | 5–200 | 5 | 108.7 | 10.3 | 50 | 98.8 | 3.8 | −17.0 |
| 308 | Spirodiclofen | 2.5 | 0.9998 | 2.5–200 | 2.5 | 91.3 | 4.0 | 50 | 85.1 | 1.6 | 6.9 |
| 309 | Spirotetramat | 2.5 | 0.9985 | 2.5–200 | 2.5 | 80.8 | 13.1 | 50 | 101.0 | 7.6 | 4.7 |
| 310 | Spirotetramat-enol | 1 | 0.9988 | 1–200 | 1 | 92.2 | 10.0 | 50 | 90.2 | 4.1 | 1.5 |
| 311 | Spirotetramat-enol-glucoside | 10 | 0.9933 | 10–200 | 10 | 112.2 | 6.3 | 50 | 69.2 | 4.7 | −11.6 |
| 312 | Spirotetramat-ketohydroxy | 10 | 0.9997 | 10–200 | 10 | 92.1 | 7.8 | 50 | 90.5 | 2.9 | 6.0 |
| 313 | Spirotetramat-monohydroxy | 2.5 | 0.9978 | 2.5–200 | 2.5 | 78.5 | 17.5 | 50 | 96.6 | 6.3 | −4.3 |
| 314 | Spiroxamine | 1 | 0.9986 | 1–200 | 1 | 82.5 | 7.2 | 50 | 91.5 | 4.9 | 0.6 |
| 315 | Sulfentrazone | 2.5 | 0.9951 | 2.5–200 | 2.5 | 105.8 | 9.7 | 50 | 106.7 | 4.8 | 4.7 |
| 316 | Sulfotep | 1 | 0.9982 | 1–200 | 1 | 87.4 | 17.3 | 50 | 95.6 | 3.2 | 3.0 |
| 317 | Sulfoxaflor | 1 | 0.9976 | 1–200 | 1 | 91.8 | 3.5 | 50 | 99.5 | 2.5 | 37.1 |
| 318 | Sulprofos | 2.5 | 0.9999 | 2.5–200 | 2.5 | 86.6 | 12.4 | 50 | 83.3 | 1.1 | 3.7 |
| 319 | TCMTB | 10 | 0.9993 | 10–200 | 10 | 15.8 | 18.0 | 50 | 16.1 | 4.9 | −6.7 |
| 320 | Tebuconzole | 2.5 | 0.9989 | 2.5–200 | 2.5 | 90.9 | 10.4 | 50 | 88.6 | 6.1 | 13.9 |
| 321 | Tebufenozide | 2.5 | 0.9912 | 2.5–200 | 2.5 | 97.2 | 10.6 | 50 | 103.7 | 15.1 | −15.8 |
| 322 | Tebufenpyrad | 2.5 | 0.9997 | 2.5–200 | 2.5 | 88.3 | 11.1 | 50 | 82.4 | 2.9 | −26.6 |
| 323 | Tebuthiuron | 1 | 0.9990 | 1–200 | 1 | 90.9 | 14.9 | 50 | 89.3 | 7.3 | −2.9 |
| 324 | Teflubenzuron | 1 | 0.9998 | 1–200 | 1 | 91.3 | 13.7 | 50 | 85.0 | 4.3 | 77.3 |
| 325 | Tepraloxydim | 2.5 | 0.9967 | 2.5–200 | 2.5 | 98.6 | 19.1 | 50 | 98.0 | 6.7 | −1.7 |
| 326 | Terbuthylazine | 2.5 | 0.9996 | 2.5–200 | 2.5 | 77.5 | 3.5 | 50 | 79.0 | 5.1 | −2.4 |
| 327 | Terbutryn | 10 | 0.9938 | 10–200 | 10 | 65.9 | 3.2 | 50 | 72.8 | 2.4 | 1.3 |
| 328 | Tetrachlorvinphos | 10 | 0.9999 | 10–200 | 10 | 48.2 | 7.9 | 50 | 70.1 | 8.6 | 2.6 |
| 329 | Tetraconazole | 1 | 0.9996 | 1–200 | 1 | 112.7 | 17.3 | 50 | 97.1 | 2.6 | −7.3 |
| 330 | Thenylchlor | 2.5 | 0.9990 | 2.5–200 | 2.5 | 89.9 | 9.2 | 50 | 97.4 | 3.8 | −3.8 |
| 331 | Thiabendazole | 1 | 0.9993 | 1–200 | 1 | 69.0 | 10.4 | 50 | 67.0 | 3.9 | 8.2 |
| 332 | Thiacloprid | 1 | 0.9976 | 1–200 | 1 | 89.7 | 13.5 | 50 | 102.6 | 3.6 | 9.7 |
| 333 | Thiamethoxam | 2.5 | 0.9991 | 2.5–200 | 2.5 | 71.2 | 17.7 | 50 | 97.0 | 2.1 | −5.0 |
| 334 | Thiazopyr | 2.5 | 0.9982 | 2.5–200 | 2.5 | 89.3 | 11.4 | 50 | 98.9 | 5.7 | 0.8 |
| 335 | Thidiazuron | 1 | 0.9995 | 1–200 | 1 | 76.9 | 5.2 | 50 | 79.8 | 5.3 | 14.9 |
| 336 | Thifensulfuron-methyl | 1 | 0.9998 | 1–200 | 1 | 77.9 | 13.6 | 50 | 82.8 | 1.5 | 12.0 |
| 337 | Thifluzamide | 10 | 0.9948 | 10–200 | 10 | 99.2 | 16.7 | 50 | 105.8 | 8.1 | 9.8 |
| 338 | Thiobencarb | 1 | 0.9997 | 1–200 | 1 | 96.3 | 15.4 | 50 | 80.0 | 4.6 | 5.6 |
| 339 | Thionazin | 1 | 0.9993 | 1–200 | 1 | 108.1 | 11.1 | 50 | 97.7 | 3.2 | 1.8 |
| 340 | Tiadinil | 1 | 0.9994 | 1–200 | 1 | 91.2 | 5.4 | 50 | 84.1 | 2.8 | 16.8 |
| 341 | Tolfenpyrad | 2.5 | 0.9996 | 2.5–200 | 2.5 | 83.7 | 14.0 | 50 | 84.5 | 5.5 | −13.0 |
| 342 | Triadimefon | 5 | 0.9983 | 5–200 | 5 | 88.6 | 14.7 | 50 | 97.3 | 4.0 | 3.0 |
| 343 | Triazophos | 1 | 0.9947 | 1–200 | 1 | 99.9 | 11.7 | 50 | 116.8 | 3.6 | −7.4 |
| 344 | Tricyclazole | 1 | 0.9973 | 1–200 | 1 | 79.4 | 9.1 | 50 | 84.5 | 6.8 | −0.3 |
| 345 | Trifloxystrobin | 1 | 0.9989 | 1–200 | 1 | 118.6 | 11.1 | 50 | 102.7 | 3.3 | −12.2 |
| 346 | Triflumizole | 1 | 0.9994 | 1–200 | 1 | 89.2 | 12.4 | 50 | 81.5 | 6.4 | −13.5 |
| 347 | Triflumuron | 2.5 | 0.9998 | 2.5–200 | 2.5 | 96.1 | 9.8 | 50 | 94.2 | 2.9 | −8.6 |
| 348 | Trimethacarb | 1 | 0.9998 | 1–200 | 1 | 98.3 | 7.4 | 50 | 91.2 | 2.1 | 5.1 |
| 349 | Triticonazole | 2.5 | 0.9995 | 2.5–200 | 2.5 | 75.7 | 17.3 | 50 | 92.6 | 2.2 | −6.3 |
| 350 | Uniconazole | 2.5 | 0.9990 | 2.5–200 | 2.5 | 82.8 | 9.7 | 50 | 96.7 | 8.1 | −19.3 |
| 351 | Vamidothion | 1 | 0.9987 | 1–200 | 1 | 82.2 | 8.9 | 50 | 95.0 | 7.5 | −1.1 |
| 352 | XMC | 1 | 0.9992 | 1–200 | 1 | 90.4 | 14.1 | 50 | 93.2 | 2.6 | 13.1 |
| 353 | Zoxamide | 1 | 0.9989 | 1–200 | 1 | 92.6 | 19.1 | 50 | 100.7 | 7.1 | −2.8 |
| Range | No. of Pesticides |
|---|---|
| LOQ | |
| 1 μg/kg | 187 (53.0%) |
| 2.5 μg/kg | 90 (25.5%) |
| 5 μg/kg | 37 (10.5%) |
| 10 μg/kg | 39 (11.0%) |
| Sum | 353 (100%) |
| r2 | |
| >0.990 at linear range; LOQ to 200 μg/kg | 350 (99.2%) |
| >0.990 at linear range; LOQ to 25 μg/kg | 3 (0.8%) |
| Sum | 353 (100%) |
| Recovery | |
| Low (RSD 2.3%–19.9%) | |
| 15% to 30% | 1 (0.3%) |
| 30% to 70% | 30 (8.5%) |
| 70% to 120% | 322 (91.2%) |
| >120% | 0 (0.0%) |
| Sum | 353 (100%) |
| High (RSD 0.8%–17.8%) | |
| 15% to 30% | 1 (0.3%) |
| 30% to 70% | 19 (5.4%) |
| 70% to 120% | 333 (94.3%) |
| >120% | 0 (0.0%) |
| Sum | 353 (100%) |
| Matrix Effect | |
| <−50% (Strong) | 0 (0.0%) |
| −50% to −20% (Medium) | 12 (3.4%) |
| −20% to 0% (Soft) | 164 (46.5%) |
| 0% to 20% (Soft) | 169 (47.9%) |
| 20% to 50% (Medium) | 6 (1.7%) |
| >50% (Strong) | 2 (0.6%) |
| Sum | 353 (100%) |
| Compound Name | Sample no. (μg/kg) | MRL [13] (μg/kg) | |||
|---|---|---|---|---|---|
| #3 | #6 | #9 | #10 | ||
| Flufenoxuron | 14.4 | 1.7 | -1 | - | - |
| Lufenuron | - | 220.7 | - | - | 20 |
| Noruron (Norea) | 3.4 | - | 19.4 | 21.0 | - |
Sample Availability: Samples of the compounds are not available from the authors. |
Publisher’s Note: MDPI stays neutral with regard to jurisdictional claims in published maps and institutional affiliations. |
© 2020 by the authors. Licensee MDPI, Basel, Switzerland. This article is an open access article distributed under the terms and conditions of the Creative Commons Attribution (CC BY) license (http://creativecommons.org/licenses/by/4.0/).
Share and Cite
Shin, Y.; Kim, C.J.; Baek, S.; Kim, L.; Son, K.-A.; Lee, H.-D.; Kim, D.; Kim, J.-H.; Noh, H.H. Liquid Chromatography-Tandem Mass Spectrometry for the Simultaneous Analysis of 353 Pesticides in the Edible Insect Tenebrio molitor Larvae (Mealworms). Molecules 2020, 25, 5866. https://doi.org/10.3390/molecules25245866
Shin Y, Kim CJ, Baek S, Kim L, Son K-A, Lee H-D, Kim D, Kim J-H, Noh HH. Liquid Chromatography-Tandem Mass Spectrometry for the Simultaneous Analysis of 353 Pesticides in the Edible Insect Tenebrio molitor Larvae (Mealworms). Molecules. 2020; 25(24):5866. https://doi.org/10.3390/molecules25245866
Chicago/Turabian StyleShin, Yongho, Chang Jo Kim, Sujin Baek, Leesun Kim, Kyeong-Ae Son, Hee-Dong Lee, Danbi Kim, Jeong-Han Kim, and Hyun Ho Noh. 2020. "Liquid Chromatography-Tandem Mass Spectrometry for the Simultaneous Analysis of 353 Pesticides in the Edible Insect Tenebrio molitor Larvae (Mealworms)" Molecules 25, no. 24: 5866. https://doi.org/10.3390/molecules25245866