
Molecular Spectroscopic Markers of DNA Damage


Abstract
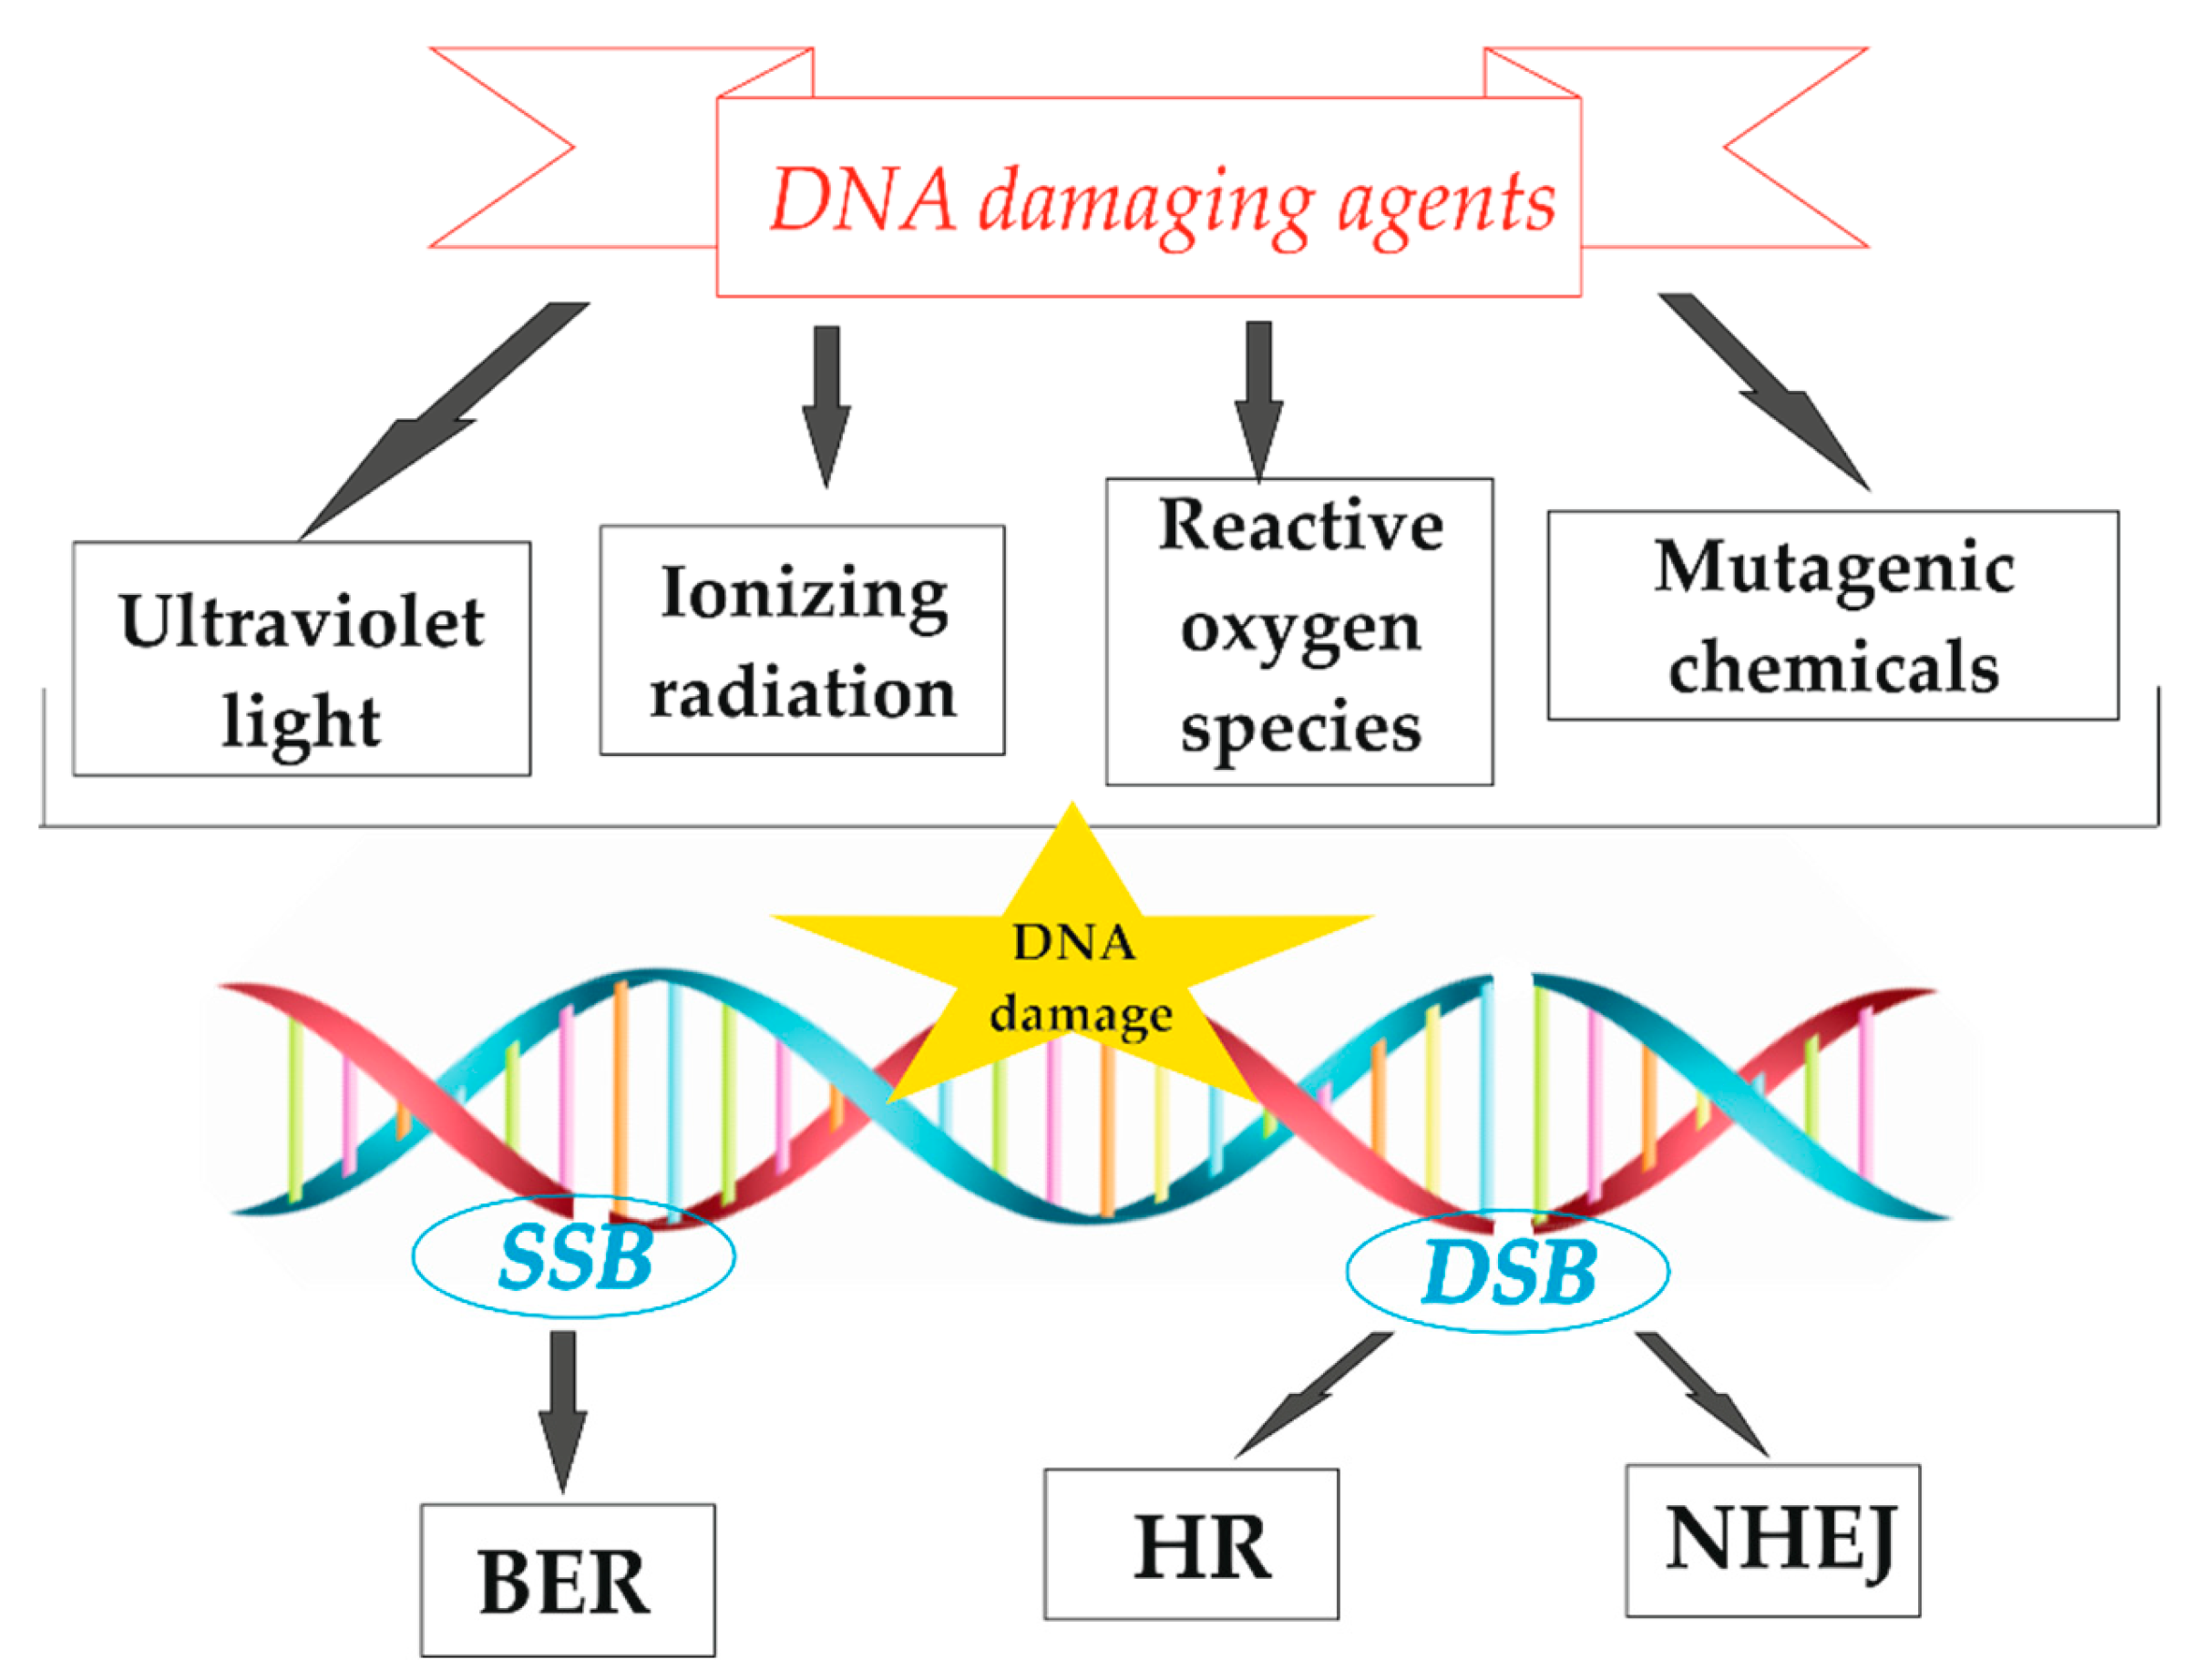
:1. Introduction
2. DNA Lesions Studied by Spectroscopic Methods
3. Nanospectroscopy of DNA Damage
2.1. SERS
2.2. TERS
4. DNA Damage at the Cellular Level
5. Conclusions
Author Contributions
Funding
Acknowledgments
Conflicts of Interest
References
- Jackson, S.P.; Bartek, J. The DNA-damage response in human biology and disease. Nature 2009, 461, 1071–1078. [Google Scholar] [CrossRef] [PubMed] [Green Version]
- Bruner, S.D.; Norman, D.P.G.; Verdine, G.L. Structural basis for recognition and repair of the endogenous mutagen 8-oxoguanine in DNA. Nature 2000, 403, 859–866. [Google Scholar] [CrossRef] [PubMed]
- Chapman, J.R.; Taylor, M.R.G.; Boulton, S.J. Playing the End Game: DNA Double-Strand Break Repair Pathway Choice. Mol. Cell 2012, 47, 497–510. [Google Scholar] [CrossRef] [PubMed] [Green Version]
- Nelms, B.E.; Maser, R.S.; MacKay, J.F.; Lagally, M.G.; Petrini, J.H.J. In situ visualization of DNA double-strand break repair in human fibroblasts. Science (80-.) 1998, 280, 590–592. [Google Scholar] [CrossRef] [Green Version]
- Thapar, R. Regulation of DNA Double-Strand Break Repair by Non-Coding RNAs. Molecules 2018, 23, 2789. [Google Scholar] [CrossRef] [Green Version]
- LeBlanc, S.J.; Gauer, J.W.; Hao, P.; Case, B.C.; Hingorani, M.M.; Weninger, K.R.; Erie, D.A. Coordinated protein and DNA conformational changes govern mismatch repair initiation by MutS. Nucleic Acids Res. 2018, 46, 10782–10795. [Google Scholar] [CrossRef]
- Wood, B.R. The importance of hydration and DNA conformation in interpreting infrared spectra of cells and tissues. Chem. Soc. Rev. 2016, 45, 1980–1998. [Google Scholar] [CrossRef]
- Dvořáková, Z.; Renčiuk, D.; Kejnovská, I.; Školáková, P.; Bednářová, K.; Sagi, J.; Vorlíčková, M. I-Motif of cytosine-rich human telomere DNA fragments containing natural base lesions. Nucleic Acids Res. 2018, 46, 1624–1634. [Google Scholar] [CrossRef] [Green Version]
- Konvalinová, H.; Dvořáková, Z.; Renčiuk, D.; Bednářová, K.; Kejnovská, I.; Trantírek, L.; Vorlíčková, M.; Sagi, J. Diverse effects of naturally occurring base lesions on the structure and stability of the human telomere DNA quadruplex. Biochimie 2015, 118, 15–25. [Google Scholar] [CrossRef]
- Wang, Y.; Zhao, H.; Yang, C.; Jie, J.; Dai, X.; Zhou, Q.; Liu, K.; Song, D.; Su, H. Degradation of Cytosine Radical Cations in 2′-Deoxycytidine and in i-Motif DNA: Hydrogen-Bonding Guided Pathways. J. Am. Chem. Soc. 2019, 141, 1970–1979. [Google Scholar] [CrossRef]
- Hoeijmakers, J.H.J. Genome maintenance mechanisms for preventing cancer. Nature 2001, 411, 366–374. [Google Scholar] [CrossRef] [PubMed]
- Wang, C.; Lees-Miller, S.P. Detection and repair of ionizing radiation-induced dna double strand breaks: New developments in nonhomologous end joining. Int. J. Radiat. Oncol. Biol. Phys. 2013, 86, 440–449. [Google Scholar] [CrossRef] [PubMed] [Green Version]
- Vilenchik, M.M.; Knudson, A.G. Endogenous DNA double-strand breaks: Production, fidelity of repair, and induction of cancer. Proc. Natl. Acad. Sci. USA 2003, 100, 12871–12876. [Google Scholar] [CrossRef] [PubMed] [Green Version]
- Mehta, A.; Haber, J.E. Sources of DNA double-strand breaks and models of recombinational DNA repair. Cold Spring Harb. Perspect. Biol. 2014, 6. [Google Scholar] [CrossRef] [PubMed] [Green Version]
- Lipiec, E.; Sekine, R.; Bielecki, J.; Kwiatek, W.M.; Wood, B.R. Molecular characterization of DNA double strand breaks with tip-enhanced Raman scattering. Angew. Chemie - Int. Ed. 2014, 53, 169–172. [Google Scholar] [CrossRef] [Green Version]
- Goodarzi, A.A.; Jeggo, P.A. The Repair and Signaling Responses to DNA Double-Strand Breaks. In Advances in Genetics; Academic Press Inc.: Cambridge, MA, USA, 2013; Volume 82, pp. 1–45. [Google Scholar]
- Higo, T.; Naito, A.T.; Sumida, T.; Shibamoto, M.; Okada, K.; Nomura, S.; Nakagawa, A.; Yamaguchi, T.; Sakai, T.; Hashimoto, A.; et al. DNA single-strand break-induced DNA damage response causes heart failure. Nat. Commun. 2017, 8. [Google Scholar] [CrossRef]
- Rastogi, R.P.; Richa; Kumar, A.; Tyagi, M.B.; Sinha, R.P. Molecular mechanisms of ultraviolet radiation-induced DNA damage and repair. J. Nucleic Acids 2010, 2010. [Google Scholar] [CrossRef] [Green Version]
- Cannan, W.J.; Pederson, D.S. Mechanisms and Consequences of Double-Strand DNA Break Formation in Chromatin. J. Cell. Physiol. 2016, 231, 3–14. [Google Scholar] [CrossRef] [Green Version]
- Chen, L.; Trujillo, K.; Sung, P.; Tomkinson, A.E. Interactions of the DNA ligase IV-XRCC4 complex with DNA ends and the DNA-dependent protein kinase. J. Biol. Chem. 2000, 275, 26196–26205. [Google Scholar] [CrossRef] [Green Version]
- San Filippo, J.; Sung, P.; Klein, H. Mechanism of Eukaryotic Homologous Recombination. Annu. Rev. Biochem. 2008, 77, 229–257. [Google Scholar] [CrossRef] [Green Version]
- Ochi, T.; Gu, X.; Blundell, T.L. Structure of the catalytic region of DNA ligase IV in complex with an artemis fragment sheds light on double-strand break repair. Structure 2013, 21, 672–679. [Google Scholar] [CrossRef] [Green Version]
- Davis, A.J.; Chen, D.J. DNA double strand break repair via non-homologous end-joining. Transl. Cancer Res. 2013, 2, 130–143. [Google Scholar]
- Pfeiffer, P. Mechanisms of DNA double-strand break repair and their potential to induce chromosomal aberrations. Mutagenesis 2000, 15, 289–302. [Google Scholar] [CrossRef]
- Lieber, M.R. The Mechanism of Double-Strand DNA Break Repair by the Nonhomologous DNA End-Joining Pathway. Annu. Rev. Biochem. 2010, 79, 181–211. [Google Scholar] [CrossRef] [Green Version]
- Mladenov, E.; Iliakis, G. Induction and repair of DNA double strand breaks: The increasing spectrum of non-homologous end joining pathways. Mutat. Res. - Fundam. Mol. Mech. Mutagen. 2011, 711, 61–72. [Google Scholar] [CrossRef]
- Fishel, R. Mismatch repair. J. Biol. Chem. 2015, 290, 26395–26403. [Google Scholar] [CrossRef] [Green Version]
- Allen, D.J.; Makhov, A.; Grilley, M.; Taylor, J.; Thresher, R.; Modrich, P.; Griffith, J.D. MutS mediates heteroduplex loop formation by a translocation mechanism. EMBO J. 1997, 16, 4467–4476. [Google Scholar] [CrossRef] [Green Version]
- Jia, Y.; Bi, L.; Li, F.; Chen, Y.; Zhang, C.; Zhang, X. α-Shaped DNA loops induced by MutS. Biochem. Biophys. Res. Commun. 2008, 372, 618–622. [Google Scholar] [CrossRef]
- Josephs, E.A.; Zheng, T.; Marszalek, P.E. Atomic force microscopy captures the initiation of methyl-directed DNA mismatch repair. DNA Repair (Amst) 2015, 35, 71–84. [Google Scholar] [CrossRef] [Green Version]
- Jiang, Y.; Marszalek, P.E. Atomic force microscopy captures MutS tetramers initiating DNA mismatch repair. EMBO J. 2011, 30, 2881–2893. [Google Scholar] [CrossRef] [Green Version]
- Shaw, C.P.; Jirasek, A. The use of ultraviolet resonance raman spectroscopy in the analysis of ionizing-radiation-induced damage in dna. Appl. Spectrosc. 2009, 63, 412–422. [Google Scholar] [CrossRef] [PubMed]
- Sanche, L. Low energy electron-driven damage in biomolecules. Eur. Phys. J. D 2005, 35, 367–390. [Google Scholar] [CrossRef]
- Valota, A.; Ballarini, F.; Friedland, W.; Jacob, P.; Ottolenghi, A.; Paretzke, H.G. Modelling study on the protective role of OH radical scavengers and DNA higher-order structures in induction of single- and double-strand break by gamma-radiation. Int. J. Radiat. Biol. 2003, 79, 643–653. [Google Scholar] [CrossRef] [PubMed]
- Prise, K.M.; Ahnström, G.; Belli, M.; Carlsson, J.; Frankenberg, D.; Kiefer, J.; Löbrich, M.; Michael, B.D.; Nygren, J.; Simone, G.; et al. A review of dsb induction data for varying quality radiations. Int. J. Radiat. Biol. 1998, 74, 173–184. [Google Scholar] [CrossRef] [PubMed]
- Chang, P.W.; Zhang, Q.M.; Takatori, K.; Tachibana, A.; Yonei, S. Increased sensitivity to sparsely ionizing radiation due to excessive base excision in clustered DNA damage sites in Escherichia coli. Int. J. Radiat. Biol. 2005, 81, 115–123. [Google Scholar] [CrossRef] [PubMed]
- Zhou, D.; Ke, W. Raman spectroscopic study on the influence of ultraviolet radiation on calf thymus DNA in aqueous solution. Spectrosc. Spectr. Anal. 2004, 24, 1370–1372. [Google Scholar]
- Sailer, K.; Viaggi, S.; Nüsse, M. Radiation-induced structural modifications in dsDNA analysed by FT-Raman spectroscopy. Int. J. Radiat. Biol. 1996, 69, 601–613. [Google Scholar] [CrossRef]
- Treffer, R.; Lin, X.; Bailo, E.; Deckert-Gaudig, T.; Deckert, V. Distinction of nucleobases - A tip-enhanced Raman approach. Beilstein J. Nanotechnol. 2011, 2, 628–637. [Google Scholar] [CrossRef] [Green Version]
- Auner, A.W.; Thomas, J.C. Double-Stranded DNA Damage Assessed with Raman Spectroscopy. Biochem Anal Biochem 2016, 5, 284–291. [Google Scholar]
- Povirk, L.F. DNA damage and mutagenesis by radiomimetic DNA-cleaving agents: Bleomycin, neocarzinostatin and other enediynes. Mutat. Res. - Fundam. Mol. Mech. Mutagen. 1996, 355, 71–89. [Google Scholar] [CrossRef]
- Arai, M.; Sato, H.; Kobayashi, H.; Suganuma, M.; Kawabe, T.; Tomoda, H.; Omura, S. Selective inhibition of bleomycin-induced G2 cell cycle checkpoint by simaomicin α. Biochem. Biophys. Res. Commun. 2004, 317, 817–822. [Google Scholar] [CrossRef]
- Weiss, A.; Wiskocil, R.L.; Stobo, J.D. The role of T3 surface molecules in the activation of human T cells: A two-stimulus requirement for IL 2 production reflects events occurring at a pre-translational level. J. Immunol. 1984, 133, 123–128. [Google Scholar] [CrossRef] [Green Version]
- Serban, D.; Benevides, J.M.; Thomas, G.J. DNA Secondary Structure and Raman Markers of Supercoiling in Escherichia coli Plasmid pUC19. Biochemistry 2002, 41, 847–853. [Google Scholar] [CrossRef] [PubMed]
- Benevides, J.M.; Serban, D.; Thomas, G.J. Structural Perturbations Induced in Linear and Circular DNA by the Architectural Protein HU from Bacillus stearothermophilus. Biochemistry 2006, 45, 5359–5366. [Google Scholar] [CrossRef]
- Beć, K.B.; Grabska, J.; Czarnecki, M.A.; Huck, C.W.; Wójcik, M.J.; Nakajima, T.; Ozaki, Y. IR Spectra of Crystalline Nucleobases: Combination of Periodic Harmonic Calculations with Anharmonic Corrections Based on Finite Models. J. Phys. Chem. B 2019, 123, 10001–10013. [Google Scholar] [CrossRef] [PubMed]
- Ghosh, D.; Dey, S.K.; Saha, C. Mutation Induced Conformational Changes in Genomic DNA from Cancerous K562 Cells Influence Drug-DNA Binding Modes. PLoS ONE 2014, 9, 84880. [Google Scholar] [CrossRef] [PubMed] [Green Version]
- Al-Jorani, K.; Rüther, A.; Martin, M.; Haputhanthri, R.; Deacon, G.B.; Li, H.L.; Wood, B.R. The Application of ATR-FTIR Spectroscopy and the Reversible DNA Conformation as a Sensor to Test the Effectiveness of Platinum(II) Anticancer Drugs. Sensors 2018, 18, 4297. [Google Scholar] [CrossRef] [Green Version]
- Batista De Carvalho, A.L.M.; Mamede, A.P.; Dopplapudi, A.; Garcia Sakai, V.; Doherty, J.; Frogley, M.; Cinque, G.; Gardner, P.; Gianolio, D.; Batista De Carvalho, L.A.E.; et al. Anticancer drug impact on DNA-a study by neutron spectroscopy coupled with synchrotron-based FTIR and EXAFS. Phys. Chem. Chem. Phys. 2019, 21, 4162–4175. [Google Scholar] [CrossRef] [Green Version]
- Olsztyńska-Janus, S.; Gasior-Głogowska, M.; Szymborska-Małek, K.; Komorowska, M.; Witkiewicz, W.; Pezowicz, C.; Szotek, S.; Kobielarz, M. Spectroscopic techniques in the study of human tissues and their components. part II: Raman spectroscopy. Acta Bioeng. Biomech. 2012, 14, 121–133. [Google Scholar] [PubMed]
- Duguid, J.G.; Bloomfield, V.A.; Benevides, J.M.; Thomas, G.J. Raman spectroscopy of DNA-metal complexes. II. The thermal denaturation of DNA in the presence of Sr2+, Ba2+, Mg2+, Ca2+, Mn2+, Co2+, Ni2+, and Cd2+. Biophys. J. 1995, 69, 2623–2641. [Google Scholar] [CrossRef] [Green Version]
- Prescott, B.; Steinmetz, W.; Thomas, G.J. Characterization of DNA structures by laser Raman spectroscopy. Biopolymers 1984, 23, 235–256. [Google Scholar] [CrossRef] [PubMed]
- Taillandier, E.; Liquier, J.; Ghomi, M. Conformational transitions of nucleic acids studied by IR and Raman spectroscopies. J. Mol. Struct. 1989, 214, 185–211. [Google Scholar] [CrossRef]
- Guan, Y.; Thomas, G.J. Vibrational analysis of nucleic acids. III. Conformation-dependent Raman markers of the phosphodiester backbone modeled by dimethyl phosphate. J. Mol. Struct. 1996, 379, 31–41. [Google Scholar] [CrossRef]
- Guan, Y.; Thomas, G.J. Vibrational analysis of nucleic acids. IV. Normal modes of the DNA phosphodiester structure modeled by diethyl phosphate. Biopolymers 1996, 39, 813–835. [Google Scholar] [CrossRef]
- Deng, H.; Bloomfield, V.A.; Benevides, J.M.; Thomas, G.J. Dependence of the raman signature of genomic B-DNA on nucleotide base sequence. Biopolymers 1999, 50, 656–666. [Google Scholar] [CrossRef]
- Tang, Y.L.; Guo, Z.Y. Raman spectroscopic analysis of the effect of ultraviolet irradiation on calf thymus DNA. Acta Biochim. Biophys. Sin. (Shanghai) 2005, 37, 39–46. [Google Scholar] [CrossRef] [Green Version]
- Ke, W.; Zhou, D.; Wu, J. Effects of UV irradiation on calf thymus DNA in aqueous solution. A Raman spectroscopic study. J. Raman Spectrosc. 2005, 36, 39–44. [Google Scholar] [CrossRef]
- Benevides, J.M.; Overman, S.A.; Thomas, G.J. Raman, polarized Raman and ultraviolet resonance Raman spectroscopy of nucleic acids and their complexes. J. Raman Spectrosc. 2005, 36, 279–299. [Google Scholar] [CrossRef]
- Synytsya, A.; Alexa, P.; de Boer, J.; Loewe, M.; Moosburger, M.; Wurkner, M.; Volka, K. Raman spectroscopic study of calf thymus DNA:an effect of proton - and irradiation. J. Raman Spectrosc. 2007, 38, 1406–1415. [Google Scholar] [CrossRef]
- Ke, W.; Yu, D.; Wu, J. Raman spectroscopic study of the influence on herring sperm DNA of heat treatment and ultraviolet radiation. Spectrochim. Acta - Part A Mol. Biomol. Spectrosc. 1999, 55, 1081–1090. [Google Scholar] [CrossRef]
- Jang, N.H. The coordination chemistry of DNA nucleosides on gold nanoparticles as a probe by SERS. Bull. Korean Chem. Soc. 2002, 23, 1790–1800. [Google Scholar]
- Movileanu, L.; Benevides, J.M.; Thomas, G.J. Temperature dependence of the raman spectrum of DNA. II. Raman signatures of premelting and melting transitions of poly(dA)·poly(dT) and comparison with poly(dA-dT)·poly(dA-dT)*. Biopolymers 2002, 63, 181–194. [Google Scholar] [CrossRef] [PubMed]
- Chapman, A.C.; Thirlwell, L.E. Spectra of phosphorus compounds-I the infra-red spectra of orthophosphates. Spectrochim. Acta 1964, 20, 937–947. [Google Scholar] [CrossRef]
- Rudbeck, M.E.; Kumar, S.; Mroginski, M.-A.; Lill, S.O.N.; Blomberg, M.R.A.; Barth, A. Infrared Spectrum of Phosphoenol Pyruvate: Computational and Experimental Studies. J. Phys. Chem. A 2009, 113, 2935–2942. [Google Scholar] [CrossRef]
- Zhu, J.; Zhang, Y.; Wu, L.; Wang, Z.; Sun, Z. Dependence of surface-enhanced Raman scattering from Calf thymus DNA on anions. Chin. Opt. Lett. 2008, 6, 526–529. [Google Scholar]
- Badr, Y.; Mahmoud, M.A. Effect of silver nanowires on the surface-enhanced Raman spectra (SERS) of the RNA bases. Spectrochim. Acta - Part A Mol. Biomol. Spectrosc. 2006, 63, 639–645. [Google Scholar] [CrossRef]
- Escobar, R.; Carmona, P.; Molina, M. Raman spectroscopic determination of thymidine nucleoside structures in nucleotides. Analyst 1996, 121, 105–109. [Google Scholar] [CrossRef]
- Thomas, G.J.; Benevides, J.M.; Overman, S.A.; Ueda, T.; Ushizawa, K.; Saitoh, M.; Tsuboi, M. Polarized Raman spectra of oriented fibers of A DNA and B DNA: Anisotropic and isotropic local Raman tensors of base and backbone vibrations. Biophys. J. 1995, 68, 1073–1088. [Google Scholar] [CrossRef] [Green Version]
- Ke, W.; Zhou, D.; Wu, J.; Ji, K. Surface-Enhanced Raman Spectra of Calf Thymus DNA Adsorbed on Concentrated Silver Colloid. Appl. Spectrosc. 2005, 59, 418–423. [Google Scholar] [CrossRef]
- Rasmussen, A.; Deckert, V. Surface- and tip-enhanced Raman scattering of DNA components. J. Raman Spectrosc. 2006, 37, 311–317. [Google Scholar] [CrossRef]
- Green, M.; Liu, F.M.; Cohen, L.; Köllensperger, P.; Cass, T. SERS platforms for high density DNA arrays. Faraday Discuss. 2006, 132, 269–280. [Google Scholar]
- Ghosh, D.; Hossain, M.; Saha, C.; Dey, S.K.; Kumar, G.S. Intercalation and Induction of Strand Breaks by Adriamycin and Daunomycin: A Study with Human Genomic DNA. DNA Cell Biol. 2012, 31, 378–387. [Google Scholar] [CrossRef] [PubMed]
- Tewey, K.M.; Rowe, T.C.; Yang, L.; Halligan, B.D.; Liu, L.F. Adriamycin-induced DNA damage mediated by mammalian DNA topoisomerase II. Science (80-.) 1984, 226, 466–468. [Google Scholar] [CrossRef] [PubMed]
- Adam, S.; Bourtayre, P.; Liquier, J.; Taboury, J.A.; Taillandier, E. Poly[d(A-T)-Cs+] conformations studied by IR spectroscopy. Biopolymers 1987, 26, 251–260. [Google Scholar] [CrossRef] [PubMed]
- Cherng, J.Y. Investigation of DNA spectral conformational changes and polymer buffering capacity in relation to transfection efficiency of DNA/polymer complexes. J. Pharm. Pharm. Sci. 2009, 12, 346–356. [Google Scholar] [CrossRef]
- Chen, C.; Liu, W.; Tian, S.; Hong, T. Novel surface-enhanced raman spectroscopy techniques for DNA, protein and drug detection. Sensors 2019, 19, 1712. [Google Scholar] [CrossRef] [Green Version]
- Guselnikova, O.; Trelin, A.; Skvortsova, A.; Ulbrich, P.; Postnikov, P.; Pershina, A.; Sykora, D.; Svorcik, V.; Lyutakov, O. Label-free surface-enhanced Raman spectroscopy with artificial neural network technique for recognition photoinduced DNA damage. Biosens. Bioelectron. 2019, 145, 111718. [Google Scholar] [CrossRef]
- Ou, L.; Chen, Y.; Su, Y.; Zou, C.; Chen, Z. Detection of Genomic DNA Damage from Radiated Nasopharyngeal Carcinoma Cells Using Surface-Enhanced Raman Spectroscopy (SERS). Appl. Spectrosc. 2016, 70, 1821–1830. [Google Scholar] [CrossRef]
- He, Z.; Han, Z.; Kizer, M.; Linhardt, R.J.; Wang, X.; Sinyukov, A.M.; Wang, J.; Deckert, V.; Sokolov, A.V.; Hu, J.; et al. Tip-Enhanced Raman Imaging of Single-Stranded DNA with Single Base Resolution. J. Am. Chem. Soc. 2019, 141, 753–757. [Google Scholar] [CrossRef]
- Stöckle, R.M.; Suh, Y.D.; Deckert, V.; Zenobi, R. Nanoscale chemical analysis by tip-enhanced Raman spectroscopy. Chem. Phys. Lett. 2000, 318, 131–136. [Google Scholar] [CrossRef]
- Lipiec, E.W.; Wood, B.R. Tip-Enhanced Raman Scattering: Principles, Instrumentation, and the Application toe Biological Systems. In Encyclopedia of Analytical Chemistry; John Wiley & Sons, Ltd.: Hoboken, NJ, USA, 2017; pp. 1–26. [Google Scholar]
- Novotny, L.; Van Hulst, N. Antennas for light. Nat. Photonics 2011, 5, 83–90. [Google Scholar] [CrossRef]
- Zhang, R.; Zhang, Y.; Dong, Z.C.; Jiang, S.; Zhang, C.; Chen, L.G.; Zhang, L.; Liao, Y.; Aizpurua, J.; Luo, Y.; et al. Chemical mapping of a single molecule by plasmon-enhanced Raman scattering. Nature 2013, 498, 82–86. [Google Scholar] [CrossRef] [PubMed]
- Liao, M.; Jiang, S.; Hu, C.; Zhang, R.; Kuang, Y.; Zhu, J.; Zhang, Y.; Dong, Z. Tip-Enhanced Raman Spectroscopic Imaging of Individual Carbon Nanotubes with Subnanometer Resolution. Nano Lett. 2016, 16, 4040–4046. [Google Scholar] [CrossRef] [PubMed]
- Panikkanvalappil, S.R.; Mahmoud, M.A.; MacKey, M.A.; El-Sayed, M.A. Surface-enhanced raman spectroscopy for real-time monitoring of reactive oxygen species-induced DNA damage and its prevention by platinum nanoparticles. ACS Nano 2013, 7, 7524–7533. [Google Scholar] [CrossRef] [PubMed]
- Andrade, P.O.; Bitar, R.A.; Yassoyama, K.; Martinho, H.; Santo, A.M.E.; Bruno, P.M.; Martin, A.A. Study of normal colorectal tissue by FT-Raman spectroscopy. Anal. Bioanal. Chem. 2007, 387, 1643–1648. [Google Scholar] [CrossRef] [PubMed]
- Segers-Nolten, G.M.J.; Sijtsema, N.M.; Otto, C. Evidence for Hoogsteen GC base pairs in the proton-induced transition from right-handed to left-handed poly(dG-dC)·poly(dG-dC). Biochemistry 1997, 36, 13241–13247. [Google Scholar] [CrossRef] [PubMed]
- Marzilli, L.G.; Saad, J.S.; Kuklenyik, Z.; Keating, K.A.; Xu, Y. Relationship of solution and protein-bound structures of DNA duplexes with the major intrastrand cross-link lesions formed on cisplatin binding to DNA. J. Am. Chem. Soc. 2001, 123, 2764–2770. [Google Scholar] [CrossRef] [PubMed]
- Sinha, R.P.; Häder, D.P. UV-induced DNA damage and repair: A review. Photochem. Photobiol. Sci. 2002, 1, 225–236. [Google Scholar] [CrossRef]
- Pagba, C.V.; Lane, S.M.; Wachsmann-Hogiu, S. Conformational changes in quadruplex oligonucleotide structures probed by Raman spectroscopy. Biomed. Opt. Express 2011, 2, 207. [Google Scholar] [CrossRef] [Green Version]
- Steenken, S.; Jovanovic, S.V. How easily oxidizable is DNA? One-electron reduction potentials of adenosine and guanosine radicals in aqueous solution. J. Am. Chem. Soc. 1997, 119, 617–618. [Google Scholar] [CrossRef]
- Cadet, J.; Delatour, T.; Douki, T.; Gasparutto, D.; Pouget, J.P.; Ravanat, J.L.; Sauvaigo, S. Hydroxyl radicals and DNA base damage. Mutat. Res. - Fundam. Mol. Mech. Mutagen. 1999, 424, 9–21. [Google Scholar] [CrossRef]
- Nishimura, Y.; Tsuboi, M.; Sato, T. Structure-spectrum correlations in nucleic acids. I. Raman lines in the 600-700 cm-1 range of guanosine residue. Nucleic Acids Res. 1984, 12, 6901–6908. [Google Scholar] [CrossRef] [PubMed] [Green Version]
- Yue, J.; Shen, Y.; Liang, L.; Guan, X.; Zhang, X.; Xu, S.; Liang, C.; Shi, W.; Xu, W. Tracing the molecular dynamics of living mitochondria under phototherapy via surface-enhanced Raman scattering spectroscopy. Analyst 2019, 144, 5521–5527. [Google Scholar] [CrossRef] [PubMed]
- Ponkumar, S.; Duraisamy, P.; Iyandurai, N. Structural Analysis of DNA Interactions with Magnesium Ion Studied by Raman Spectroscopy. Am. J. Biochem. Biotechnol. 2011, 7, 135–140. [Google Scholar]
- Muntean, C.M.; Leopold, N.; Halmagyi, A.; Valimareanu, S. Surface-enhanced Raman spectroscopy of DNA from leaves of in vitro grown apple plants. J. Raman Spectrosc. 2011, 42, 844–850. [Google Scholar] [CrossRef]
- Chan, J.W.; Taylor, D.S.; Zwerdling, T.; Lane, S.M.; Ihara, K.; Huser, T. Micro-raman spectroscopy detects individual neoplastic and normal hematopoietic cells. Biophys. J. 2006, 90, 648–656. [Google Scholar] [CrossRef] [Green Version]
- Chan, J.W.; Taylor, D.S.; Thompson, D.L. The effect of cell fixation on the discrimination of normal and leukemia cells with laser tweezers Raman spectroscopy. Biopolymers 2009, 91, 132–139. [Google Scholar] [CrossRef]
- Spadavecchia, J.; Perumal, R.; Casale, S.; Krafft, J.M.; Methivier, C.; Pradier, C.M. Polyethylene glycol gold-nanoparticles: Facile nanostructuration of doxorubicin and its complex with DNA molecules for SERS detection. Chem. Phys. Lett. 2016, 648, 182–188. [Google Scholar] [CrossRef] [Green Version]
- Beljebbar, A.; Sockalingum, G.D.; Angiboust, J.F.; Manfait, M. Comparative FT SERS, resonance Raman and SERRS studies of doxorubicin and its complex with DNA. Spectrochim. Acta Part A Mol. Spectrosc. 1995, 51, 2083–2090. [Google Scholar] [CrossRef]
- Kang, B.; Afifi, M.M.; Austin, L.A.; El-Sayed, M.A. Exploiting the nanoparticle plasmon effect: Observing drug delivery dynamics in single cells via Raman/fluorescence imaging spectroscopy. ACS Nano 2013, 7, 7420–7427. [Google Scholar] [CrossRef]
- Masetti, M.; Xie, H.N.; Krpetić, Ž.; Recanatini, M.; Alvarez-Puebla, R.A.; Guerrini, L. Revealing DNA interactions with exogenous agents by surface-enhanced raman scattering. J. Am. Chem. Soc. 2015, 137, 469–476. [Google Scholar] [CrossRef]
- Vrána, O.; Mašek, V.; Dražan, V.; Brabec, V. Raman spectroscopy of DNA modified by intrastrand cross-links of antitumor cisplatin. J. Struct. Biol. 2007, 159, 1–8. [Google Scholar] [CrossRef] [PubMed]
- Giese, B.; McNaughton, D. Interaction of Anticancer Drug Cisplatin with Guanine: Density Functional Theory and Surface-Enhanced Raman Spectroscopy Study. Biopolym. - Biospectroscopy Sect. 2003, 72, 472–489. [Google Scholar] [CrossRef] [PubMed]
- Ou, L.; Chen, Y.; Su, Y.; Huang, Y.; Chen, R.; Lei, J. Application of silver nanoparticle-based SERS spectroscopy for DNA analysis in radiated nasopharyngeal carcinoma cells. J. Raman Spectrosc. 2013, 44, 680–685. [Google Scholar] [CrossRef]
- Ilkhani, H.; Hughes, T.; Li, J.; Zhong, C.J.; Hepel, M. Nanostructured SERS-electrochemical biosensors for testing of anticancer drug interactions with DNA. Biosens. Bioelectron. 2016, 80, 257–264. [Google Scholar] [CrossRef]
- Chul, J.L.; Jae, S.K.; Mak, S.K.; Kwang, P.L.; Mu, S.L. The study of doxorubicin and its complex with DNA by SERS and UV-resonance Raman spectroscopy. Bull. Korean Chem. Soc. 2004, 25, 1211–1216. [Google Scholar]
- Morjani, H.; Sharonov, S.; Manfait, M.; Sokolov, K.; Nabiev, I. SERS and micro-sers analysis of doxorubicin interaction in vitro and in living human cancer cells. In Proceedings of the Proceedings of the Annual International Conference of the IEEE Engineering in Medicine and Biology Society, Paris, France, 29 October–1 November 1992; Institute of Electrical and Electronics Engineers Inc.: Piscataway, NJ, USA, 1992; Volume 1, pp. 330–331. [Google Scholar]
- Barhoumi, A.; Zhang, D.; Tam, F.; Halas, N.J. Surface-enhanced raman spectroscopy of DNA. J. Am. Chem. Soc. 2008, 130, 5523–5529. [Google Scholar] [CrossRef]
- Harrigan, G.G.; Goodacre, R. (Eds.) Metabolic Profiling: Its Role in Biomarker Discovery and Gene Function Analysis; Springer: New York, NY, USA, 2003; ISBN 978-1-4615-0333-0. [Google Scholar]
- Lipiec, E.; Bambery, K.R.; Heraud, P.; Kwiatek, W.M.; McNaughton, D.; Tobin, M.J.; Vogel, C.; Wood, B.R. Monitoring uvr induced damage in single cells and isolated nuclei using sr-ftir microspectroscopy and 3d confocal raman imaging. Analyst 2014, 139, 4200–4209. [Google Scholar] [CrossRef]
- Pozzi, D.; Grimaldi, P.; Gaudenzi, S.; Di Giambattista, L.; Silvestri, I.; Morrone, S.; Castellano, A.C. UVB-Radiation-Induced Apoptosis in Jurkat Cells: A Coordinated Fourier Transform Infrared Spectroscopy-Flow Cytometry Study. Radiat. Res. 2007, 168, 698–705. [Google Scholar] [CrossRef] [Green Version]
- Lipiec, E.; Bambery, K.R.; Lekki, J.; Tobin, M.J.; Vogel, C.; Whelan, D.R.; Wood, B.R.; Kwiatek, W.M. SR-FTIR Coupled with Principal Component Analysis Shows Evidence for the Cellular Bystander Effect. Radiat. Res. 2015, 184, 73–82. [Google Scholar] [CrossRef]
- Lipiec, E.; Birarda, G.; Kowalska, J.; Lekki, J.; Vaccari, L.; Wiecheć, A.; Wood, B.R.; Kwiatek, W.M. A new approach to studying the effects of ionising radiation on single cells using FTIR synchrotron microspectroscopy. Radiat. Phys. Chem. 2013, 93, 135–141. [Google Scholar] [CrossRef]
- Lipiec, E.; Bambery, K.R.; Heraud, P.; Hirschmugl, C.; Lekki, J.; Kwiatek, W.M.; Tobin, M.J.; Vogel, C.; Whelan, D.; Wood, B.R. Synchrotron FTIR shows evidence of DNA damage and lipid accumulation in prostate adenocarcinoma PC-3 cells following proton irradiation. J. Mol. Struct. 2014, 1073, 134–141. [Google Scholar] [CrossRef]
- Gault, N.; Lefaix, J.-L. Infrared Microspectroscopic Characteristics of Radiation-Induced Apoptosis in Human Lymphocytes. Radiat. Res. 2003, 160, 238–250. [Google Scholar] [CrossRef]
- Meade, A.D.; Clarke, C.; Byrne, H.J.; Lyng, F.M. Fourier transform infrared microspectroscopy and multivariate methods for radiobiological dosimetry. Radiat. Res. 2010, 173, 225–237. [Google Scholar] [CrossRef]
- Lipiec, E.; Wood, B.R.; Kulik, A.; Kwiatek, W.M.; Dietler, G. Nanoscale Investigation into the Cellular Response of Glioblastoma Cells Exposed to Protons. Anal. Chem. 2018, 90, 7644–7650. [Google Scholar] [CrossRef]
- Fale, P.L.; Altharawi, A.; Chan, K.L.A. In situ Fourier transform infrared analysis of live cells’ response to doxorubicin. Biochim. Biophys. Acta - Mol. Cell Res. 2015, 1853, 2640–2648. [Google Scholar] [CrossRef] [Green Version]
- Altharawi, A.; Rahman, K.M.; Chan, K.L.A. Towards identifying the mode of action of drugs using live-cell FTIR spectroscopy. Analyst 2019, 144, 2725–2735. [Google Scholar] [CrossRef] [Green Version]
- Huang, H.; Shi, H.; Feng, S.; Chen, W.; Yu, Y.; Lin, D.; Chen, R. Confocal Raman spectroscopic analysis of the cytotoxic response to cisplatin in nasopharyngeal carcinoma cells. Anal. Methods 2013, 5, 260–266. [Google Scholar] [CrossRef]
- Shirazi, F.; Wong, P.; Goe, R. Interaction of Cisplatin with Cellular Macromolecules: A Fourier Transform Infrared Spectroscopy Study. Iran. J. Pharm. Res. 2010, 0, 11–15. [Google Scholar]
- Jimenez-Hernandez, M.; Brown, M.D.; Hughes, C.; Clarke, N.W.; Gardner, P. Characterising cytotoxic agent action as a function of the cell cycle using fourier transform infrared microspectroscopy. Analyst 2015, 140, 4453–4464. [Google Scholar] [CrossRef]
- Di Giambattista, L.; Grimaldi, P.; Gaudenzi, S.; Pozzi, D.; Grandi, M.; Morrone, S.; Silvestri, I.; Congiu Castellano, A. UVB radiation induced effects on cells studied by FTIR spectroscopy. Eur. Biophys. J. 2010, 39, 929–934. [Google Scholar] [CrossRef] [Green Version]
- Yao, H.; Tao, Z.; Ai, M.; Peng, L.; Wang, G.; He, B.; Li, Y. qing Raman spectroscopic analysis of apoptosis of single human gastric cancer cells. Vib. Spectrosc. 2009, 50, 193–197. [Google Scholar] [CrossRef]
- Lin, J.; Li, Y.; Feng, S.; Chen, R.; Chen, G.; Chen, Q.; Pan, J.; Lin, S.; Yu, Y. Raman spectroscopic analysis of cytotoxic effect of cisplatin-treated leukemic cells. In Proceedings of the Eighth International Conference on Photonics and Imaging in Biology and Medicine (PIBM 2009), Wuhan, China, 8–10 August 2009; SPIE: Bellingham, WA, USA, 2009; Volume 7519, p. 75191G, ISBN 9780819479082. [Google Scholar]
- Nawaz, H.; Bonnier, F.; Meade, A.D.; Lyng, F.M.; Byrne, H.J. Comparison of subcellular responses for the evaluation and prediction of the chemotherapeutic response to cisplatin in lung adenocarcinoma using Raman spectroscopy. Analyst 2011, 136, 2450–2463. [Google Scholar] [CrossRef] [Green Version]


| Damaging Factor | Spectral Change [cm−1] | Dynamics | Assignment | Ref. |
|---|---|---|---|---|
| Ionizing radiation | 2898–2891 | ν(C–H) deoxyribose and T | [39,50,51,52,53] | |
| 1671–1666 | ν(C=O), δ(NH2) dT, dG, dC, C/G/T, ν(C=C str), δs(NH2) | |||
| 1579–1576 | A/C/G/T rings | |||
| 1536–1531 | in–plane ring str. dC, T | |||
| 1491–1489 | ν(C=N) in imidiazole, dG, dA, | |||
| 1422–1418 | ν(C4–C5str) C A, T | |||
| 1339–1335 | dA, dG, A/G (ring mode) | |||
| 1245–1243 | νasym(O–P–O) | |||
| 1106–1100 | νsym(O–P–O) | |||
| 1016–1008 | ν(N–sugar) A | |||
| 690–670 | C2’–endo/anti, G ring breathing | |||
| 500–494 | C/T ring def. | |||
| Proton and γ radiation | 1715–1706 | ν(C6=O)-G | [36,54,55,56,57,58,59,60,61] | |
| 1702–1689 | ν(C6=O), δ(N1H2)-G | |||
| 1684–1683 | ν(C2=O)-C | |||
| 1670–1664 | ν(C4=O)-T | |||
| 1652–1645 | ν(C2=O)-T | |||
| 1612–1604 | ν(C5C6), δ(NH2)-A,G | |||
| 1545–1530 | ν(N3C4)-C | |||
| 1515–1508 | δ(N6H2) + ring-A | |||
| 1488–1482 | ring mode N7-G,A | |||
| 1464–1452 | δ(5′CH2)-dRib | |||
| 1427–1418 | δ(2′CH2)-dRib | |||
| 1374–1369 | ring mode δs(C5H3)-T,A,C | |||
| 1342–1327 | ν(C2N3)-A,G | |||
| 1306–1302 | ring mode-A,C | |||
| 1253–1244 | ring mode-C,T | |||
| 1100–1098 | νs(PO2−) | |||
| 1077 app | PO2−–strand breaks | |||
| 1062–1051 | ν(CO5′)-dRib | |||
| 1013–1003 | T,G,C,dRib | |||
| 985 app | ν(PO32−)-strand breaks | |||
| 970–960 | dRib | |||
| 948–941 | dRib | |||
| 935–927 | dRib | |||
| 918–914 | ν(CCO)-dRib | |||
| 890–882 | ν(CO)-dRib-P | |||
| 875 app | dRib-denaturation | |||
| 868–860 | ν(CO)-dRib-P | |||
| 836–825 | ν(O–P–O), B-type | |||
| 818–805 | ν(O–P–O), A-type | |||
| 784–781 | ring breathing-T,C | |||
| 755–746 | ring breathing-T | |||
| 730–727 | ring breathing-A | |||
| 683–669 | ring breathing-G | |||
| 626–612 | ring breathing-G,A,dRib | |||
| 599–592 | δ(CCO) + δ(CCC)-dRib; δ(C=O)-C, T | |||
| 572–563 | ring def.-C,T | |||
| 539–535 | ring def.-A | |||
| 500–497 | δ(PO2−); ring def. | |||
| 453–450 | ring def.-C | |||
| 424–416 | ring def.-T,C | |||
| 411–390 | δ(C=O)-T,G | |||
| 334–325 | ring def.-G,A,T | |||
| Bleomycin | 1456 | deoxyribose or guanine vibrations | [40] | |
| 1084 | ν(PO2) bk | |||
| 1044 | ν(PO43−) bk | |||
| 880 | C–C bk vibration | |||
| Ultraviolet C (UVC) | 1665–1657 | δs(NH2) | [39,62,63,64,65,66,67,68,69,70,71,72] | |
| 1571–1570 | in plane ring vibration A/G, δs(NH2) | |||
| 1482–1468 | ν(C=N) pyrimidine, C2H2 def. | |||
| 1418–1412 | ν(C6–N1) pyrimidine, ring | |||
| 1336–1332 | (C–N), ring | |||
| 1303–1293 | ring | |||
| 1240–1234 | νasym(O–P–O) | |||
| 1192–1183 | ν P–(OH) | |||
| 1089–1086 | νsym(O–P–O) | |||
| 1062–1060 | ν(N-sugar) A | |||
| 1020–1019 | ν(C8-N9, N9-H, C8-H) A | |||
| 982–963 | (CC, CO) T, ribose δr (NH2) T | |||
| 916–913 | δr (NH2) A/C/G, deoxyribose | |||
| 784–767 | T ring breathing | |||
| 680–630 | G ring breathing | |||
| Adriamycin/daunomycin | 1347–1338 | ring mode(G,A) | [47,73,74] | |
| 1149–1144 | deoxyribose-phosphate stretching | |||
| 1053–1044 | ν(C=O)/νsym PO2− | |||
| 962–951 | deoxyribose | |||
| 889–880 | deoxyribose/ν(O–P–O) | |||
| 808–800 | ν(O–P–O) vibration | |||
| 776–763 | ring breathing (C) | |||
| 701–692 | ring breathing(G) influence by C2′ endo sugar pucker | |||
| 675–673 | ring breathing(G) influence by C3′ endo sugar pucker | |||
| 636–633 | ring mode(T)/T breathing vibration | |||
| Platinum chemotherapeutic drugs | 1716–1711 | base pair carbonyl ν(C=O) | [48,49,75,76] | |
| 1238–1225 | νasym PO2− | |||
| 1088 | νsym PO2 | |||
| 1055 | ν(C–O) bk | |||
| 968–966 | ν(C–C) bk |
| Damaging Factor | Spectral Change [cm−1] | Dynamics | Assignments | Ref. |
|---|---|---|---|---|
| H2O2/UV | 1502 | G, A (oxidation of guanosine by ROS) | [87,88] | |
| 1438 | (C5′–H2) def. T | [89] | ||
| 1387 | A, T, and G ring vibrations | [51,86] | ||
| 1334 | A ring vibration | |||
| 1179 | unpaired T | [63,90] | ||
| 1159 | A ring vibration | [86] | ||
| 1085–1075 | νsym(PO2−), bk | [51,86] | ||
| 800 | νsym(O–P–O) | |||
| 740 spl. to 715 and 738 | A, T ring breathing | [51,90] | ||
| 660–640 | G ring breathing (vibration sensitive to orientation relative to the ribose ring) | [91,92,93,94] | ||
| ROS inducted during PDT | 1445–1430 | ribose; breakage of DNA backbone structure | [95] | |
| 1337 | A, cleavage of the double chain | |||
| 1214–1208 | A, cleavage of the double chain | |||
| 1092 | νsym(O–P–O); damage of DNA double-helix structure | |||
| UV–A | 1660 | ν(C=O), δs(NH2) | [78] | |
| 1585 | ν(C=C, N–C) | |||
| 1480, 1510 | ν(N–C) | |||
| 1378 | δ(C–H), ν(C–N–C) | |||
| 1270 | ν(N–C) | |||
| 1056, 1098 | νsym(PO2−) | |||
| 904 | ν(C–C) | |||
| 802–843 | νsym(O–P–O), δ(N–H, C–H) | |||
| 674–703 | G ring breathing, δ(C–C, N–C) | |||
| UV-C | 1684 dis. | ν(C=O), δ(NH2) of T/G/C, base stacking vibration | [50] | |
| 1667–1660 | δs(NH2) | [62] | ||
| 1581–1573 | in plane ring vibration A/G, δs(NH2) | [62,63] | ||
| 1519–1507 | ring | [63] | ||
| 1484–1478 | ν(C=N) pyrimidine, (C2H2) def. | [62,63] | ||
| 1440 app. | δr(CH2) | [96] | ||
| 1402–1400 | ν(C6–N1) pyrimidine, ring | [62,63] | ||
| 1370 app. | δs(CH2, CH3) | [96] | ||
| 1324–1313 | (C–N), ring | [50,63] | ||
| 1324–1311 | ring | [63] | ||
| 1254–1245 | νasym(O–P–O) | [63] | ||
| 1202–1198 | ν P–(OH) | [64,65] | ||
| 1128–1090 | νsym(O–P–O) | [66] | ||
| 1070–1068 | ν(N–sugar) A | [62] | ||
| 1030 dis. | ν(C8–N9, N9–H, C8–H) A | [67] | ||
| 930 app. | δr(NH2) A/C/G, deoxyribose | [62,67,68] | ||
| 880 app. | deoxyribose ring | [69] | ||
| 850–841 | deoxyribose ring | [69] | ||
| 786–780 | T ring breathing | [67,70] | ||
| 658–648 | G ring breathing | [71,72] | ||
| X-ray | 1577–1563 | A, G ring vibration | [51,97,98,99] | |
| 1509–1503 | A | |||
| 1420–1414 | A, G | |||
| 1336–1333 | A, G ring vibration | |||
| 1176–1162 | T, C, G, | |||
| 1134–1119 | ν(C–N) | |||
| 1095–1086 | νsym(O–P–O) | |||
| 893–884 | phosphodiester bk, deoxyribose | |||
| 792–783 | unpaired T, C, νsym(O–P–O), bk | |||
| 769–767 | C, T ring breathing | |||
| 736–730 | A ring breathing | |||
| 686–683 | G ring breathing | [86,91,94] | ||
| Doxorubicin | 1642 | ν(C=O), hydrogen-bonding to the C=O | [100,101,102] | |
| 1591 app. | complex formation | |||
| 1586–1571 | A; doxorubicin interaction with the N7 position of A, which is accessible for doxorubicin in the DNA structure | |||
| 1467 | G, (C8H-N9C8 and C8N7) | |||
| 1372–1312 | T, def. of the hydrogen bond between the NH2 group of A and the C40 group of T, δ(ring C20/15 and C16–OH) | |||
| 1318 | A; doxorubicin interaction with the N7 position of A | |||
| 1273 app. | _ν(C–O) of ring A of doxorubicin | |||
| 1246, 1214 | δs(C–O, C–O–H, C–H) intercalation of rings B and C of doxorubicin within the double helix. | |||
| 1123 | ν(C–N) | |||
| Cisplatin | 1726 | ν(C=O) G | [51,103] | |
| 1665 | ν(C=O), (N–H) def. of T/G/C | |||
| 1588 | G vibration | |||
| 1485 | cisplatin (electrophilic agent) binding to the N7 atom of G | [103,104] | ||
| 1333 | G vibration | [51,103] | ||
| 541 app. | Pt-NH3 stretching of cisplatin ligands | [103,105] |
| Damaging Factor | Spectral Change [cm−1] | Dynamics | Assignments | Ref. |
|---|---|---|---|---|
| UV-C | 1702 dis. | ν(C=O), δ(NH2) of T/G/C, base stacking vibration | [50] | |
| 1653–1651 | δs(NH2) | [62] | ||
| 1578–1571 | in plane ring vibration A/G, δs(NH2) | [62,63] | ||
| 1515–1512 | Ring | [63] | ||
| 1483–1472 | ν(C=N) pyrimidine, (C2H2) def. | [62,63] | ||
| 1440 app. | δr (CH2) | [96] | ||
| 1406–1403 | ν(C6–N1) pyrimidine, ring | [62,63] | ||
| (1365–1350) app. | δs(CH2, CH3) | [96] | ||
| 1328–1317 | (C–N), ring | [50,63] | ||
| 1296−(1313–1296) | ring | [63] | ||
| 1237–1234 | νasym(O–P–O) | [63] | ||
| 1190 app. | ν P–(OH) | [64,65] | ||
| 1160 app. | δ(P–O–H) | [64,96] | ||
| 1115 | νsym (P–O–C), νsym (O–P–O) | [39,66,111] | ||
| 1085–1079 | νsym(O–P–O) | [66] | ||
| 1067–1061 | ν(N–sugar) A | [62] | ||
| 1034 app. | ν(C8–N9, N9–H, C8–H) A | [67] | ||
| 980 app. | ν(CC, CO) T, ribose; δr(NH2) T | [39] | ||
| 930 app. | δr(NH2) A/C/G, deoxyribose | [62,67,68] | ||
| 870 app. | deoxyribose ring | [69] | ||
| 830 app. | deoxyribose ring | [69] | ||
| 655 app. | G ring breathing | [71,72] |
| Damaging Factor | Type of Damage | Spectral Change [cm−1] | Dynamics | Assignment | Ref. |
|---|---|---|---|---|---|
| UV-A + UV-B | base-pair damage such as purine and pyrimidine dimer formation along with 6–4 lesions | 1714 | base stacking mode | [112] | |
| DNA conformation change | 1245–1230 | νasym(O–P–O) | |||
| DNA fragmentation, apoptosis | 1080 | νsym(O–P–O) | [112,113] | ||
| Protons | local rupture of base-paired structures | 1714 | Base stacking mode | [114,115,116] | |
| hydrogen bonding structure in DNA typical for apoptotic cells, changes in the deoxyribose/ribose structure | 1242 | νasym(O–P–O) | [117,118,119] | ||
| 1157 | –C–OH | ||||
| DNA fragmentation, apoptosis | 1080 | νsym (O–P–O) | |||
| DNA fragmentation, apoptosis | 970–963 | ν(C–C), ν(C–O) | [113] | ||
| SSB, DSB, crosslinks, and deoxyribose damage | 970 | ribose-phosphate skeletal motions | [115] | ||
| γ and X rays | base–pair damage including purine, pyrimidine dimer formation and 6–4 lesions | 1713 | Base stacking mode | [115,120,121] | |
| partial structural transition from B-DNA and A-DNA | 1240–1220 | νasym(O–P–O) | |||
| 1080 | νasym(O–P–O) | ||||
| DNA fragmentation | 1036, 1020 | ||||
| DNA damage, fragmentation | 791 | νsym(O–P–O) | |||
| 784 | ring breathing vibrations of DNA base pairs | ||||
| Doxorubicin | DNA phosphates backbone changes because of the DNA disintegrating effect of doxorubicin | 1085 | νsym(O–P–O) | [120,121] | |
| 1050 | ν(C–O) | ||||
| Platinum chemotherapeutic compounds:cisplatin, carboplatin | phosphodiester bonds breakage and DNA bases | 1576 | A, G | [122] | |
| phosphodiester bonds breakage and DNA bases | 1523 | C | |||
| the change of the DNA content (not change of the double helix structure) | 1338 | the polynucleotide chain (DNA–purine bases) | |||
| nonhydrogen-bonded phosphodiester groups of nucleic acids are bonded to a heavy group in cisplatin | (1223–1221) | hydrogen-bonded phosphodiester groups | [123] | ||
| modification of the interchain packing of the DNA | 1087 | νsym(O–P–O) | |||
| breakdown of phosphodiester bonds and DNA bases | 783 | ν(O–P–O) | |||
| Paclitaxel | DNA condensation, apoptosis | 1036, 1020 | C–O stretch of carbohydrates convoluted with skeletal trans conformation (C–C) | [124] |
© 2020 by the authors. Licensee MDPI, Basel, Switzerland. This article is an open access article distributed under the terms and conditions of the Creative Commons Attribution (CC BY) license (http://creativecommons.org/licenses/by/4.0/).
Share and Cite
Sofińska, K.; Wilkosz, N.; Szymoński, M.; Lipiec, E. Molecular Spectroscopic Markers of DNA Damage. Molecules 2020, 25, 561. https://doi.org/10.3390/molecules25030561
Sofińska K, Wilkosz N, Szymoński M, Lipiec E. Molecular Spectroscopic Markers of DNA Damage. Molecules. 2020; 25(3):561. https://doi.org/10.3390/molecules25030561
Chicago/Turabian StyleSofińska, Kamila, Natalia Wilkosz, Marek Szymoński, and Ewelina Lipiec. 2020. "Molecular Spectroscopic Markers of DNA Damage" Molecules 25, no. 3: 561. https://doi.org/10.3390/molecules25030561