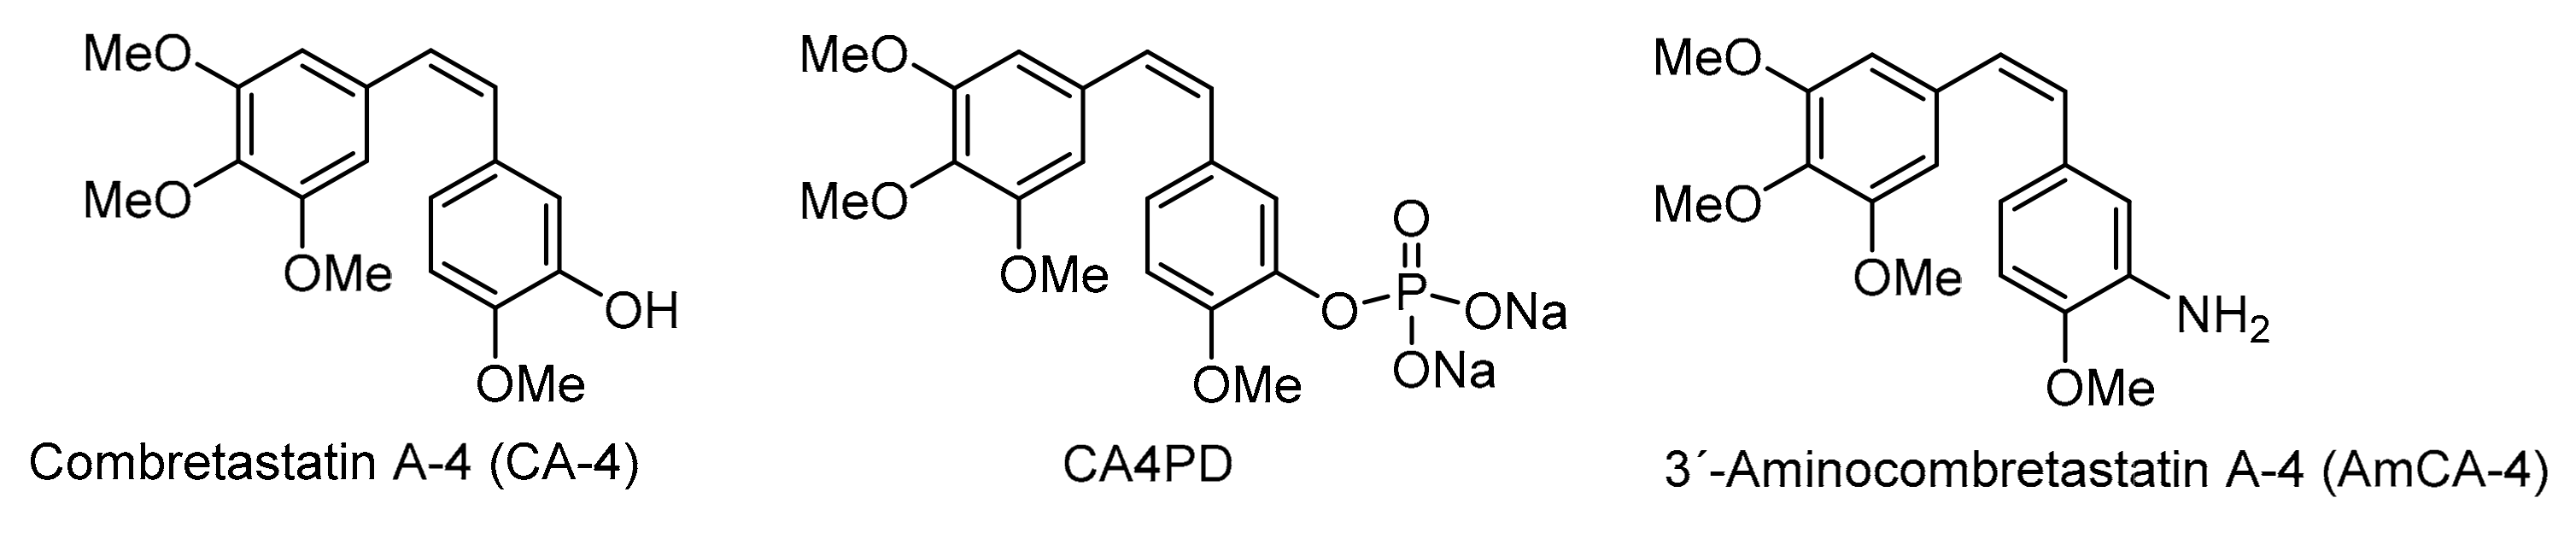
Figure 1.
Structures of combretastatin A-4, combretastatin A-4 disodium phosphate and 3′-aminocombretastatin A-4.
Figure 1.
Structures of combretastatin A-4, combretastatin A-4 disodium phosphate and 3′-aminocombretastatin A-4.
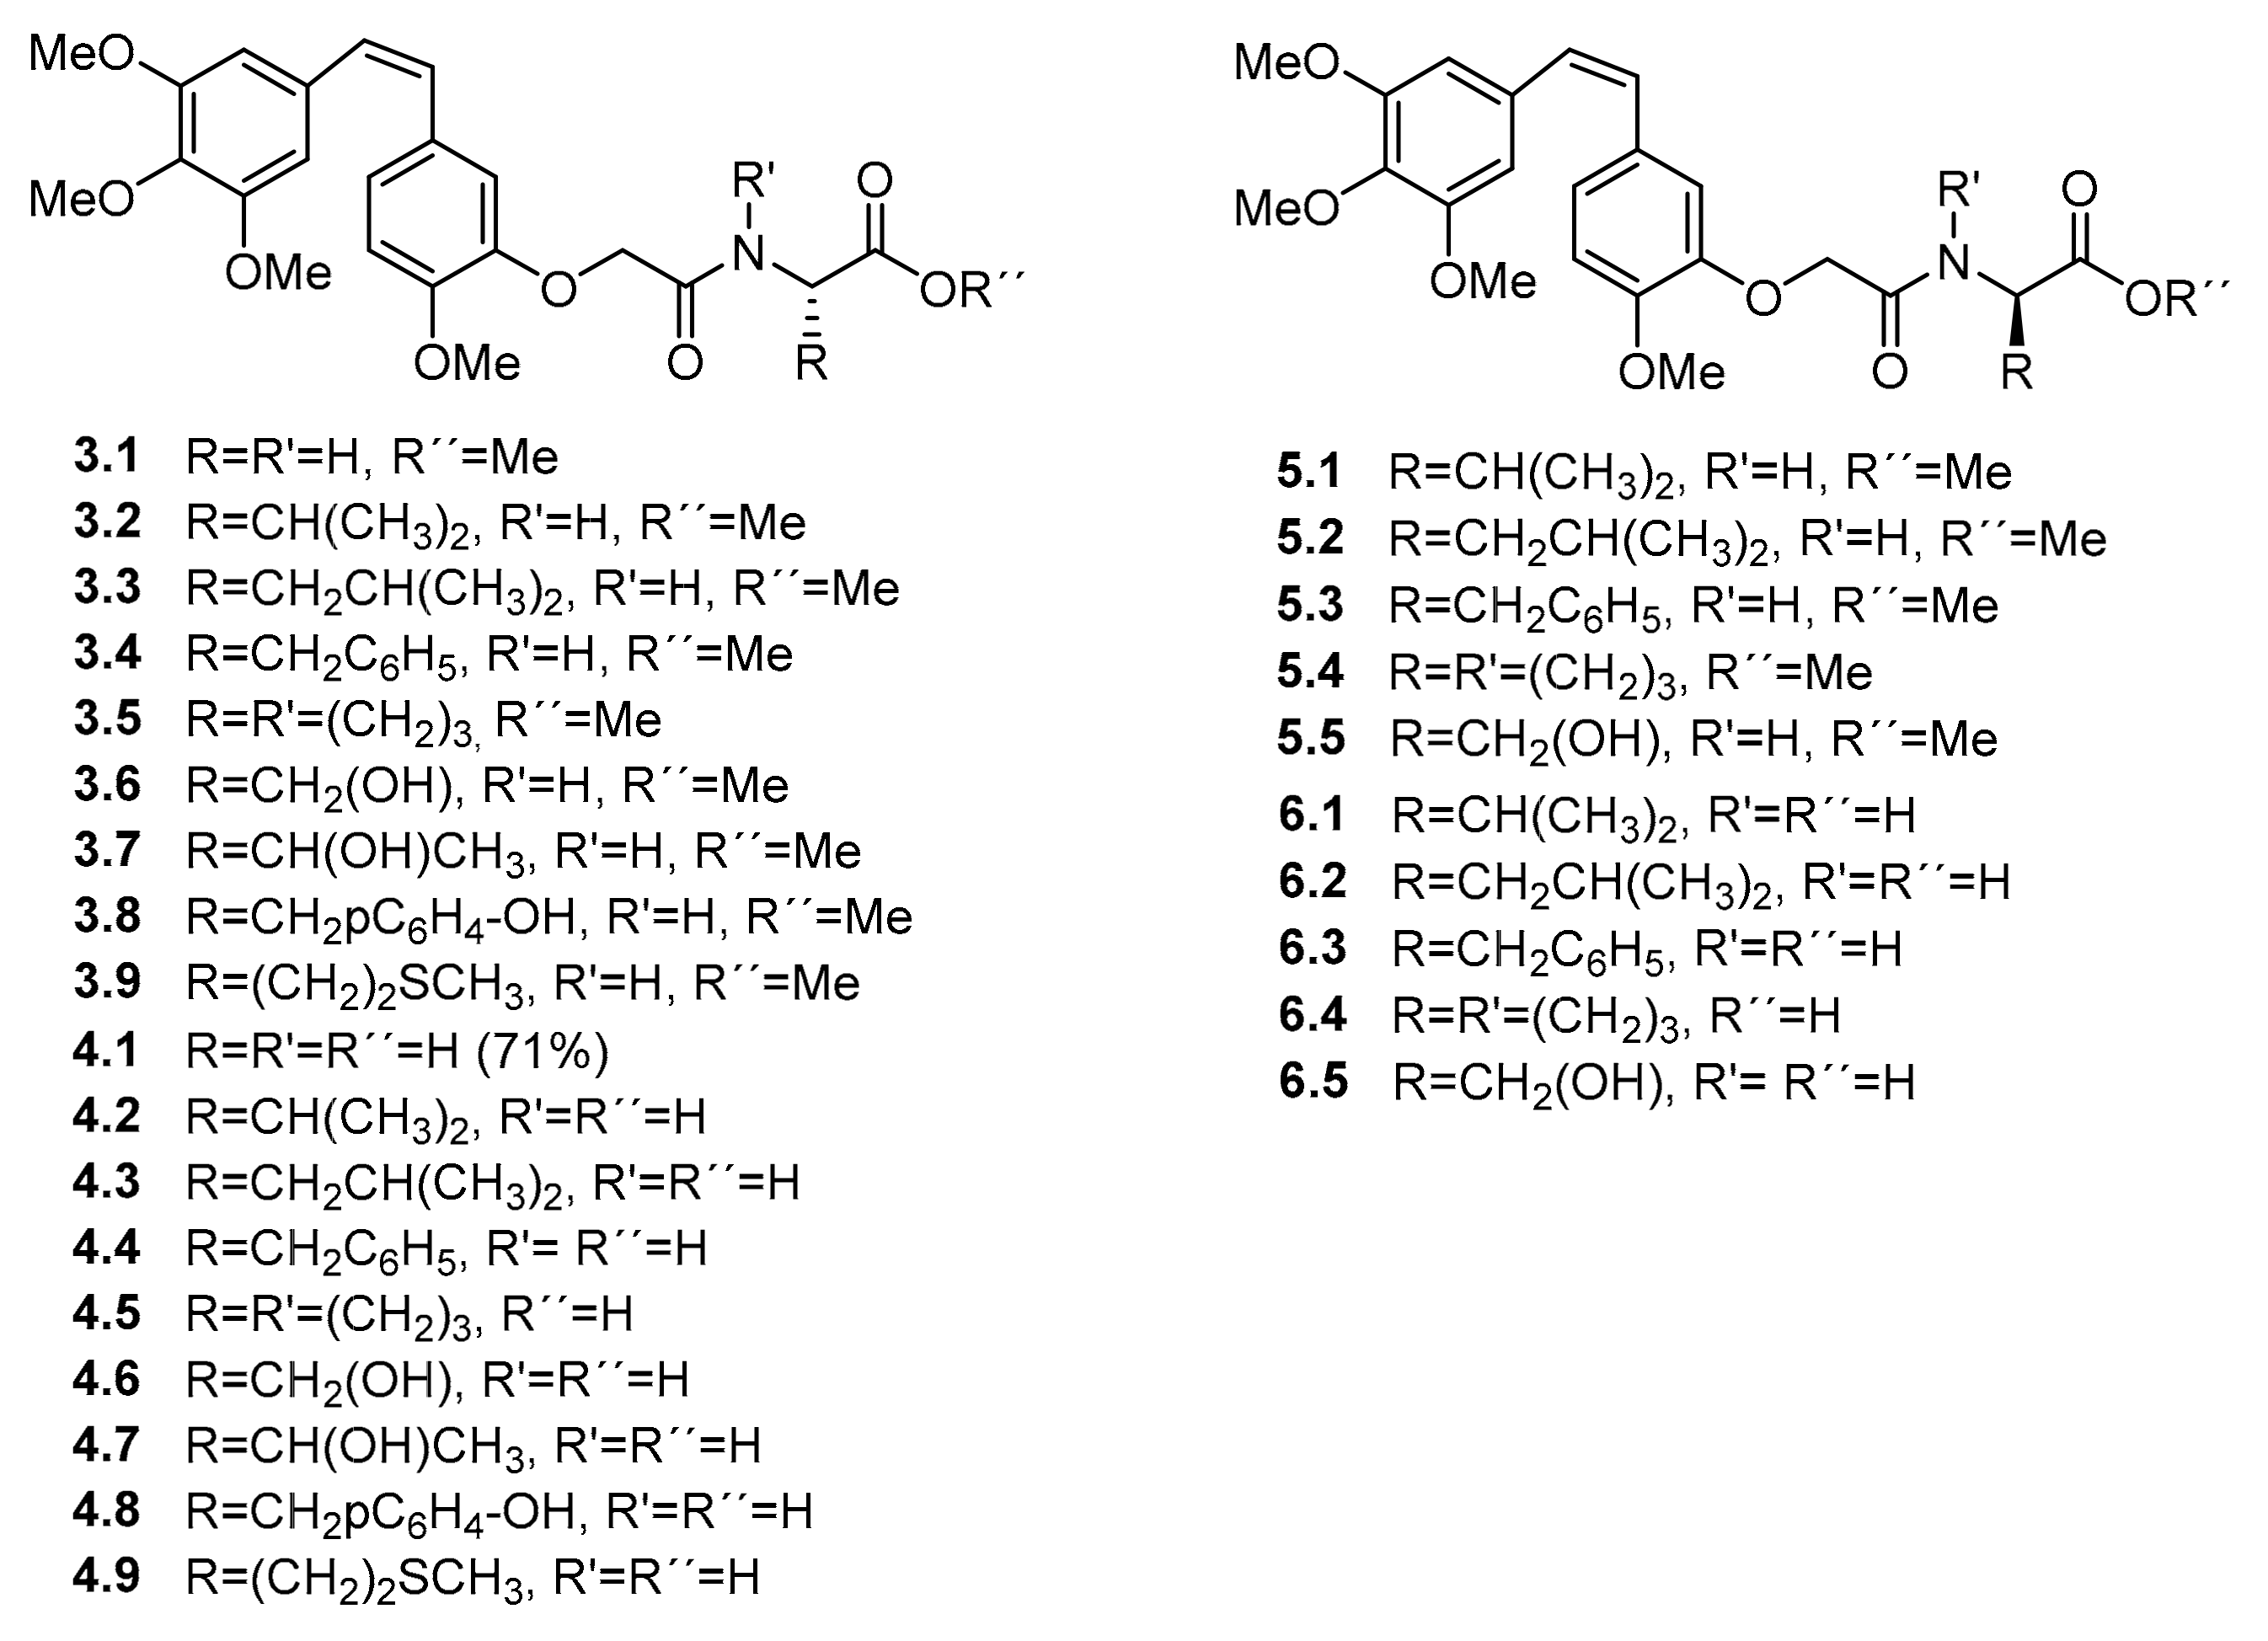
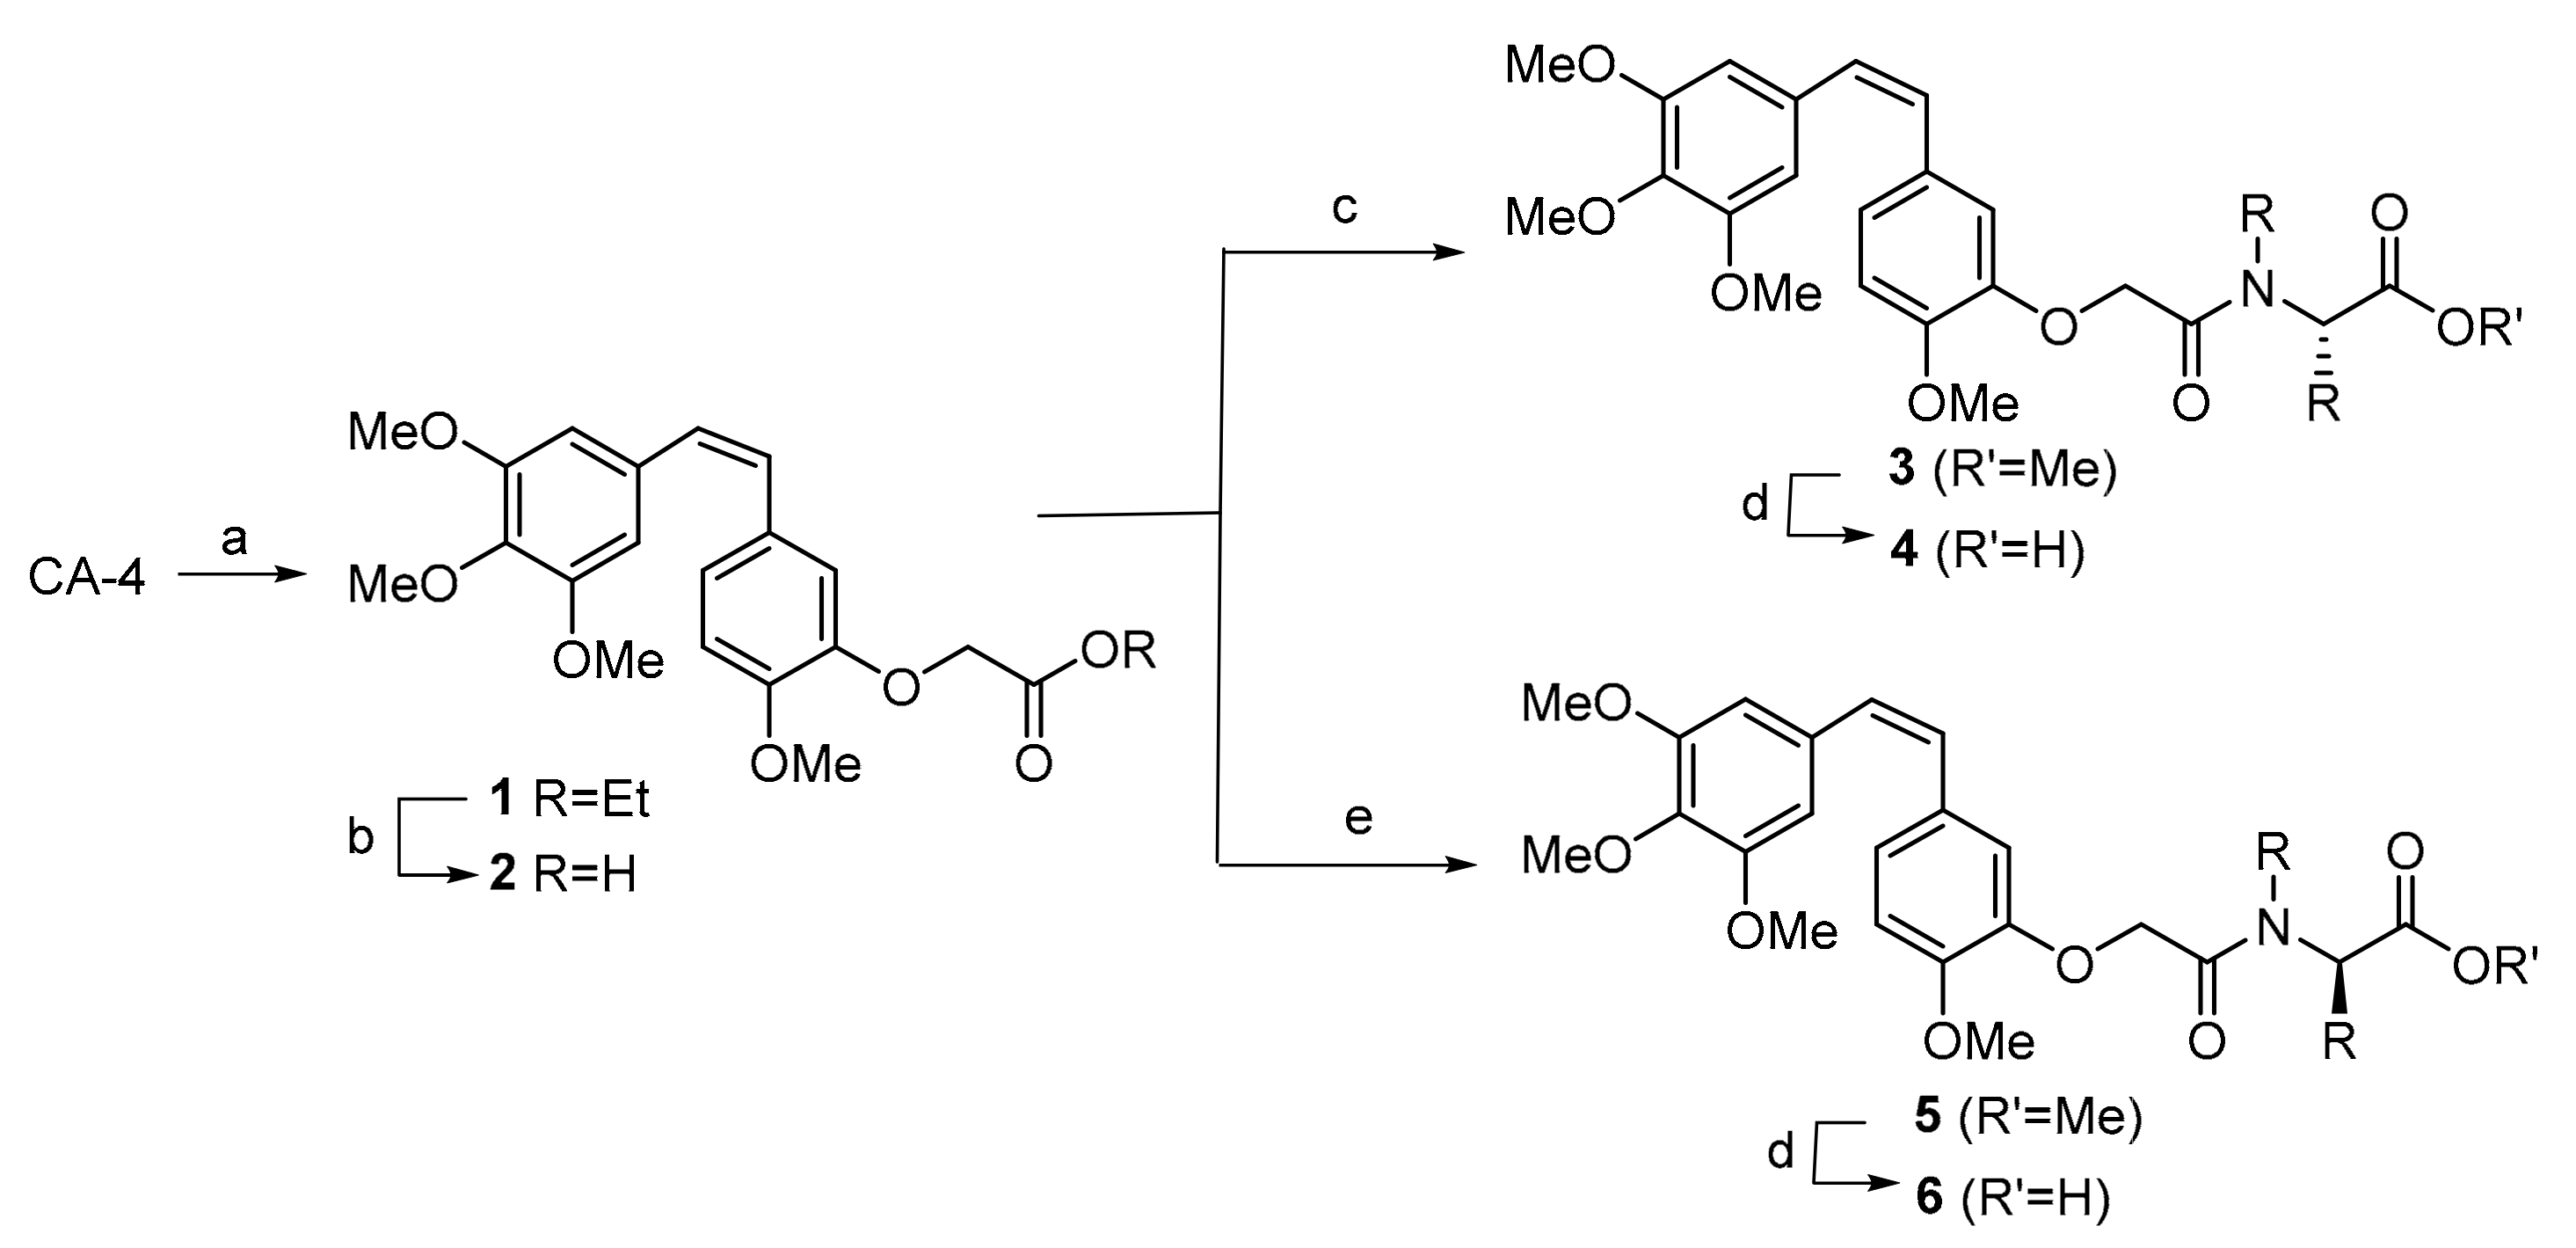
Scheme 1.
Synthesis of combretastatin A-4 (CA-4) derivatives. Reagents and conditions: (a) K2CO3 and DMF, RT 1 h., then BrCH2COEt, RT 24 h, 94%. (b) NaOH and EtOH, RT 1 h, 91%. (c) l-amino ester, EDCI·HCl, DMAP and DMF, 0 °C, 2 h, then RT 2 h. (d) LiOH and MeOH/H2O, RT 1 h. (e) d-amino ester, EDCI·HCl, DMAP and DMF, 0 °C, 2 h, then RT 2 h.
Figure 2.
Structures of CA-4 derivatives.
Figure 2.
Structures of CA-4 derivatives.
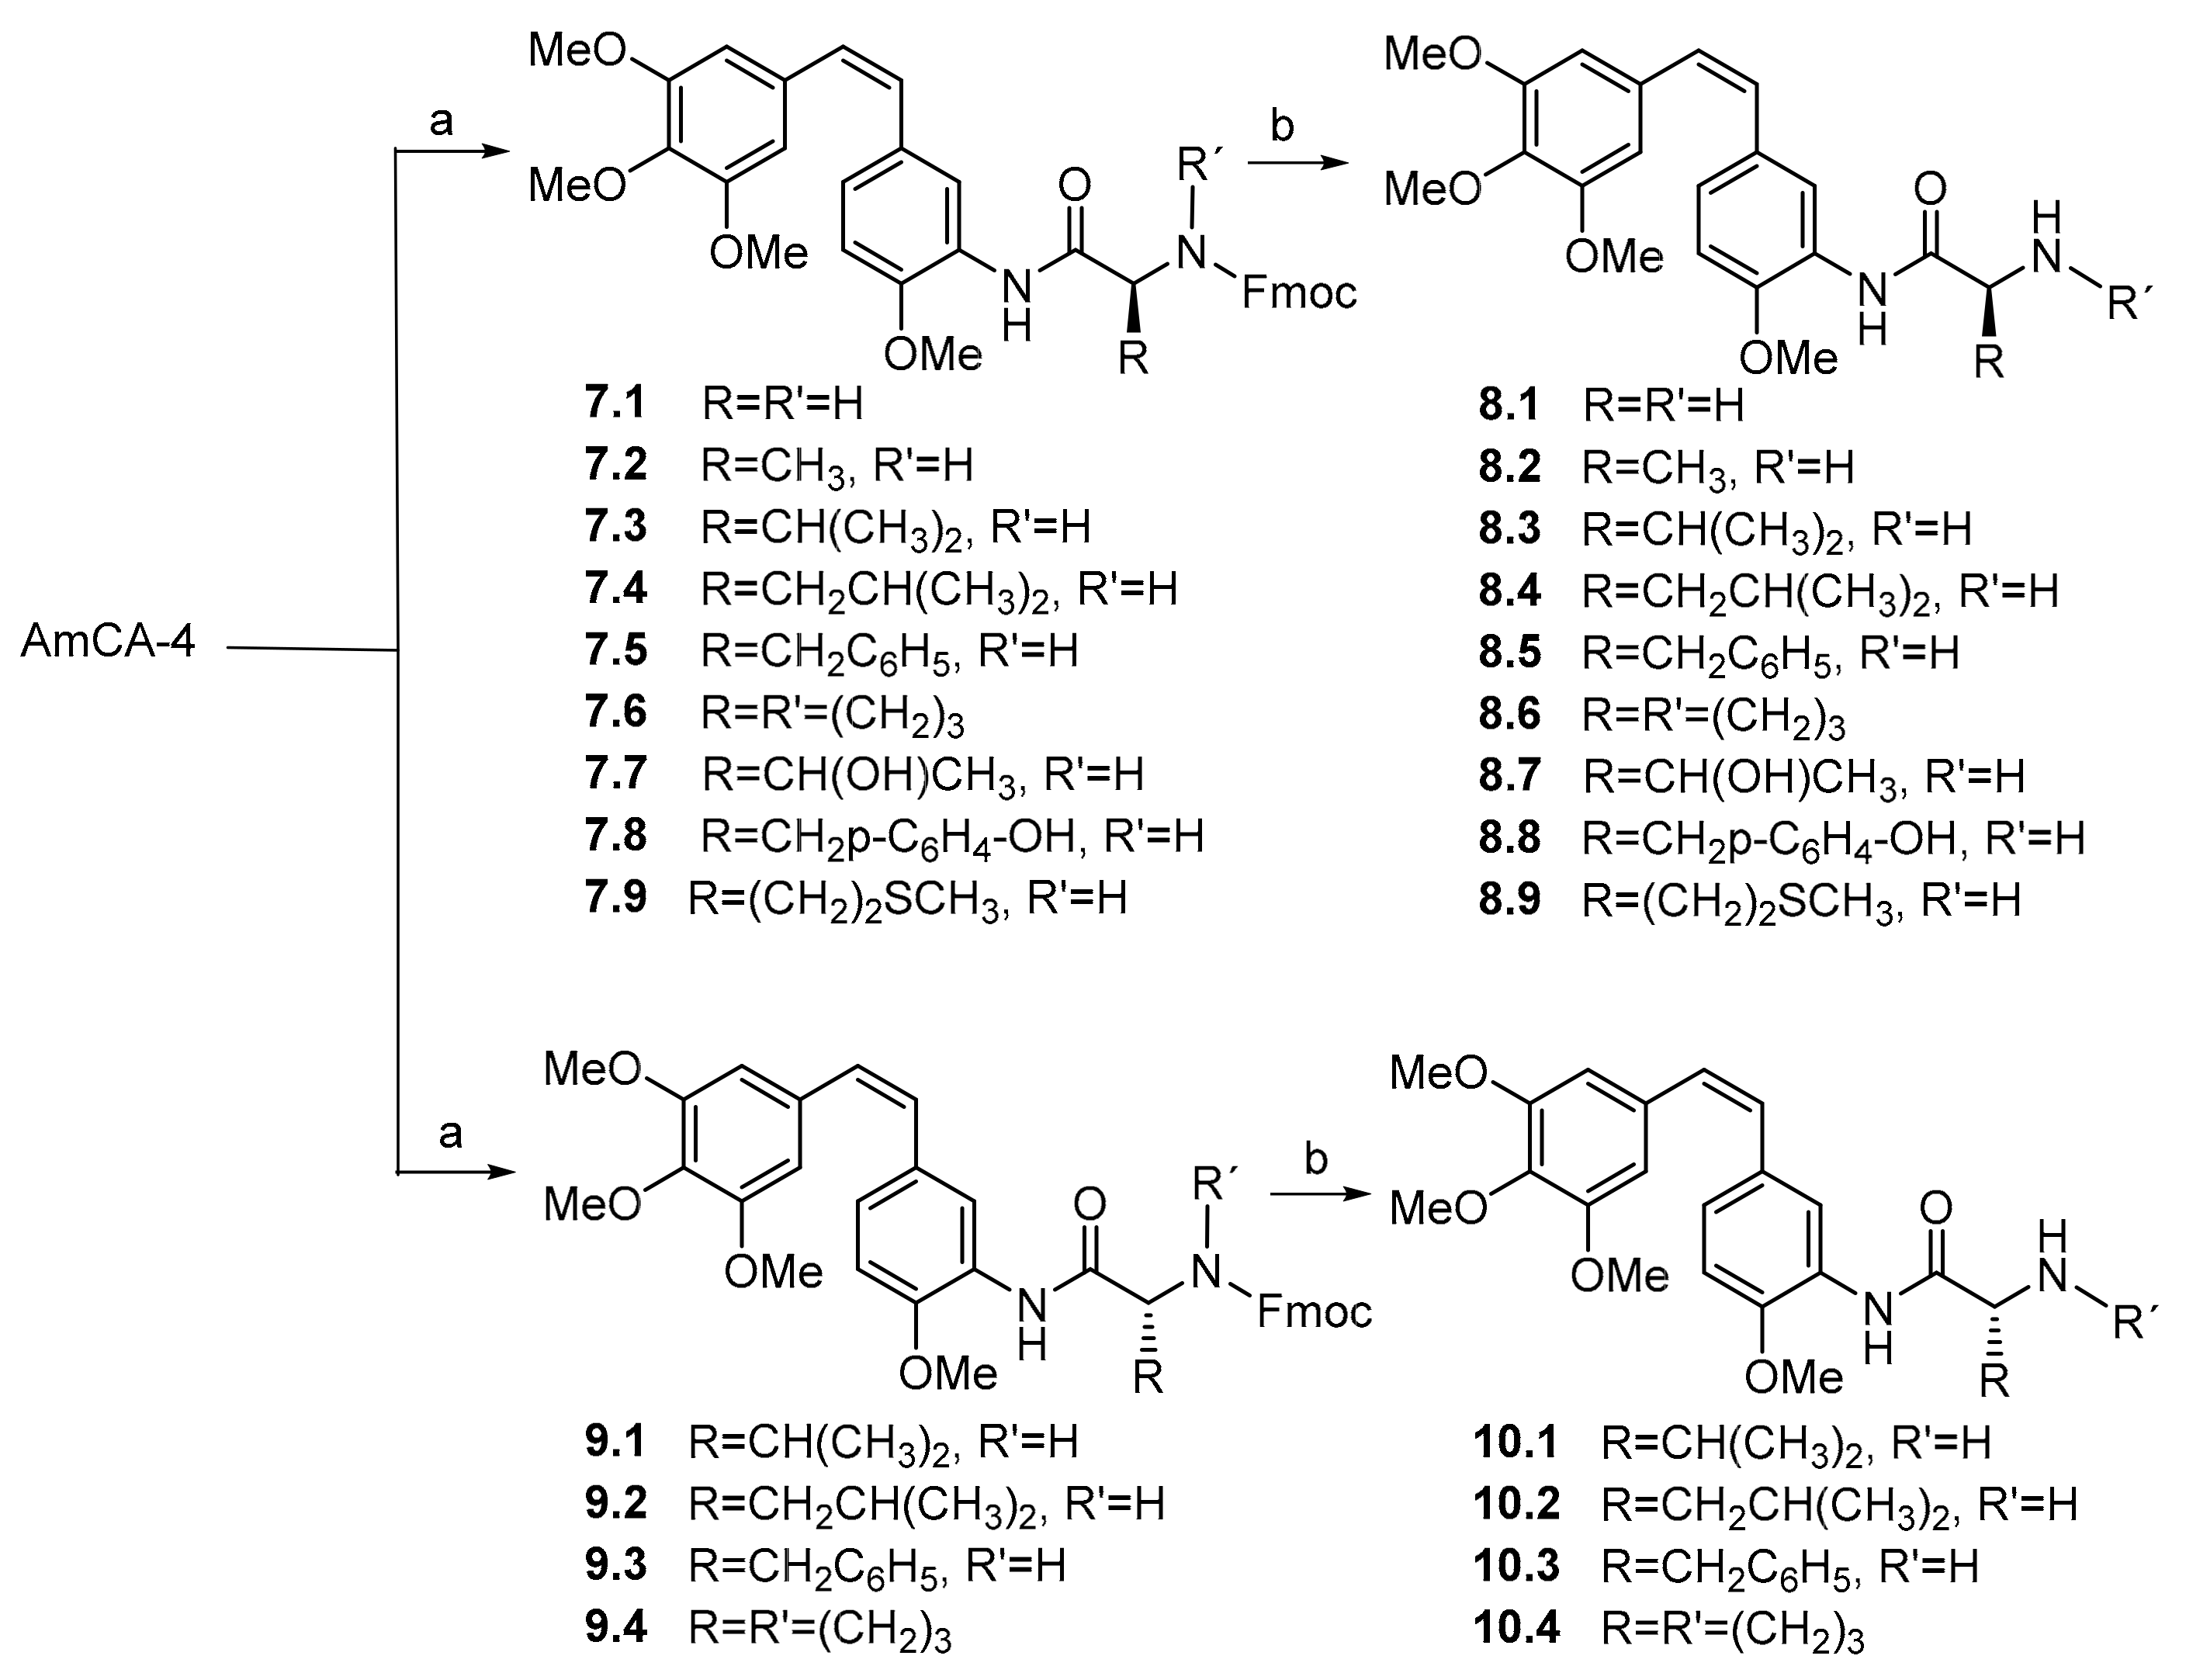
Scheme 2.
Synthesis of 3′-aminocombretastatin A-4 (AmCA-4) derivatives. Reagents and conditions: (a) N-Fmoc-l-amino acid or N-Fmoc-d-amino acid, DCC, HOBt and DMF, RT 16 h. (b) KF, 18-crown-6 and DMF, RT 4 h.
Scheme 2.
Synthesis of 3′-aminocombretastatin A-4 (AmCA-4) derivatives. Reagents and conditions: (a) N-Fmoc-l-amino acid or N-Fmoc-d-amino acid, DCC, HOBt and DMF, RT 16 h. (b) KF, 18-crown-6 and DMF, RT 4 h.
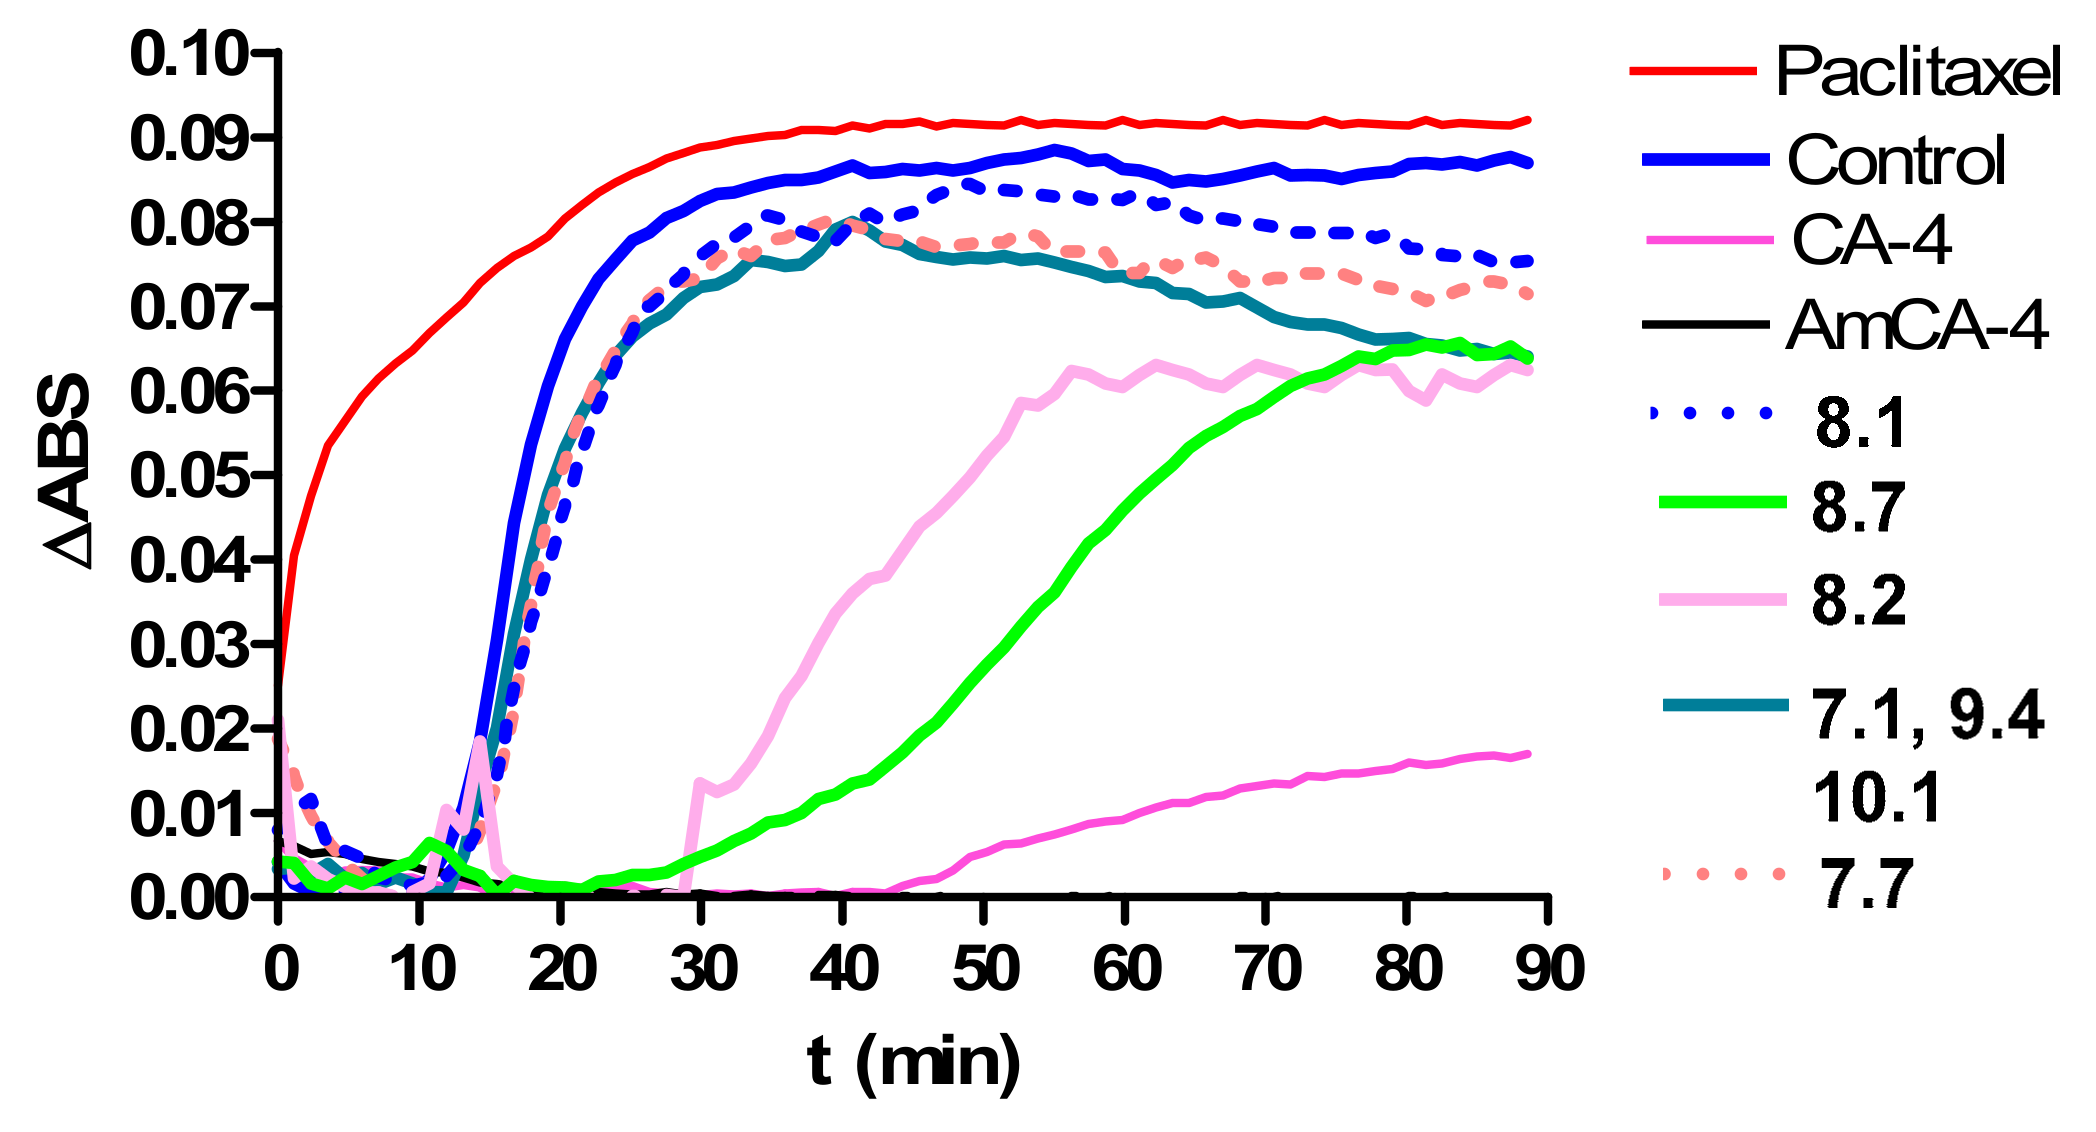
Figure 3.
Effects of paclitaxel, CA-4, AmCA-4 and derivatives on the in vitro tubulin polymerization.
Figure 3.
Effects of paclitaxel, CA-4, AmCA-4 and derivatives on the in vitro tubulin polymerization.
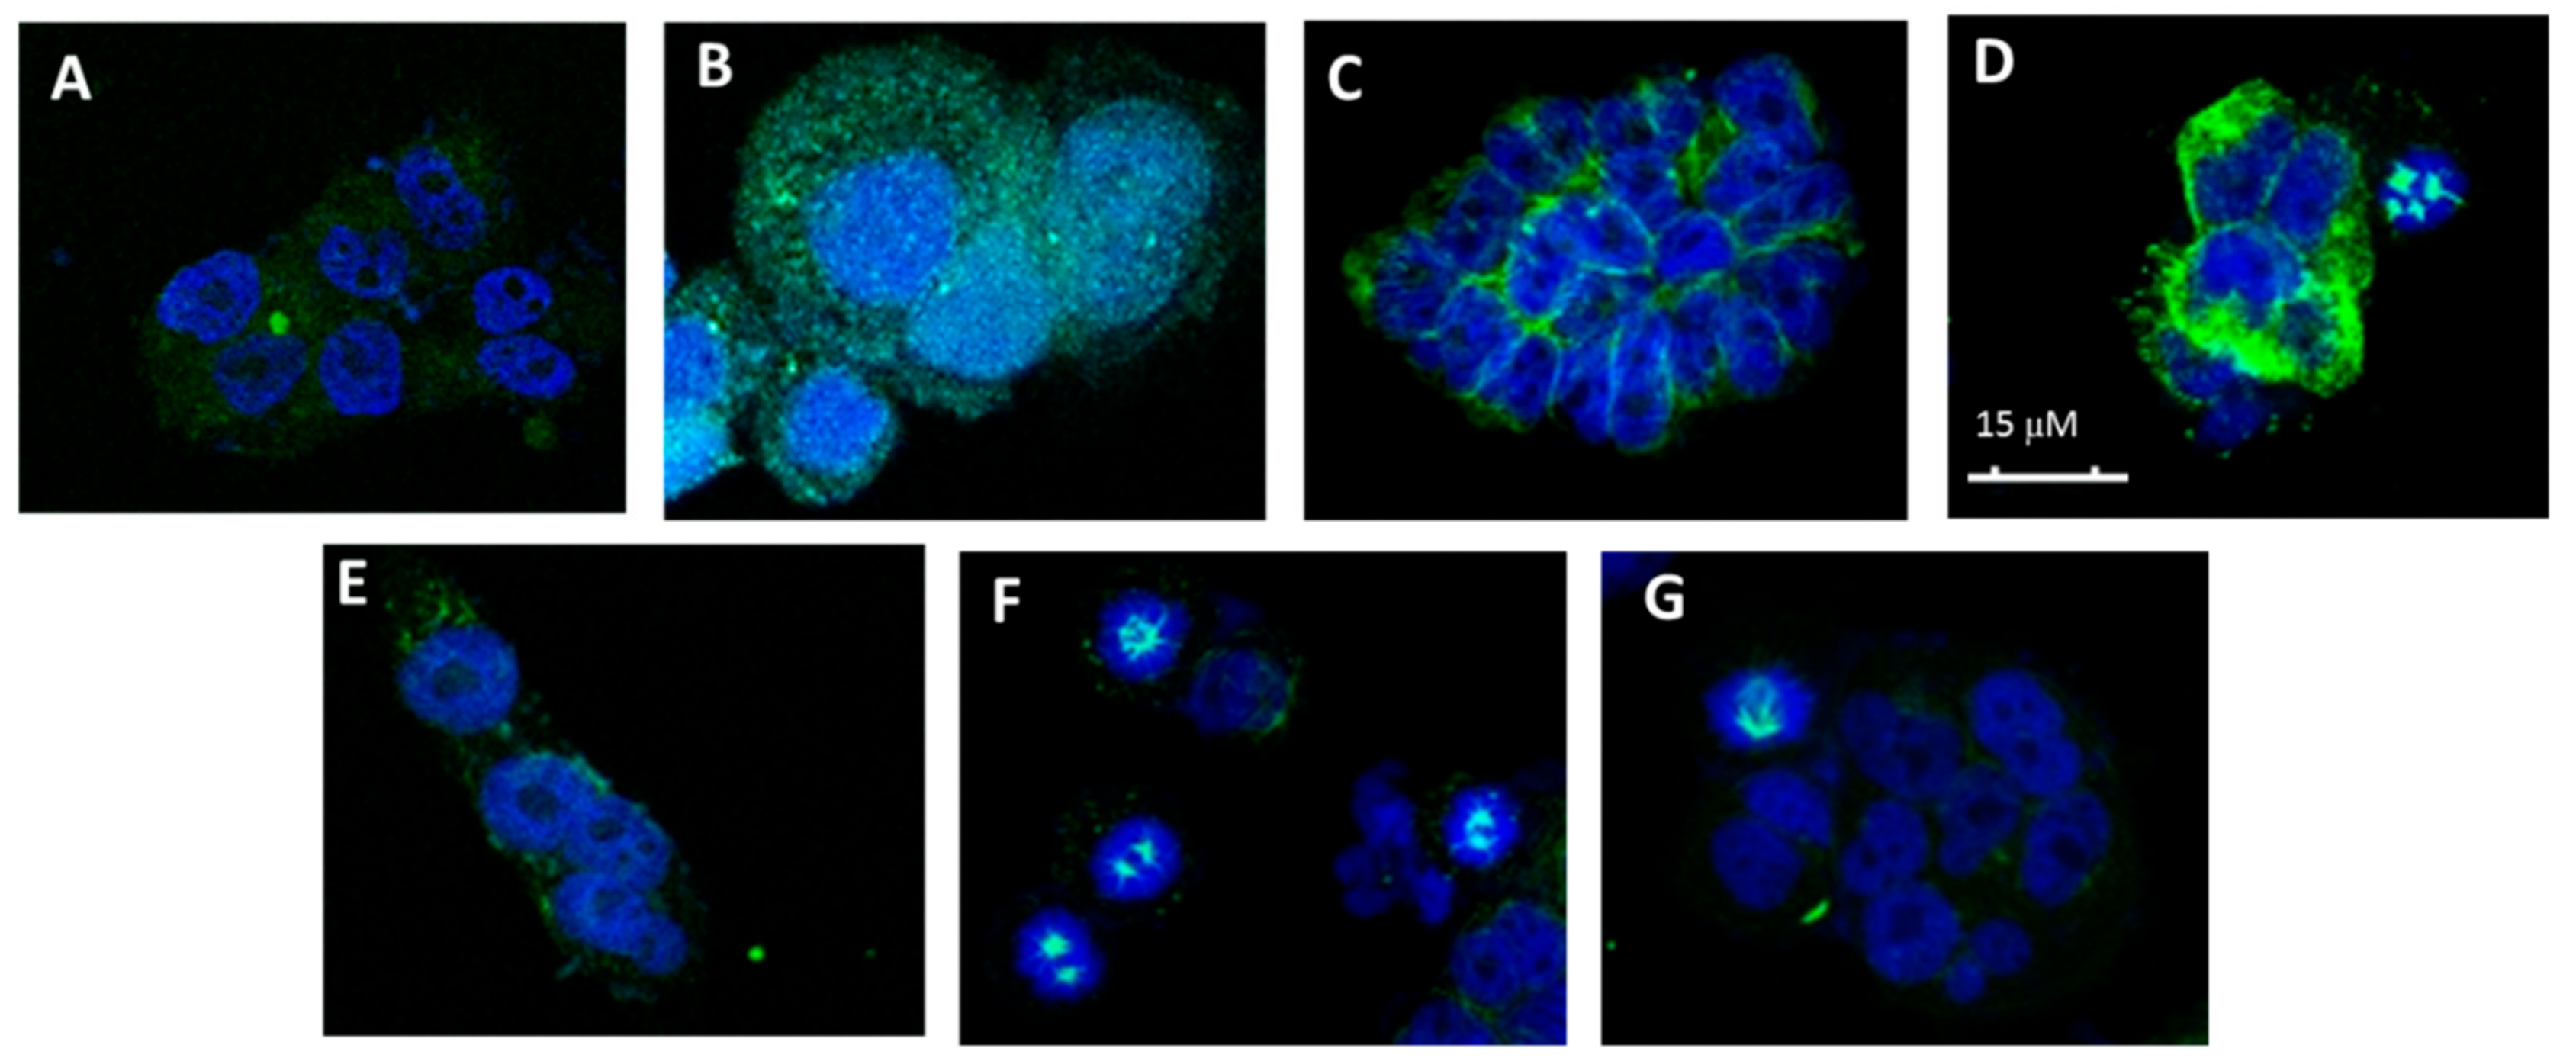
Figure 4.
Effects on the microtubule network. (A) Cellular microtubules with DMSO, (B) 50 nM CA-4, (C) 50 μM 1, (D) 75 μM 3.7 (l-Thr-OMe), (E) 75 μM 3.8 (l-Tyr-OMe), (F) 50 μM 4.2 (l-Val) and (G) 75 μM 4.3 (l-Leu).
Figure 4.
Effects on the microtubule network. (A) Cellular microtubules with DMSO, (B) 50 nM CA-4, (C) 50 μM 1, (D) 75 μM 3.7 (l-Thr-OMe), (E) 75 μM 3.8 (l-Tyr-OMe), (F) 50 μM 4.2 (l-Val) and (G) 75 μM 4.3 (l-Leu).
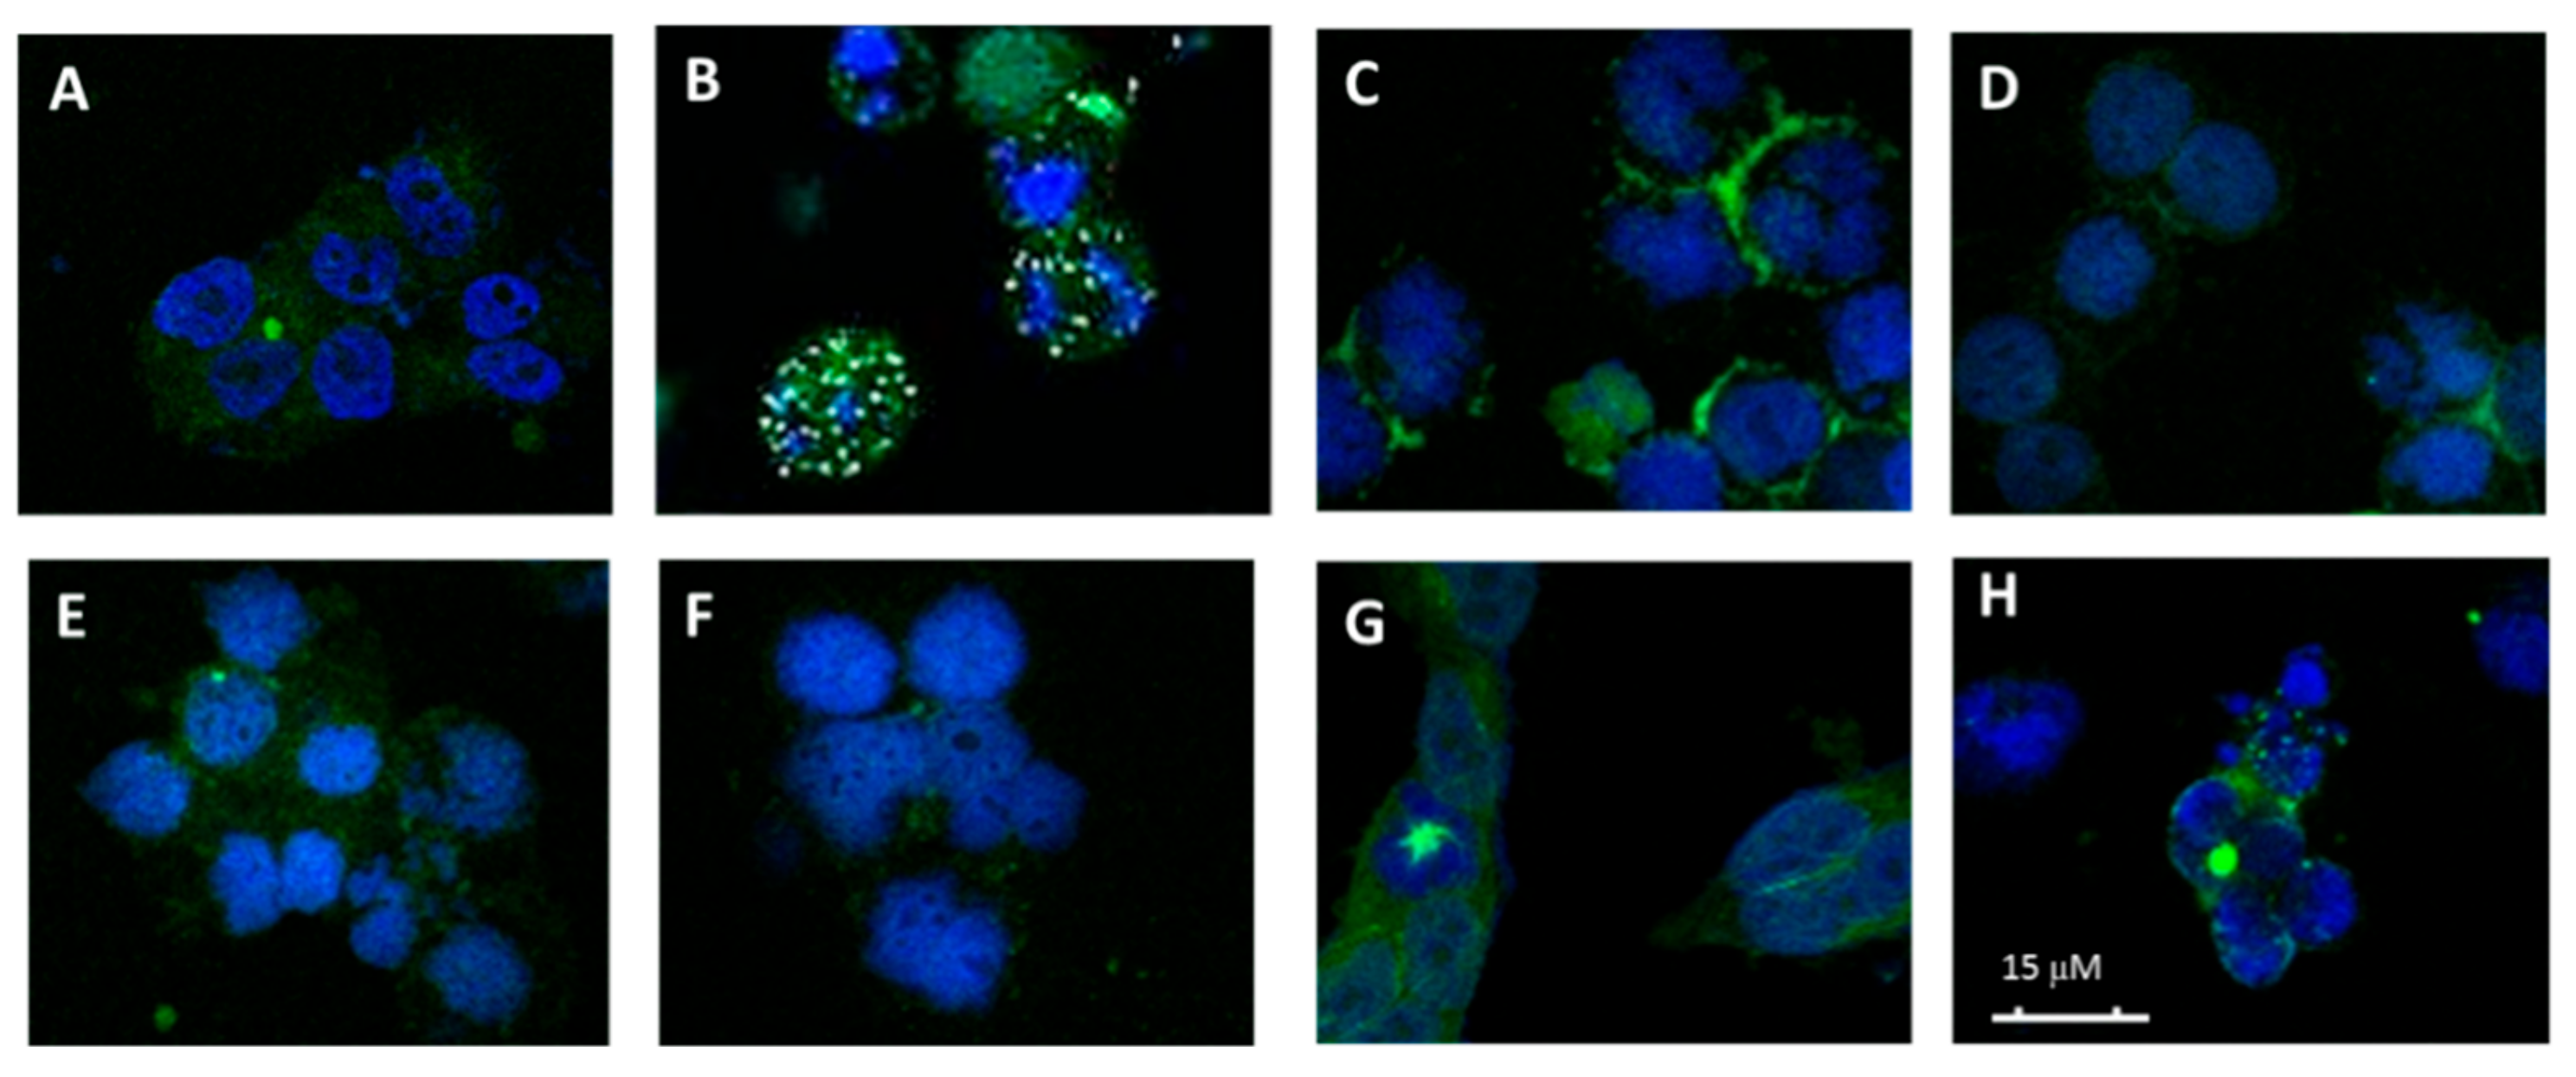
Figure 5.
Effects on the microtubule network. (A) Cellular microtubules with DMSO, (B) 50 nM AmCA-4, (C) 0.5 μM 7.1 (Fmoc-Gly), (D) 2 µM 8.1 (Gly), (E) 3 µM 8.2 (l-Ala), (F) 0.5 µM 8.5 (l-Phe), (G) 40 µM de 10.1 (d-Val) and (H) 0.5 µM 10.2 (d-Leu).
Figure 5.
Effects on the microtubule network. (A) Cellular microtubules with DMSO, (B) 50 nM AmCA-4, (C) 0.5 μM 7.1 (Fmoc-Gly), (D) 2 µM 8.1 (Gly), (E) 3 µM 8.2 (l-Ala), (F) 0.5 µM 8.5 (l-Phe), (G) 40 µM de 10.1 (d-Val) and (H) 0.5 µM 10.2 (d-Leu).
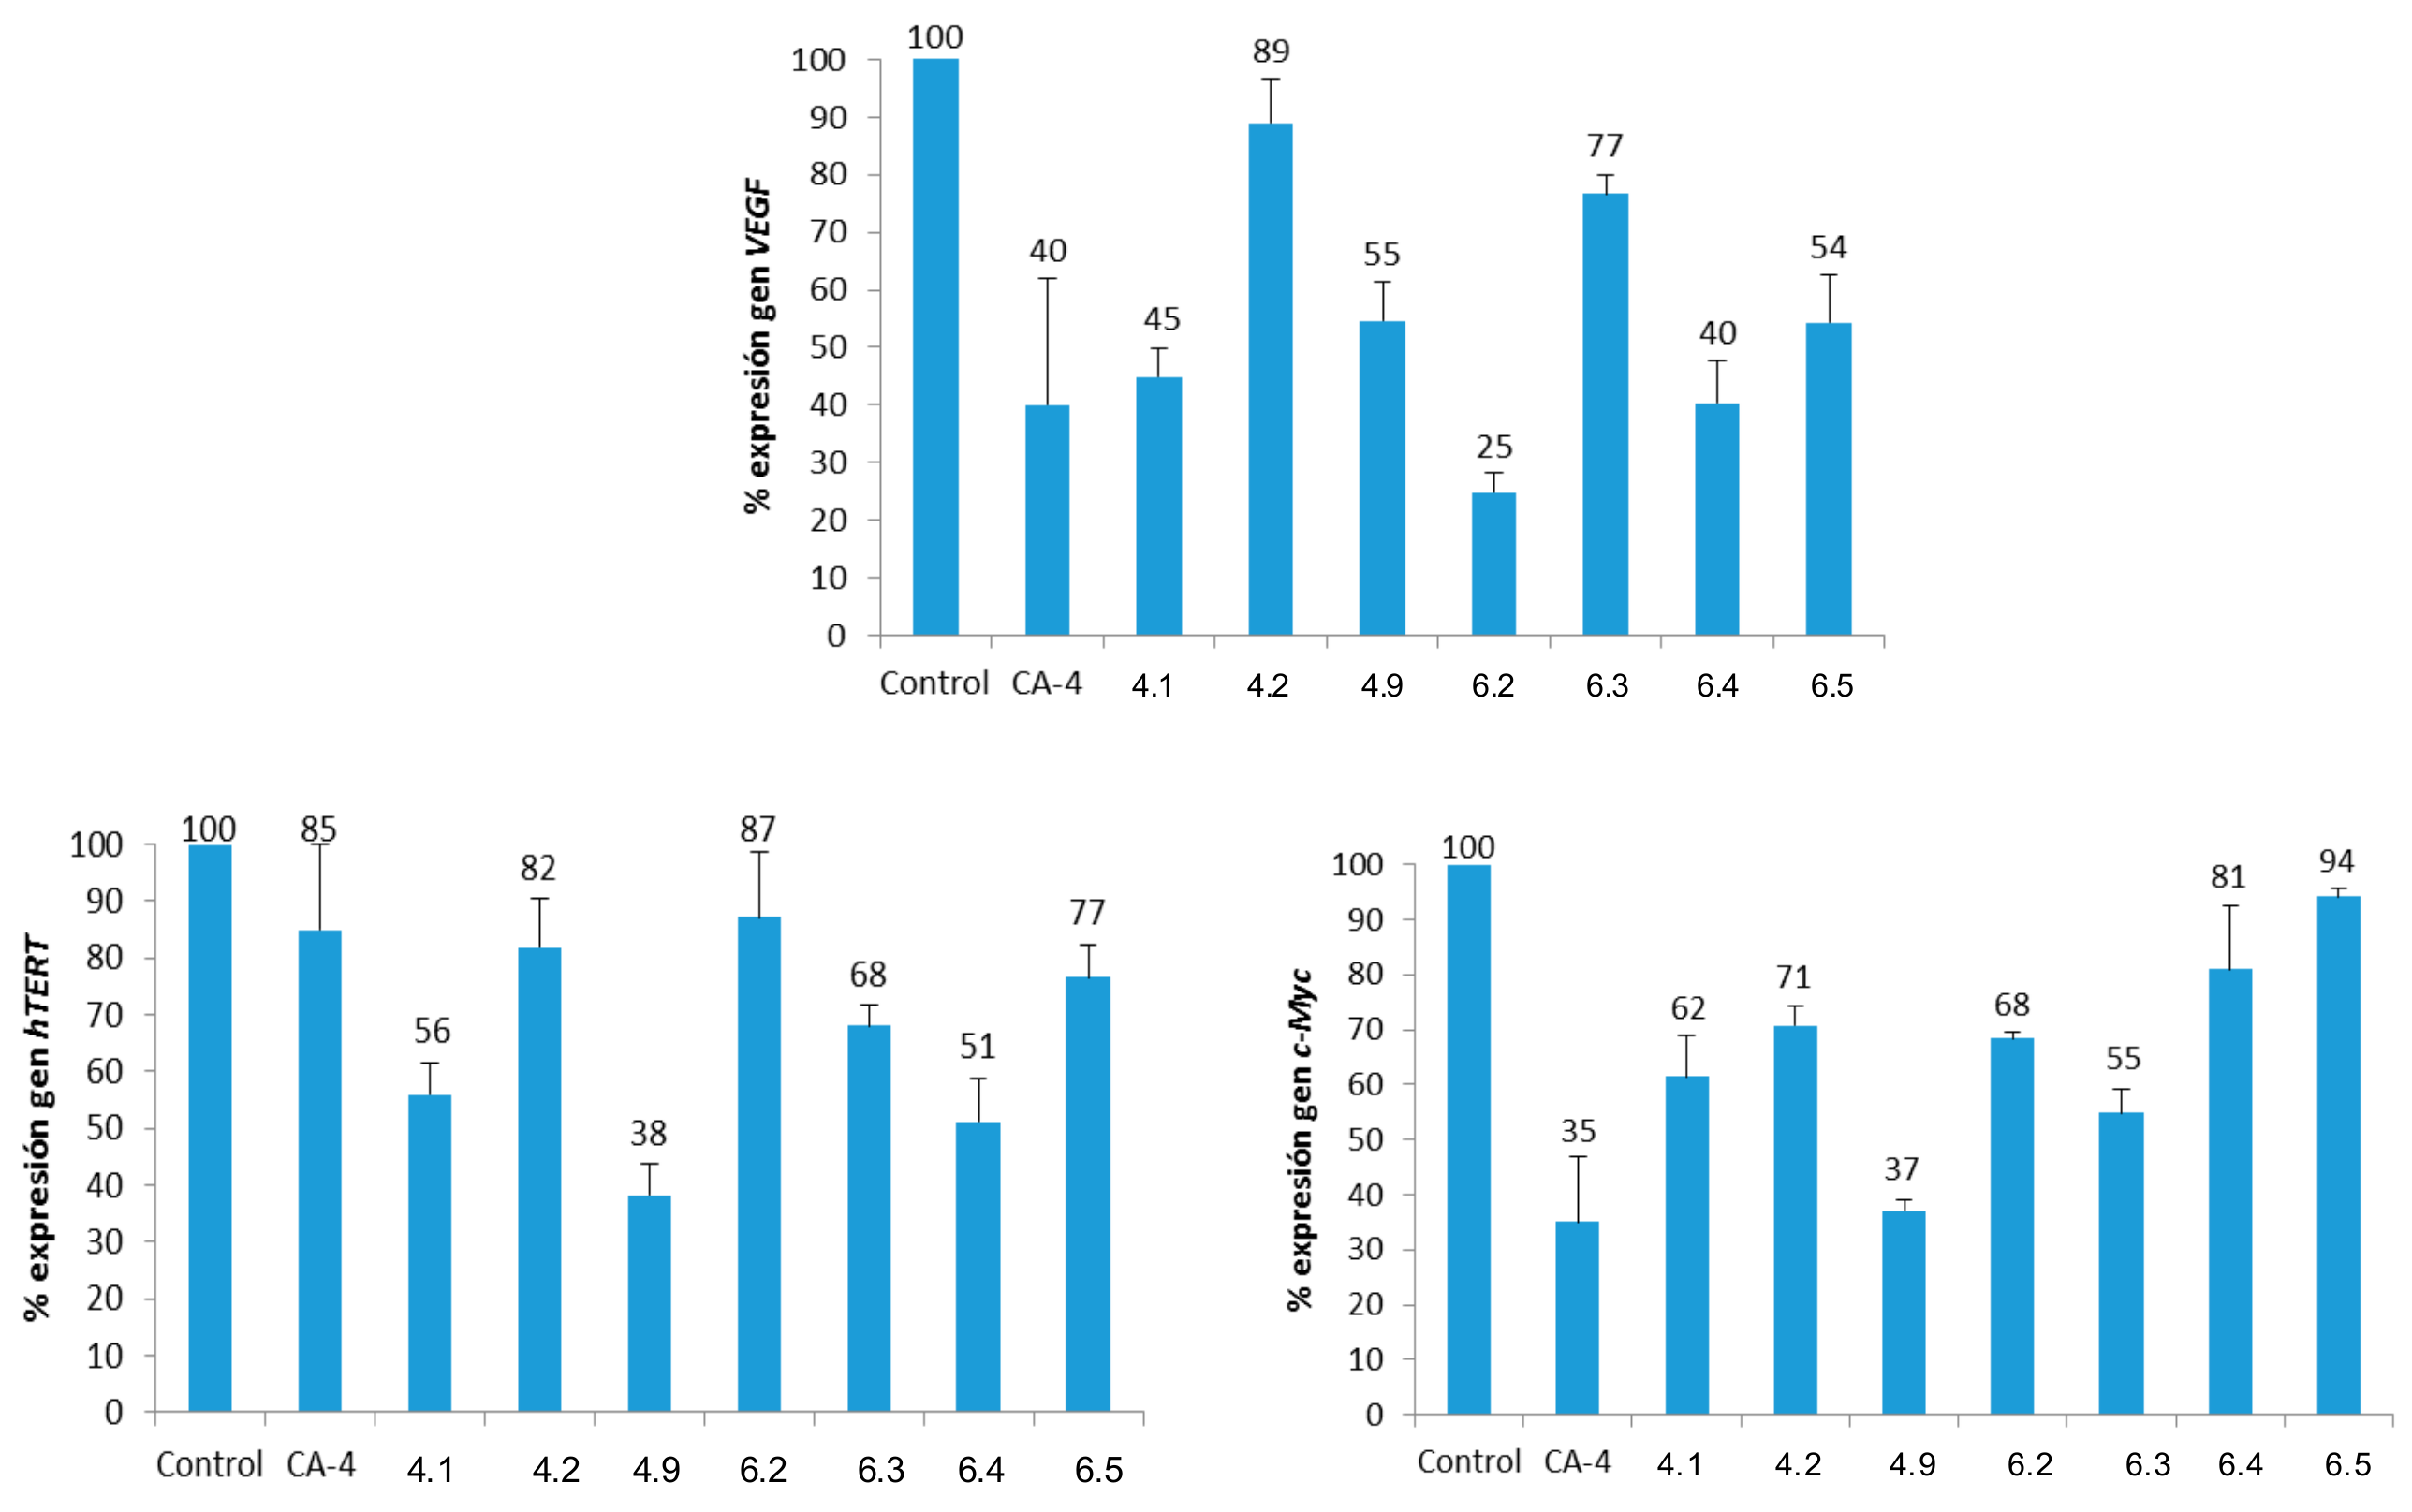
Figure 6.
Percentages of gene expression (normalized to β-actin). Concentrations: CA-4 (15 μM); 4.1 (Gly, 5 μM); 4.5 (L-Pro, 25 μM); 4.9 (L-Met, 25 μM); 6.2 (d-Leu, 25 μM); 6.3 (d-Phe, 25 μM); 6.4 (d-Pro, 25 μM) and 6.5 (d-Ser, 10 μM).
Figure 6.
Percentages of gene expression (normalized to β-actin). Concentrations: CA-4 (15 μM); 4.1 (Gly, 5 μM); 4.5 (L-Pro, 25 μM); 4.9 (L-Met, 25 μM); 6.2 (d-Leu, 25 μM); 6.3 (d-Phe, 25 μM); 6.4 (d-Pro, 25 μM) and 6.5 (d-Ser, 10 μM).
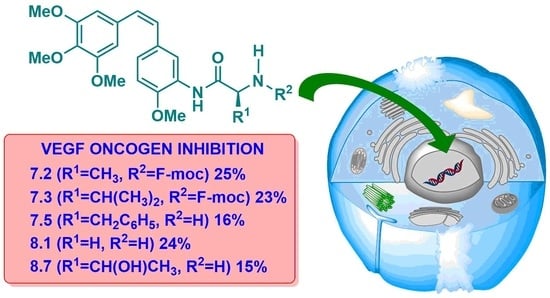
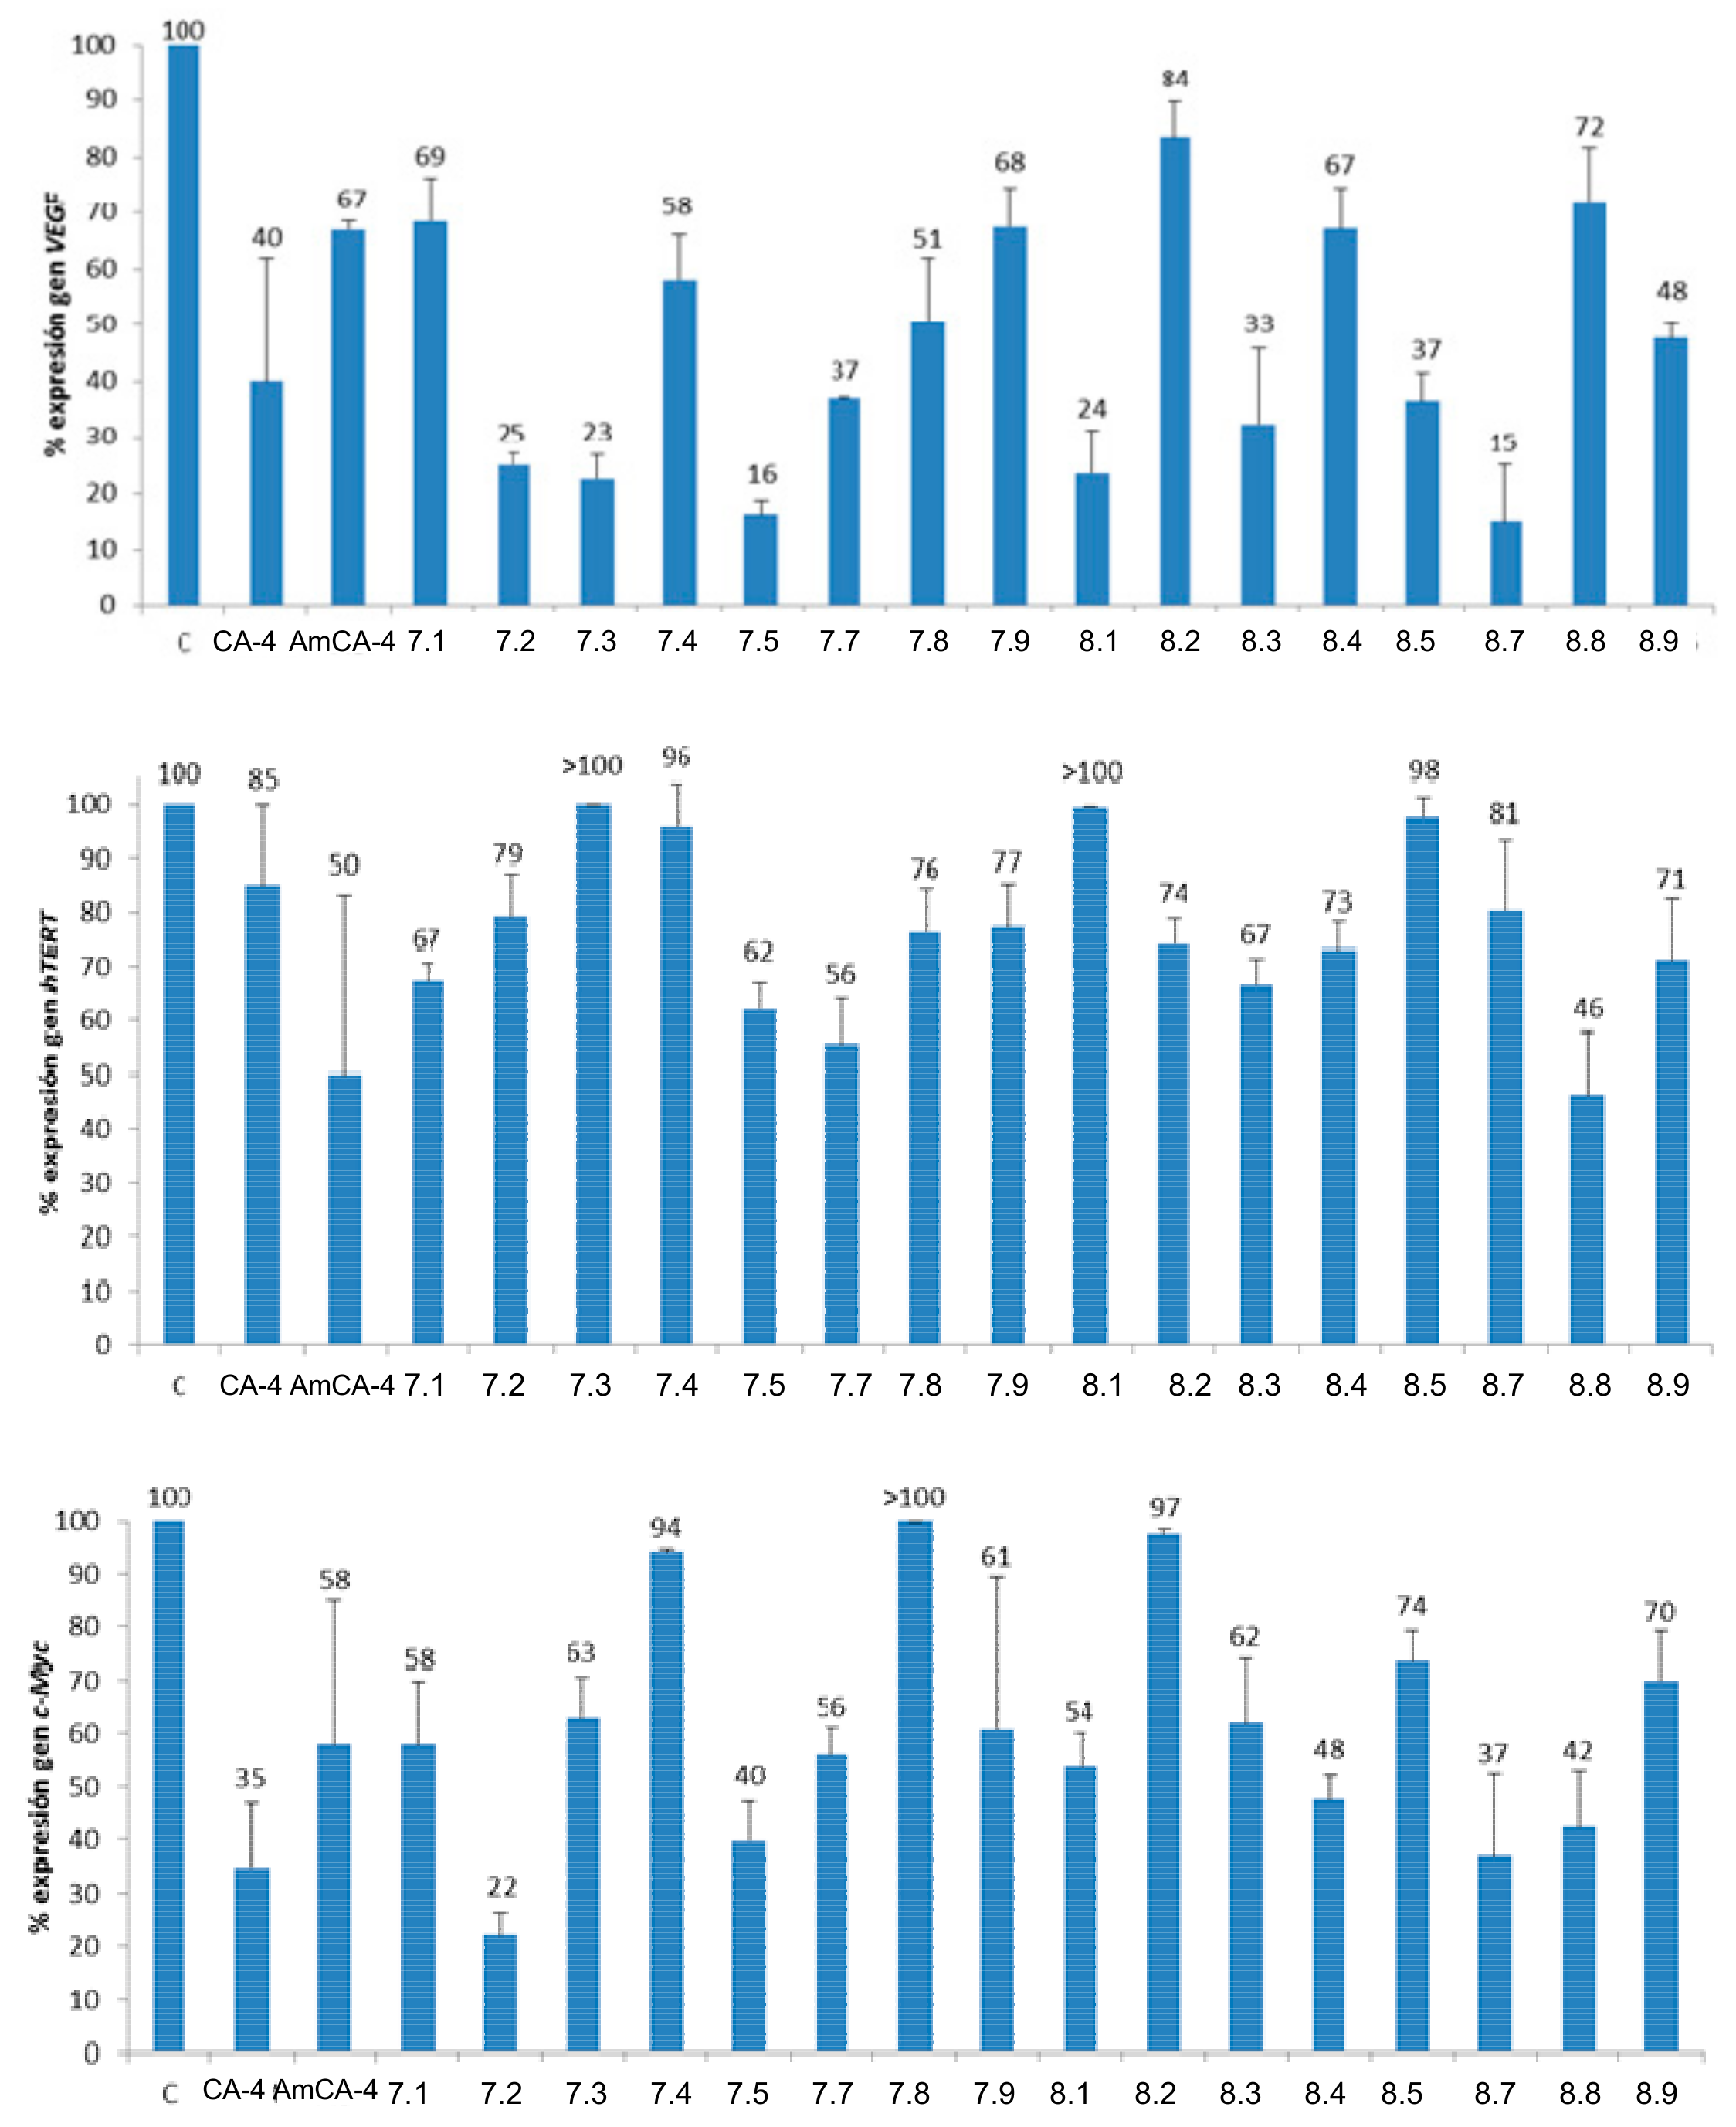
Figure 7.
Percentages of gene expression. Concentrations: CA-4 (15 μM), AmCA-4 (15 nM), 7.1 (7 nM), 7.2 (1.5 nM), 7.3 (4 nM), 7.4 (15 nM), 7.5 (2 nM), 7.7 (7 nM), 7.8 (15 nM), 7.9 (30 nM), 8.1 (7 nM), 8.2 (3 nM), 8.3 (10 nM), 8.4 (1.5 nM), 8.5 (4 nM), 8.7 (7 nM), 8.8 (3 nM) and 8.9 (4 nM).
Figure 7.
Percentages of gene expression. Concentrations: CA-4 (15 μM), AmCA-4 (15 nM), 7.1 (7 nM), 7.2 (1.5 nM), 7.3 (4 nM), 7.4 (15 nM), 7.5 (2 nM), 7.7 (7 nM), 7.8 (15 nM), 7.9 (30 nM), 8.1 (7 nM), 8.2 (3 nM), 8.3 (10 nM), 8.4 (1.5 nM), 8.5 (4 nM), 8.7 (7 nM), 8.8 (3 nM) and 8.9 (4 nM).
Figure 8.
IC50 values (μM) in the logarithmic scale for the HT-29 cell line.
Figure 8.
IC50 values (μM) in the logarithmic scale for the HT-29 cell line.
Table 1.
IC50 values (μM) and SI indexes for CA-4 derivatives a.
Table 1.
IC50 values (μM) and SI indexes for CA-4 derivatives a.
| Comp. | HT-29 | MCF-7 | A-549 | HEK-293 | SIA b | SIB c | SIc d |
|---|
| CA-4 | 4.2 ± 0.5 | 1.0 ± 0.2 | 0.428 ± 0.004 | 25 ± 3 | 5.9 | 25 | 58 |
| 1 | 7 ± 4 | 8 ± 4 | 9 ± 1 | 3.6 ± 0.5 | 0.5 | 0.4 | 0.4 |
| 2 | 33 ± 6 | 11 ± 5 | 38 ± 5 | 12 ± 5 | 0.4 | 1.1 | 0.3 |
| 3.1 | 12 ± 2 | 8 ± 2 | 26 ± 2 | 9 ± 1 | 0.7 | 1.1 | 0.3 |
| 3.2 | 24 ± 4 | 12 ± 6 | 24 ± 1 | 5 ± 2 | 0.2 | 0.4 | 0.2 |
| 3.3 | 29 ± 6 | 19 ± 6 | 8 ± 1 | 9 ± 2 | 0.3 | 0.5 | 1.1 |
| 3.4 | 28 ± 7 | 8 ± 2 | 9 ± 2 | 4 ± 1 | 0.14 | 0.5 | 0.4 |
| 3.5 | 48 ± 5 | 24 ± 2 | 50 ± 10 | 20 ± 1 | 0.4 | 0.8 | 0.4 |
| 3.6 | 9 ± 3 | 7 ± 3 | 18 ± 4 | 7 ± 2 | 0.8 | 1.0 | 0.4 |
| 3.7 | 18 ± 7 | 12 ± 4 | 19 ± 1 | 14 ± 2 | 0.8 | 1.2 | 0.7 |
| 3.8 | 16 ± 5 | 12 ± 4 | 18 ± 1 | 10 ± 2 | 0.6 | 0.8 | 0.6 |
| 3.9 | 16 ± 7 | 10 ± 3 | 10 ± 2 | 8 ± 1 | 0.5 | 0.8 | 0.9 |
| 4.1 | 5 ± 1 | 6 ± 1 | 24 ± 4 | 5 ± 1 | 0.9 | 0.8 | 0.2 |
| 4.2 | 12 ± 5 | 7 ± 1 | 17 ± 2 | 4 ± 1 | 0.4 | 0.6 | 0.3 |
| 4.3 | 15 ± 5 | 16 ± 6 | 14 ± 2 | 9 ± 2 | 0.6 | 0.6 | 0.6 |
| 4.4 | 54 ± 9 | 45 ± 4 | 100 ± 20 | 47 ± 3 | 0.9 | 1.0 | 0.5 |
| 4.5 | 26 ± 13 | 83 ± 16 | 110 ± 10 | 45 ± 16 | 1.7 | 0.5 | 0.4 |
| 4.6 | 39 ± 16 | 27 ± 9 | 36 ± 4 | 17 ± 1 | 0.4 | 0.6 | 0.5 |
| 4.7 | 34 ± 11 | 40 ± 9 | 41 ± 3 | 23 ± 9 | 0.7 | 0.6 | 0.6 |
| 4.8 | 55 ± 5 | 43 ± 7 | 30 ± 7 | 33 ± 1 | 0.6 | 0.8 | 1.1 |
| 4.9 | 32 ± 6 | 13 ± 2 | >300 | 40 ± 4 | 1.3 | 3.1 | <0.1 |
| 5.1 | 27 ± 7 | 9 ± 3 | 5 ± 1 | 3.9 ± 0.6 | 0.1 | 0.4 | 0.8 |
| 5.2 | 26 ± 1 | 16 ± 3 | 22 ± 3 | 13 ± 3 | 0.5 | 0.8 | 0.6 |
| 5.3 | 12 ± 4 | 6 ± 1 | 10 ± 3 | 3.7 ± 1.6 | 0.3 | 0.7 | 0.4 |
| 5.4 | 50 | 10 ± 4 | 15 ± 1 | 5.7 ± 0.8 | 0.1 | 0.6 | 0.4 |
| 5.5 | 11 ± 2 | 7 ± 2 | 28 ± 1 | 9 ± 3 | 0.8 | 1.3 | 0.3 |
| 6.1 | 45 ± 5 | 46 ± 3 | 54 ± 7 | 39 ± 6 | 0.9 | 0.8 | 0.7 |
| 6.2 | 47 ± 9 | 25 ± 2 | 68 ± 1 | 49 ± 12 | 1.0 | 2.0 | 0.7 |
| 6.3 | 27 ± 5 | 43 ± 3 | 60 ± 4 | 46 ± 6 | 1.7 | 1.1 | 0.8 |
| 6.4 | 50 ± 11 | 55 ± 13 | 95 ± 14 | 53 ± 9 | 1.1 | 1.0 | 0.6 |
| 6.5 | 13 ± 1 | 12 ± 1 | >150 | 14 ± 4 | 1.1 | 1.2 | <0.09 |
Table 2.
IC50 values (nM) and SI indexes for AmCA-4 derivatives a.
Table 2.
IC50 values (nM) and SI indexes for AmCA-4 derivatives a.
| Comp. | HT-29 | MCF-7 | A-549 | HEK-293 | SIA b | SIB c | SIc d |
|---|
| CA-4 | 4200 ± 500 | 1000 ± 200 | 428 ± 4 | 25000 ± 3000 | 5.9 | 25 | 60 |
| AmCA-4 | 22 ± 1 | 8 ± 1 | 117 ± 7 | 7 ± 1 | 0.3 | 0.9 | 0.06 |
| 7.1 | 7 ± 4 | 4.8 ± 0.5 | 186 ± 11 | 3.5 ± 1.9 | 0.5 | 0.7 | 0.02 |
| 7.2 | 1.1 ± 0.4 | 1.9 ± 0.8 | 242 ± 13 | 1.5 ± 0.6 | 1.4 | 0.8 | 0.01 |
| 7.3 | 130 ± 40 | 100 ± 50 | 870 ± 60 | 60 ± 20 | 0.5 | 0.6 | 0.07 |
| 7.4 | 23 ± 10 | 9 ± 2 | 490 ± 13 | 14 ± 3 | 0.6 | 1.6 | 0.03 |
| 7.5 | 8 ± 3 | 14 ± 4 | 270 ± 50 | 2.3 ± 2 | 0.3 | 0.2 | 0.01 |
| 7.6 | 320 ± 140 | 58 ± 12 | 1330 ± 90 | 130 ± 30 | 0.4 | 2.2 | 0.1 |
| 7.7 | 9 ± 3 | 25 ± 12 | 422 ± 8 | 13 ± 2 | 1.4 | 0.5 | 0.03 |
| 7.8 | 18 ± 5 | 12 ± 2 | 8900 ± 1200 | 16 ± 2 | 0.9 | 1.3 | 0.01 |
| 7.9 | 33 ± 20 | 5.1 ± 0.3 | 407 ± 23 | 8 ± 4 | 0.2 | 1.6 | 0.02 |
| 8.1 | 10 ± 2 | 9 ± 4 | 400 ± 70 | 10 ± 2 | 1.0 | 1.1 | 0.02 |
| 8.2 | 3.0 ± 0.3 | 4.8 ± 0.5 | 611 ± 16 | 4.0 ± 0.1 | 1.3 | 0.8 | 0.01 |
| 8.3 | 13.3 ± 0.5 | 13 ± 2 | 490 ± 100 | 7.6 ± 0.3 | 0.6 | 0.6 | 0.02 |
| 8.4 | 1.8 ± 0.4 | 1.8 ± 1.2 | 167 ± 23 | 1.7 ± 0.8 | 0.9 | 0.9 | 0.01 |
| 8.5 | 4.4 ± 2.5 | 2.3 ± 1.5 | 141 ± 3 | 3.5 ± 1.9 | 0.8 | 1.5 | 0.02 |
| 8.6 | 700 ± 200 | 3100 ± 600 | 1200 ± 300 | 2400 ± 1400 | 3.4 | 0.8 | 2.0 |
| 8.7 | 8 ± 2 | 12 ± 1 | 410 ± 40 | 14 ± 3 | 1.8 | 1.1 | 0.03 |
| 8.8 | 2.2 ± 1.2 | 4.9 ± 0.2 | 206 ± 20 | 2.7 ± 1.4 | 1.2 | 0.5 | 0.01 |
| 8.9 | 4.9 ± 0.1 | 3.4 ± 1.2 | 90 ± 30 | 3.7 ± 0.3 | 0.7 | 1.1 | 0.04 |
| 9.1 | 5500 ± 700 | 4800 ± 500 | 7340 ± 230 | 5100 ± 700 | 0.9 | 1.1 | 0.7 |
| 9.2 | 44000 ± 6000 | 3100 ± 500 | 48000 ± 3000 | 2400 ± 400 | 0.05 | 0.8 | 0.05 |
| 9.3 | 13000 ± 5000 | 4500 ± 1700 | 18500 ± 1700 | 11200 ± 1500 | 0.9 | 2.5 | 0.6 |
| 9.4 | 5300 ± 300 | 5300 ± 1100 | 12800 ± 800 | 3100 ± 1100 | 0.6 | 0.6 | 0.2 |
| 10.1 | 4800 ± 600 | 4700 ± 700 | 9900 ± 1300 | 2400 ± 300 | 0.5 | 0.5 | 0.2 |
| 10.2 | 1050 ± 140 | 2000 ± 900 | 157 ± 7 | 430 ± 40 | 0.4 | 0.2 | 2.7 |
| 10.3 | 3900 ± 800 | 2000 ± 800 | 2900 ± 500 | 3500 ± 900 | 0.9 | 1.8 | 1.2 |
| 10.4 | 4400 ± 1900 | 600 ± 140 | 7030 ± 220 | 3000 ± 600 | 0.7 | 5.0 | 0.4 |
Table 3.
Critical concentration (CrC) values for the assembly of purified tubulin in GAB in the presence of CA-4 derivatives.
Table 3.
Critical concentration (CrC) values for the assembly of purified tubulin in GAB in the presence of CA-4 derivatives.
| Comp. | CrC (µM) | Comp. | CrC (µM) | Comp. | CrC (µM) |
|---|
| Control | 7.9 ± 1.2 | 3.8 | 13.26 ± 0.19 | 5.1 | 13.31 ± 0.01 |
| CA-4 | 21.5 ± 0.8 | 3.9 | 8.06 ± 0.04 | 5.2 | 13.2 ± 0.5 |
| 1 | 13.6 ± 0.3 | 4.1 | 9.3 ± 0.4 | 5.3 | 13.1 ± 0.8 |
| 2 | 12.0 ± 0.7 | 4.2 | 9.3 ± 0.3 | 5.4 | 9 ± 3 |
| 3.1 | 9.52 ± 0.05 | 4.3 | 8 ± 3 | 5.5 | 9.2 ± 0.9 |
| 3.2 | 11.7 ± 2.3 | 4.4 | 11.4 ± 0.7 | 6.1 | 9.4 ± 1.3 |
| 3.3 | 9.4 ± 1.4 | 4.5 | 9.2 ± 0.5 | 6.2 | 11 ± 3 |
| 3.4 | 13.20 ± 0.06 | 4.6 | 7.9 ± 1.6 | 6.3 | 9.2 ± 0.4 |
| 3.5 | 10.4 ± 2.0 | 4.7 | 10.1 ± 1.8 | 6.4 | 10 ± 3 |
| 3.6 | 13.00 ± 0.10 | 4.8 | 8.5 ± 2.0 | 6.5 | 9.25 ± 0.16 |
| 3.7 | 10 ± 3 | 4.9 | 8.6 ± 0.4 | | |
Table 4.
Critical Concentration (CrC) values for the assembly of purified tubulin in GAB in the presence of AmCA-4 derivatives.
Table 4.
Critical Concentration (CrC) values for the assembly of purified tubulin in GAB in the presence of AmCA-4 derivatives.
| Comp. | CrC (µM) | Comp. | CrC (µM) | Comp. | CrC (µM) |
|---|
| Control | 7.9 ± 1.2 | 7.8 | 10.1 ± 1.1 | 8.9 | 8.5 ± 1.2 |
| CA-4 | 21.5 ± 0.8 | 7.9 | 7.1 ± 0.4 | 9.1 | 8.9 ± 1.5 |
| AmCA-4 | 23 ± 3 | 8.1 | 10.2 ± 1.8 | 9.2 | 6.5 ± 0.7 |
| 7.1 | 11 ± 4 | 8.2 | 13.9 ± 1.5 | 9.3 | 6.6 ± 0.2 |
| 7.2 | 9.4 ± 0.3 | 8.3 | 9.3 ± 0.5 | 9.4 | 11.4 ± 0.2 |
| 7.3 | 6.9 ± 0.3 | 8.4 | 8.3 ± 0.3 | 10.1 | 12.8 ± 0.3 |
| 7.4 | 9.9 ± 0.8 | 8.5 | 9.1 ± 0.9 | 10.2 | 7.0 ± 0.5 |
| 7.5 | 8.1 ± 1.6 | 8.6 | 8.4 ± 0.1 | 10.3 | 7.7 ± 2.1 |
| 7.6 | 6.0 ± 0.5 | 8.7 | 12.3 ± 0.6 | 10.4 | 8.7 ± 1.2 |
| 7.7 | 12.0 ± 0.3 | 8.8 | 7.7 ± 0.8 | | |
Table 5.
It50 values.
| Compound | It50 (min) |
|---|
| Control | 16.6 ± 1.0 |
| Paclitaxel | 3.2 ± 0.4 |
| CA-4 | 21.5 ± 0.8 |
| AmCA-4 | 23 ± 3 |
| 7.1 | 16 ± 3 |
| 7.7 | 19.2 ± 0.3 |
| 8.1 | 18.5 ± 2.1 |
| 8.2 | 48 ± 5 |
| 8.7 | 65 ± 7 |
| 9.4 | 16.5 ± 0.3 |
| 10.1 | 17.1 ± 1.3 |
Table 6.
Cell cycle distribution for CA-4 and selected compounds after 24 h of treatment.
Table 6.
Cell cycle distribution for CA-4 and selected compounds after 24 h of treatment.
| Comp. | Conc. (μM) | G0/G1 | S | G2/M |
|---|
| Control | - | 75 ± 4 | 11 ± 2 | 14 ± 2 |
| CA-4 | 0.05 | 25 ± 1 | 15 ± 1 | 60 ± 2 |
| 1 | 50 | 23 ± 5 | 22 ± 4 | 55 ± 8 |
| 3.2 | 75 | 42 ± 3 | 14 ± 4 | 44 ± 1 |
| 3.3 | 75 | 45 ± 6 | 19 ± 2 | 36 ± 4 |
| 3.4 | 50 | 33 ± 4 | 16 ± 5 | 51 ± 2 |
| 3.5 | 100 | 77 ± 2 | 16 ± 2 | 7 ± 1 |
| 3.6 | 75 | 30 ± 9 | 17 ± 6 | 53 ± 3 |
| 3.7 | 75 | 25 ± 5 | 18 ± 1 | 57 ± 6 |
| 3.8 | 75 | 17 ± 2 | 18 ± 1 | 65 ± 1 |
| 3.9 | 75 | 47 ± 4 | 17 ± 3 | 36 ± 1 |
| 4.1 | 75 | 68 | 12 | 20 |
| 4.2 | 50 | 17 ± 2 | 16 ± 3 | 67 ± 4 |
| 4.3 | 75 | 22 ± 6 | 15 ± 2 | 63 ± 5 |
| 4.5 | 75 | 72 | 12 | 16 |
| 4.9 | 75 | 76 | 11 | 13 |
| 5.1 | 25 | 53 ± 8 | 16 ± 2 | 31 ± 7 |
| 5.2 | 100 | 43 ± 4 | 23 ± 4 | 34 ± 1 |
| 5.3 | 50 | 38 ± 2 | 19 ± 2 | 43 ± 1 |
| 5.4 | 75 | 36 ± 4 | 14 ± 3 | 50 ± 1 |
| 6.1 | 100 | 67 ± 2 | 20 ± 2 | 13 ± 1 |
| 6.2 | 75 | 85 ± 1 | 3 ± 2 | 12 ± 1 |
| 6.3 | 75 | 74 ± 3 | 11 ± 6 | 14 ± 2 |
| 6.4 | 75 | 71 | 14 | 15 |
| 6.5 | 75 | 64 | 18 | 18 |
Table 7.
Cell cycle distribution for CA-4, AmCA-4 and selected compounds after 24 h of treatment.
Table 7.
Cell cycle distribution for CA-4, AmCA-4 and selected compounds after 24 h of treatment.
| Compound | Conc. (µM) | G0/G1 | S | G2/M |
|---|
| Control | - | 75 ± 4 | 11 ± 2 | 14 ± 2 |
| CA-4 | 0.05 | 25 ± 1 | 15 ± 1 | 60 ± 2 |
| AmCA-4 | 0.125 | 26 ± 1 | 15 ± 2 | 59 ± 2 |
| 7.1 | 0.5 | 28 ± 1 | 18 ± 2 | 54 ± 1 |
| 7.2 | 0.5 | 28 ± 1 | 19 ± 2 | 53 ± 2 |
| 7.5 | 2 | 34 ± 2 | 20 ± 1 | 46 ± 3 |
| 7.9 | 2 | 72 ± 2 | 18 ± 1 | 10 ± 3 |
| 8.1 | 2 | 32 ± 5 | 22 ± 2 | 46 ± 4 |
| 8.2 | 3 | 28 ± 1 | 14 ± 4 | 58 ± 5 |
| 8.3 | 2 | 65 ± 2 | 20 ± 1 | 15 ± 2 |
| 8.4 | 0.5 | 35 ± 1 | 17 ± 2 | 48 ± 1 |
| 8.5 | 0.5 | 46 ± 2 | 28 ± 11 | 26 ± 10 |
| 8.7 | 2 | 31 ± 1 | 18 ± 1 | 51 ± 2 |
| 8.8 | 0.5 | 30 ± 2 | 18 ± 1 | 52 ± 3 |
| 8.9 | 0.2 | 30 ± 1 | 19 ± 1 | 51 ± 2 |
| 10.1 | 40 | 26 ± 2 | 14 ± 1 | 60 ± 1 |
| 10.2 | 0.5 | 63 ± 4 | 16 ± 3 | 22 ± 2 |


 ,
, 


