Article

Effect of Heat Treatment on the Chemical Structure and Thermal Properties of Softwood-Derived Glycol Lignin

1
Center for Advanced Materials, Forestry and Forest Products Research Institute (FFPRI), 1 Matsunosato, Tsukuba, Ibaraki 305-8687, Japan
2
Research Institute for Sustainable Humanosphere, Kyoto University, Gokasho, Uji, Kyoto 611-0011, Japan
3
Research Unit for Development and Global Sustainability, Kyoto University, Gokasho, Uji, Kyoto 611-0011, Japan
*
Authors to whom correspondence should be addressed.
Molecules 2020, 25(5), 1167; https://doi.org/10.3390/molecules25051167
Submission received: 15 February 2020 / Revised: 3 March 2020 / Accepted: 3 March 2020 / Published: 5 March 2020
(This article belongs to the Special Issue Lignin – A Natural Resource with Huge Potential)

Abstract

:
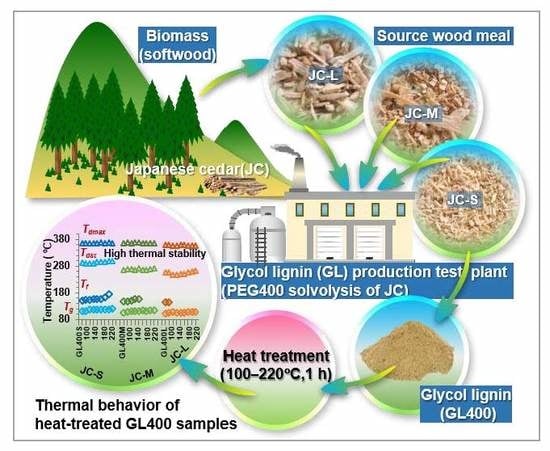
A large-scale glycol lignin (GL) production process (50 kg wood meal per batch) based on acid-catalyzed polyethylene glycol (PEG) solvolysis of Japanese cedar (JC) was developed at the Forestry and Forest Products Research Institute (FFPRI), Tsukuba, Japan. JC wood meal with various particle size distributions (JC-S < JC-M < JC-L) (average meal size, JC-S (0.4 mm) < JC-M (0.8 mm) < JC-L (1.6 mm)) and liquid PEG with various molecular masses are used as starting materials to produce PEG-modified lignin derivatives, namely, GLs, with various physicochemical and thermal properties. Because GLs are considered a potential feedstock for industrial applications, the effect of heat treatment on GL properties is an important issue for GL-based material production. In this study, GLs obtained from PEG400 solvolysis of JC-S, JC-M, and JC-L were subjected to heating in a constant-temperature drying oven at temperatures ranging from 100 to 220 °C for 1 h. All heat-treated GL series were thermally stable, as determined from the Klason lignin content, TMA, and TGA analyses. SEC analysis suggests the possibility of condensation among lignin fragments during heat treatment. ATR-FTIR spectroscopy, thioacidolysis, and 2D HSQC NMR demonstrated that a structural rearrangement occurs in the heat-treated GL400 samples, in which the content of α–PEG-βO-4 linkages decreases along with the proportional enrichments of β–5 and ββ linkages, particularly at treatment temperatures above 160 °C.

Graphical Abstract

1. Introduction

Lignin is known as the most abundant aromatic biopolymer in nature, representing 15%–35% of the cell wall components of typical vascular plants including trees, where it functions as a bonding agent between cells to provide cell walls with outstanding resistance against external physical, chemical, and biological reactions [1]. Lignin is readily available in large quantities as a major byproduct of pulp and paper plants and lignocellulosic biofuel industries. Lignins from chemical pulping processes are primarily used as fuel feedstock, while only a small portion of technical lignins in the form of kraft lignin, alkali lignin, and lignosulfonate are used for value-added products because of their diverse chemical structures and heterogeneity, which largely depend on the sources, processing conditions, and isolation method [2,3,4]. Lignins typically consist of three types of phenylpropane units, i.e., p-hydroxyphenyl (H), guaicyl (G), and syringyl (S) units, with various interunit linkages such as βO–4 (40%–60%), β–5 (4%–10%), and biphenyl (3.5%–25%) [5]. Depending on the type of biomass resource used (e.g., softwood, hardwood, or grass), different proportions of phenylpropane units and diverse interunit linkages occur, resulting in wide variations in lignin macromolecules, with a high degree of complexity and heterogeneity [6,7,8]. Because of these heterogeneous features, high-value applications of technical lignins are rather limited. It is difficult to change the process conditions to obtain lignin with specific properties, as lignin is only a byproduct. Numerous studies and developments on effective isolation methods to obtain lignin with specific properties have been reported [9,10,11,12,13], and some of these approaches have been integrated in chemical pulping processes and realized in large-scale plants [9,10,11]. In addition, the organosolv fractionation method has been widely used to isolate lignin from biomass, for which efficient lignin isolation yields with high purity and high pulp yield have been reported [14].
Considering the issues of structural heterogeneity and the subsequent processing required for lignin byproducts, we propose the use of softwood as an initial biomass resource to produce lignin derivatives as the main product. Because softwoods are known to contain lignins almost exclusively composed of G units, lignin derivatives can be produced with less structural heterogeneity in terms of the aromatic unit [1,15]. Utilizing the abundance of Japan’s softwood plantation forests, 50% of which are occupied by Japanese cedar (Cryptomeria japonica; JC), we have developed a large-scale (50 kg wood meal per batch) lignin production process based on technically feasible and environmentally benign acid-catalyzed polyethylene glycol (PEG) solvolysis of JC. A test plant was developed in 2015 at the Forestry and Forest Products Research Institute (FFPRI), Tsukuba, Japan, under a project of the Strategic Innovation Promotion (SIP) Lignin Research Consortium [16]. JC wood meals with various particle size distributions (JC-S < JC-M < JC-L) and liquid PEG with various molecular masses (PEG200 < PEG400 < PEG600) are typically used as starting raw materials to produce PEG-modified lignin, namely, glycol lignin (GL). The effectiveness of the production process has been elucidated by investigating the influence of these two main raw materials on the yield, chemical structure, average molecular mass, and thermal properties of the resulting GLs when operating under constant reaction conditions. It has been found that the chemical structure of GLs contains three main intermonomeric linkage types, i.e., α-PEG-β–O–4, β–5, and ββ linkages, indicating that the substitution of PEG moieties occurs primarily at the benzyl (α) carbon in α-OH-β–O–4 units in the source JC lignins during PEG solvolysis, giving rise to α-PEG-β–O–4 units. The PEGylation of lignin exhibits a viscous thermal flow at temperature above the glass transition state, providing suitable space for the molecular motion of rigid lignin side chains [16,17]. This type of thermal fusibility is crucial for thermal processing in material fabrication. Hence, the application of GLs to value-added functional materials, including flexible electronic substrates [18,19], fiber-reinforced plastics [20], elastomeric epoxy resins [21], and heat-resistant insulation films [22], has been explored, aiming to promote large-scale GL utilization in various applications, particularly for high-value-added GL-based high-performance materials.
Because GLs are considered a potential feedstock for industrial applications, the effect of heat treatment on GL properties is an important parameter to consider for efficiently integrating GL with other counterparts and to obtain the intended characteristics of the target products. A continuous supply with constant qualities as a common feedstock is another goal for potential industrial implementations of GL-based material production. It is well known that heat treatment alters the chemical structure of lignin as well as its molecular weight due to thermal decomposition and structural rearrangement through a series of chemical reactions, depending on the treatment temperature and duration [23,24,25,26]. In this study, three types of PEG400-substituted GL (GL400) samples obtained from the test plant were subjected to heat treatment in a constant-temperature drying oven at temperatures ranging from 100 to 220 °C for 1 h. To obtain an in-depth understanding of the physicochemical properties of heat-treated GL400 samples, ultraviolet (UV) and Klason lignin analyses, size exclusion chromatography (SEC), attenuated total reflectance Fourier-transform infrared (ATR-FTIR) spectroscopy, thioacidolysis, 2D nuclear magnetic resonance (NMR), thermomechanical analysis (TMA), and thermogravimetric analysis (TGA) were performed to determine the lignin content, average molecular mass, functional group distribution, frequency of ether linkages and intermonomeric linkages, and thermal transition temperatures.

2. Results and Discussion

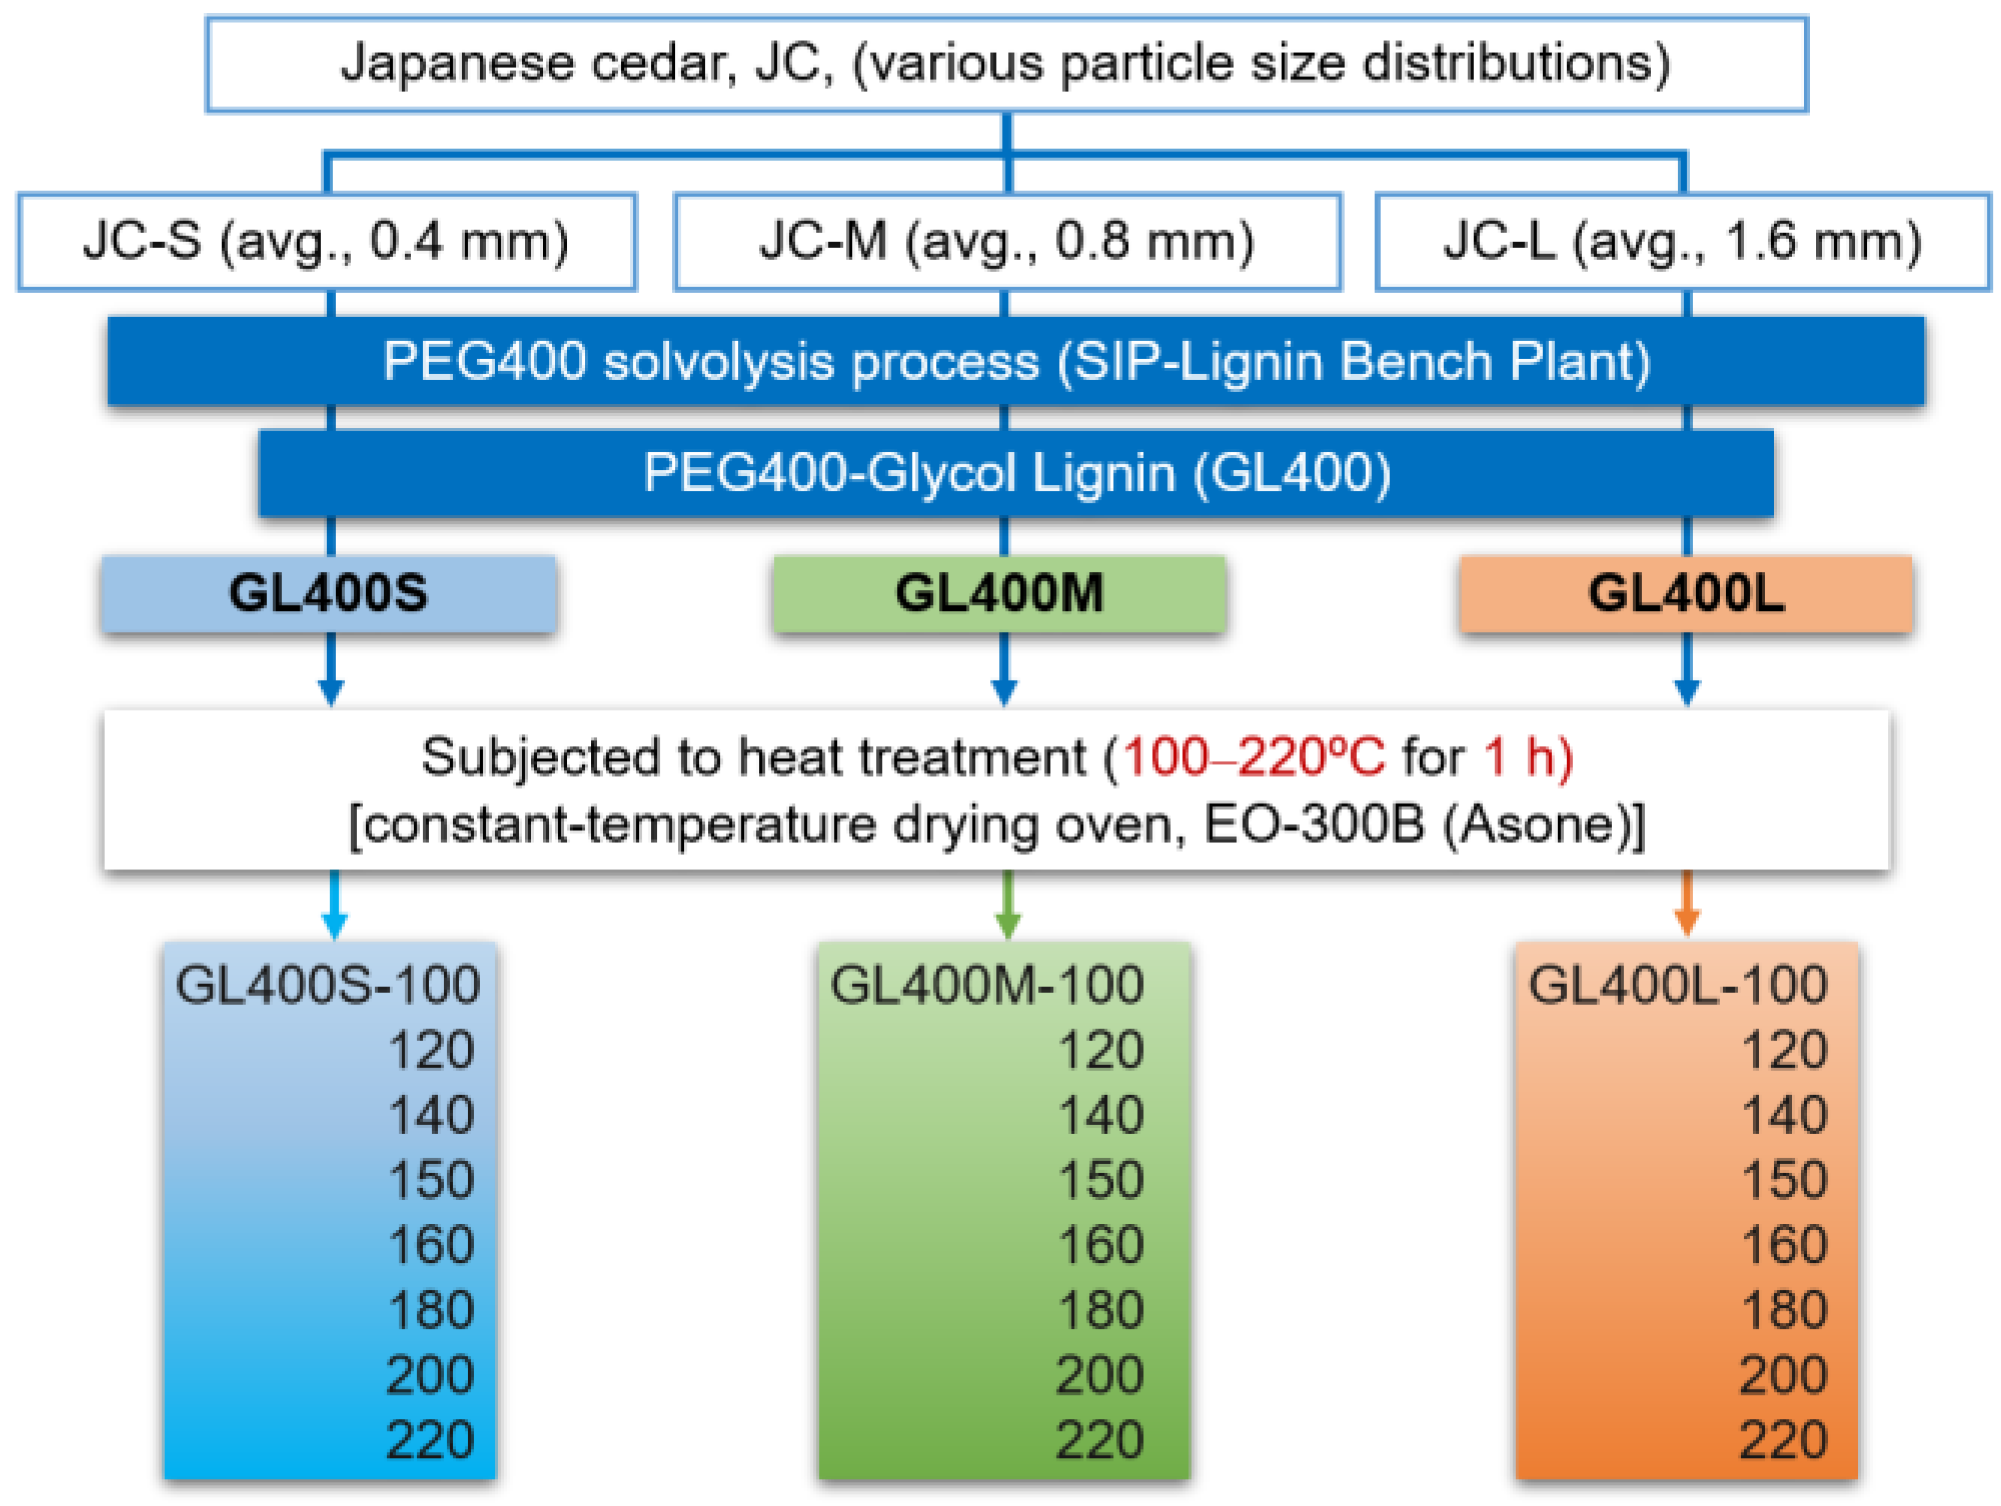
As reported in our previous study, the particle size distribution of the source wood meal (JC) strongly affects the molecular mass, chemical structure, and thermal properties of the resultant GLs. For example, a greater source wood meal size (an average size of 0.4–1.6 mm was applied in the present study range) gives rise to GLs with a higher average molecular mass, higher yield of βO–4-linked units, greater degree of PEGylation, and slightly reduced thermal transition temperatures, such as glass transition temperature (Tg), viscous thermal flow temperature (Tf), decomposition starting temperature (Tdst), and maximum degradation temperature (Tdmax) [16]. Hence, three types of control GL samples, denoted as GL400S, GL400M, and GL400L (Table 1), produced from PEG400 solvolysis of JC-S, JC-M, and JC-L, respectively, were selected for thermal treatment. As shown in Scheme 1, the GL400 samples were subjected to heat treatment at temperatures ranging from 100 to 220 °C in a constant-temperature drying oven for 1 h under atmospheric conditions. The heat-treated GL400 samples were designated based on the GL400-source wood meal size and treatment temperature, e.g., GL400S-100, GL400M-100, GL400L-100, etc. (Scheme 1). The visual color change from pale brown to dark brown observed with increasing temperature suggests that thermochemical reactions, such as depolymerization, side chain cleavage, and repolymerization through condensation, may occur during heat treatment [23,24,25,26], even though only a trace amount of weight loss (less than 1 wt%) was measured after heat treatment.

2.1. Lignin Content of Heat-Treated GL400

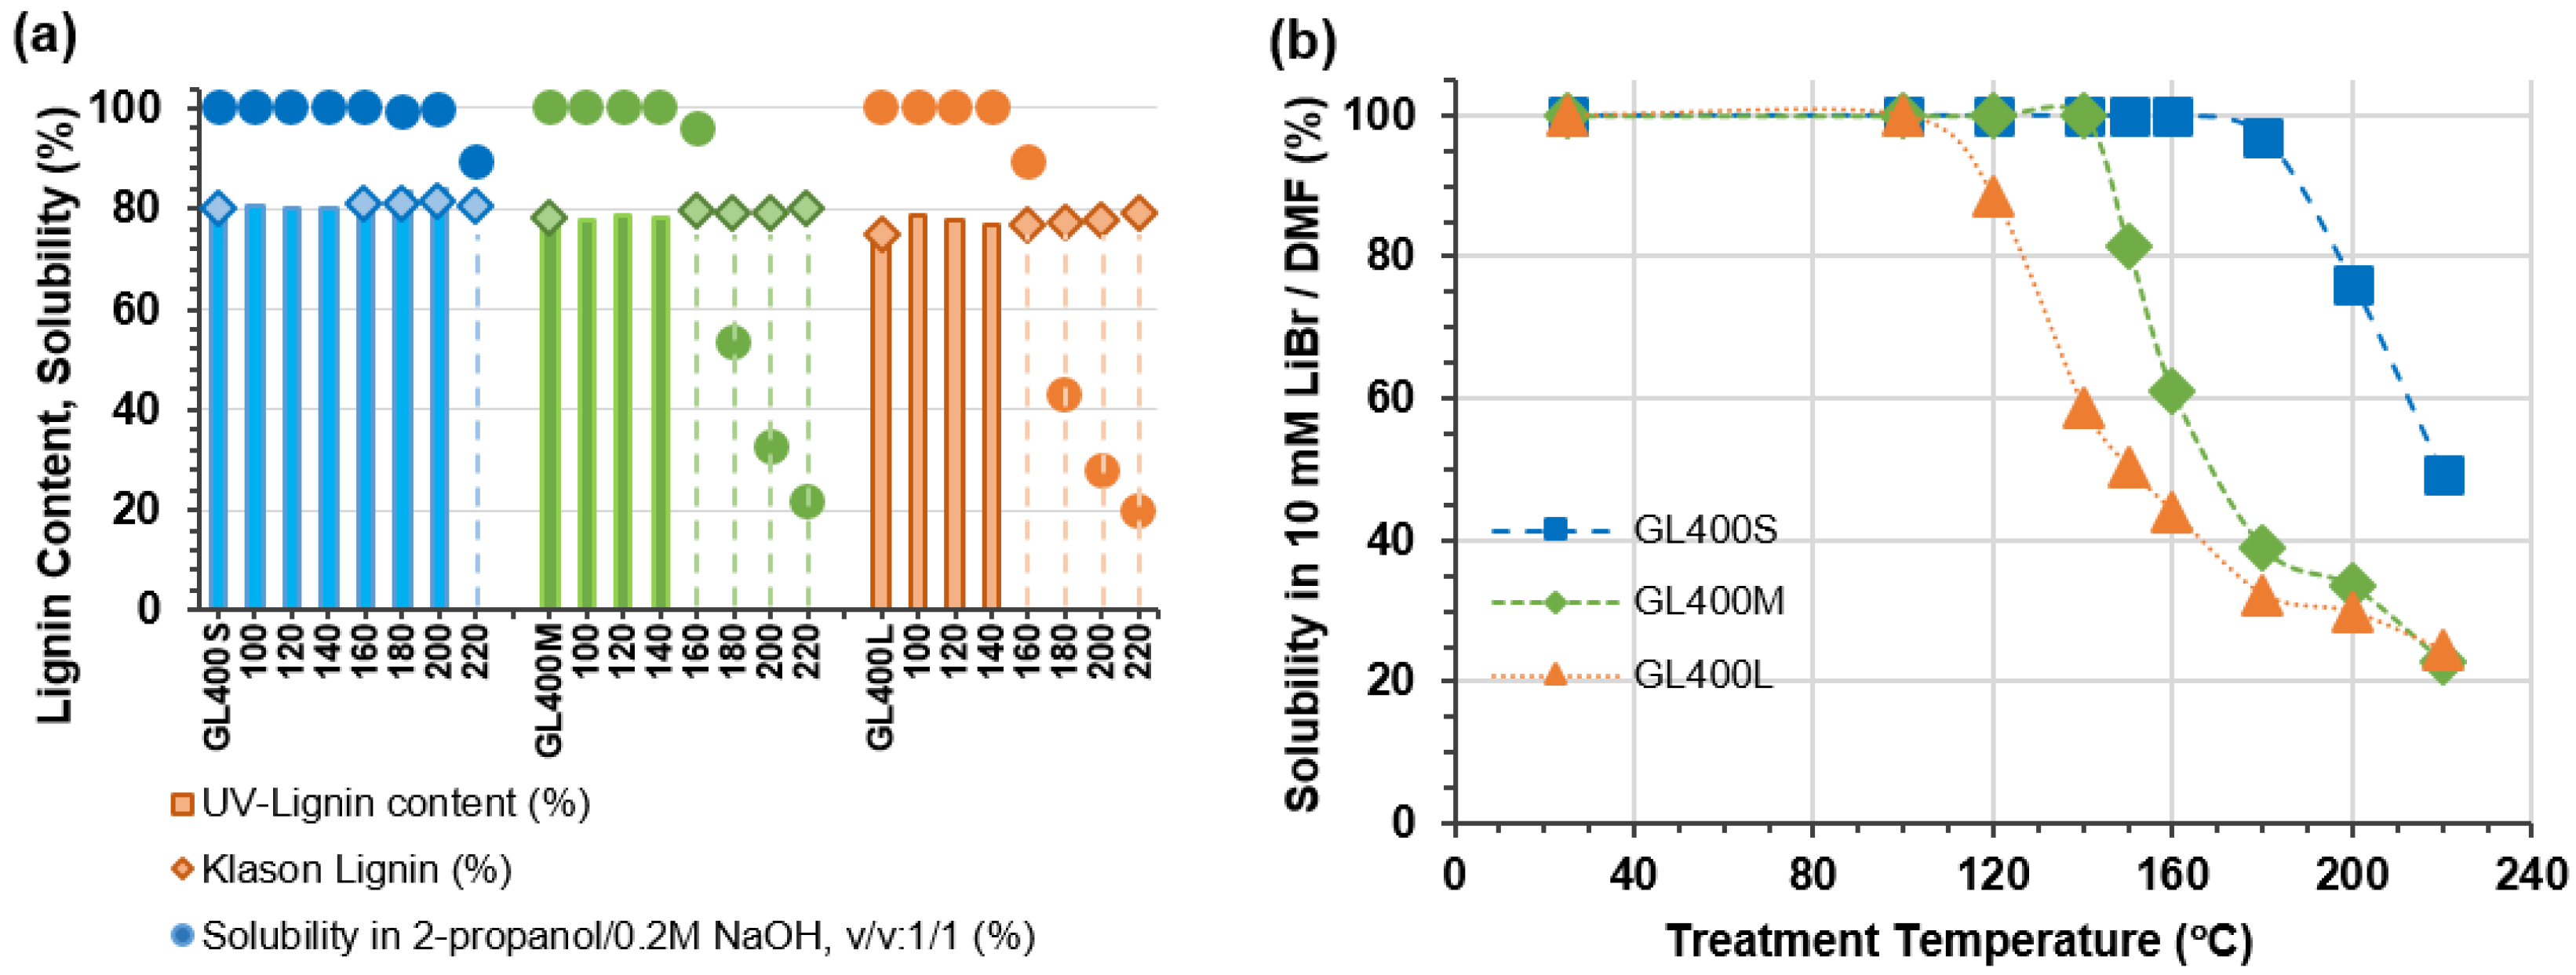
The lignin content of the heat-treated GL400 series was determined by either UV or Klason lignin analysis, as not all samples completely dissolved in the solvent (2-propanol:0.2M NaOH, v/v: 1/1) used for UV analysis, hereafter denoted as the UV solvent. In particular, low solubilities were observed for GL400M and GL400L samples treated at temperatures above 150 °C. The insoluble portion of the GL400M and GL400L series increased with increasing treatment temperature, whereas the GL400S series remained nearly soluble at a treatment temperature of 200 °C. The UV lignin contents of completely soluble samples were found to be similar regardless of the treatment temperature (Figure 1a). In addition, the Klason lignin contents determined for samples treated at 160, 180, 200 and 220 °C for each GL400 series were also similar, although a slight increase was observed with increasing temperature compared with the corresponding GL400 controls (Figure 1a, Table 1). The results of UV and Klason lignin analyses suggest that no significant degradation occurs at temperatures of up to 220 °C for the three GL400 series [24]. However, it appears that a heat-induced structural rearrangement occurs in the GL400M and GL400L series at treatment temperatures above 150 °C, which generate a more condensed structure, as indicated by the UV-solvent insoluble fractions. The UV-solvent soluble fractions most likely consist of GL400 fractions with a higher degree of PEGylation compared with the UV-solvent insoluble fractions, while the PEG content of the heat-treated samples remains largely unchanged.

2.2. Molecular Weight Distribution of Heat-Treated GL400

The average molecular mass (Mw and Mn) of the control GL400S, GL400M, and GL400L samples subjected to heat treatment are 5310/2050, 8150/2360, and 13,630/2590, respectively (Table 1). Low solubility was also observed for the heat-treated GL400 series in the eluent (10 mM LiBr/DMF) used for SEC analysis, which determines the average molecular mass. Low solubilities were observed in samples treated at ≥180 °C in the GL400S series, ≥ 150 °C in the GL400M series, and ≥ 120 °C in the GL400L series (Figure 1b). The variation in low solubility with GL400 type at different treatment temperatures implies that the source wood meal size for the GL400 has a substantial effect.
The average molecular mass (Mw and Mn) increased with increasing temperature in all completely soluble heat-treated samples, and the increase in Mw values was greater than that of the Mn values (Table 1, Figure S1). For a treatment temperature of 220 °C, a considerably higher molecular mass (Mw, 7060) was determined for the moderately soluble fraction of GL400S (49% solubility), whereas lower Mw values of 2110 and 1840 were determined for the partially soluble fractions of GL400M (24% solubility) and GL400L (24% solubility), respectively, compared with the corresponding control samples (Table 1). SEC data revealed that the DMF-insoluble fractions of heat-treated samples in each GL400 series were modified GL400 fractions (heat-induced structural rearrangements, such as a cross-linked and condensed structure) with a considerably higher molecular mass. The extent of this modification was related to the treatment temperature [23]. The DMF-soluble fractions, however, were low-molecular-mass GL400 fractions having PEG–lignin side chains that were not affected by the heat-induced structural rearrangement.

2.3. Chemical Structure of Heat-Treated GL400 Samples

ATR-FTIR spectra of PEG400 (a), milled wood lignin (MWL) extracted from JC-L (b), control GL400L (c), GL400L treated at 220 °C, termed GL400L-220 (d), and the UV-solvent insoluble fraction of GL400L-220 (e) are displayed in Figure 2. The absorption peaks observed at 2870, 1350, 1103–1106, and 947 cm−1 for PEG400 (Figure 2a) correspond to symmetric C–H stretching of methylene groups, CH2 wagging, and C–O stretching, and CH2 rocking vibration [27,28], with strong C–O stretching absorption proximal to 1103 cm−1 being the dominant contribution. Consequently, the appearance of two strong peaks at 1126 cm−1 (C–O–C stretching of ether) and 1092 cm−1 (C–O deformation in secondary alcohol and ether) in GL400L (Figure 2c), compared with the MWL spectrum (Figure 2b) indicate the introduction of PEG moieties into the lignin macromolecules. In addition, two new absorption peaks at 1350 and 947 cm−1 and the enhanced intensity of the C–H stretching vibration at 2873 cm−1 and of the characteristic lignin absorption peaks in the GL400 spectrum further indicate the PEGylation of lignin macromolecules.
The typical absorption peaks of lignin [29] (Figure 2c) are assigned to aromatic and aliphatic O–H stretching (ca. 3410-3413 cm−1), asymmetric C–H stretching of methyl and methylene groups (2933 cm−1), unconjugated (ca. 1714 cm−1) and conjugated (ca. 1666 cm−1) carbonyl stretching in ketone/aldehyde groups, aromatic skeletal vibration or aromatic ring C=C–C stretching (1597 and 1512 cm−1), C–H deformation of methyl and methylene groups (1462-1454 cm−1), aromatic skeletal vibration combined with C–H deformation (1423-1427 cm−1), guaiacyl (G) ring breathing with C–O stretching (1269 cm−1), C–C, C–O, and C=O stretching of G ring (1221-1223 cm−1), and G-type aromatic C–H in-plane deformation and C–O deformation (1034 cm−1). The ATR-FTIR spectrum of GL400L after heat treatment at 220 °C (Figure 2d) displays common features in several regions compared with that of the corresponding control GL400L, whereas a notable difference is observed in the spectrum of its UV-solvent insoluble fraction (Figure 2e). The O–H absorption peak centered at 3417 cm−1 for GL400L-220 (Figure 2d) was shifted to a lower wavenumber of 3410 cm−1, with a broad peak for the UV-solvent insoluble GL400L-220. In addition, a notably enhanced intensity at 1653 cm−1 (carbonyl stretching in conjugated aryl ketone) and a weakened unconjugated carbonyl absorption peak at 1714 cm−1 were observed in the UV-solvent insoluble fraction (Figure 2e). It is possible that the cleavage of βO–4 linkages under heat treatment involves the formation of ketones via reactive benzyl cations [7,23,30].
A semiquantitative examination was performed to measure the relative absorbance using the peak at 1512 cm−1 (aromatic ring C=C–C stretching) as an internal reference to normalize all spectra. The measured relative intensities of selected peaks for the GL400L and GL400M series treated at 200–220 °C and their respective UV-solvent insoluble fractions are listed in Table 2 and Table 3, respectively.
As displayed in Table 2 for the GL400L series, the reduced relative intensity at 949–951 cm−1 and the increased relative intensity at 1354–1356 cm−1 for PEG in the UV-solvent insoluble fractions indicate that the PEG–lignin side chains are involved in the structural rearrangement. Moreover, compared with the corresponding counterparts, the increase in relative intensity at 1421 and 1460 cm−1 for the UV-solvent insoluble fraction, corresponding to aromatic skeletal vibration combined with C–H in-plane deformation and C–H bending of CH3 and CH2 groups, suggests an enrichment in condensed bonds with increasing treatment temperature. In addition to the increased intensity, the broad absorption peak at 1593 cm−1 (aromatic skeletal vibration combined with C=O stretching) further supports the presence of structural diversity around the aromatic rings. The proportional increase in aromatic C–C bonds, such as β–5 and ββ, mainly due to the decomposition of βO–4 ether linkages, is also supported by the HSQC NMR data discussed below. The same trend was observed for the heat-treated GL400M series (Table 3). Overall, the FTIR spectral data provide evidence of structural rearrangements occurring during heat treatment, particularly at ≥ 180 °C, where the UV-solvent insoluble portions were determined to account for 50%–80% depending on the GL400 type and treatment temperature (Figure 1a).
For a further in-depth structural characterization of heat-treated GL400 samples, thioacidolysis and 2D HSQC NMR (Table 1 and Figure 3) were performed. The cleavage of βO–4 linkages is a common feature of many lignin depolymerization and degradation pathways for any type of thermal treatment [23,24,30]. Supporting this contention, analytical thioacidolysis, which quantifies lignin monomers released from βO–4 units upon chemical degradation [31,32], of the heat-treated GL400 samples indicated that the amount of βO–4 units per Klason lignin (Table 1) decreased with different degrees depending on the treatment temperature and the size of the source wood meal. In consistent with our previous work [16], the monomer yield of control GL400 samples decreased with decreasing source wood meal size (GL400L > GL400M > GL400S). For the same treatment temperature range of 100–220 °C, the GL400S series showed little or relatively minor change, whereas the GL400M and GL400L series showed a sharp decrease in the thioacidolysis monomer yield at treatment temperatures of ≥ 200° and ≥ 160 °C, respectively (Table 1). Thioacidolysis data therefore suggest that the source wood meal size used for GL production affect not only the amount of βO–4 units in GL400 [16] but also their chemical rearrangements upon the heat treatment.
Solution-state HSQC NMR spectra of selected heat-treated GL samples (Table 1) were recorded using DMSO-d6 as solvent; the solubility of each heat-treated GL sample was more or less similar to that in the LiBr/DMF system described earlier (Figure 1b). In consistent with our earlier work [16], the HSQC spectra of all the tested GL400 samples displayed signals from the major intermonomeric units, i.e., α–PEG-β–O–4 (I’), β–5 (II) and ββ (III), along with those from aromatic methoxyl (OMe) and PEG (P) residues, comprising lignin and PEG fractions for GL400 samples (Figure 3); signals from α–OH-β–O–4 (I) units abundant in the source JC lignin were undetectable in all the GL400 spectra (Figure 3), indicating their complete conversions during the solvolysis process to produce each GL sample. Relative intensities of well-resolved Cα–Hα contours from α–PEG-β–O–4 (I’), β–5 (II) and ββ (III) units were used to estimate the change of lignin structures upon the heat treatment. Consequently, the proportions of α–PEG-β–O–4 () were significantly depleted, whereas the proportions of β–5 (II) and ββ (III) units were instead increased, particularly at treatment temperatures above 160 °C (Figure 3, Table 1). The NMR data suggest that the chemical structure rearrangements primarily involve β–O–4 linkages, leaving β–5 and ββ linkages relatively unchanged during heat treatment at temperatures above 160 °C. We also observed that P2/OMe signal ratio, which reflects PEG/lignin ratio, was considerably increased in the spectra of GL400 samples treated at 220 °C compared with those observed in the spectra of the untreated GL400 samples and GL400 samples treated at 100 and 160 °C (Table 1, Figure 3). Given that large portions of GL400 samples treated at 220 °C became insoluble and inaccessible by NMR (Figure 1b), we deduced that relatively PEG-rich GL400 fractions left soluble (and accessible by NMR) after lignin condensation upon the heat treatment [23,25,30] had made relatively lignin-rich GL400 fractions insoluble (and inaccessible by NMR). This notion was corroborated by the SEC and ATR-FTIR data described earlier (Table 1, Table 2 and Table 3).

2.4. Thermal Properties of Heat-Treated GL400 Samples

TMA and TGA were performed to elucidate the thermal behavior of the heat-treated GL400 series. TMA measures the glass transition temperature (Tg) and the viscous thermal flow temperature (Tf), while TGA measures the decomposition starting temperature (Tdst) and the maximum degradation temperature (Tdmax).
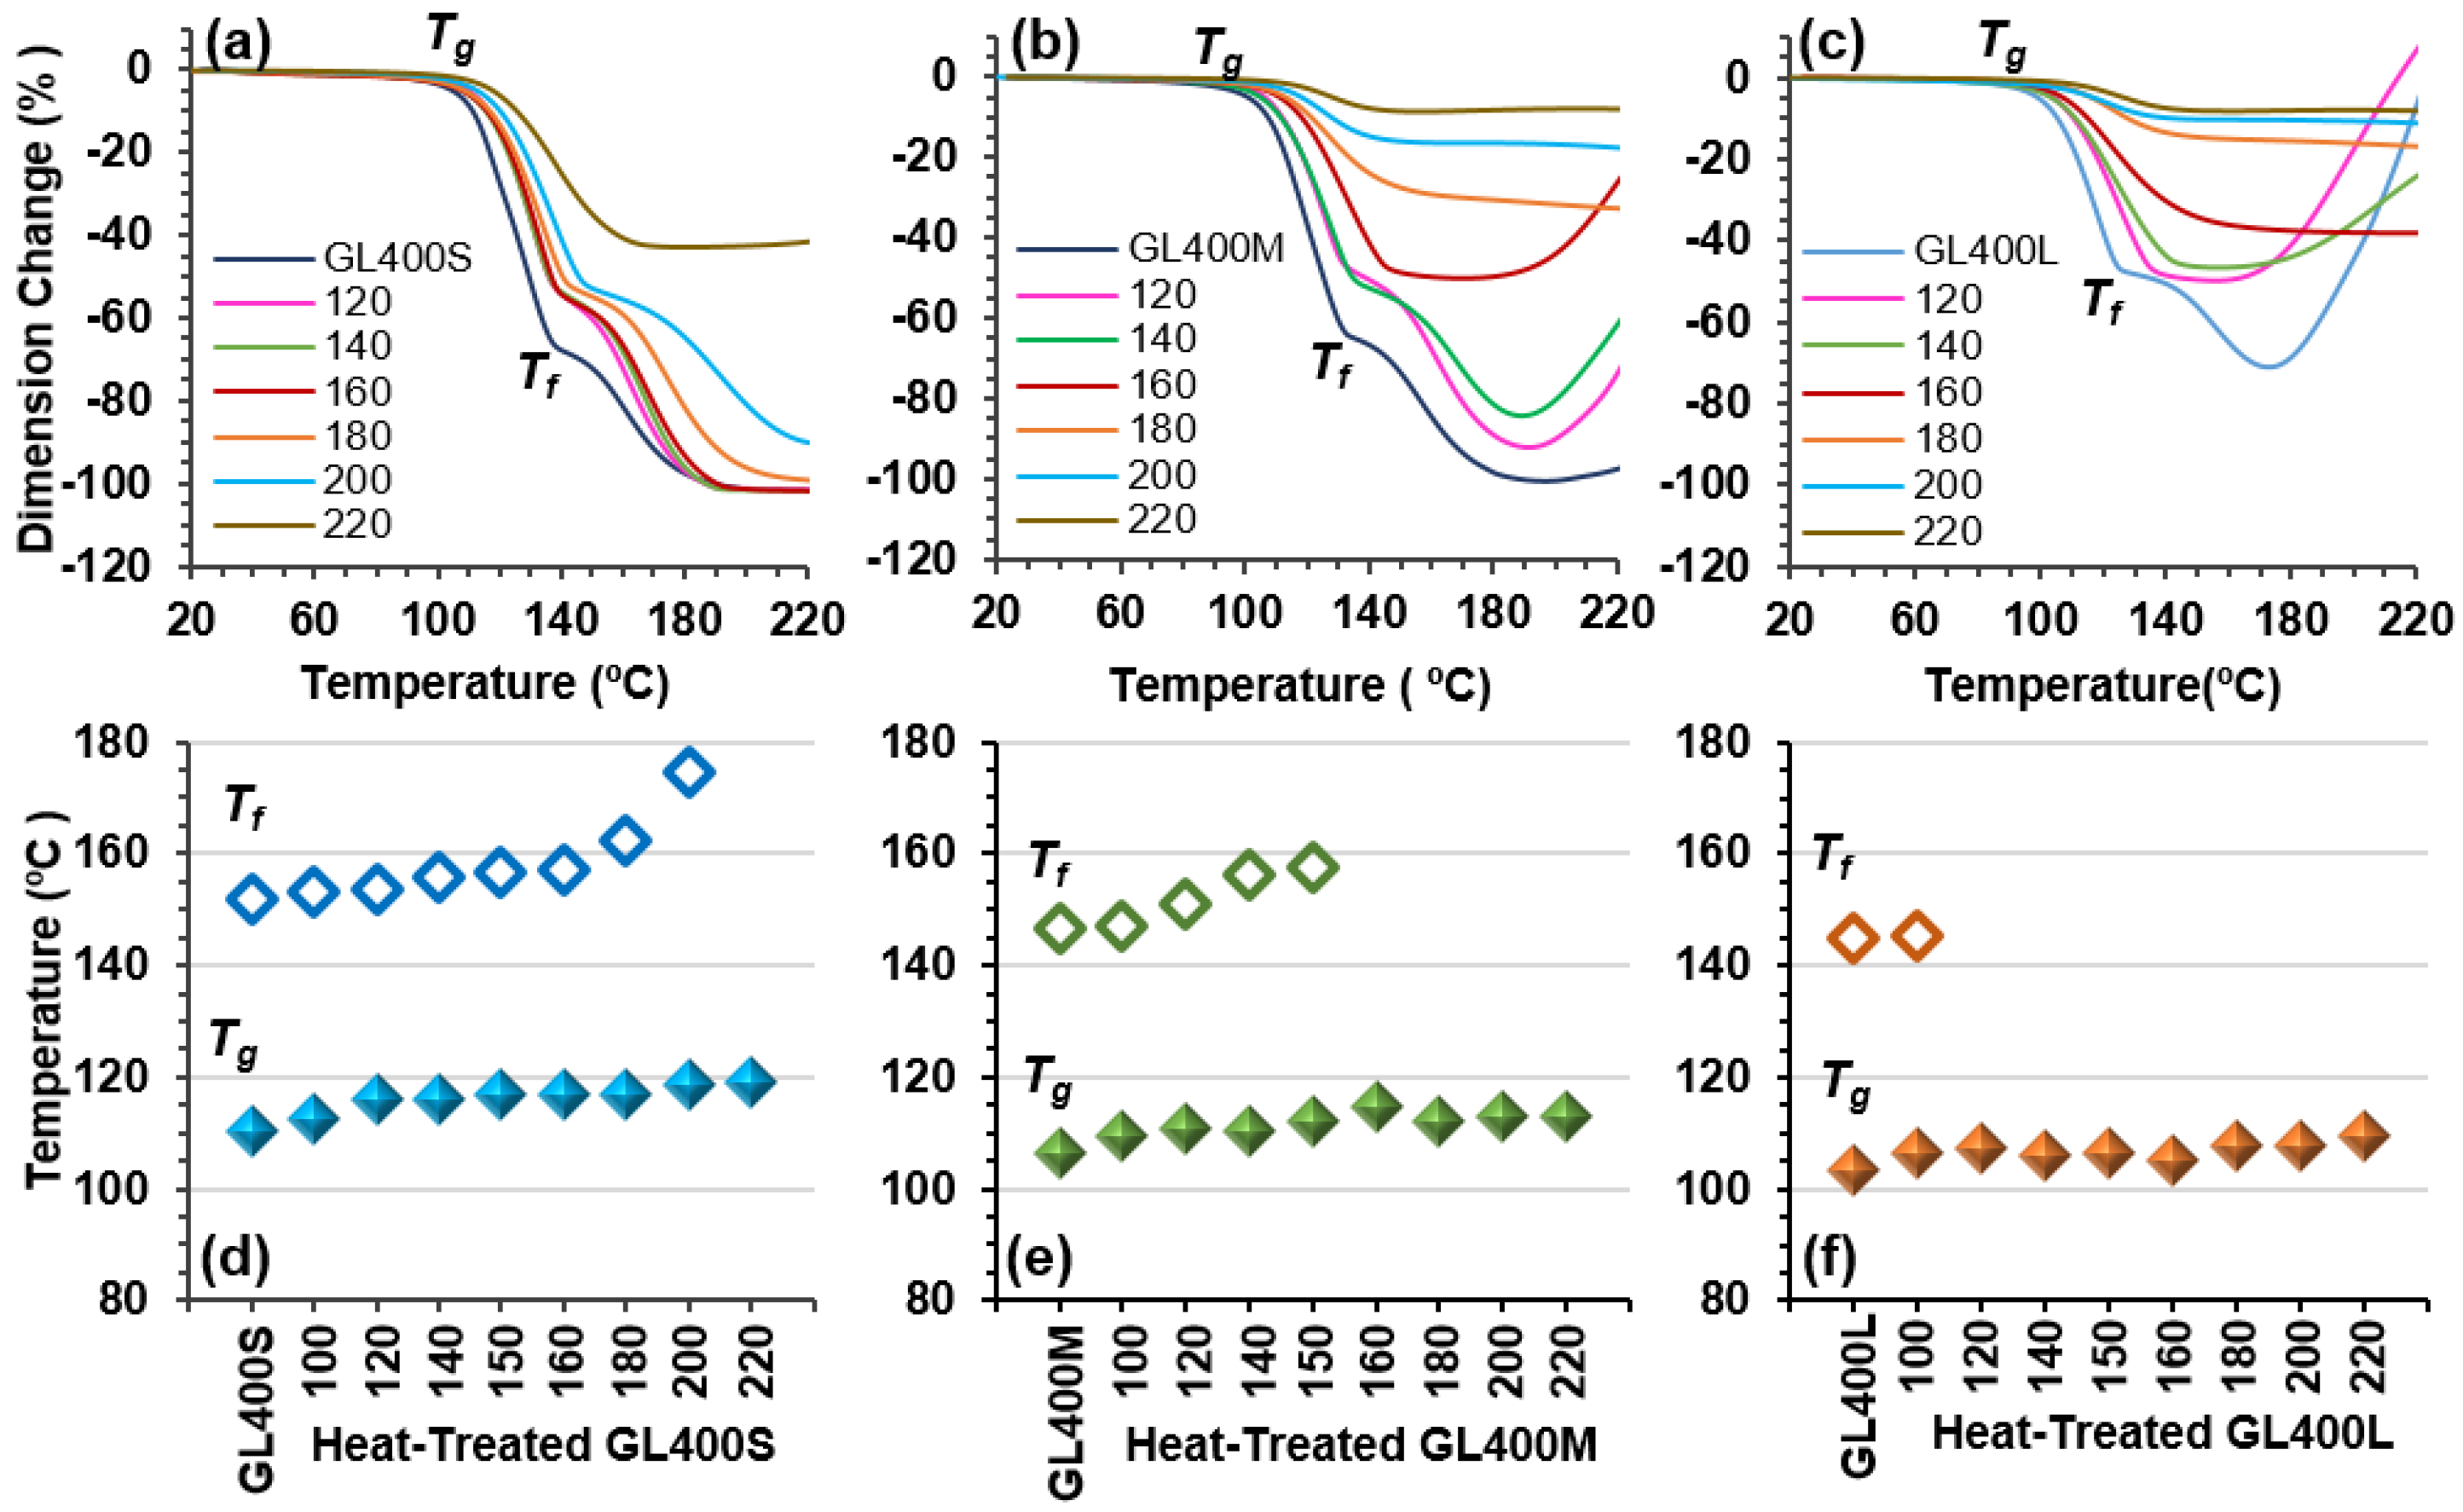
As reported in our previous studies [16,17], the PEGylation of the lignin macromolecules gave rise to a second thermal transition temperature (Tf) above Tg for all of the GLs, where the temperature range depends on the source wood meal size and the PEG molecular mass used for GL production. As the GLs in this study were produced from PEG400 solvolysis with three source wood meal sizes (JC-S < JC-M < JC-L), the corresponding GL400S, GL400M, and GL400L samples had Tg and Tf values of 110, 106, 104 °C and 152, 146, 145 °C, respectively. The GL400S produced from the smaller source wood meal had higher Tg and Tf values, even though its average molecular mass was lower than that of the other two series (Table 1). The Tg and Tf values are related to the degree of PEGylation and the relative proportions of major intermonomeric linkage units: α–PEG-β–O–4, β–5, and ββ (Table 1). Consequently, the lower proportions of α–PEG-β–O–4 signals and the higher proportions of ββ signals in GL400S compared with those of GL400M and GL400L give rise to higher Tg and Tf values. Both of the thermal transition temperatures for the heat-treated GL400S series gradually increased with increasing temperature up to 200 °C, where the increment in Tf was higher than that of Tg, and Tf was not detected after heat treatment at 220 °C (Figure 4a,d). Notably, Tf was no longer detected in the GL400M (Figure 4b,e) and GL400L (Figure 4c,f) series after heat treatment at 160 and 100 °C, respectively. As stated above, the average molecular mass of the heat-treated GL400 series increased with increasing temperature, along with chemical structure rearrangements, including the enrichment of a cross-linked and condensed structure; the extent of this enrichment depended on the GL400 type. The molecular motion of the PEG–lignin side chains became limited, and Tf was no longer observed once the side chains movement was restricted.
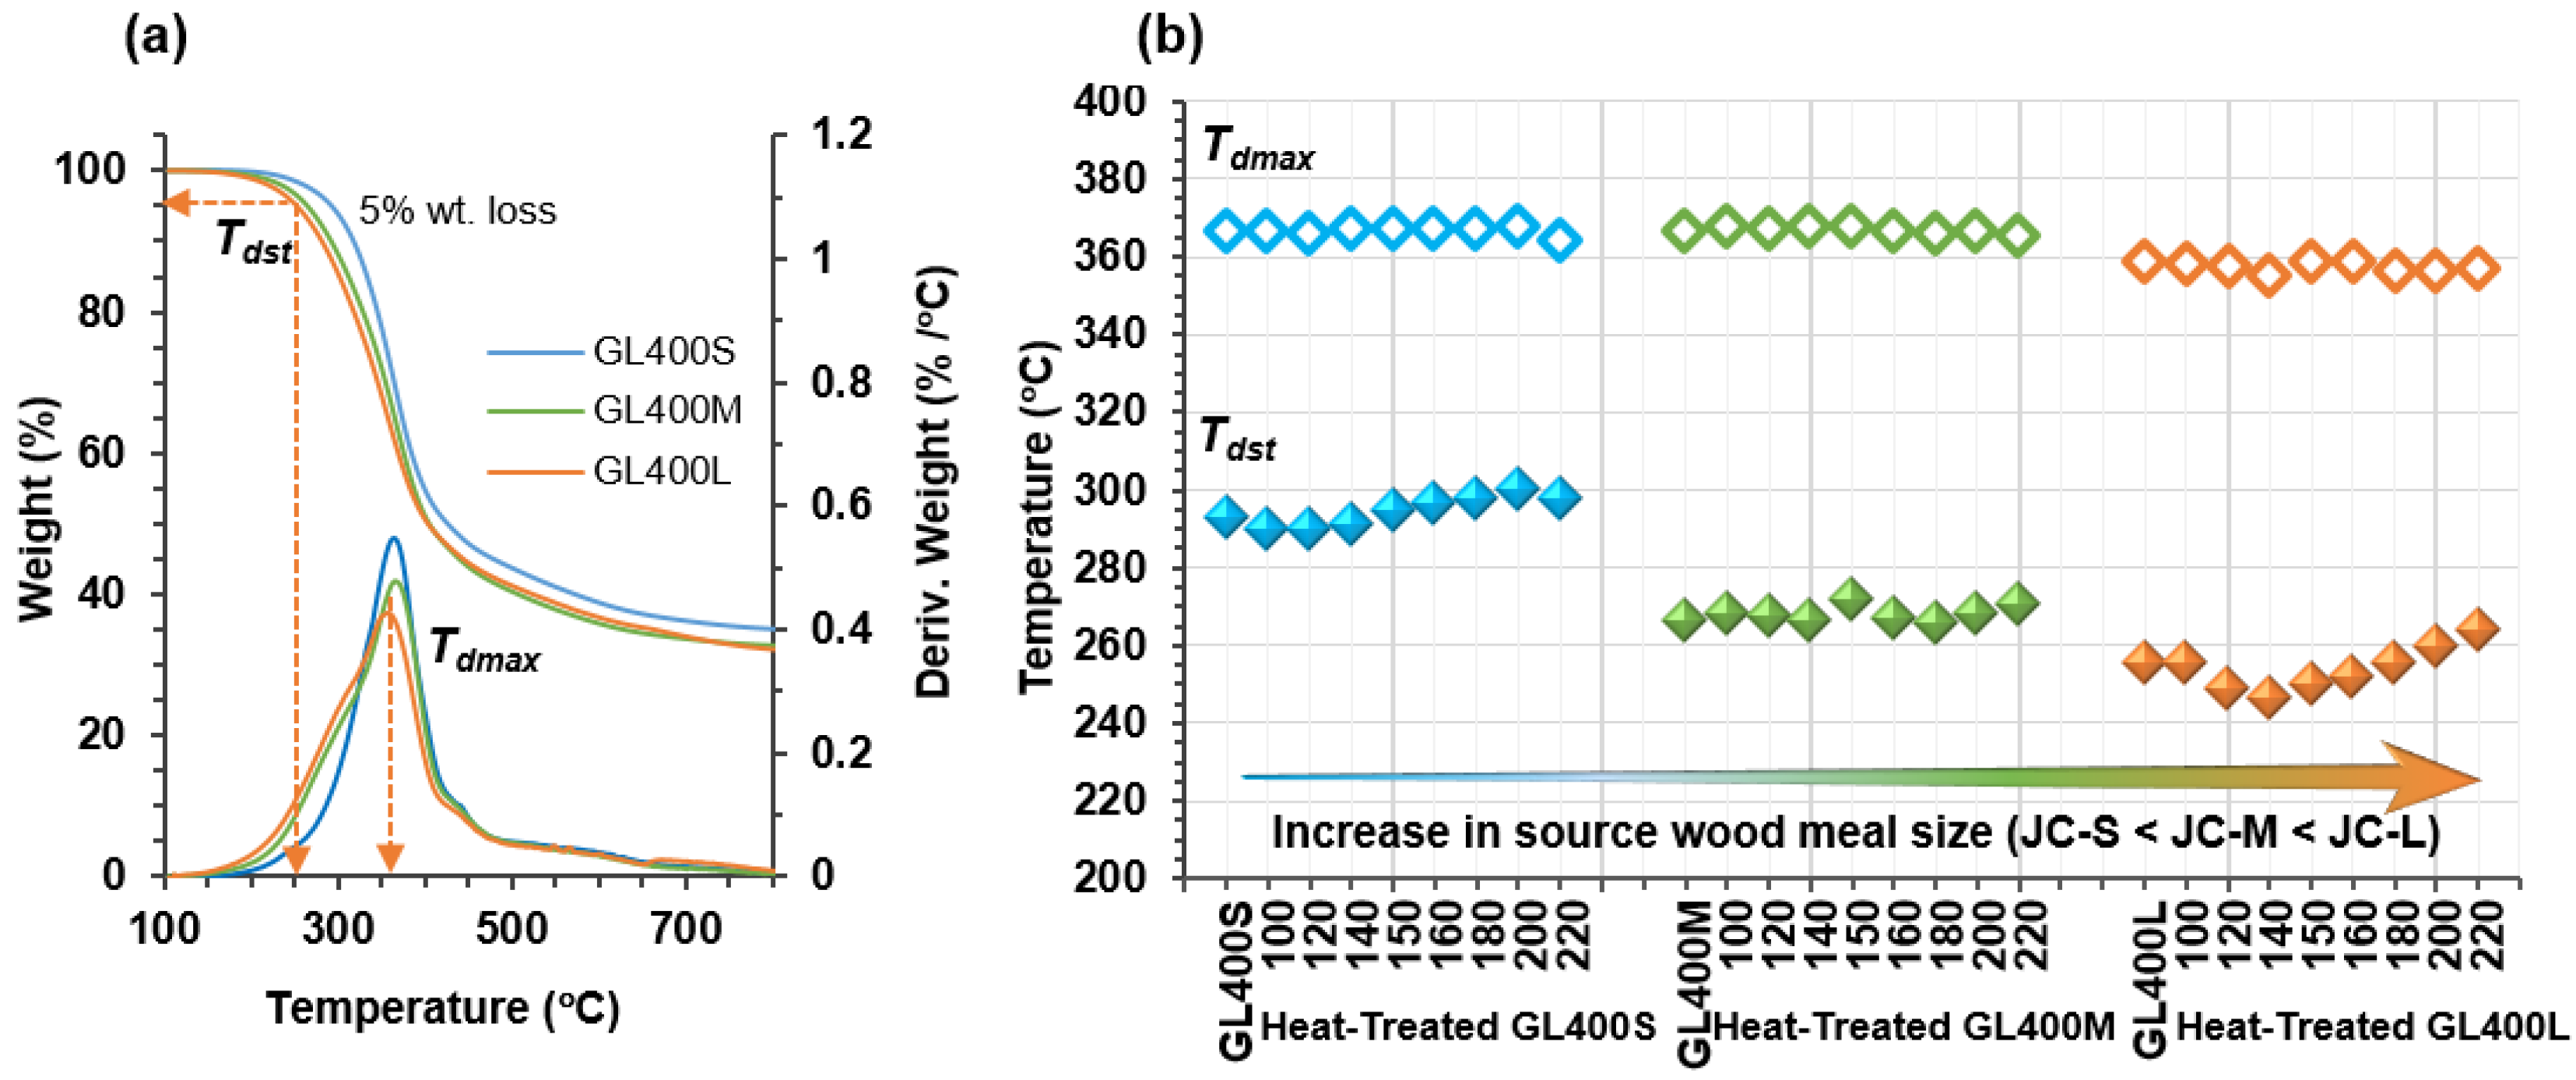
In addition to Tg and Tf, the thermal stability (Tdst and Tdmax) of GLs is important for industrial utilization with consistent processability [33]. Generally, all of the heat-treated GL400 samples and corresponding control GL400 samples showed a broad DTGA curve with a maximum at 367 °C and shoulders near 300 and 430 °C; here, the shoulder near 300 °C is not well resolved in the GL400S series (Figure 5a), suggesting that GL400S series has a more condensed structure than Gl400M and GL400L series. Tdst (corresponding to 5 wt% weight loss) decreased slightly for treatment temperatures of up to 140 °C, followed by a gradual increase with increasing temperature. In contrast, Tdmax (corresponding to the maximum weight loss) showed no obvious change within the treatment temperature range for any of the GL400 series (Figure 5b).
The slight fluctuation of Tdst around 140 °C is related to the viscous thermal flow temperature (Tf) of GL400, determined for 140–150 °C. An enhanced thermal stability was observed in all heat-treated GL400 samples after heating at temperatures above 140 °C. Both Tdst and Tdmax showed an increasing tendency with decreasing source wood meal size (GL400L series < GL400M series < GL400S series), as reported in our previous study [16]. The ranges of the TGA-derived Tdst for the GL400L, GL400M, and GL400S series were 246–264 °C, 267–272 °C, and 290–300 °C, respectively. The ranges of Tdmax were 356–359 °C, 364–367 °C, and 365–367 °C for the GL400L, GL400M, and GL400S series, respectively. In addition, the residual char at 800 °C increased slightly with increasing temperature for all GL400 samples: from 34.6 to 36.1 wt% (GL400S series), 30.5 to 33.6 wt% (GL400M series), and 31.9 to 33.3 wt% (GL400L series). This finding further indicates the enrichment of condensed structures with increasing treatment temperature.
In summary, three types of PEG400-substituted softwood-derived lignin derivatives, i.e., GL400S, GL400M, and GL400L, with unique physicochemical and thermal behaviors were subjected to heat treatment in a constant-temperature oven at temperatures of 100–220 °C for 1 h under atmospheric conditions. Klason lignin analysis indicated no obvious degradation in any of the GL400 series at temperatures of up to 220 °C. Instead, enhanced thermal stability was achieved after heating at temperatures above 140 °C for all GL400 samples, as supported by our Tdst results. This enhanced thermal stability is attributed to structural rearrangements occurring during heat treatment, particularly after heating at temperatures above 160 °C, as suggested by the thioacidolysis-derived βO–4-linked monomer yields and HSQC NMR spectral data. It is likely that the cleavage of βO–4-linked units (depolymerization) occurred simultaneously with a condensation reaction and that the repolymerization of lignin in a cross-linked condensed structure resulted in a considerable higher-molecular-mass fraction. Hence, a low solubility was observed for the heat-treated GL400 samples in multiple characterizing solvents used for UV lignin analysis, SEC analysis, and NMR analysis; however, the degree of solubility varied depending on the GL400 type and treatment temperature. ATR-FTIR spectral analysis of the UV-solvent insoluble Gl400L and GL400M fractions also provided evidence of chemical structural rearrangements during heating at higher temperatures. Overall, the heat-treated GL400 samples consist of PEG-rich soluble fractions with a relatively low average molecular mass and considerable high-molecular-mass fractions with a modified lignin structure (cross-linked condensed structure), which does not dissolve in characterizing solvents. However, the overall PEG content is not affected by moderate heat treatment. These results provide indispensable information for the advancement of GL production test plants to pilot-scale plants and for the upgrading of GLs with a wide variety of physicochemical and thermal properties to meet various industrial requirements for a potential feedstock.

3. Materials and Methods

3.1. GL Preparation and Heat Treatment

GL samples were obtained from the GL production test plant at FFPRI, Tsukuba, Japan [16]. Briefly, air-dried JC wood meal (46 kg (dry basis) per batch) with various particle size distributions (average wood meal size, JC-S (0.4 mm), JC-M (0.8 mm), JC-L (1.6 mm)), obtained as the byproducts of local sawmill industries, were used as received. The moisture content of JC wood meal is in the range of 9%–13%. PEG400 and 0.3 wt% sulfuric acid based on PEG were used as the solvolysis reagent and catalyst, respectively. Acid-catalyzed PEG solvolysis of JC (JC/PEG:1/5, wt/wt) was conducted in a large-scale batch reactor at 140 °C for 90 min under atmospheric pressure. The PEG400-modified GL (GL400) was collected as solid fractions after the acidification of lignin-solubilized solvolysis liquor and successive centrifugal washing (at 14,000 rpm for 30 min). Finely ground, vacuum- dried GL400 samples, denoted as GL400S, GL400M, and GL400L produced from JC-S, JC-M, and JC-L, respectively, were subjected to heat treatment.
A series of GL400 samples (ca. 10.00 g with moisture contents of less than 0.9%) were uniformly loaded in a glass petri dish (ϕ 60 mm, PyrexTM) and subjected to thermal treatment in a constant-temperature drying oven (EO-300B, As One Corporation, Osaka, Japan) at designated temperatures ranging from 100 to 220 °C. The samples were placed in an oven that had been preheated to the designated temperature and maintained at the set temperature for 20 min. The heat treatment was then conducted for 1 h. All heat-treated samples were finely ground before centrifugal washing and were vacuum-dried for further analysis.

3.2. Chemical Analyses

UV lignin analysis was conducted with a Shimadzu UV1800 spectrophotometer (Shimadzu Corp., Kyoto, Japan). The heat-treated GL400 samples and corresponding control GL400 samples were typically dissolved in 2-propanol:0.2 M NaOH (v/v:1/1) solution followed by the addition of NaBH4. The solution samples were stored in the dark to allow the reduction reaction to proceed for 2 weeks in order to eliminate possible UV-absorbing furans. The solution was then diluted with an appropriate volume of 2-propanol:distilled water (v/v:1/1) to obtain UV absorption spectra within an intensity range of 0.3–0.7 at 280 nm. The lignin content was calculated using absorption coefficient values of 23.116, 21.563, and 20.955 gL−1cm−1 for the GL400S, GL400M, and GL400L series, respectively. Depending on the type of control GL400 sample, samples treated at >150 °C became completely insoluble in 2-propanol:0.2 M NaOH solution. The solubility of the heat-treated GL400 samples was also determined. The insoluble portion was filtered by vacuum-filtration, followed by successive washing before subjected to vacuum-drying. The percent solubility was then calculated based on an initial amount of sample used for corresponding analysis. Klason lignin analysis [16,34] was performed for samples hated at 160, 180, 200, 220 °C and for the corresponding control samples. Analytical thioacidolysis was performed to quantify βO–4-linked lignin units in the GL400 samples, as reported previously [31,35,36]. Duplicate or triplicate runs were performed for each of the above chemical analyses, and the average values were reported.

3.3. D NMR

Samples heated at 100, 160, and 220 °C and corresponding control samples (ca. 15 mg) were dissolved in DMSO-d6 (600 μL) and filtered to remove the insoluble fraction. A similar solubility issue was encountered in samples treated at 220 °C. NMR spectra were recorded on a Bruker Biospin Avance III 800US spectrometer (Bruker Biospin, Billerica, MA, USA.) fitted with a cryogenically cooled 5 mm TCI gradient probe. Adiabatic 2D 1H–13C short-range correlation (HSQC) experiments were performed using the standard Bruker implementation (“hsqcetgpsp.3”, Bruker Biospin, Billerica, MA, USA), based on the parameters reported by Mansfield et al. [37]. The Bruker TopSpin software (Bruker Biospin, Billerica, MA, USA) was used for data processing, and the central DMSO solvent peaks (δC/δH: 39.5/2.49 ppm) were used as an internal reference. HSQC plots were obtained with typical matched Gaussian apodization in F2 and squared cosine-bell apodization and one level of linear prediction (16 coefficients) in F1. For contour integration analysis, well-resolved Cα–Hα contours from I, II, III, and I′, and OMe and P2 contours were integrated [16].

3.4. ATR-FTIR Spectroscopy

ATR-FTIR spectra were recorded using a Nicolet iS50 FTIR spectrometer (Thermo Fisher Scientific, Madison, WI, USA) equipped with an ATR accessary, a single crystal diamond top plate. Finely ground, vacuum-dried samples were used for spectrum collection over the range of 4000–400 cm−1 with an accumulation of 32 scans and a resolution of 4 cm−1. The band intensity of aromatic skeletal vibrations (aromatic ring C=C–C stretching) at 1512 cm−1 was used as an internal reference to normalize all spectra after ATR correction and base-line adjustment.

3.5. SEC

SEC analysis was performed using a Shimadzu Prominence LC-20AD (Shimadzu Corporation, Kyoto, Japan) system equipped with a UV (280 nm) and refractive index (RI) detector and a three-column sequence of Shodex KD802, KD803, and KD805. HPLC-grade N, N-dimethyl formamide (DMF) with 10 mM LiBr was used as the eluent, with a flow rate of 1.0 mL min−1 at 40 °C. Fluka polyethylene glycol/poly(ethylene oxide) standard ReadyCal sets (Sigma-Aldrich Japan G. K., Tokyo, Japan) were used for molecular mass calibration. The standard and samples were completely dissolved in the eluent and filtered through a 0.45 μm PTFE syringe filter (ADVENTEC) prior to injection to the system. Some of the GL400 samples treated at ≥120 °C did not dissolve completely, thus, the soluble portion was filtered and subjected to SEC analysis.

3.6. TMA

The glass transition temperature (Tg) and the viscous thermal flow temperature (Tf) of heat-treated GL400 samples and corresponding control samples were determined under a nitrogen environment (100 mL min−1) using a Q400 TMA (TA Instruments-Waters LLC, New Castle, DE, USA). A vacuum-dried, finely ground powder sample (7–8 mg) was loaded onto a platinum sample pan (ϕ 6 × 2.5 mm) and a flat aluminum plate (ϕ 4 mm) was placed on top of the sample to avoid direct contact with the probe surface. The sample assembly was placed between a quartz stage equipped with a thermal sensor and a movable probe with a contact diameter of 2.54 mm. The temperature was increased from 20 to 240 °C at a heating rate of 5 °C min−1 under an applied load of 0.05 N. Volume changes occurring within the samples during heating were recorded based on the motion of the probe. Universal analysis software was used to analyze the data, with Tg and Tf identified as onset temperatures.

3.7. TGA

The thermal stability of the heat-treated GL400 samples and corresponding control samples was determined under a nitrogen environment (60 mL min−1 for the sample chamber and 40 mL min−1 for the balance chamber) using a Q500 TGA (TA Instruments-Waters LLC, New Castle, DE, USA.). A vacuum-dried fine powder sample (7–8 mg) was loaded onto a TGA platinum pan (100 μL). The temperature was initially increased to 105 °C at 10 °C min−1 and was held constant for 20 min, followed by heating to 850 °C at a rate of 10 °C min−1. Universal analysis software was used to analyze the decomposition starting temperature (Tdst) corresponding to 5 wt% loss and the maximum decomposition temperature (Tdmax) corresponding to the maximum weight loss. Tdst was recalculated after the weight was fixed at 105 °C.

Supplementary Materials

The following are available online, Figure S1: SEC molecular weight distribution profiles of the heat-treated GL400S (a), GL400M (b), and GL400L series (c). The samples were subjected to heat treatment at temperatures of 100–220 °C for 1 h.

Author Contributions

Conceptualization, T.T.N. and T.Y.; methodology, T.T.N.; formal analysis, T.T.N., Y.T., M.Y., S.T. and E.T.; investigation, T.T.N.; writing—original draft preparation, T.T.N.; writing—review and editing, T.T.N., Y.T., T.U. and T.Y.; project administration, T.Y. All authors have read and agreed to the published version of the manuscript.

Funding

This research was funded by SIP-Lignin Project, Technologies for Creating Next-Generation Agriculture Forestry and Fisheries under the Cross-Ministerial Strategic Innovation Promotion Program (SIP) administered by Council for Science Technology and Innovation (CSTI), Japan.

Acknowledgments

We thank Kanae Miyashita, Eri Matsui and Sachie Itahashi (FFPRI) for their assistance in UV and Klason lignin analyses, Keiko Tsuchida, Naoko Tsue, and Megumi Ozaki for their assistance in thioacidolysis, and Hironori Kaji and Ayaka Maeno for their assistance in NMR analysis. A part of this study was conducted using the facilities in DASH/FBAS at Research Institute for Sustainable Humanosphere, Kyoto University, and the NMR spectrometer in JURC at the Institute for Chemical research, Kyoto University.

Conflicts of Interest

The authors declare no conflict of interest.

References

  1. Henriksson, G. Lignin. In Pulp and Paper Chemistry and Technology, Wood Chemistry and Wood Biotechnology; Ek, M., Gellerstedt, G., Henriksson, G., Eds.; de Grutyter: Berlin, Germany, 2009; Volume 1, pp. 121–146. [Google Scholar]
  2. Brännvall, E. Overview of Pulp and Paper Processes. In Pulp and Paper Chemistry and Technology, Pulping Chemistry and Technology; Ek, M., Gellerstedt, G., Henrikkson, G., Eds.; de Grutyter: Berlin, Germany, 2009; Volume 2, pp. 1–12. [Google Scholar]
  3. Chiang, V.L.; Puumala, R.J.; Takeuchi, H.; Eckert, R.E. Comparison of softwood and hardwood kraft pulping. Tappi. J. 1988, 71, 173–176. [Google Scholar]
  4. Lia, Y.Z.; Sarkanen, K.V. Isolation and Structural Studies. In Lignins, Occurrence, Formation, Structure and Reactions; Sarkanen, K.V., Ludwig, C.H., Eds.; Wiley Interscience: New York, NY, USA, 1971; pp. 165–240. [Google Scholar]
  5. Brunow, G.; Lundquist, K. Functional Groups and Bonding Patterns in Lignin (Including the Lignin-Carbohydrate Complexes). In Lignin and Lignans: Advances in Chemistry; Heitner, C., Dimmel, D., Schmidt, J., Eds.; CRC Press: Boca Rotan, FL, USA, 2010; pp. 267–299. [Google Scholar]
  6. Norgren, M.; Edlund, H. Lignin: Recent advances and emerging applications. Curr. Opin. in Colloid In. 2014, 19, 409–416. [Google Scholar] [CrossRef]
  7. Li, J.; Henriksson, G.; Gellerstedt, G. Lignin depolymerization/repolymerization and its critical role for delignification of aspen wood by steam explosion. Bioresour. Technol. 2007, 98, 3061–3068. [Google Scholar] [CrossRef]
  8. Vanholme, R.; Demedts, B.; Morreel, K.; Ralph, J.; Boerjan, W. Lignin biosynthesis and structure. Plant Physiol. 2010, 153, 895–905. [Google Scholar] [CrossRef] [Green Version]
  9. Öhman, F.; Theliander, H.; Tomani, P.; Axegard, P. Method for Separating Lignin from Black Liquor. U.S. Patent 8486224B2, 16 July 2013. [Google Scholar]
  10. Kouisni, L.; Paleologou, M. Method for Separating Lignin from Black Liquor. U.S. Patent 8771464B2, 8 July 2014. [Google Scholar]
  11. Lange, H.; Schiffels, P.; Sette, M.; Sevastyanova, O.; Crestini, C. Fractional precipitation of wheat straw organosolv lignin: Macroscopic properties and structural insights. ACS Sustainable Chem. Eng. 2016, 4, 5136–5151. [Google Scholar] [CrossRef]
  12. Nitsos, C.; Stoklosa, R.; Karnaouri, A.; Vörös, D.; Lange, H.; Hodge, D.; Crestini, C.; Rova, U.; Christakopoulos, P. Isolation and characterization of organosolv and alkaline lignins from hardwood and softwood biomass. ACS Sustainable Chem. Eng. 2016, 4, 5181–5193. [Google Scholar] [CrossRef]
  13. Jiang, X.; Savithri, D.; Du, X.; Pawar, S.; Jameel, H.; Chang, H.-M.; Zhou, X. Fractionation and characterization of kraft lignin by sequential precipitation with various organic solvent. ACS Sustainable Chem. Eng. 2017, 5, 835–842. [Google Scholar] [CrossRef]
  14. Yawalata, D.; Paszner, L. Anionic effect in high concentration alcohol organosolv pulping. Holzforschung 2004, 58, 1–6. [Google Scholar] [CrossRef]
  15. Dence, C.W.; Lin, S.Y. Introduction. In Methods in Lignin Chemistry: Springer Series in Wood Science; Dence, C.W., Lin, S.Y., Eds.; Springer: Berlin, Germany, 1992; pp. 1–19. [Google Scholar]
  16. Nge, T.T.; Tobimatsu, Y.; Takahashi, S.; Takata, E.; Yamamura, M.; Miyagawa, Y.; Ikeda, T.; Umezawa, T.; Yamada, T. Isolation and characterization of polyethylene glycol (PEG)-modified glycol lignin via PEG solvolysis of softwood biomass in a large-scale batch reactor. ACS Sustainable Chem. Eng. 2018, 6, 7841–7848. [Google Scholar] [CrossRef]
  17. Nge, T.T.; Takata, E.; Takahashi, S.; Yamada, T. Isolation and thermal characterization of softwood-derived lignin with thermal flow properties. ACS Sustainable Chem. Eng. 2016, 4, 2861–2868. [Google Scholar] [CrossRef]
  18. Kaneko, H.; Ishii, R.; Suzuki, A.; Nakamura, T.; Ebina, T.; Nge, T.T.; Yamada, T. Flexible clay glycol lignin nanocomposite film with heat durability and high moisture-barrier property. Appl. Clay Sci. 2016, 132–133, 425–429. [Google Scholar] [CrossRef]
  19. Takahashi, K.; Ishii, R.; Nakamura, T.; Suzuki, A.; Ebina, T.; Yoshida, M.; Kubota, M.; Nge, T.T.; Yamada, T. Flexible electronic substrate film fabricated using natural clay and wood components with cross-linking polymer. Adv. Mater. 2017, 29, 1606512. [Google Scholar] [CrossRef]
  20. Kobayashi, A.; Kobayashi, F.; Ebina, T.; Ishii, R.; Nakamura, T.; Nge, T.T.; Yamada, T.; Shiraishi, A.; Yamashita, T. Effect of thermal base generators on the FRP fabrication with glycol-lignin. J. Photopolym. Sci. Tec. 2018, 31, 101–106. [Google Scholar] [CrossRef]
  21. Ono, K.; Tanaike, O.; Ishii, R.; Nakamura, T.; Shikinaka, K.; Ebina, T.; Nge, T.T.; Yamada, T. Solvent-free fabrication of an elastomeric epoxy resin using glycol lignin from Japanese cedar. ACS Omega 2019, 4, 17251–17256. [Google Scholar] [CrossRef]
  22. Suzuki, A.; Shikinaka, K.; Ishii, R.; Yoshida, H.; Ebina, T.; Ishida, T.; Nge, T.T.; Yamada, T. Heat-resistant insulation film containing clay and wood components. Appl. Clay Sci. 2019, 180, 105189. [Google Scholar] [CrossRef]
  23. Kim, J.-Y.; Hwang, H.; Oh, S.; Kim, Y.-S.; Kim, U.-J.; Choi, J.W. Investigation of structural modification and thermal characteristics of lignin after heat treatment. Int. J. Biol. Macromol. 2014, 66, 57–65. [Google Scholar] [CrossRef]
  24. Rousset, P.; Lapierre, C.; Pollet, B.; Quirino, W.; Perre, P. Effect of severe thermal treatment on spruce and beech wood lignins. Ann. For. Sci. 2009, 66, 110. [Google Scholar] [CrossRef] [Green Version]
  25. Chen, X.; Li, H.; Sun, S.; Cao, X.; Sun, R. Effect of hydrothermal pretreatment on the structural changes of alkali ethanol lignin from wheat straw. Sci. Rep. 2016, 6, 39354. [Google Scholar] [CrossRef]
  26. Zhang, Y.; Wu, J.-Q.; Li, H.; Yuan, T.-Q.; Wang, Y.-Y.; Sun, R.-C. Heat treatment of industrial alkaline lignin and its potential application as an adhesive for green wood-lignin composites. ACS Sustainable Chem. Eng. 2017, 5, 7269–7277. [Google Scholar] [CrossRef]
  27. Matsuura, H.; Miyazawa, T. Interchain force field and normal vibrations of polyethylene glycol. Bull. Chem. Soc. Jpn. 1968, 41, 1798–1808. [Google Scholar] [CrossRef] [Green Version]
  28. Feng, Y.; Lan, J.; Ma, P.; Dong, X.; Qu, J.; He, H. Chemical structure and thermal properties of lignin modified with polyethylene glycol during steam explosion. Wood Sci Technol. 2017, 51, 135–150. [Google Scholar] [CrossRef]
  29. Faix, O. Fourier Transform Infrared Spectroscopy. In Methods in Lignin Chemistry: Springer Series in Wood Science; Dence, C.W., Lin, S.Y., Eds.; Springer: Berlin, Germany, 1992; pp. 83–110. [Google Scholar]
  30. Sun, Q.; Khunsupat, R.; Akato, K.; Tao, J.; Labbé, N.; Gallego, N.C.; Bozell, J.J.; Rials, T.G.; Tuskan, G.A.; Tschaplinski, T.J.; et al. A study of poplar organosolv lignin after melt rheology treatment as carbon fiber precursors. Green Chem. 2016, 18, 5015–5024. [Google Scholar] [CrossRef]
  31. Yamamura, M.; Hattori, T.; Suzuki, S.; Shibata, D.; Umezawa, T. Microscale thioacidolysis method for the rapid analysis of βO–4 substructures in lignin. Plant Biotechnol. 2012, 29, 419–423. [Google Scholar] [CrossRef] [Green Version]
  32. Lapierre, C.; Monties, B.; Rolando, C. Preparative thioacidolysis of spruce lignin: Isolation and identification of main monomeric products. Holzforschung 1986, 40, 47–50. [Google Scholar] [CrossRef]
  33. Sen, S.; Patil, S.; Argyropoulos, D.S. Thermal properties of lignin in copolymers, blends, and composites: A Review. Green Chem. 2015, 17, 4862–4887. [Google Scholar] [CrossRef]
  34. Sluiter, A.; Hames, B.; Ruiz, R.; Scarlata, C.; Sluiter, J.; Templeton, D.; Crocker, D. Determination of Structural Carbohydrates and Lignin in Biomass; National Renewable Energy Laboratory: Golden, CO, USA, 2008.
  35. Yue, F.; Lu, F.; Sun, R.-C.; Ralph, J. Syntheses of lignin-derived thioacidolysis monomers and their uses as quantitation standards. J. Agric. Food. Chem. 2012, 60, 922–928. [Google Scholar] [CrossRef]
  36. Lam, P.Y.; Tobimatsu, Y.; Takeda, Y.; Suzuki, S.; Yamamura, M.; Umezawa, T.; Lo, C. Disruption flavone synthase II alters lignin and improves biomass digestibility. Plant Physiol. 2017, 174, 972–985. [Google Scholar] [CrossRef] [Green Version]
  37. Mansfield, S.D.; Kim, H.; Lu, F.; Ralph, J. Whole plant cell wall characterization using solution-state 2D NMR. Nat. Protoc. 2012, 7, 1579–1589. [Google Scholar] [CrossRef]
Sample Availability: Samples of the compounds are available from the authors.
Scheme 1. Schematic illustration of heat treatment for three types of PEG400-modified glycol lignin (GL400). GL400S, GL400M, and GL400L were obtained from the SIP-Lignin Bench Plant through acid-catalyzed PEG400 solvolysis of wood meal (JC): JC-S, JC-M, and JC-L, respectively.
Molecules 25 01167 sch001
Figure 1. Lignin content (UV and Klason) of GL400S, GL400M, and GL400L after heat treatment at temperatures of 100 to 220 °C for 1 h and their solubility in the 2-propanol:0.2M NaOH (v/v:1/1) solvent used for UV lignin analysis (a) and in the 10 mM LiBr/DMF solvent used for SEC analysis (b).
Molecules 25 01167 g001
Figure 2. ATR-FTIR spectra of PEG400 (a), milled wood lignin (MWL) extracted from JC wood meal (JC-L) (b), GL400L prepared from acid-catalyzed PEG400 solvolysis of wood meal (JC-L) (c), GL400L after heat treatment at 220 °C for 1 h, (GL400L-220) (d), and the fraction of heat-treated GL400L-220 that is insoluble in the solvent (2-propanol:0.2M NaOH, v/v:1/1) used for UV lignin analysis (e).
Molecules 25 01167 g002
Figure 3. Two-dimensional (2D) HSQC NMR spectra of GL400M before heat treatment (a) and after heat treatment at 100 °C (b), 160 °C (c), and 220 °C (d) for 1 h. GL400M was obtained via acid-catalyzed PEG400 solvolysis of JC wood meal (JC-M).
Molecules 25 01167 g003
Figure 4. TMA profiles of the heat-treated GL400S (a), GL400M (b), GL400L series (c) and the respective thermal transition temperature, glass transition temperature (Tg), and viscous thermal flow temperature (Tf) for the GL400S (d), GL400M (e), and GL400L series (f). The samples were subjected to heat treatment at temperatures of 100–220 °C for 1 h.
Molecules 25 01167 g004
Figure 5. TGA/DTGA plots of control GL400S, GL400M, and GL400L (a) and thermal transition temperatures (Tdst and Tdmax) for the heat-treated GL400S, GL400M, and GL400L series, as determined by TGA (b). The samples were subjected to heat treatment at temperatures of 100–220 °C for 1 h. Tdst: decomposition starting temperature corresponding to 5 wt% loss, Tdmax: temperature corresponding to the maximum weight loss.
Molecules 25 01167 g005
Table 1. Chemical structure and molecular mass data for heat-treated GL400 Samples.
Thioacidolysis Monomer Yield (μmol/g) bRelative NMR Signal intensity and Ratio cMolecular Mass d
GL Samples aKlason Lignin (wt%)per GLper Klason LigninI’ [β–O–4] (%)II[β–5] (%)III[ββ] (%)P2/OMeRatioMwMn
GL400S79.814.718.43220490.3053102050
GL400S-100-15.6-3522430.3054502060
GL400S-120-15.2-----61502130
GL400S-140-15.9-----69102150
GL400S-150-15.8-----76502220
GL400S-16080.713.817.02324520.2992202280
GL400S-18080.816.220.0----17,900 *2530 *
GL400S-20081.313.716.9----48,840 *2380 *
GL400S-22080.214.518.110 *23 *67 *0.32 *7060 *1720 *
GL400M78.081.8104.95031190.3081502360
GL400M-100-82.0-5231160.2986602400
GL400M-120-81.7-----10,8302500
GL400M-140-85.6-----22,6402710
GL400M-150-81.3-----21,770 *2490
GL400M-16079.481.8103.14832200.2710,090 *2000 *
GL400M-18079.179.9101.0----4260 *1470 *
GL400M-20078.971.991.2----2840 *1210 *
GL400M-22079.951.864.97 *47 *46 *0.62 *2110 *1040 *
GL400L75.1168.7224.75236120.3513,6302590
GL400L-100-167.2-5335110.3317,1702680
GL400L-120-161.8-----16,180 *2380 *
GL400L-140-159.4-----7090 *1910 *
GL400L-150-148.6-----5730 *1760 *
GL400L-16076.6156.1203.74840120.294930 *1630 *
GL400L-18077.3138.0178.5----2920 *1240 *
GL400L-20077.8109.4140.5----2260 *1080 *
GL400L-22079.391.9115.820 *60 *20 *0.89 *1840 *970 *
a GL400 samples prepared by PEG400 solvolysis of JC wood meal with various particle size distribution (JC-S < JC-M < JC-L) were subjected to heat treatment at temperatures of 100 to 220 °C for 1 h. b Yield of guaiacyl-type trithioethylphenylpropanes. c Based on relative contour integration ratio in HSQC NMR (Figure 3). d Determined by SEC using polyethylene glycol/poly(ethylene oxide) standards. * Identified only soluble heat-treated GL400 fractions for the respective analysis. -, not determined.
Table 2. ATR-FTIR spectral data for GL400L, heat-treated GL400L-200 and GL400L-220.
GL400LGl400L-200GL400L-220
a Soluble and Insolubleb Insoluble Fractiona Soluble and Insolubleb Insoluble Fraction
λ−1/cm−1c RAλ−1/cm−1c RAλ−1/cm−1c RAλ−1/cm−1c RAλ−1/cm−1c RA
d 9470.2659490.2709490.2239490.2719510.245
e 13500.48313500.48413540.62813500.48713560.645
f 14230.52114250.53414210.67314270.54214210.735
g 14620.73014620.74614600.89014620.75614600.952
h 15970.44815970.46515930.70215970.47015930.709
a heat-treated GL400 sample, b determined insoluble GL400L fractions for treatment temperatures of 200 and 220 °C, which did not dissolve in the solvent (2-propanol:0.2M NaOH, v/v:1/1) used for UV lignin analysis, c relative absorbance (A/A1512), d CH2 rocking vibration (PEG), e CH2 wagging vibration (PEG), f aromatic skeletal vibration with C–H deformation, g C–H bending of CH3 and CH2 groups, h aromatic skeletal vibration and C=O stretching.
Table 3. ATR-FTIR spectral data for GL400M, heat-treated GL400M-200 and GL400M-220.
GL400MGl400M-200GL400M-220
a Soluble and Insolubleb Insoluble Fractiona Soluble and Insolubleb Insoluble Fraction
λ−1/cm−1c RAλ−1/cm−1c RAλ−1/cm−1c RAλ−1/cm−1c RAλ−1/cm−1c RA
d 9490.2239490.2589490.2449490.2809490.240
e 13500.47213500.48413540.59713500.49413540.636
f 14270.50814270.54014230.64514270.55914210.684
g 14620.72514620.75614600.87414620.76914600.919
h 15970.43115970.46015930.67915970.46815930.709
a heat-treated GL400 sample, b determined insoluble GL400M fractions for treatment temperatures of 200 and 220 °C, which did not dissolve in the solvent (2-propanol:0.2M NaOH, v/v:1/1) used for UV lignin analysis, c relative absorbance (A/A1512), d CH2 rocking vibration (PEG), e CH2 wagging vibration (PEG), f aromatic skeletal vibration with C–H deformation, g C–H bending of CH3 and CH2 groups, h aromatic skeletal vibration and C=O stretching.