Article

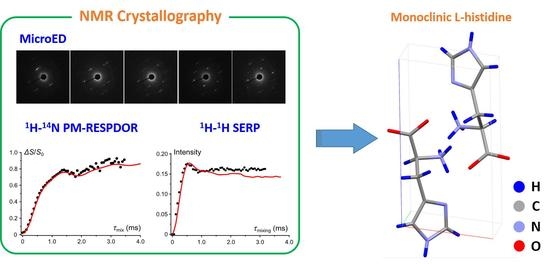
Structure Solution of Nano-Crystalline Small Molecules Using MicroED and Solid-State NMR Dipolar-Based Experiments

1
RIKEN-JEOL Collaboration Center, RIKEN, Yokohama, Kanagawa 230-0045, Japan
2
JEOL Ltd., Akishima, Tokyo 196-8558, Japan
3
System in Frontier Inc., Tachikawa, Tokyo 190-0012, Japan
4
RIKEN Center for Biosystems Dynamics Research, RIKEN, Yokohama, Kanagawa 230-0045, Japan
5
JEOL RESONANCE Inc., Akishima, Tokyo 196-8558, Japan
*
Author to whom correspondence should be addressed.
Molecules 2021, 26(15), 4652; https://doi.org/10.3390/molecules26154652
Submission received: 1 July 2021 / Revised: 24 July 2021 / Accepted: 27 July 2021 / Published: 31 July 2021
(This article belongs to the Special Issue Intermolecular Interactions in Crystal Lattice)

Abstract

:
Three-dimensional electron diffraction crystallography (microED) can solve structures of sub-micrometer crystals, which are too small for single crystal X-ray crystallography. However, R factors for the microED-based structures are generally high because of dynamic scattering. That means R factor may not be reliable provided that kinetic analysis is used. Consequently, there remains ambiguity to locate hydrogens and to assign nuclei with close atomic numbers, like carbon, nitrogen, and oxygen. Herein, we employed microED and ssNMR dipolar-based experiments together with spin dynamics numerical simulations. The NMR dipolar-based experiments were 1H-14N phase-modulated rotational-echo saturation-pulse double-resonance (PM-S-RESPDOR) and 1H-1H selective recoupling of proton (SERP) experiments. The former examined the dephasing effect of a specific 1H resonance under multiple 1H-14N dipolar couplings. The latter examined the selective polarization transfer between a 1H-1H pair. The structure was solved by microED and then validated by evaluating the agreement between experimental and calculated dipolar-based NMR results. As the measurements were performed on 1H and 14N, the method can be employed for natural abundance samples. Furthermore, the whole validation procedure was conducted at 293 K unlike widely used chemical shift calculation at 0 K using the GIPAW method. This combined method was demonstrated on monoclinic l-histidine.

Graphical Abstract

1. Introduction

X-ray diffraction (XRD) crystallography is a fundanmental technique for structural determination in chemistry and biology because it provides three-dimensional structure at the atomic level. However, this technique requires that the target molecule must yield sufficiently large crystals. Such a requirement precludes the applications of XRD crystallography to micro- or nanocrystals. Powder XRD (PXRD) is a potential solution; however, it suffers from the ambiguities in (i) localizing hydrogen atoms and (ii) distinguishing the atoms with similar atomic numbers such as carbon, nitrogen, and oxygen not to mention the requirement of a large sample amount of isomorphic powder crystals (about 1 mg). Recently, microED, three-dimensional electron diffraction crystallography, has gained attraction since it is able to solve the crystalline structure from submicron-sized single crystals including small molecules to proteins [1,2,3,4,5,6,7,8,9,10,11,12,13]. This advantage is owing to stronger interactions of the electron beam to matter than the X-ray beam, thus allowing the studies of crystals smaller than 1 μm. In crystallography, R factor, which gives agreement between experimental diffraction data and modeled structure, is typically used to validate the structures. However, structures solved by microED with the kinetic analysis give a relatively high (between 15–30% for small molecules) R factors, that are well above the satisfactory level in XRD (<7%). Such a high value is largely due to dynamic scattering which redistributes the strong diffraction intensities to weak spots. As a result, small R factor may not necessarily represent better structure or R factor may not be a reliable measure of validation as long as kinetic analysis is used. Indeed, microED struggles to (i) precisely locate hydrogen (H) atom due to its low scattering and (ii) unambiguously assign carbon (C), nitrogen (N), and oxygen (O) atoms due to their similar atomic numbers, while (P)XRD partially shares the same issues. The inclusion of dynamic refinement in the data analysis significantly reduces the R factor and can address the above issues, even determining the absolute configuration [7,14,15,16]. However, size, thickness and orientation of the crystals have to be involved in strict treatments. Nevertheless, these two limitations make the complete structure determination solely by microED difficult, thus necessiating the use of additional techniques.
We have recently demonstrated that solid-state nuclear magnetic resonance (ssNMR) can provide complementry information to microED-based structures, allowing efficient validation of structures [4]. Namely, the limitations posed by microED can be readily solved by ssNMR since (i) 1H is the most sensitive NMR attive nucleus due to its high gyromagnetic ratio and natural abundance; whereas (ii) 13C, 14/15N, and 17O NMR are completely different nuclei due to their intrinsic characteristics—gyromagnetic ratios, spin numbers, and natural abundances. Indeed, ssNMR has intensively been used to solve similar issues for XRD-based structures, namely poor locations of hydrogen atoms and ambiguous assignments of isoelectronic moeities like F, OH, and CH3, etc. It has been demonstrated that ssNMR, diffraction techniques (mostly XRD), and quantum chemical calculation can be combined for structure determination, an approach referred to as NMR crystallography [17,18,19,20,21,22,23,24]. A common practice of NMR crystallography utilizes the NMR chemical shifts as a measure of validation instead of R factor. Although chemical shifts are sensitive to the local environments surrounding a nucleus, these values cannot be directly converted to the crystallographic structure. Thus, to link the chemical shift and the structure, a quantum chemical calculation, such as GIPAW (gauge including projector argumented wave) method [25,26,27], is desired since it can optimize the structure and estimate the shieldings, thus chemical shifts from the structure. The strategy is that once candidate structures have been modeled by a diffraction method, computation, and their combination, these caculated chemical shifts are then compared to experimental NMR values to validate the correct structure. While most of the application of NMR crystallography use XRD-based structure, we have successfully applied the NMR crystallography approach using ssNMR and microED to determine crystalline structure including hydrogens, enabling structural solution from nano-sized crystals of orthorhombic l-histidine and the B form of cimetidine [4].
The successful application of NMR crystallography relies on the precise estimate of chemical shift values. Although GIPAW calculations yield root mean square deviation (RMSD) of 0.3–0.6 ppm for 1H and 2–3 ppm for 13C in most cases, several examples show poor agreement [28,29,30,31]. This discrepancy results from the limited computational level and lack of molecular motions in the calculations. Indeed, GIPAW calcualtions are performed at 0 K, whereas NMR experiments are typically conducted at 293 K or ambient temperature. Such a difference could lead to wrong estimate of strength of hydrogen bonding, since proton position can be labile to temperature [32]. The temperature effect can be involved in chemical shift calculation using density functional theory (DFT)-molecular dynamics [33].
Here, we propose NMR dipolar-based as an alternative or additive method to validate the structures instead of or in addition to chemical shift and R factor. Unlike chemical shift, dipolar coupling is directly related to structure because dipolar coupling is inversely proportional to the cube of distance, thus sensitive to the arrangements of atoms within a molecule. Although the spin dynamics are complicated when multiple dipolar couplings are involved, the NMR dipolar-based data can be simulated straightforwardly for a given structure using spin dynamics numerical simulations. This reminds us the role of calculated chemical shift; hence, NMR dipolar-based data can also be used in the NMR crystallography. The structure solution is fulfilled by evaluating the degree of agreement between experimental and simulated NMR dipolar-based data. The NMR dipolar-based data can be used solely or in combination with a quantum computation to refine the microED structures, thus improving the accuracy. As all the NMR measurements are performed at the ambient temperature, the temperature-dependent effect issue can be lifted. In this work, we use the combination of microED and ssNMR dipolar-based experiments together with spin dynamics numerical simulations to determine the structure of moloclinic l-histidine (His). It is worth noting that the l-histidine sample exhibits two stable crystalline forms: monoclinic and orthorhombic. In a recent work from our lab, the orthorhombic l-histidine was used as a model for de-novo structural determination by the combination of microED, ssNMR experiments, and GIPAW calculation [4]. Herein, we choose monoclinic l-histidine as the model sample for a proof of concept. The two NMR dipolar-based experiments, namely 1H-14N rotational-echo saturation-pulse double-resonance (RESPDOR) [34,35,36,37,38,39] and 1H-1H selective recoupling of proton (SERP) [40,41,42], were used. Both experiments were performed at fast magic-angle spinning (>60 kHz) for proton-detection and a high-resolution 1H spectrum. The structure of His was firstly analyzed by microED to yield candidate structures whose correctness needs to be identified. By performing 1H-14N RESPDOR experiment, we unambiguosly assigned the C and N atoms; whereas, by performing 1H-1H SERP, we clearly verified the position of the H atom on which N atoms on the imidazole ring. The structural information gained by ssNMR dipolar-based experiments helps complete the structural determination by microED. We also perform the quantum chemical calculation to verify the final structure.

2. Experiments and Methods

2.1. Sample

l-histidine powder (Wako Pure Chemical Industries Ltd., Japan) was dissolved in ethanol/water solution (about 40 w/w%) at 343 K. Monoclinic form of l-histidine was recrystalized by slow evaporation and was separated by filtration. The recrystallized sample was dried at 313 K and identified by 1H DQ/1H SQ solid-state NMR at a MAS frequency (νR) of 70 kHz [43].

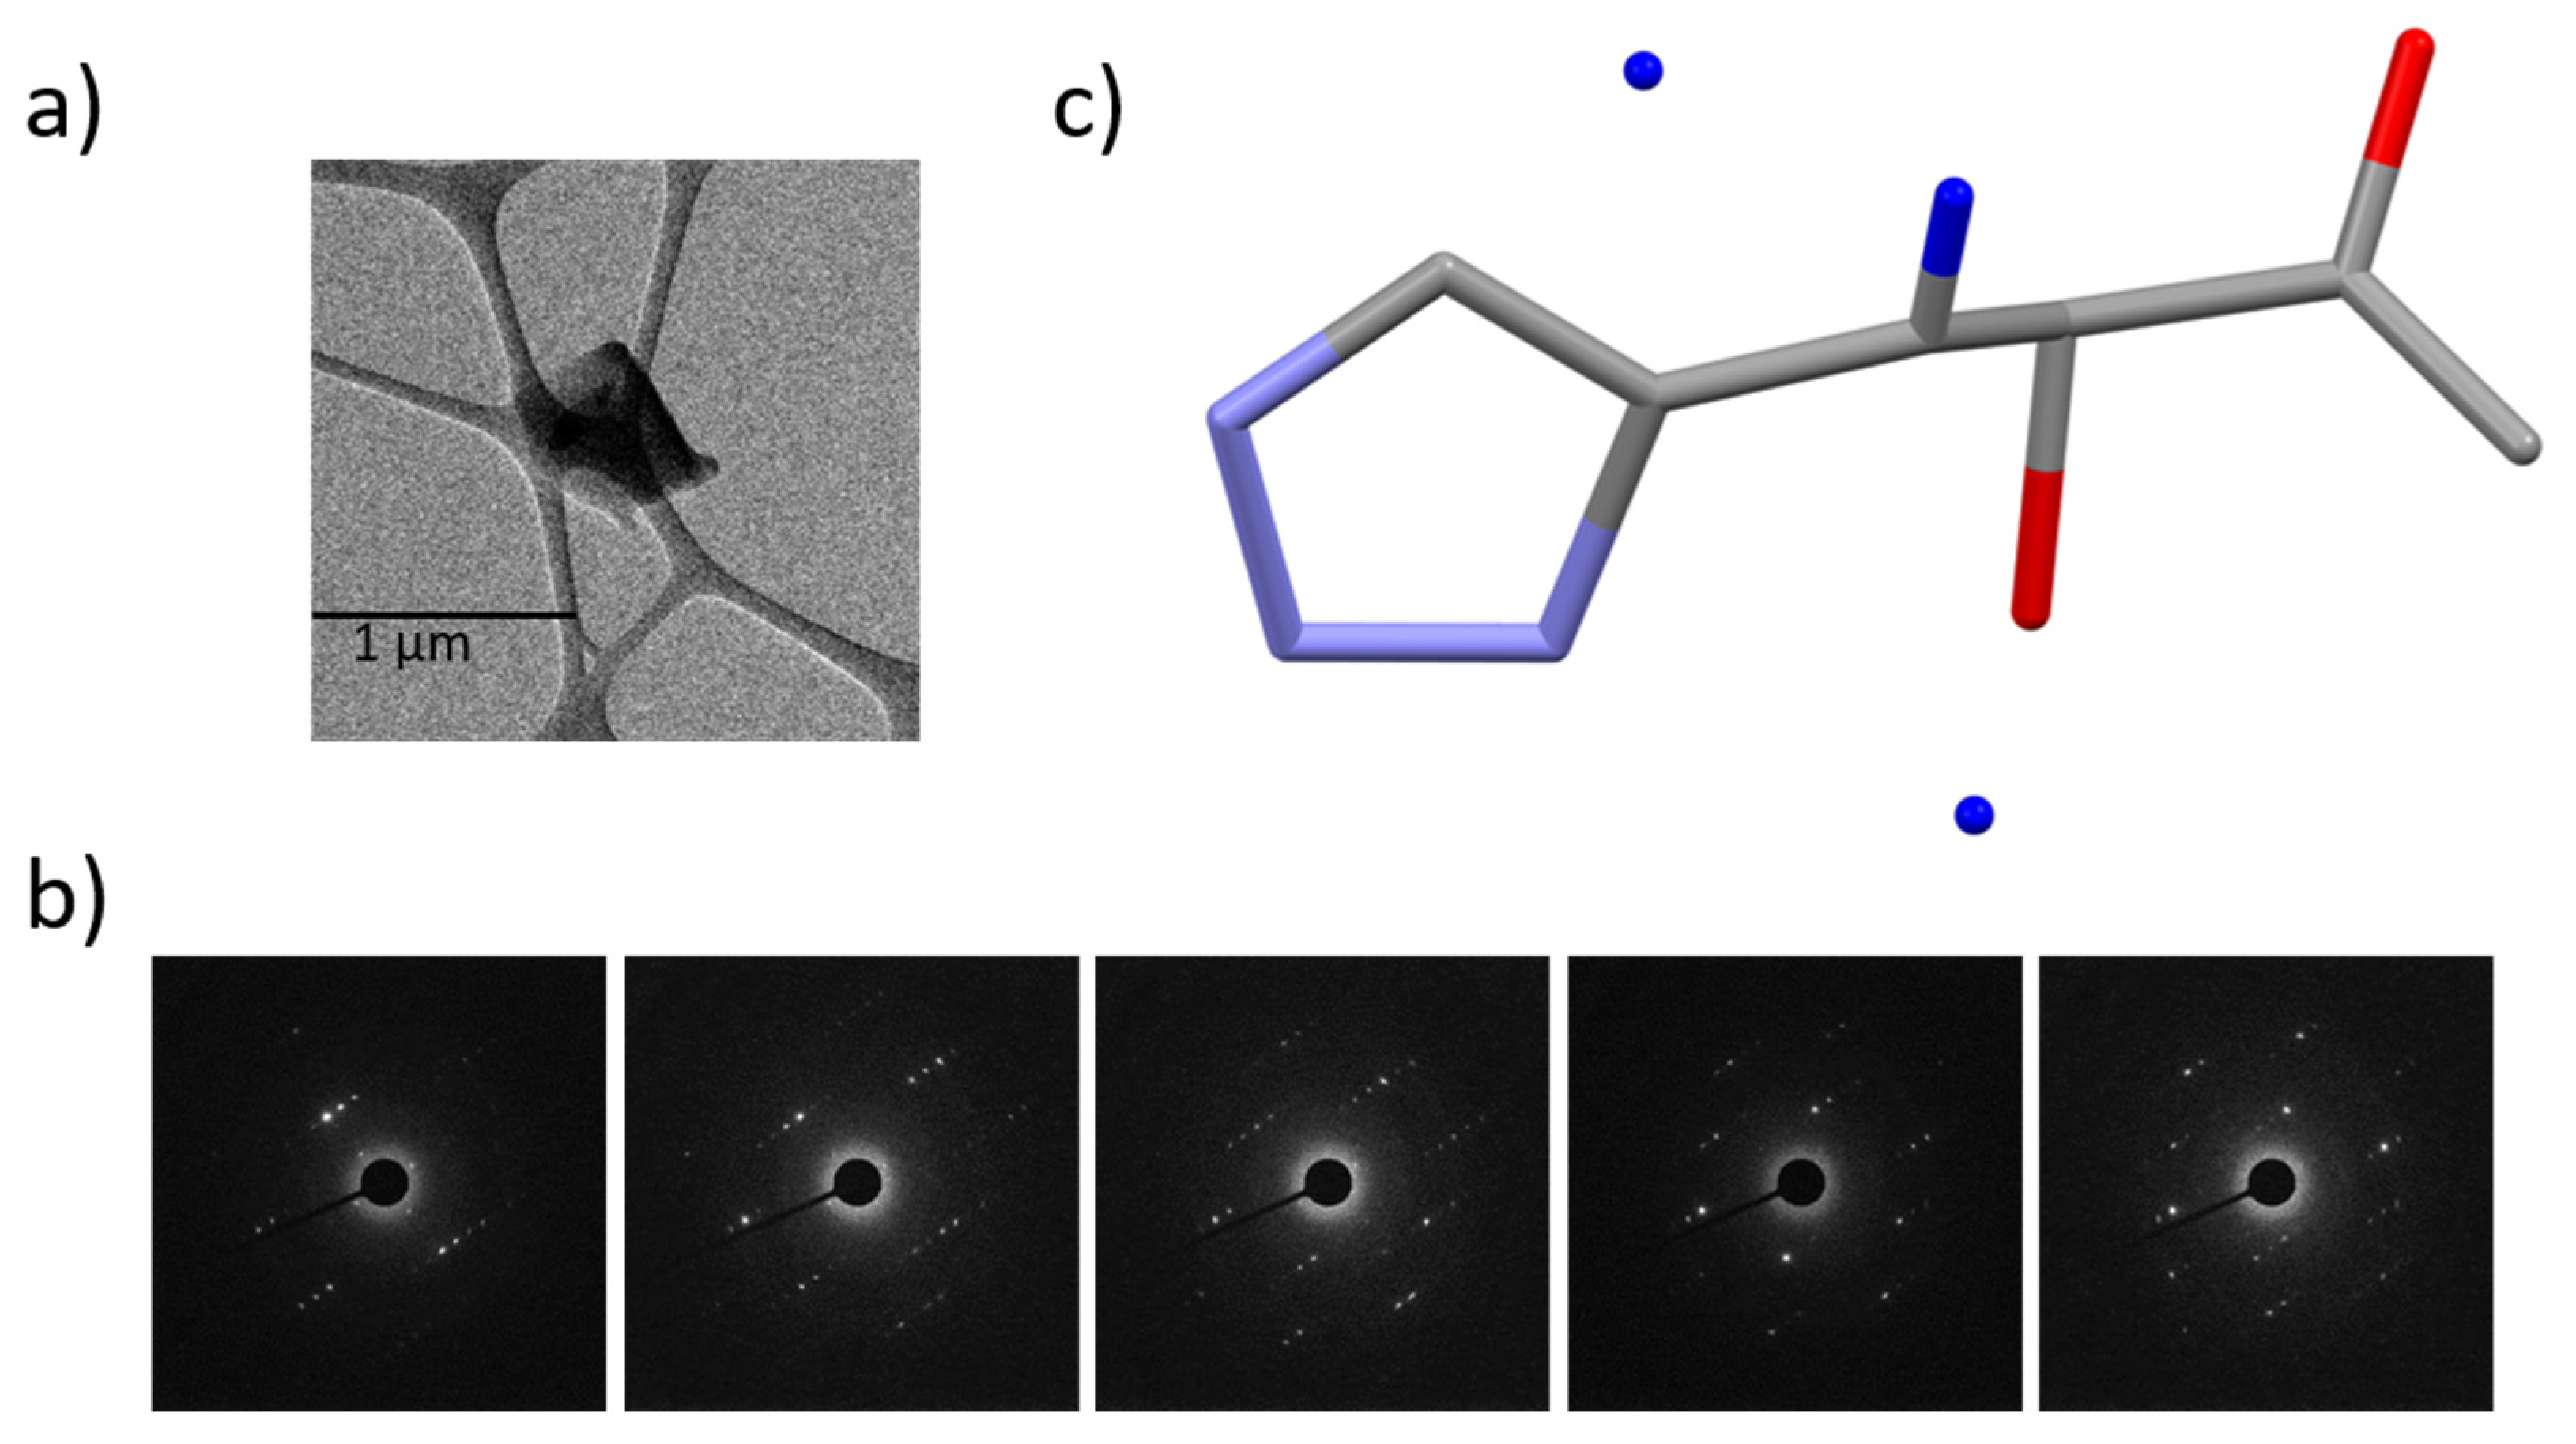
2.2. Three-Dimensional Electron Diffraction Crystallography (MicroED)

The ED patterns of the monoclinic l-histidine crystals were measured using a JEM-F200 transmission electron microscope (JEOL Ltd., Tokyo, Japan) operating at 200 kV. The sample was maintained at the ambient temperature during measurements. The diffraction data were recorded using a high-sensitivity CMOS camera (TemCam XF-416, TVIPS GmbH, Gauting, Germany) with × 4 binning (1024 × 1024 pixels). The camera length (874 mm) was calibrated using a gold polycrystal specimen. In order to minimize the dose damage, electron dose rate was set to a very low level of 0.01 elÅ−2s−1. A set of ED patterns was collected under the continuous rotation from −30° to +30° with a rate of 0.25° s−1 using RECORDER software (System In Frontier Inc., Tokyo, Japan). This condition yielded a total irradiation time of 240 s, corresponding to 2.4 elÅ−2 total dose. Exposure time was set to 4 s, giving 60 images in total. The granular particles of monoclinic l-histidine crystals were grounded by glass plate and distributed on a TEM grid supported by ultra-thin carbon film. The collected ED patterns were indexed and converted into the SHELX format using XDS [44]. Initial structure was solved by SIR2019 using direct method [45]. The solutions were refined after correcting atomic assignments and adding protons by SHELXL program with ShelXle interface [46,47].

2.3. Solid-State Nuclear Magnetic Resonance (NMR)

All NMR experiments were recorded at ambient temperature on either 600 MHz (JNM-ECZ600R, JEOL RESONANCE Inc., Tokyo, Japan) or 700 MHz (JNM-ECZ700R, JEOL RESONANCE Inc., Tokyo, Japan) spectrometers equipped with 1.0 mm 1H/X double-resonance ultrafast MAS probes. The sample was packed into a 1.0 mm zirconia rotor. The following three experiments were performed at the 700 MHz spectrometer at νR of 70 kHz and the recycling delay (RD) of 10.0 s, unless otherwise stated. The SERP experiment was performed at the 600 MHz spectrometer at νR of 68.03 kHz and the RD of 8.5 s.

2.3.1. 1H Double-Quantum (DQ)/1H Single-Quantum (SQ) Correlation

A R 18 4 7   DQ homonulcear recoupling sequence [48] as shown in Figure S1a was used to excite and reconvert the 1H DQ coherences in the 1H DQ/SQ experiments. The 1H radio-frequency (rf) field (ν1H) was set to 158 kHz for the R 18 4 7   sequence and 281 kHz for a read-pulse of 0.89 µs. The R 18 4 7   mixing time was 114.2 µs. Before the read-pulse, the 0.5 ms z-filter was employed to suppress residual transversal magnetization. The two-dimensional (2D) 1H DQ/SQ spectrum was recorded with 4 scans, 64 t1 points, and rotor-synchronized t1 increment of 57.1 µs. The experimental time was 1.4 h. The States-TPPI method was employed for the quadrature detection in the indirect dimension [49].

2.3.2. 1H-{13C} Proton-Detected CP-HSQC

The experiments were performed using the sequence in Figure S1b. The ν1H and ν13C for π/2 pulse were 281 kHz and 220 kHz, respectively. The 1H → 13C and 13C → 1H cross-polarization (CP1 and CP2, respectively) were performed using ν1H = 20 kHz and ν13C = 50 kHz with a linear ramp on the 13C channel of −14% for CP1 and +14% for CP2. The contact time of CP1 was 2.0 ms while that of CP2 was either 0.1 ms or 1.0 ms. The 100 ms HORROR scheme with ν1H = 35 kHz was used to suppress the residual 1H polarizations after CP1. The WALTZ decoupling sequences, with ν1H = ν13C = 10 kHz, were used during the 13C evolution period and the 1H acquisition, respectively. Each 2D 1H-{13C} spectrum was recorded with 24 scans, 128t1 points on the 13C indirect spectral width of 180 ppm. The experimental time was 17.1 h. The States-TPPI method was employed for the quadrature detection in the indirect dimension [49].

2.3.3. 1H-14N Phase-Modulated Rotational-Echo Saturation-Pulse Double-Resonance (PM-S-RESPDOR)

The νR was reduced to 62.5 kHz for spinning stability. The experiment was performed using the sequence in Figure S1c. The 1H pulse lengths for π/2 and π pulses were 0.93 and 2.13 µs, respectively. The SR 4 1 2   sequence was used to recouple 1H-14N dipolar couplings [50]. The ν1H value for the SR 4 1 2   sequence was 125 kHz. The τPM and ν14N for the phased-modulated (PM) pulse [38,51,52,53,54] were 0.192 ms (= 12 rotor cycles) and 140 kHz, respectively. The 1H and 14N offsets were 7 ppm and 0 ppm, respectively. The mixing time was ranged from 0 to 3456 µs with a step of 64 µs. The NMR measurement was recorded with 18 scans and the RD was 6 s. The experimental time was 3.3 h.

2.3.4. 1H-1H Selective Recoupling of Proton (SERP)

The experiments were performed using the sequence in Figure S1d. The shaped Q3 Gaussian pulse was applied at 14.28 ppm to select imidazole NH with the pulse length and rf-field of 2.0 ms and 1.8 kHz, respectively. The selective NH to H6 and NH to H8 SERP build-up curves were performed at 1H offsets of 9.73 ppm and 10.60 ppm, respectively. The cycle time, ν1H, phase, and τmixing for SERP for both experiments were 14.7 µs, 108 kHz, 480°, and from 0 to 3175.2 µs with a step of 58.8 µs, respectively. The 1H pulse length for the read-pulse was 0.75 µs. Both experiments were recorded with 24 scans with the recycling delay of 8.5 s, resulting in the experimental time of 3.2 h.

2.4. Spin Dynamics Simulation

Numerical simulations were performed using the SIMPSON software [55,56,57]. The input files are available in Supplementary Materials. For the 1H-14N PM-S-RESPDOR experiment, the powder averaging was performed with 100 pairs of {αPR, βPR} angles according to the REPULSION algorithm and 11 γPR angles. The spin models consist of a specific H spin and its neighboring N spins within the distance of 4.0 Å, corresponding to the four candidate structures of His1-4. For all the PM-S-RESPDOR simulations, the 14N quadrupolar coupling constant was set to 1.0 MHz. The J-couplings and the anisotropic chemical shifts of 1H and 14N nuclei were neglected. The other conditions were identical to the experiment. For the 1H-1H SERP experiments, the powder averaging was performed with 143 pairs of {αPR, βPR} angles according to the ZCW algorithm and 11 γPR angles. The spin models consist of a specific H spin and its neighboring H spins within the distance of 4.5 Å, corresponding to the four candidate structures of His1-4. The isotropic chemical shifts were taken from the experimental values, and the effective dipolar coupling for a specific spin pair Hj and Hk is considered:
b rss , j = j k b jk 2
where bjk is the dipolar coupling between spins Hj and Hk. The J-couplings and the chemical shift anisotropies of 1Hs were neglected. The other conditions are identical to the experiments.

2.5. Quantum Chemical (Density Functional Theory (DFT) and GIPAW) Calculation

The coordinates of all atoms were optimized (calculation mode ‘relax’ of program ‘pw’) before chemical shift calculation (program ‘gipaw’) using the density functional theory programs in the Quantum ESPRESSO package version 6.1 [58,59]. The cif2cell program was used to convert atomic coordinates from CIF to the unit cell. The unit cell contained 40 atoms for monoclinic l-histidine. The Monkhorst–Pack k-point grid was generated using a resolution of 0.4 Å−1. X.pbetrm-new-gipaw-dc. UPF was used as the pseudopotential for the atom X [60]. The kinetic energy cutoff for the wave functions (ecutwfc) was set to 80 Ry. The coordinates of all atoms were optimized with relaxed cell parameters starting from those determined by microED. The NMR shieldings, and thus chemical shifts, were obtained by subtracting the calculated chemical shifts from the reference shifts, which were adjusted to give the best agreement with the experimental data.

3. Results and Discussion

3.1. Ambiguities in MicroED Solution

Figure 1a,b represent the TEM image of a monoclinic His single crystal and a part of its ED patterns used in the structural solution, respectively. The initial solution is obtained from a single data set from a single crystal without merging (Figure 1c). The data provide the lattice parameters of a = 5.18 Å, b = 7.37 Å, c = 9.45 Å, and β = 98.4° with a space group of monoclinic P21 (Table S1). Although the initial structure includes missing or poorly located H(s) and misassignments of C, N, and O atoms, they are easily corrected with chemical knowledge of the molecular structure. In addition, a simple 1H/14N correlation experiment reveals the protonation states of the imidazole nitrogens and formation of zwitterion similar to the previous demonstration on orthorhombic l-histidine (see Figure S2) [4,43]. Since only two NH correlations appear and one is from NH3+ based on the characteristic 14N shifts, we confirm: (i) only one nitrogen on the imidazole ring was protonated and (ii) zwitterion was formed. However, there still remain four possible candidate structures derived from microED, which gave relatively high and indistinguishable R factors between 17.0 to 18.3 (Figure 2 and Table S2). We classify these structures into two groups—one consists of His1 (Figure 2a) and His3 (Figure 2c) while the other consists of His2 (Figure 2b) and His4 (Figure 2d). These two groups differ by the positions of C and N atoms on the imidazole ring. The R factors may indicate which is the correct structure; however, the kinetic approach in microED introduced ambiguities to distinguish these two atoms. Within each group, the His1 differs from His3 (as well as His2 differs from His4) by the position of H on either N5 or N7. Again the uncertainty in the R factor evaluation hampered clear validation of H atoms. In the folllowing, we used 1H-14N and 1H-1H NMR dipolar-based experiments to identify the correct structure.

3.2. Spectral Assignments

In the NMR dipolar-based validation, time evolution of a specific 1H resonance under 1H-14N or 1H-1H dipolar couplings is simulated based on the candidate structures and compared with the experimental one. Thus, it is crucial to assign the 1H resonances correctly to each hydrogen prior to the 1H-14N PM-S-RESPDOR and 1H-1H SERP analyses. For that purpose, 1H DQ/1H SQ homonuclear and 1H/13C heteronuclear correlation experiments were performed and their spectra are shown in Figure 3. Commonly, the combination of 1H DQ/1H SQ correlations (Figure 3a) and their distances from the crystallographic structure is a powerful tool for assigning 1H resonances. However, the location of a hydrogen atom on the imidazole ring is uncertain, which can lead to errors in assignment if based on 1H-1H distances. Therefore, it is better to assign peaks by 1H/13C correlation experiments. With such short CP2 of 0.1 ms, Figure 3b only shows the covalently bonded 1H and 13C resonances. Based on 13C chemical shifts, we unambiguously assign the four peaks C3, C2, C8, and C6 and link them to the corresponding 1H resonances of H3, H2, H8, and H6. The two remaining 1H resonances that do not show the correlations in Figure 3b are clearly assigned to imidazole NH and NH3 resonances since they do not attach to 13C. Based on the 1H signal intensities, we also assign NH and NH3 with certainty. The 1H/14N correlation experiment (Figure S2) also supports this assignment. All 1H resonances are clearly assigned. Quaternary carbons can be assigned through long C–H correlations. We performed the CP-HSQC experiment with a longer CP2 of 1.0 ms. The spectrum in Figure 3c shows the two additional 13C peaks with different chemical shifts that we can clearly assign to C4 and C1 resonances.

1H-14N PM-S-RESPDOR Experiment

Since the difference between His1(3) and His2(4) lies on the position of two N atoms on the imidazole ring, their H–N dipolar coupling network also differs. In order to probe the H–N dipolar coupling network, we performed the 1H-14N PM-S-RESPDOR experiment using the sequence in Figure S1c for the fraction curve. The fraction curve is generated by setting the ratio: ΔS/S0 = (S0S’)/S0 as a function of recoupling mixing time (τmix), where S0 and S’ are obtained from PM-S-RESPDOR without and with a 14N saturation pulse, respectively. The intensity ΔS/S0 of the fraction curve could in principle strongly depend on the 14N chemical shifts, 14N quadrupolar coupling as well as the ν14N of the saturation pulse. We overcame such dependences by using the PM pulse as the 14N saturation pulse since it can completely saturate 14N atoms no matter of 14N parameters [37]. 1H-14N PM-S-RESPDOR is capable of monitoring the weak 1H-14N dipolar couplings (i.e., long range 1H-14N interaction), which is relevant for the structural validation, even in the presence of strong 1H-14N dipolar coupling. This great advantage is owing to the recoupled Hamiltonians which commute to each other. As a result, while the behavior of the fraction curve at a short τmix is dominated by the strongest 1H-14N coupling, weak couplings modulate the fraction curve at a long τmix. Our strategy for correcting the N positions was to evaluate the agreement between the experimental and simulated 1H-14N PM-S-RESPDOR fraction curves. The better agreement corresponds to the more plausible structure.
Figure 4a shows the experimental (black circles) 1H-14N PM-S-RESPDOR fraction curve of H2. We first notice that the ΔS/S0 of this fraction curve is larger than 0.67—a theoretical maximum for an isolated 1H-14N system, indicating that the fraction curve results from the contributions of more than one 1H-14N pair. In other words, H2 experiences the dephasing effect induced by not only the closest neighboring 14N atom but also multiples of surrounding 14N atoms. We then simulated the 1H-14N fraction curve of this H2 atom using the 1H-14N distances, and thus dipolar couplings taken from the four candidate structures. To run the simulations within a reasonable time, we set the cutoff 1H-14N distance of 4.0 Å, corresponding to a dipolar coupling constant of 0.136 kHz. Figure 4a shows that the simulated curves of His1 (red) and His3 (green) are in better agreement with the experiment (black circles) than those of His2 (blue) and His4 (orange). However, the differences between the simulated curves for all structures are not significant enough to identify whether His1(3) are favored. Hence, we next examined the NH3 site.
Figure 4b shows the experimental (black circles) 1H-14N fraction curve of NH3. By contrast with that of H2, this fraction curve first reaches a maximum before continuing to grow at longer mixing time. This maximum results from the dipolar coupling of the covalent H–N bond. Since microED cannot precisely determine H–N distance in this case, we should separately measure this N–H dipolar coupling for better reproduction of the experiment. This was fulfilled by adjusting the strongest H–N dipolar coupling in a two-spin 1H-14N simulation so that the τmix for the first maximum between simulation and experiment matches (see Figure S3). Another issue to consider is the fast rotation of three H atoms of the NH3 site along the C–N axis. In the NMR timescale, N-H dipolar couplings, regardless to bonded or non-bonded NH, are time averaged dipolar coupling rather than the summation of the three independent N–H dipolar couplings. Again, in order to reproduce the experiment, we need to derive this averaged N-H dipolar coupling, whose procedure is detailed in the SI and Figure S4. Once we had calculated the averaged dipolar couplings of covalently bonded and the non-bonded H–N(s), we then simulated the 1H-14N PM-S-RESPDOR fraction curve for the NH3 site of the four candidate structures. Figure 4b shows a significantly better agreement between the simulated fraction curves of His1 (red) and His3 (green) and the experiment than those of His2 (blue) and His4 (orange). This confirms that His1 and His3 are favored, allowing the clear assignments of C and N atoms. Besides H2 and NH3 sites, we also simulated the 1H-14N PM-S-RESPDOR fraction curves for other 1H atoms but the experimental and simulated curves from the four candidate structures are similar to each other; hence, we cannot reach any conclusion from these 1H atoms (Figure S5).
In conclusion, by performing 1H-14N S-RESPDOR in combination with the PM pulse, we can identify the plausible structures, thus assign the C and N atoms with certainty on the imidazole ring.

3.3. 1H-1H SERP Experiments

Thanks to the 1H-14N PM-S-RESPDOR experiment, the candidate structures from microED were limited to His1 and His3. These two structures differ by the H position on either N7 or N5 on the imidazole ring. For His1, this H is spatially close to both H6 and H8 (dH-H ≤ 3.0 Å) whereas for His3, this H is only spatially close to H6. Such a difference in 1H-1H dipolar coupling network results in a different magnetization transfer profile. Namely, if we can selectively transfer the magnetization from NH to H6 and H8, we expect that His1 should provide two 1H-1H build-up curves with similar build-up rates whereas His3 should provide two 1H-1H build-up curves with different build-up rates. By simulating these curves and comparing them with the experiments, we can identify the correct structure. This strategy is feasible only when the magnetization transfer is selective otherwise the other 1H-1H dipolar couplings would complicate this transfer. For example, under a broadband recoupling sequence such as fp-RFDR, the build-up curves show almost similar build-up rates for all 1H atoms owing to the relayed magnetization transfer [40]. For this reason, we performed the 1H-1H SERP experiments to selectively transfer the magnetization between a 1H-1H pair, using the sequence in Figure S1d.
In the previous section, we measured the H–N bond distance by matching the simulated and experimental 1H-14N PM-S-RESPDOR curves because microED fails to precisely locate H atoms for covalent N–H bond. With the new N–H distance, the new H position must be modified. Consequently, the distances of this N-bonded H to other H atoms also need to be recalculated for reproducing the experiment. The procedure of recalculation is shown in the SI and Figure S6. For running simulations within a reasonable time, we set the cutoff 1H-1H distance of 4.5 Å, corresponding to a dipolar coupling constant of 1.32 kHz.
Figure 5a shows the comparison of the experimental 1H-1H SERP build-up curve with the simulated curves from His1 (red) and His3 (green) for selective transfer between NH and H6. All curves are similar to each other. This result is expected because the NH is spatially close to H6 for both His1 and His3; thus, their build-up curves should be similar. Figure 5b shows the comparison of the experimental 1H-1H SERP build-up curve with the simulated curves from His1 (red) and His3 (green) for selective transfer between NH and H8. We clearly observe that the simulated build-up curve from His1 matches the experimental curve well but the curve from His3 does not. Furthermore, the simulated NH-H8 build-up rate is similar to that of NH-H6 for His1. These results clearly indicate that His1 is the correct structure.
We note that the ambiguity of the H position here can be qualitatively solved by the 1H-1H R 12 2 5 sequence (Figure S1a) at short mixing time of 57.1 μs, where only short dH-H correlations can be probed. The experiment clearly gives two correlations between NH and H6/H8 with similar intensities, confirming that His1 is the correct structure (see Figure S7). This is consistent with the result from SERP.
In conclusion, the 1H-1H SERP experiments reveal the H position on the N7 atom.
We have further performed quantum chemical calculation based on a well-established NMR crystallography approach. First, geometry optimization was conducted by relaxing all atoms for His1-4. The root mean square of the atomic displacement of non-hydrogen atoms is given in Table S3. The large atomic displacements in His2-4 reveal that these structures are unstable and need significant structural modifications to minimize the energy. On the other hand, His1 clearly exhibits the minimum atomic displacement, indicating His1 is the most plausible structure. The His1 structure also exhibits the minimum energy consistent with all the above analyses (Table S3). The 1H/13C/15N isotropic chemical shifts were calculated for each geometry optimized structure and compared with the experimental values (Figure S8 and Table S4). The best agreements in 1H and 13C shifts are given for the His1 structure. All the above analyses consistently support the assertion that His1 is the correct structure, agreeing with the published XRD monoclinic l-histidine structure from CCDC. This conclusion is further confirmed by the comparison of the two structures (see Figure S9).

4. Conclusions

We have demonstrated that the ssNMR dipolar-based experiments can provide a reliable measure of structure validation. While microED successfully solves the structures of sub-micro sized crystals, several different candidates remain due to uncertain H positions and C/N/O assignments. R factor is widely used as a reliable measure of validation in XRD; however, the nature of dynamic scattering in microED undermines its reliability in kinetic analysis. On the other hand, it is experimentally and numerically feasible to investigate the spin evolution for each candidate structure in the ssNMR dipolar-based method to identify the correct structure. As a demonstration, the crystalline structure of monoclinic l-histidine was solved. MicroED provided the four candidate structures each of which differs in H positions and C/N assignments. ssNMR dipolar-based experiments were used with the aid of spin dynamics numerical simulations for structural validation. Namely, by comparing the experimental and simulated data, we unambiguously distinguished the C and N atoms with 1H-14N PM-S-RESPDOR and correctly located the H atom on the N atom of the imidazole ring with 1H-1H SERP. The chemical shifts, atomic displacement during geometry optimization, and total energy in the quantum chemical calculations also supported the result. The ssNMR dipolar-based experiments do not need any isotopic labelling and were performed at natural abundance with high sensitivity of 1H-detection. The additional advantage of our approach is the independence from the temperature effect since all the experimental and simulated measurements were performed at the ambient temperature. Nevertheless, we note that the unambiguous 1H assignments are a prerequisite for the success of this approach because the ssNMR dipolar-based experiments studied the time evolution of each single 1H resonance. This requirement may be difficult for large molecules without isotopic labelling where the 1H resonances are severely overlapped. With the advantages and disadvantages, we believe that our approach still contributes to the NMR crystallography field for the structural determination of small molecules.

Supplementary Materials

The following are available online, Table S1: Crystallographic data for monoclinic l-histidine, Table S2: R factors for His1-4, Table S3: Root mean square of atomic displacement during energy optimization and total energies for His1-4, Table S4: The root mean square deviation value between experimental and calculated chemical shifts for His1-4, Figure S1: Pulse sequences for (a) 2D 1H DQ/1H SQ, (b) 2D 1H-{13C} CP-HSQC, (c) 1H-14N PM-S-RESPDOR, (d) 1H-1H SERP, and (e) 2D 1H-{14N} T-HMQC. For (a), R 18 4 7 or R 12 2 5 are used to excite and reconvert the 1H DQ coherences. For (c), the PM pulse is used to uniformly saturate the populations of 14N nuclei. For (d), the Q3 Gaussian pulse is used to selectively invert a 1H site of interest and m denotes the number of loops. The 1H-14N dipolar coupling is recovered by (b) SR 4 1 2 lasting for τmix on 1H channel or (e) long continuous wave pulse lasting for τp on 14N channel. The grey rand black rectangles denote the π/2 and π pulses, respectively, Figure S2: The 2D 1H-{14N} T-HMQC experiment using the sequence in Figure S1e was performed at B0 = 16.4 T and νR = 62.5 kHz. The τp was 350 µs while the 1H pulse lengths for π/2 and π pulses were 0.93 and 2.13 µs, respectively. The 1H and 14N offsets were 8 and −150 ppm, respectively. The 2D spectrum was recorded with 8 scans, 32 t1 points, and rotor-synchronized t1 increment of 16 µs. The recycling delay was 10 s. The experimental time was 1.4 h. The States-TPPI method was employed for the quadrature detection along the indirect dimension, Figure S3: 1H-14N PM-S-RESPDOR fraction curves: experiment (black circles) and 1H-14N simulation (red line) for (a) NH3 and (b) NH. The 1H-14N dipolar coupling is numerically adjusted so that the τmix for the first maximum (dashed line) between experiment and simulation matches to each other, Figure S4: Schematic illustrations of calculating the temporal H position (Htemp) resulting from the rotation of three hydrogens Ha, Hb, and Hc in the (a) three-dimensional and (b) simplified two-dimensional space. The CN vector crosses the plane (HaHbHc) at the point R. The RH cross and RH temp vectors are defined by the mathematical at the upper right of the figure. The symbol α(t) denotes an angle as a variable of time between RH a and RH temp vectors, Figure S5: Comparison of the experimental 1H-14N RESPDOR fraction curve (black circles) with the simulated curves from His1 (red), His2 (blue) for (a) NH, (b) H6, and (c) H3. For a, the dipolar coupling of the H–N bond was taken from the two-spin simulation in Figure S3b, Figure S6: Schematic illustration to re-calculate the 1H-1H distance of interest, here the Hnew−Hfar pair based on the new dN-Hnew derived from the 1H-14N PM-S-RESPDOR experiment, Figure S7: The 2D 1H DQ/1H SQ R 12 2 5 experiment using the sequence in Figure S1a was performed at B0 = 16.4 T and νR = 70 kHz. The R 12 2 5 DQ homonulcear recoupling sequence was used to excite and reconvert the 1H DQ coherences. The NH-H6 and NH-H8 correaltions are highlighted by two horizontal lines. The ν1H was 210 kHz for R 12 2 5   and 281 kHz for the read-pulse of 0.89 µs. The R 12 2 5   mixing time was 57.1 µs. Before the read-pulse, the 0.5 ms z-filter was employed to suppress residual transversal magnetization. The 2D 1H DQ/SQ spectrum was recorded with four scans, 64 t1 points, and rotor-synchronized t1 increment of 57.1 µs. The recycling delay was 10 s. The experimental time was 1.4 h. The States-TPPI method was employed for the quadrature detection along the indirect dimension, Figure S8: A comparison of the experimental chemical shifts with the calculated values by GIPAW for His1 (black squares), His2 (red circles), His3 (blue triangles), and His4 (green crosses) for (a) 1H, (b) 13C, and (c) 15N, Figure S9: Comparison of the (a) His1 structure with (b) the XRD-based structure, SIMPSON input files for PM-S-RESPDOR and SERP.

Author Contributions

Conceptualization, Y.N.; methodology, N.T.D., Y.A., K.K., T.Y. and Y.N.; formal analysis, N.T.D.; investigation, N.T.D. and Y.N.; resources, Y.N.; writing—original draft preparation, N.T.D.; writing—review and editing, N.T.D., Y.A., K.K., T.Y. and Y.N.; visualization, N.T.D.; supervision, Y.N.; project administration, Y.N.; funding acquisition, Y.N. All authors have read and agreed to the published version of the manuscript.

Funding

This work was supported by JSPS KAKENHI Grant Number 20K05483 and in part by the JST-Mirai Program (Grant No. JPMJMI17A2, Japan) to Y.N.

Institutional Review Board Statement

Not applicable.

Informed Consent Statement

Not applicable.

Data Availability Statement

Data available upon request.

Conflicts of Interest

The authors declare no conflict of interest.

Sample Availability

Sample of the monoclinic form of l-histidine compound is available from the authors.

References

  1. Gemmi, M.; Lanza, A.E. 3D electron diffraction techniques. Acta Crystallographica Section B: Structural Science. Acta Crystallogr. Sect. B Struct. Sci. Cryst. Eng. Mater. 2019, 75, 495–504. [Google Scholar] [CrossRef] [PubMed]
  2. Mugnaioli, E.; Gorelik, T.; Kolb, U. “Ab initio” structure solution from electron diffraction data obtained by a combination of automated diffraction tomography and precession technique. Ultramicroscopy 2009, 109, 758–765. [Google Scholar] [CrossRef]
  3. Nannenga, B.L.; Shi, D.; Leslie, A.G.W.; Gonen, T. High-resolution structure determination by continuous-rotation data collection in MicroEDED. Nat. Methods 2014, 11, 927–930. [Google Scholar] [CrossRef] [PubMed] [Green Version]
  4. Guzmán-Afonso, C.; Hong, Y.-L.; Colaux, H.; Iijima, H.; Saitow, A.; Fukumura, T.; Aoyama, Y.; Motoki, S.; Oikawa, T.; Yamazaki, T.; et al. Understanding hydrogen-bonding structures of molecular crystals via electron and NMR nanocrystallography. Nat. Commun. 2019, 10, 1–10. [Google Scholar] [CrossRef]
  5. Gruene, T.; Wennmacher, J.T.C.; Zaubitzer, C.; Holstein, J.J.; Heidler, J.; Fecteau-Lefebvre, A.; De Carlo, S.; Müller, E.; Goldie, K.N.; Regeni, I.; et al. Rapid Structure Determination of Microcrystalline Molecular Compounds Using Electron Diffraction. Angew. Chem. Int. Ed. 2018, 57, 16313–16317. [Google Scholar] [CrossRef] [PubMed] [Green Version]
  6. Jones, C.G.; Martynowycz, M.W.; Hattne, J.; Fulton, T.J.; Stoltz, B.M.; Rodriguez, J.A.; Nelson, H.M.; Gonen, T. The CryoEM Method MicroED as a Powerful Tool for Small Molecule Structure Determination. ACS Cent. Sci. 2018, 4, 1587–1592. [Google Scholar] [CrossRef]
  7. Palatinus, L.; Brázda, P.; Boullay, P.; Perez, O.; Klementová, M.; Petit, S.; Eigner, V.; Zaarour, M.; Mintova, S. Hydrogen positions in single nanocrystals revealed by electron diffraction. Science 2017, 355, 166–169. [Google Scholar] [CrossRef]
  8. Van Genderen, E.; Clabbers, M.T.B.; Das, P.P.; Stewart, A.; Nederlof, I.; Barentsen, K.C.; Portillo, Q.; Pannu, N.S.; Nicolopoulos, S.; Gruene, T.; et al. Ab initio structure determination of nanocrystals of organic pharmaceutical compounds by electron diffraction at room temperature using a Timepix quantum area direct electron detector. Acta Crystallogr. Sect. A Found. Adv. 2016, 72, 236–242. [Google Scholar] [CrossRef] [Green Version]
  9. Hattne, J.; Reyes, F.E.; Nannenga, B.L.; Shi, D.; De La Cruz, M.J.; Leslie, A.G.W.; Gonen, T. MicroED data collection and processing. Acta Crystallogr. Sect. A Found. Adv. 2015, 71, 353–360. [Google Scholar] [CrossRef] [PubMed] [Green Version]
  10. Kolb, U.; Gorelik, T.; Otten, M.T. Towards automated diffraction tomography. Part II-Cell parameter determination. Ultramicroscopy 2008, 108, 763–772. [Google Scholar] [CrossRef]
  11. Zhang, D.; Oleynikov, P.; Hovmoller, S.; Zou, X. Collecting 3D electron diffraction data by the rotation method. Z. Fuer Krist. 2010, 225, 94–102. [Google Scholar] [CrossRef]
  12. Shi, D.; Nannenga, B.L.; Iadanza, M.G.; Gonen, T. Three-dimensional electron crystallography of protein microcrystals. eLife 2013, 2, 1–17. [Google Scholar] [CrossRef]
  13. Yonekura, K.; Kato, K.; Ogasawara, M.; Tomita, M.; Toyoshima, C. Electron crystallography of ultrathin 3D protein crystals: Atomic model with charges. Proc. Natl. Acad. Sci. USA 2015, 112, 3368–3373. [Google Scholar] [CrossRef] [Green Version]
  14. Clabbers, M.T.B.; Gruene, T.; van Genderen, E.; Abrahams, J.P. Reducing dynamical electron scattering reveals hydrogen atoms. Acta Crystallogr. Sect. A Found. Adv. 2019, 75, 82–93. [Google Scholar] [CrossRef] [Green Version]
  15. Hynek, J.; Brázda, P.; Rohlíček, J.; Londesborough, M.G.S.; Demel, J. Phosphinic Acid Based Linkers: Building Blocks in Metal–Organic Framework Chemistry. Angew. Chem. Int. Ed. 2018, 57, 5016–5019. [Google Scholar] [CrossRef]
  16. Brázda, P.; Palatinus, L.; Babor, M. Electron diffraction determines molecular absolute configuration in a pharmaceutical nanocrystal. Science 2019, 364, 667–669. [Google Scholar] [CrossRef]
  17. Ripmeester, J.A.; Wasylishen, R.E. NMR crystallography. CrystEngComm 2013, 15, 8598. [Google Scholar] [CrossRef]
  18. Martineau, C.; Senker, J.; Taulelle, F. NMR Crystallography. In Annual Reports on NMR Spectroscopy; Elsevier Ltd.: London, UK, 2014; Volume 82, pp. 1–57. ISBN 9780128001844. [Google Scholar] [CrossRef]
  19. Mafra, L. Preface. Solid State Nucl. Magn. Reson. 2015, 65, 1. [Google Scholar] [CrossRef]
  20. Ashbrook, S.E.; McKay, D. Combining solid-state NMR spectroscopy with first-principles calculations-a guide to NMR crystallography. Chem. Commun. 2016, 52, 7186–7204. [Google Scholar] [CrossRef] [Green Version]
  21. Bryce, D.L.; Taulelle, F. NMR Crystallography. Acta Crystallogr. Sect. C Struct. Chem. 2017, 73, 126–127. [Google Scholar] [CrossRef] [Green Version]
  22. Bryce, D.L. NMR crystallography: Structure and properties of materials from solid-state nuclear magnetic resonance observables. IUCrJ 2017, 4, 350–359. [Google Scholar] [CrossRef] [Green Version]
  23. Ashbrook, S.E.; Hodgkinson, P. Perspective: Current advances in solid-state NMR spectroscopy. J. Chem. Phys. 2018, 149, 040901. [Google Scholar] [CrossRef] [Green Version]
  24. Hodgkinson, P. NMR crystallography of molecular organics. Prog. Nucl. Magn. Reson. Spectrosc. 2020, 118–119, 10–53. [Google Scholar] [CrossRef] [PubMed]
  25. Pickard, C.J.; Mauri, F. All-electron magnetic response with pseudopotentials: NMR chemical shifts. Phys. Rev. B Condens. Matter Mater. Phys. 2001, 63, 2451011–2451013. [Google Scholar] [CrossRef] [Green Version]
  26. Sebastiani, D.; Parrinello, M. A new ab-initio approach for NMR chemical shifts in periodic systems. J. Phys. Chem. A 2001, 105, 1951–1958. [Google Scholar] [CrossRef]
  27. Yates, J.R.; Pickard, C.J.; Mauri, F. Calculation of NMR chemical shifts for extended systems using ultrasoft pseudopotentials. Phys. Rev. B Condens. Matter Mater. Phys. 2007, 76, 1–11. [Google Scholar] [CrossRef]
  28. Corlett, E.K.; Blade, H.; Hughes, L.P.; Sidebottom, P.J.; Walker, D.; Walton, R.I.; Brown, S.P. Investigating discrepancies between experimental solid-state NMR and GIPAW calculation: N[dbnd]C–N 13C and OH⋯O 1H chemical shifts in pyridinium fumarates and their cocrystals. Solid State Nucl. Magn. Reson. 2020, 108, 101662. [Google Scholar] [CrossRef]
  29. Harris, R.K.; Joyce, S.A.; Pickard, C.J.; Cadars, S.; Emsley, L. Assigning carbon-13 NMR spectra to crystal structures by the INADEQUATE pulse sequence and first principles computation: A case study of two forms of testosterone. Phys. Chem. Chem. Phys. 2006, 8, 137–143. [Google Scholar] [CrossRef]
  30. Dračínský, M.; Unzueta, P.; Beran, G.J.O. Improving the accuracy of solid-state nuclear magnetic resonance chemical shift prediction with a simple molecular correction. Phys. Chem. Chem. Phys. 2019, 21, 14992–15000. [Google Scholar] [CrossRef]
  31. Dračínský, M. Analyzing Discrepancies in Chemical-Shift Predictions of Solid Pyridinium Fumarates. Molecules 2021, 26, 3857. [Google Scholar] [CrossRef]
  32. Steiner, T.; Majerz, I.; Wilson, C.C. First O−H−N Hydrogen Bond with a Centered Proton Obtained by Thermally Induced Proton Migration. Angew. Chem. Int. Ed. 2001, 40, 2651–2654. [Google Scholar] [CrossRef]
  33. Mazurek, A.H.; Szeleszczuk, Ł.; Pisklak, D.M. A review on combination of ab initio molecular dynamics and nmr parameters calculations. Int. J. Mol. Sci. 2021, 22, 4378. [Google Scholar] [CrossRef]
  34. Gan, Z. Measuring multiple carbon-nitrogen distances in natural abundant solids using R-RESPDOR NMR. Chem. Commun. 2006, 4712–4714. [Google Scholar] [CrossRef]
  35. Chen, L.; Lu, X.; Wang, Q.; Lafon, O.; Trébosc, J.; Deng, F.; Amoureux, J.P. Distance measurement between a spin-1/2 and a half-integer quadrupolar nuclei by solid-state NMR using exact analytical expressions. J. Magn. Reson. 2010, 206, 269–273. [Google Scholar] [CrossRef] [PubMed]
  36. Chen, L.; Wang, Q.; Hu, B.; Lafon, O.; Trébosc, J.; Deng, F.; Amoureux, J.P. Measurement of hetero-nuclear distances using a symmetry-based pulse sequence in solid-state NMR. Phys. Chem. Chem. Phys. 2010, 12, 9395–9405. [Google Scholar] [CrossRef] [PubMed]
  37. Lu, X.; Lafon, O.; Trébosc, J.; Amoureux, J.P. Detailed analysis of the S-RESPDOR solid-state NMR method for inter-nuclear distance measurement between spin-1/2 and quadrupolar nuclei. J. Magn. Reson. 2011, 215, 34–49. [Google Scholar] [CrossRef]
  38. Duong, N.T.; Rossi, F.; Makrinich, M.; Goldbourt, A.; Chierotti, M.R.; Gobetto, R.; Nishiyama, Y. Accurate 1H-14N distance measurements by phase-modulated RESPDOR at ultra-fast MAS. J. Magn. Reson. 2019, 308, 106559. [Google Scholar] [CrossRef]
  39. Duong, N.T.; Gan, Z.; Nishiyama, Y. Selective 1H-14N Distance Measurements by 14N Overtone Solid-State NMR Spectroscopy at Fast MAS. Front. Mol. Biosci. 2021, 8, 71. [Google Scholar] [CrossRef] [PubMed]
  40. Duong, N.T.; Raran-Kurussi, S.; Nishiyama, Y.; Agarwal, V. Quantitative 1H–1H Distances in Protonated Solids by Frequency-Selective Recoupling at Fast Magic Angle Spinning NMR. J. Phys. Chem. Lett. 2018, 9, 5948–5954. [Google Scholar] [CrossRef]
  41. Duong, N.T.; Raran-Kurussi, S.; Nishiyama, Y.; Agarwal, V. Can proton-proton recoupling in fully protonated solids provide quantitative, selective and efficient polarization transfer? J. Magn. Reson. 2020, 317, 106777. [Google Scholar] [CrossRef] [PubMed]
  42. Potnuru, L.R.; Duong, N.T.; Ahlawat, S.; Raran-Kurussi, S.; Ernst, M.; Nishiyama, Y.; Agarwal, V. Accuracy of 1H-1H distances measured using frequency selective recoupling and fast magic-angle spinning. J. Chem. Phys. 2020, 153, 084202. [Google Scholar] [CrossRef]
  43. Oikawa, T.; Okumura, M.; Kimura, T.; Nishiyama, Y. Solid-state NMR meets electron diffraction: Determination of crystalline polymorphs of small organic microcrystalline samples. Acta Crystallogr. Sect. C Struct. Chem. 2017, 73, 219–228. [Google Scholar] [CrossRef]
  44. Kabsch, W. research papers XDS research papers. Acta Crystallogr. Sect. D Biol. Crystallogr. 2010, 66, 125–132. [Google Scholar] [CrossRef] [PubMed] [Green Version]
  45. Burla, M.C.; Caliandro, R.; Carrozzini, B.; Cascarano, G.L.; Cuocci, C.; Giacovazzo, C.; Mallamo, M.; Mazzone, A.; Polidori, G. Crystal structure determination and refinement via SIR2014. J. Appl. Crystallogr. 2015, 48, 306–309. [Google Scholar] [CrossRef]
  46. Hübschle, C.B.; Sheldrick, G.M.; Dittrich, B. ShelXle: A Qt graphical user interface for SHELXL. J. Appl. Crystallogr. 2011, 44, 1281–1284. [Google Scholar] [CrossRef] [PubMed] [Green Version]
  47. Sheldrick, G.M. Crystal structure refinement with SHELXL. Acta Crystallogr. Sect. C Struct. Chem. 2015, 71, 3–8. [Google Scholar] [CrossRef] [PubMed]
  48. Nishiyama, Y.; Agarwal, V.; Zhang, R. Efficient symmetry-based γ-encoded DQ recoupling sequences for suppression of t1-noise in solid-state NMR spectroscopy at fast MAS. Solid State Nucl. Magn. Reson. 2021, 114, 101734. [Google Scholar] [CrossRef]
  49. Marion, D.; Ikura, M.; Tschudin, R.; Bax, A. Rapid recording of 2D NMR spectra without phase cycling. Application to the study of hydrogen exchange in proteins. J. Magn. Reson. 1989, 85, 393–399. [Google Scholar] [CrossRef]
  50. Brinkmann, A.; Kentgens, A.P.M. Proton-selective O-17-H-1 distance measurements in fast magic-angle-spinning solid-state NMR spectroscopy for the determination of hydrogen bond lengths. J. Am. Chem. Soc. 2006, 128, 14758–14759. [Google Scholar] [CrossRef] [Green Version]
  51. Nimerovsky, E.; Gupta, R.; Yehl, J.; Li, M.; Polenova, T.; Goldbourt, A. Phase-modulated LA-REDOR: A robust, accurate and efficient solid-state NMR technique for distance measurements between a spin-1/2 and a quadrupole spin. J. Magn. Reson. 2014, 244, 107–113. [Google Scholar] [CrossRef]
  52. Nimerovsky, E.; Makrinich, M.; Goldbourt, A. Analysis of large-anisotropy-spin recoupling pulses for distance measurement under magic-angle spinning NMR shows the superiority and robustness of a phase modulated saturation pulse. J. Chem. Phys. 2017, 146, 124202. [Google Scholar] [CrossRef]
  53. Makrinich, M.; Nimerovsky, E.; Goldbourt, A. Pushing the limit of NMR-based distance measurements–retrieving dipolar couplings to spins with extensively large quadrupolar frequencies. Solid State Nucl. Magn. Reson. 2018, 92, 19–24. [Google Scholar] [CrossRef] [PubMed]
  54. Makrinich, M.; Sambol, M.; Goldbourt, A. Distance measurements between carbon and bromine using a split-pulse PM-RESPDOR solid-state NMR experiment. Phys. Chem. Chem. Phys. 2020, 22, 21022–21030. [Google Scholar] [CrossRef] [PubMed]
  55. Bak, M.; Rasmussen, J.T.; Nielsen, N.C. SIMPSON: A general simulation program for solid-state NMR spectroscopy. J. Magn. Reson. 2000, 147, 296–330. [Google Scholar] [CrossRef] [PubMed] [Green Version]
  56. Tošner, Z.; Andersen, R.; Stevensson, B.; Edén, M.; Nielsen, N.C.; Vosegaard, T. Computer-intensive simulation of solid-state NMR experiments using SIMPSON. J. Magn. Reson. 2014, 246, 79–93. [Google Scholar] [CrossRef]
  57. Juhl, D.W.; Tošner, Z.; Vosegaard, T. Versatile NMR simulations using SIMPSON. Annu. Rep. NMR Spectrosc. 2020, 100, 1–59. [Google Scholar] [CrossRef]
  58. Varini, N.; Ceresoli, D.; Martin-Samos, L.; Girotto, I.; Cavazzoni, C. Enhancement of DFT-calculations at petascale: Nuclear Magnetic Resonance, Hybrid Density Functional Theory and Car-Parrinello calculations. Comput. Phys. Commun. 2013, 184, 1827–1833. [Google Scholar] [CrossRef] [Green Version]
  59. Giannozzi, P.; Andreussi, O.; Brumme, T.; Bunau, O.; Buongiorno Nardelli, M.; Calandra, M.; Car, R.; Cavazzoni, C.; Ceresoli, D.; Cococcioni, M.; et al. Advanced capabilities for materials modelling with Quantum ESPRESSO. J. Phys. Condens. Matter 2017, 29, 465901. [Google Scholar] [CrossRef] [Green Version]
  60. Ceresoli, D. Pseudopotentials. Available online: https://sites.google.com/site/dceresoli/pseudopotentials (accessed on 30 June 2021).
Figure 1. (a) TEM image of a single crystal of monoclinic l-histidine. (b) A set of ED patterns observed under the continuous rotation. The sample rotated 1° during each acquisition. (c) Initial structure solved using microED data set. The dark blue, grey, light blue, and red atoms denote H, C, N, and O, respectively.
Molecules 26 04652 g001
Figure 2. Four candidate structures of monoclinic l-histidine (His) derived from microED analysis: (a) His1, (b) His2, (c) His3, and (d) His4. The dark blue, grey, light blue, and red atoms denote H, C, N, and O, respectively. His1(3) differ from His2(4) by the positions of C and N atoms on the imidazole ring. His1(2) differ from His3(4) by the position of H atom on a N atom on the imidazole ring. The H, C and N atoms are numbered.
Molecules 26 04652 g002
Figure 3. 1H and 13C spectral assignments of His with (a) 2D 1H-1H R 18 4 7   experiment, (b) and (c) 2D 1H-13C proton-detected CP-HSQC experiments with (b) CP2 = 0.1 ms and (c) 1.0 ms.
Molecules 26 04652 g003
Figure 4. Comparison of the experimental 1H-14N phase-modulated rotational-echo saturation-pulse double-resonance (PM-S-RESPDOR) fraction curves (black circles) with the simulated curves of His1 (red), His2 (blue), His3 (green), His4 (orange) for (a) H2 and (b) NH3.
Molecules 26 04652 g004
Figure 5. Comparison of the experimental 1H-1H selective recoupling of proton (SERP) build-up curve (black circle) with the simulated curves from His1 (red) and His3 (green) for selective transfer between (a) NH-H6 and (b) NH-H8.
Molecules 26 04652 g005
Publisher’s Note: MDPI stays neutral with regard to jurisdictional claims in published maps and institutional affiliations.

