
Size and Structure of Empty and Filled Nanocontainer Based on Peptide Dendrimer with Histidine Spacers at Different pH

 , , , , and
Abstract
1. Introduction
2. Materials and Methods
3. Results
3.1. The Global Characteristics
3.2. The Local Structure
3.2.1. The Spatial Symmetry and Atomic Distributions
3.2.2. Electrostatic Interactions
3.2.3. The Hydrogen Bonds
3.3. The Imidazole and Guanidine Pairing
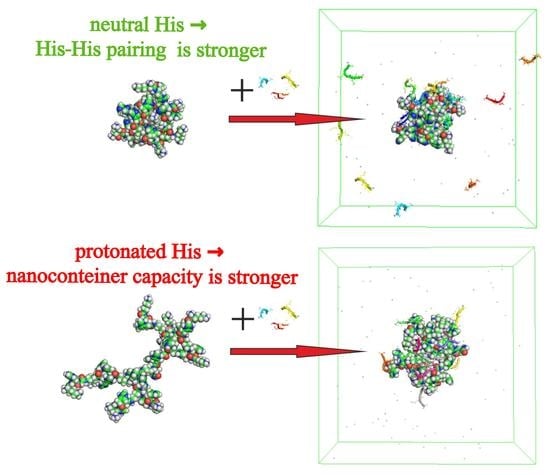
3.4. The Interaction of Dendrimers with Molecules of Therapeutic Tetrapeptide
4. Conclusions
Author Contributions
Funding
Institutional Review Board Statement
Informed Consent Statement
Acknowledgments
Conflicts of Interest
References
- Buhleier, E.; Wehner, W.; Vogtle, F. Cascade and Nonskid-Chain-Like Syntheses of Molecular Cavity Topologies. Synthesis 1978, 2, 155–158. [Google Scholar] [CrossRef]
- Tomalia, D.; Baker, H.; Dewald, M.; Hall, J.; Kallos, G.; Martin, S.; Roeck, J.; Ryder, J.; Smith, P. A New Class of Polymers: Starburst-Dendritic Macromolecules. Polym. J. 1985, 17, 117–132. [Google Scholar] [CrossRef]
- Hawker, C.J.; Frechet, J.M.J. Control of surface functionality in the synthesis of dendritic macromolecules using the convergent-growth approach. Macromolecules 1990, 23, 4726–4729. [Google Scholar] [CrossRef]
- Yemul, O.; Imae, T. Synthesis and characterization of poly(ethyleneimine) dendrimers. Colloid Polym. Sci. 2008, 286, 747–752. [Google Scholar] [CrossRef]
- Schlenk, C.; Frey, H. Carbosilane Dendrimers—Synthesis, Functionalization, Application. Silicon Chem. 1999, 3–14. [Google Scholar] [CrossRef]
- Abbasi, E.; Aval, S.; Akbarzadeh, A.; Milani, M.; Nasrabadi, H.; Joo, S.; Hanifehpour, Y.; Nejati-Koshki, K.; Pashaei-Asl, R. Dendrimers: Synthesis, applications, and properties. Nanoscale Res. Lett. 2014, 9, 247. [Google Scholar] [CrossRef] [PubMed]
- Yamamoto, K.; Imaoka, T.; Tanabe, M.; Kambe, T. New Horizon of Nanoparticle and Cluster Catalysis with Dendrimers. Chem Rev. 2020, 120, 1397–1437. [Google Scholar] [CrossRef] [PubMed]
- Sherje, A.; Jadhav, M.; Dravyakar, B.; Kadam, D. Dendrimers: A versatile nanocarrier for drug delivery and targeting. Int. J. Pharm. 2018, 548, 707–720. [Google Scholar] [CrossRef]
- Madaan, K.; Kumar, S.; Poonia, N.; Lather, V.; Pandita, D. Dendrimers in drug delivery and targeting: Drug-dendrimer interactions and toxicity issues. J. Pharm. Bioallied Sci. 2014, 6, 139–150. [Google Scholar] [CrossRef]
- Dutta, T.; Jain, N.; McMillan, N.; Parekh, H. Dendrimer nanocarriers as versatile vectors in gene delivery. Nanomedicine 2010, 6, 815. [Google Scholar] [CrossRef]
- Ionov, M.; Lazniewska, J.; Dzmitruk, V.; Halets, I.; Loznikova, S.; Novopashina, D.; Apartsin, E.; Krasheninina, O.; Venyaminova, A.; Milowska, K.; et al. Anticancer siRNA cocktails as a novel tool to treat cancer cells. Part (A). Mechanisms of interaction. Int. J. Pharm. 2015, 485, 261–269. [Google Scholar] [CrossRef] [PubMed]
- Rabiee, N.; Ahmadvand, S.; Ahmadi, S.; Fatahi, Y.; Dinarvand, R.; Bagherzadeh, M.; Hamblin, M.R. Carbosilane Dendrimers: Drug and Gene Delivery Applications. J. Drug Deliv. Sci. Technol. 2020, 59, 101879. [Google Scholar] [CrossRef]
- Yin, H.; Kanasty, R.L.; Eltoukhy, A.A.; Vegas, A.J.; Dorkin, J.R.; Anderson, D.G. Non-viral vectors for gene-based therapy. Nat. Rev. Genet. 2014, 15, 541–555. [Google Scholar] [CrossRef]
- Jiang, D.; Wang, M.; Wang, T.; Zhang, B.; Liu, C.; Zhang, N. Multifunctionalized polyethyleneimine-based nanocarriers for gene and chemotherapeutic drug combination therapy through one-step assembly strategy. Int. J. Nanomed. 2017, 12, 8681–8698. [Google Scholar] [CrossRef] [PubMed][Green Version]
- Biswas, S.; Torchilin, V. Dendrimers for siRNA delivery. Pharmaceuticals 2013, 6, 161–183. [Google Scholar] [CrossRef] [PubMed]
- Denkewalter, R.G.; Kolc, J.; Lukasavage, W.J. Macromolecular Highly Branched Homogeneous Compound Based on Lysine Units. U.S. Patent US 4289872A, 15 September 1981. [Google Scholar]
- Aharoni, S.M.; Crosby, C.R., III; Walsh, E.K. Size and solution properties of globular tert-butyloxycarbonyl-poly(α,ϵ-L-lysine). Macromolecules 1982, 15, 1093–1098. [Google Scholar] [CrossRef]
- Aharoni, S.; Murthy, M. Spherical non-draining BOC-poly-(α,ϵ-L-lysine) macromolecules SAX and viscous study. Polym. Commun. 1983, 24, 132. [Google Scholar]
- Vlasov, G.; Pavlov, G.; Bayanova, N.; Korneeva, E.; Ebel, C.; Khodorkovskii, M.; Artamonova, T. Dendrimers Based on a-Amino Acids: Synthesis and Hydrodynamic Characteristics. Dokl. Phys. Chem. 2004, 399, 366–368. [Google Scholar] [CrossRef]
- Roberts, B.P.; Scanlon, M.J.; Krippner, G.Y.; Chalmers, D.K. Molecular Dynamics of Poly(l-lysine) Dendrimers with Naphthalene Disulfonate Caps. Macromolecules 2009, 42, 2775–2783. [Google Scholar] [CrossRef]
- Neelov, I.; Falkovich, S.; Markelov, D.; Paci, E.; Darinskii, A.; Tenhu, H. Molecular Dynamics of Lysine Dendrimers. Computer Simulation and NMR. In Dendrimers in Biomedical Applications; Royal Society of Chemistry: Cambridge, UK, 2013; pp. 99–114. [Google Scholar] [CrossRef]
- Neelov, I.; Markelov, D.; Falkovich, S.; Ilyash, M.; Okrugin, B.; Darinskii, A. Mathematical simulation of lysine dendrimers. Temperature dependencies. Polym. Sci. Ser. C 2013, 55, 154–161. [Google Scholar] [CrossRef]
- Falkovich, S.; Markelov, D.; Neelov, I.; Darinskii, A. Are structural properties of dendrimers sensitive to the symmetry of branching? Computer simulation of lysine dendrimers. J. Chem. Phys. 2013, 139, 064903. [Google Scholar] [CrossRef] [PubMed]
- Markelov, D.A.; Falkovich, S.G.; Neelov, I.M.; Ilyash, M.Y.; Matveev, V.V.; Lahderanta, E.; Ingman, P.; Darinskii, A.A. Molecular dynamics simulation of spin–lattice NMR relaxation in poly-l-lysine dendrimers: Manifestation of the semiflexibility effect. Phys. Chem. Chem. Phys. 2015, 17, 3214–3226. [Google Scholar] [CrossRef]
- Rao, C.; Tam, J. Synthesis of peptide dendrimer. J. Am. Chem. Soc. 1994, 116, 6975–6976. [Google Scholar] [CrossRef]
- Tam, J. Synthetic peptide vaccine design: Synthesis and properties of a high-density multiple antigenic peptide system. Proc. Natl. Acad. Sci. USA 1988, 85, 5409–5413. [Google Scholar] [CrossRef]
- Vlasov, G.; Korol’kov, V.; Pankova, G.; Tarasenko, I.; Baranov, A.; Glazkov, P.; Kiselev, A.; Ostapenko, O.; Lesin, E.; Baranov, V. Lysine Dendrimers and Their Starburst Polymer Derivatives: Possible Application for DNA Compaction and in vitro Delivery of Genetic Constructs. Russ. J. Bioorg. Chem. 2004, 30, 15–24. [Google Scholar] [CrossRef] [PubMed]
- Maillard, N.; Clouet, A.; Darbre, T.; Reymond, J.L. Combinatorial libraries of peptide dendrimers: Design, synthesis, on-bead high-throughput screening, bead decoding and characterization. Nat. Protoc. 2009, 4, 132–142. [Google Scholar] [CrossRef] [PubMed]
- Luo, K.; Li, C.; Wang, G.; Nie, Y.; He, B.; Wu, Y.; Gu, Z. Peptide dendrimers as efficient and biocompatible gene delivery vectors: Synthesis and in vitro characterization. J. Control. Release 2011, 155, 77–87. [Google Scholar] [CrossRef]
- Kwok, A.; Eggimann, G.A.; Reymond, J.L.; Darbre, T.; Hollfelder, F. Peptide dendrimer/lipid hybrid systems are efficient DNA transfection reagents: Structure–activity relationships highlight the role of charge distribution across dendrimer generations. ACS Nano 2013, 7, 4668–4682. [Google Scholar] [CrossRef]
- Filipe, L.C.S.; Machuqueiro, M.; Darbre, T.; Baptista, A.M. Exploring the Structural Properties of Positively Charged Peptide Dendrimers. J. Phys. Chem. B 2016, 120, 11323–11330. [Google Scholar] [CrossRef]
- Rewatkar, P.V.; Sester, D.P.; Parekh, H.S.; Parat, M.O. Express in Vitro Plasmid Transfection Achieved with 16+ Asymmetric Peptide Dendrimers. ACS Biomater. Sci. Eng. 2016, 2, 438–445. [Google Scholar] [CrossRef]
- Heitz, M.; Zamolo, S.; Javor, S.; Reymond, J.L. Fluorescent Peptide Dendrimers for siRNA Transfection: Tracking pH Responsive Aggregation, siRNA Binding and Cell Penetration. Bioconjug. Chem. 2020, 31, 1671–1684. [Google Scholar] [CrossRef] [PubMed]
- Santos, S.; Gonzaga, R.; Silva, J.; Savino, D.; Prieto, D.; Shikay, J.; Silva, R.; Paulo, L.; Ferreira, E.; Giarolla, J. Peptide dendrimers: Drug/gene delivery and other approaches. Can. J. Chem. 2017, 95, 907–916. [Google Scholar] [CrossRef]
- Sheveleva, N.N.; Markelov, D.A.; Vovk, M.A.; Mikhailova, M.E.; Tarasenko, I.I.; Neelov, I.M.; Lahderanta, E. NMR studies of excluded volume interactions in peptide dendrimers. Sci. Rep. 2018, 8, 1–7. [Google Scholar] [CrossRef] [PubMed]
- Sheveleva, N.N.; Markelov, D.A.; Vovk, M.A.; Mikhailova, M.E.; Tarasenko, I.I.; Tolstoy, P.M.; Neelov, I.M.; Lähderanta, E. Lysine-based dendrimer with double arginine residues. RSC Adv. 2019, 9, 18018–18026. [Google Scholar] [CrossRef]
- Sheveleva, N.N.; Markelov, D.A.; Vovk, M.A.; Tarasenko, I.I.; Mikhailova, M.E.; Ilyash, M.Y.; Neelov, I.M.; Lahderanta, E. Stable Deuterium Labeling of Histidine-Rich Lysine-Based Dendrimers. Molecules 2019, 24, 2481. [Google Scholar] [CrossRef] [PubMed]
- Gorzkiewicz, M.; Konopka, M.; Janaszewska, A.; Tarasenko, I.I.; Sheveleva, N.N.; Gajek, A.; Neelov, I.M.; Klajnert-Maculewicz, B. Application of new lysine-based peptide dendrimers D3K2 and D3G2 for gene delivery: Specific cytotoxicity to cancer cells and transfection in vitro. Bioorg. Chem. 2020, 95, 103504. [Google Scholar] [CrossRef] [PubMed]
- Gorzkiewicz, M.; Kopec, O.; Janaszewska, A.; Konopka, M.; Pedziwiatr-Werbicka, E.; Tarasenko, I.I.; Bezrodnyi, V.V.; Neelov, I.M.; Klajnert-Maculewicz, B. Poly(lysine) Dendrimers Form Complexes with siRNA and Provide Its Efficient Uptake by Myeloid Cells: Model Studies for Therapeutic Nucleic Acid Delivery. Int. J. Mol. Sci. 2020, 21, 3138. [Google Scholar] [CrossRef] [PubMed]
- Mikhtaniuk, S.E.; Bezrodnyi, V.V.; Shavykin, O.V.; Neelov, I.M.; Sheveleva, N.N.; Penkova, A.V.; Markelov, D.A. Comparison of Structure and Local Dynamics of Two Peptide Dendrimers with the Same Backbone but with Different Side Groups in Their Spacers. Polymers 2020, 12, 1657. [Google Scholar] [CrossRef]
- Bezrodnyi, V.V.; Shavykin, O.V.; Mikhtaniuk, S.E.; Neelov, I.M.; Sheveleva, N.N.; Markelov, D.A. Why the orientational mobility in arginine and lysine spacers of peptide dendrimers designed for gene delivery is different? Int. J. Mol. Sci. 2020, 21, 9749. [Google Scholar] [CrossRef]
- Mikhailov, I.; Darinskii, A. Does symmetry of branching affect the properties of dendrimers? Polym. Sci. Ser. A 2014, 56, 534–544. [Google Scholar] [CrossRef]
- Shavykin, O.; Neelov, I.; Darinskii, A. Is the Manifestation of the Local Dynamics in the Spin-Lattice NMR Relaxation in Dendrimers Sensitive to Excluded Volume Interactions. Phys. Chem. Chem. Phys. 2016, 18, 24307–24317. [Google Scholar] [CrossRef] [PubMed]
- Shavykin, O.; Mikhailov, I.; Darinskii, A.; Neelov, I.; Leermakers, F. Effect of an asymmetry of branching on structural characteristics of dendrimers revealed by Brownian dynamics simulations. Polymer 2018, 146, 256–266. [Google Scholar] [CrossRef]
- Okrugin, B.; Neelov, I.; Leermakers, F.M.; Borisov, O. Structure of asymmetrical peptide dendrimers: Insights given by self-consistent field theory. Polymer 2017, 125, 292–302. [Google Scholar] [CrossRef]
- Shavykin, O.V.; Leermakers, F.A.; Neelov, I.M.; Darinskii, A.A. Self-Assembly of Lysine-Based Dendritic Surfactants Modeled by the Self-Consistent Field Approach. Langmuir 2018, 34, 1613–1626. [Google Scholar] [CrossRef] [PubMed]
- Shavykin, O.; Neelov, I.; Borisov, O.; Darinskii, A.; Leermakers, F. SCF Theory of Uniformly Charged Dendrimers: Impact of Asymmetry of Branching, Generation Number, and Salt Concentration. Macromolecules 2020, 53, 7298–7311. [Google Scholar] [CrossRef]
- Okuda, T.; Sugiyama, A.; Niidome, T.; Aoyagi, H. Characters of dendritic poly(L-lysine) analogues with the terminal lysines replaced with arginines and histidines as gene carriers in vitro. Biomaterials 2004, 25, 537–544. [Google Scholar] [CrossRef]
- Lee, H.; Choi, J.S. Larson R.G. Molecular Dynamics Studies of the Size and Internal Structure of the PAMAM Dendrimer Grafted with Arginine and Histidine. Macromolecules 2011, 44, 8681–8686. [Google Scholar] [CrossRef]
- Sheikhi Mehrabadi, F.; Zeng, H.; Johnson, M.; Schlesener, C.; Guan, Z.; Haag, R. Multivalent dendritic polyglycerolamine with arginine and histidine end groups for efficient siRNA transfection. Beilstein J. Org. Chem. 2015, 11, 763–772. [Google Scholar] [CrossRef]
- Vondrášek, J.; Mason, P.E.; Heyda, J.; Collins, K.D.; Jungwirth, P. The Molecular Origin of Like-Charge Arginine-Arginine Pairing in Water. J. Phys. Chem. B 2009, 113, 9041–9045. [Google Scholar] [CrossRef]
- Lee, D.; Lee, J.; Seok, C. What stabilizes close arginine pairing in proteins? Phys. Chem. Chem. Phys. 2013, 15, 5844–5853. [Google Scholar] [CrossRef]
- Tomalia, D.A.; Nixon, L.S.; Hedstrand, D.M. The Role of Branch Cell Symmetry and Other Critical Nanoscale Design Parameters in the Determination of Dendrimer Encapsulation Properties. Biomolecules 2020, 10, 642. [Google Scholar] [CrossRef]
- Abraham, M.J.; Murtola, T.; Schulz, R.; Pall, S.; Smith, J.C.; Hess, B.; Lindahl, E. GROMACS: High performance molecular simulations through multi-level parallelism from laptops to supercomputers. SoftwareX 2015, 1–2, 19–25. [Google Scholar] [CrossRef]
- Lindorff-Larsen, K.; Piana, S.; Palmo, K.; Maragakis, P.; Klepeis, J.L.; Dror, R.O.; Shaw, D.E. Improved side-chain torsion potentials for the Amber ff99SB protein force field. Proteins 2010, 78, 1950–1958. [Google Scholar] [CrossRef] [PubMed]
- Evans, D.; Holian, B.L. The Nose-Hoover thermostat. J. Chem. Phys. 1985, 83, 4069. [Google Scholar] [CrossRef]
- Parrinello, M.; Rahman, A. Polymorphic transitions in single crystals: A new molecular dynamics method. J. Appl. Phys. 1982, 52, 7182. [Google Scholar] [CrossRef]
- Kell, G.S. Isothermal Compressibility of liquid Water at 1 Atm. J. Chem. Eng. Data 1970, 15, 119–122. [Google Scholar] [CrossRef]
- Darinskii, A.; Gotlib, Y.; Lyulin, A.; Neyelov, L. Computer simulation of local dynamics of a polymer chain in the orienting field of the LC type. Vysokomol. Soedin. Ser. A 1991, 33, 1211–1220. [Google Scholar] [CrossRef]
- Ennari, J.; Elomaa, M.; Neelov, I.; Sundholm, F. Modeling of water-free and water containing solid polyelectrolytes. Polymer 2000, 41, 985–990. [Google Scholar] [CrossRef]
- Ennari, J.; Neelov, I.; Sundholm, F. Molecular dynamics simulation of the PEO sulfonic acid anion in water. Comput. Theor. Polym. Sci. 2000, 10, 403–410. [Google Scholar] [CrossRef]
- Ennari, J.; Neelov, I.; Sundholm, F. Simulation of a PEO based solid polyelectrolyte, comparison of the CMM and the Ewald summation method. Polymer 2000, 41, 2149–2155. [Google Scholar] [CrossRef]
- Darinskii, A.; Gotlib, Y.; Lukyanov, M.; Lyulin, A.; Neelov, I. Computer simulation of the molecular motion in LC and oriented polymers. Prog. Colloid Polym. Sci. 1993, 91, 13–15. [Google Scholar]
- Gowdy, J.; Batchelor, M.; Neelov, I.; Paci, E. Nonexponential kinetics of loop formation in proteins and peptides: A signature of rugged free energy landscapes? J. Phys. Chem. B 2017, 121, 9518–9525. [Google Scholar] [CrossRef]
- Neelov, I.; Adolf, D.; McLeish, T.; Paci, E. Molecular dynamics simulation of dextran extension by constant force in single molecule AFM. Biophys. J. 2006, 91, 3579–3588. [Google Scholar] [CrossRef]
- Neelov, I.M.; Binder, K. Brownian dynamics of grafted polymer chains: Time-dependent properties. Macromol. Theory Simul. 1995, 4, 1063–1084. [Google Scholar] [CrossRef]
- Neelov, I.; Adolf, D. Brownian dynamics simulations of dendrimers under elongational flow: Bead-rod model with hydrodynamic interactions. Macromolecules 2003, 36, 6914–6924. [Google Scholar] [CrossRef]
- Neelov, I.; Adolf, D. Brownian dynamics simulation of hyperbranched polymers under elongational flow. Phys. Chem. B 2004, 108, 7627–7636. [Google Scholar] [CrossRef]
- Klos, J.; Sommer, J. Properties of Dendrimers with Flexible Spacer-Chains: A Monte Carlo Study. Macromolecules 2009, 42, 4878–4886. [Google Scholar] [CrossRef]
- Theodorou, D.N.; Suter, U.W. Shape of unperturbed linear polymers: Polypropylene. Macromolecules 1985, 18, 1206–1214. [Google Scholar] [CrossRef]
- Rudnick, G.; Gaspari, G. The aspherity of random walks. J. Phys. A 1986, 4, L191. [Google Scholar] [CrossRef]
- Nygaard, M.; Kragelund, B.B.; Papaleo, E.; Lindorff-Larsen, K. An Efficient Method for Estimating the Hydrodynamic Radius of Disordered Protein Conformations. Biophys. J. 2017, 113, 550–557. [Google Scholar] [CrossRef]
- Kirkwood, J.G. The general theory of irreversible processes in solutions of macromolecules. J. Polym. Sci. Part B Polym. Phys. Ed. 1954, 34, 597–610. [Google Scholar] [CrossRef]
- Burchard, W. Solution Properties of Branched Macromolecules. In Advances in Polymer Science; Springer: Berlin/Heidelberg, Germany, 1999; Volume 143, pp. 113–194. [Google Scholar] [CrossRef]
- Ohshima, H. Theory of Colloid and Interfacial Electric Phenomena. Interface Science and Technology; Academic Press: Cambridge, MA, USA, 2006; Volume 12, p. 473. [Google Scholar] [CrossRef]
- Delgado, A.V.; Gonzalez-Caballero, F.; Hunter, R.J.; Koopal, L.K.; Lyklema, J. Measurement and interpretation of electrokinetic phenomena. Pure Appl. Chem. 2005, 77, 1753–1805. [Google Scholar] [CrossRef]
- Wolterink, J.K.; Leermakers, F.A.; Fleer, G.J.; Koopal, L.K.; Zhulina, E.B.; Borisov, O.V. Screening in Solutions of Star-Branched Polyelectrolytes. Macromolecules 1999, 32, 2365. [Google Scholar] [CrossRef]
- Jeffrey, G.A.; Saenger, W. (Eds.) Hydrogen Bonding in Biological Structures, 1st ed.; Springer: Berlin/Heidelberg, Germany, 1991; p. 569. [Google Scholar] [CrossRef]
- Baker, E.N. Hydrogen bonding in biological macromolecules. In International Tables for Crystallography Volume F: Crystallography Ofbiological Macromolecules; Rossmann, M.G., Arnold, E., Eds.; Springer: Dordrecht, The Netherlands, 2006; pp. 546–552. [Google Scholar] [CrossRef]
- Martinho, N.; Silva, L.; Florindo, H.; Brocchini, S.; Zloh, M.; Barata, T. Rational design of novel, fluorescent, tagged glutamic acid dendrimers with different terminal groups and in silico analysis of their properties. Int. J. Nanomed. 2017, 112, 7053–7073. [Google Scholar] [CrossRef]
- Luzar, A. Resolving the hydrogen bond dynamics conundrum. J. Chem. Phys. 2000, 113, 10663. [Google Scholar] [CrossRef]
- Balasubramanian, S.; Pal, S.; Bagchi, B. Hydrogen-Bond Dynamics near a Micellar Surface: Origin of the Universal Slow Relaxation at Complex Aqueous Interfaces. Phys. Rev. Lett. 2002, 89, 115505. [Google Scholar] [CrossRef] [PubMed]
- Van der Spoel, D.; van Maaren, P.J.; Larsson, P.; Timneanu, N. Thermodynamics of hydrogen bonding in hydrophilic and hydrophobic media. J. Phys. Chem. B 2006, 110, 4393–4398. [Google Scholar] [CrossRef] [PubMed]
- Heyda, J.; Mason, P.E.; Jungwirth, P. Attractive Interactions between Side Chains of Histidine-Histidine and Histidine-Arginine-Based Cationic Dipeptides in Water. J. Phys. Chem. B 2010, 114, 8744–8749. [Google Scholar] [CrossRef]
- Khavinson, V.; Diomede, F.; Mironova, E.; Linkova, N.; Trofimova, S.; Trubiani, O.; Caputi, S.; Sijari, B. AEDG Peptide Stimulates Gene Expression and Protein Synthesis during Neurogenesis: Posible Epigenetic Mechanism. Molecules 2020, 25, 609. [Google Scholar] [CrossRef] [PubMed]
- Khavinson, V.; Malinin, V. Gerontological Aspects of Genome Peptide Regulation; Karger AG: Basel, Switzerland, 2005; p. 104. [Google Scholar] [CrossRef]
- Sadovnichy, V.; Tikhonravov, A.; Voevodin, V.; Opanasenko, V. Contemporary High Performance Computing: From Petascale toward Exascale; CRC Press: Boca Raton, FL, USA, 2013; pp. 283–307. [Google Scholar] [CrossRef]


| Dendrimer | M (g/mol) | (e) | (e) | (e) | (nm) | |||
|---|---|---|---|---|---|---|---|---|
| Lys-2His | 5918.02 | +16 | 16 | +16 | 28 | 0 | 13,293 | 7.5 |
| Lys-2Hisp | 5946.24 | +44 | 16 | +16 | 28 | +28 | 13,256 | 7.5 |
| Dendrimer | |||||||
|---|---|---|---|---|---|---|---|
| Lys-2His | 1.32 | 1.22 | 0.93 | 1.74 | 2.00 | 2.53 | 0.01 |
| Lys-2Hisp | 2.05 | 1.65 | 0.73 | 2.64 | 2.78 | 3.17 | 0.02 |
| Dendrimer | (e) | (e/nm) | (mV) | |||
|---|---|---|---|---|---|---|
| Lys-2His | 0.67 | 6.02 | 9.31 | 0.58 | 0.03 | 17.57 |
| Lys-2Hisp | 3.38 | 27.69 | 12.93 | 0.29 | 0.03 | 11.17 |
| Dendrimer | (ps) | (ps) | ||||
|---|---|---|---|---|---|---|
| Lys-2His | 14.86 | 143.8 | 98.8 | 3.53 | 186.6 | 59.88 |
| Lys-2Hisp | 1.33 | 149.3 | 96.3 | 3.44 | 95.56 | 51.08 |
| Lys-2His | Lys-2Hisp | Lys-2Arg | |
|---|---|---|---|
| neighbour | 1.36 | 0.53 | 0.19 |
| non-neighbour | 15.04 | 1.59 | 3.7 |
| neighbour | 159.3 | 42.8 | 17.95 |
| non-neighbour | 104.2 | 33.06 | 33.58 |
| Lys-2His | Lys-2Hisp | |||
|---|---|---|---|---|
| s = 1.5 | s = 2 | s = 1.5 | s = 2 | |
| 1.22 | 1.22 | 1.57 | 1.57 | |
| 1.46 | 1.47 | 1.63 | 1.63 | |
| 8.98 | 9.29 | 15.64 | 15.70 | |
Publisher’s Note: MDPI stays neutral with regard to jurisdictional claims in published maps and institutional affiliations. |
© 2021 by the authors. Licensee MDPI, Basel, Switzerland. This article is an open access article distributed under the terms and conditions of the Creative Commons Attribution (CC BY) license (https://creativecommons.org/licenses/by/4.0/).
Share and Cite
Bezrodnyi, V.V.; Mikhtaniuk, S.E.; Shavykin, O.V.; Neelov, I.M.; Sheveleva, N.N.; Markelov, D.A. Size and Structure of Empty and Filled Nanocontainer Based on Peptide Dendrimer with Histidine Spacers at Different pH. Molecules 2021, 26, 6552. https://doi.org/10.3390/molecules26216552
Bezrodnyi VV, Mikhtaniuk SE, Shavykin OV, Neelov IM, Sheveleva NN, Markelov DA. Size and Structure of Empty and Filled Nanocontainer Based on Peptide Dendrimer with Histidine Spacers at Different pH. Molecules. 2021; 26(21):6552. https://doi.org/10.3390/molecules26216552
Chicago/Turabian StyleBezrodnyi, Valeriy V., Sofia E. Mikhtaniuk, Oleg V. Shavykin, Igor M. Neelov, Nadezhda N. Sheveleva, and Denis A. Markelov. 2021. "Size and Structure of Empty and Filled Nanocontainer Based on Peptide Dendrimer with Histidine Spacers at Different pH" Molecules 26, no. 21: 6552. https://doi.org/10.3390/molecules26216552
APA StyleBezrodnyi, V. V., Mikhtaniuk, S. E., Shavykin, O. V., Neelov, I. M., Sheveleva, N. N., & Markelov, D. A. (2021). Size and Structure of Empty and Filled Nanocontainer Based on Peptide Dendrimer with Histidine Spacers at Different pH. Molecules, 26(21), 6552. https://doi.org/10.3390/molecules26216552