
High-Throughput Analysis of Amino Acids for Protein Quantification in Plant and Animal-Derived Samples Using High Resolution Mass Spectrometry


Abstract
:
1. Introduction
2. Results and Discussion
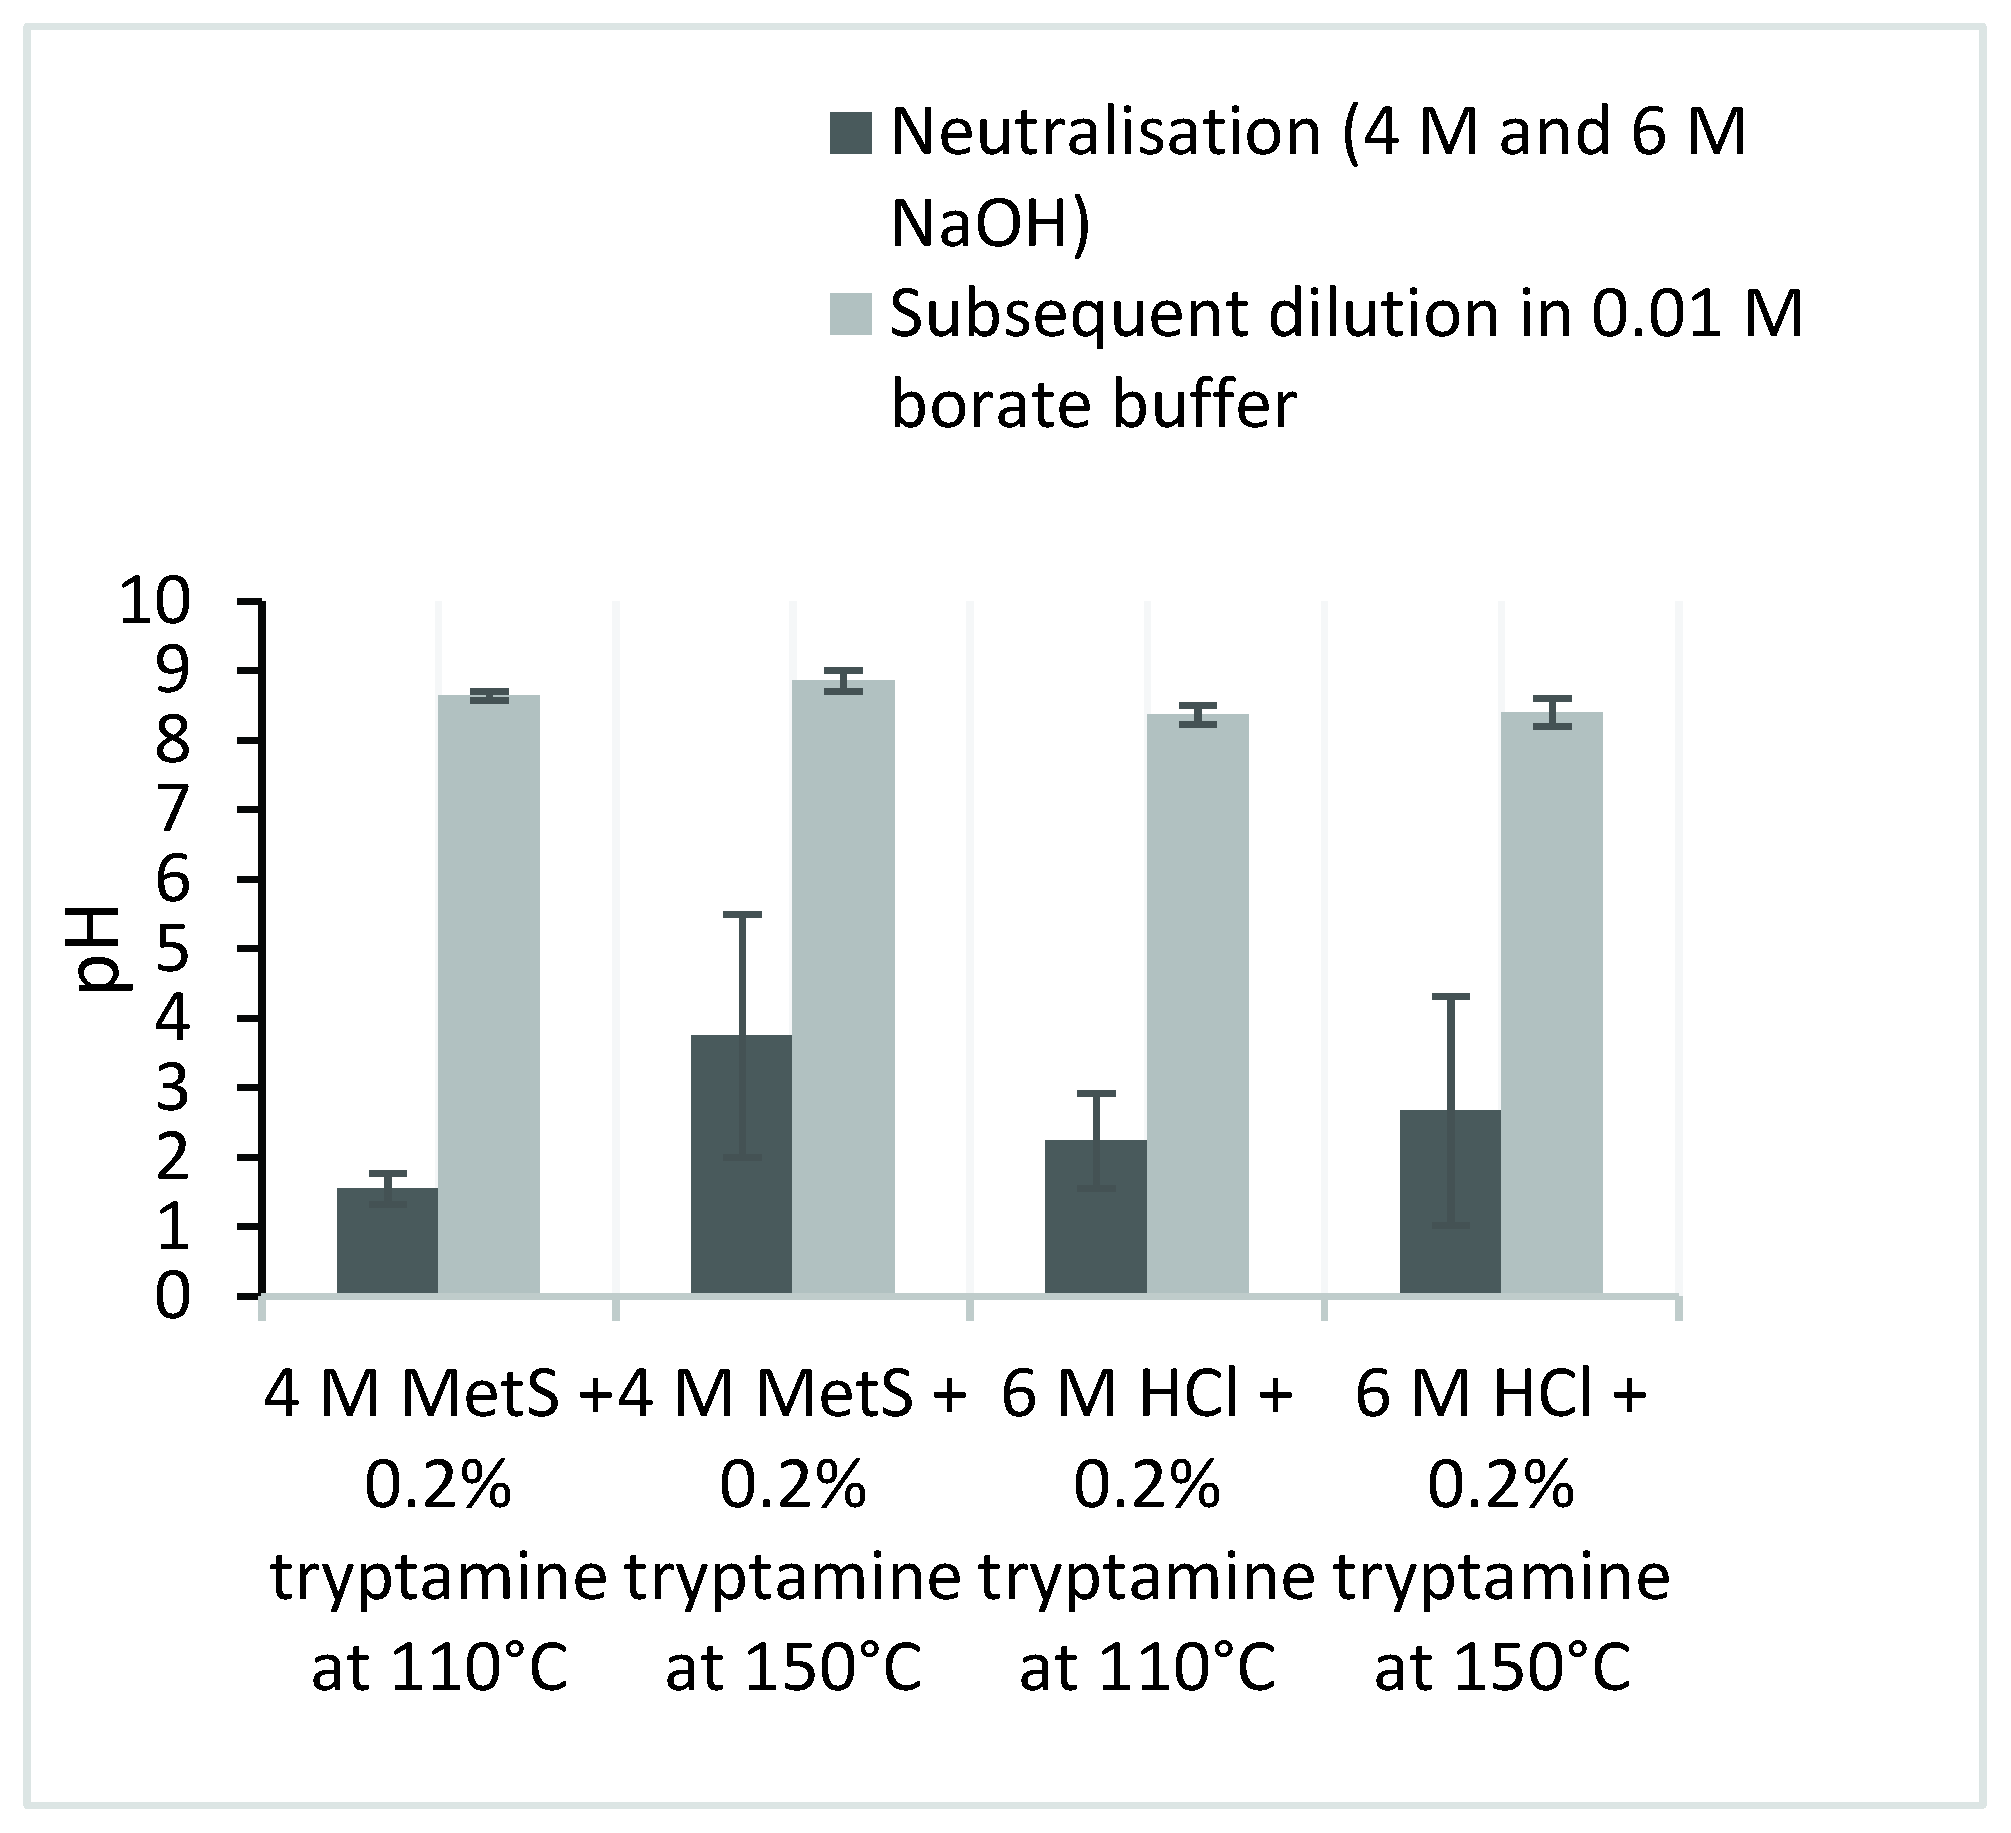
2.1. Protein Hydrolysis
2.2. Method Validation
3. Materials and Methods
3.1. Samples
3.2. Standards
3.3. Sample Preparation
3.4. Amino Acid Quantitation Pre-Hydrolysis
3.5. Lentil Hydrolysis
3.6. Liquid Chromatography–Mass Spectrometry (LC–MS) Analysis
4. Conclusions
Supplementary Materials
Author Contributions
Funding
Institutional Review Board Statement
Informed Consent Statement
Data Availability Statement
Acknowledgments
Conflicts of Interest
Sample Availability
References
- Noble, J.E.; Bailey, M.J.A. Methods in Enzymology; Chapter 8; Academic Press: San Diego, CA, USA, 2009; Volume 463, pp. 73–95. [Google Scholar]
- Lowry, O.H.; Rosebrough, N.J.; Farr, A.L.; Randall, R.J. Protein measurement with the Folin phenol reagent. J. Biol. Chem. 1951, 193, 265–275. [Google Scholar] [CrossRef]
- Smith, P.K.; Krohn, R.I.; Hermanson, G.T.; Mallia, A.K.; Gartner, F.H.; Provenzano, M.D.; Fujimoto, E.K.; Goeke, N.M.; Olson, B.J.; Klenk, D.C. Measurement of protein using bicinchoninic acid. Anal. Biochem. 1985, 150, 76–85. [Google Scholar] [CrossRef]
- Burkitt, W.I.; Pritchard, C.; Arsene, C.; Henrion, A.; Bunk, D.; O’Connor, G. Toward Système International d′Unité-traceable protein quantification: From amino acids to proteins. Anal. Biochem. 2008, 376, 242–251. [Google Scholar] [CrossRef] [PubMed]
- Dahl-Lassen, R.; van Hecke, J.; Jørgensen, H.; Bukh, C.; Andersen, B.; Schjoerring, J.K. High-throughput analysis of amino acids in plant materials by single quadrupole mass spectrometry. Plant Methods 2018, 14. [Google Scholar] [CrossRef] [PubMed] [Green Version]
- Boughton, B.A.; Callahan, D.L.; Silva, C.; Bowne, J.; Nahid, A.; Rupasinghe, T.; Tull, D.L.; McConville, M.J.; Bacic, A.; Roessner, U. Comprehensive profiling and quantitation of amine group containing metabolites. Anal. Chem. 2011, 83, 7523–7530. [Google Scholar] [CrossRef]
- Mason, V.C.; Bech-Andersen, S.; Rudemo, M. Hydrolysate preparation for amino acid determinations in feed constituents. Stability of bound amino acids to oxidation with performic acid/hydrogen peroxide reagents. Z. Tierphysiol. Tierernähr. Futterm. 1978, 41, 226–235. [Google Scholar] [CrossRef]
- Kambhampati, S.; Li, J.; Evans, B.S.; Allen, D.K. Accurate and efficient amino acid analysis for protein quantification using hydrophilic interaction chromatography coupled tandem mass spectrometry. Plant Methods 2019, 15, 46. [Google Scholar] [CrossRef] [PubMed] [Green Version]
- Ng, L.T.; Pascaud, A.; Pascaud, M. Hydrochloric acid hydrolysis of proteins and determination of tryptophan by reversed-phase high-performance liquid chromatography. Anal. Biochem. 1987, 167, 47–52. [Google Scholar] [CrossRef]
- Puchała, R.; Piór, H.; von Keyserlingk, M.; Shelford, J.A.; Barej, W. Determination of methionine sulfoxide in biological materials using HPLC and its degradability in the rumen of cattle. Anim. Feed Sci. Technol. 1994, 48, 121–130. [Google Scholar] [CrossRef]
- Liu, Z.; Rochfort, S. A fast liquid chromatography–mass spectrometry (LC–MS) method for quantification of major polar metabolites in plants. J. Chromatogr. B Anal. Technol. Biomed. Life Sci. 2013, 912, 8–15. [Google Scholar] [CrossRef] [PubMed]
- Reddy, P.; Rochfort, S.; Read, E.; Deseo, M.; Jaehne, E.; Van Den Buuse, M.; Guthridge, K.; Combs, M.; Spangenberg, G.; Quinn, J. Tremorgenic effects and functional metabolomics analysis of lolitrem B and its biosynthetic intermediates. Sci. Rep. 2019, 9, 9364. [Google Scholar] [CrossRef] [PubMed]

| Column | 4 M MetS + 0.2% Tryptamine at 110 °C | 4 M MetS + 0.2% Tryptamine at 150 °C | 6 M HCl + 0.2% Tryptamine at 110 °C | 6 M HCl + 0.2% Tryptamine at 150 °C | ||||||||
|---|---|---|---|---|---|---|---|---|---|---|---|---|
| Lentil QC 1 (n = 5) | 100.00 | ± | 1.32 | 91.52 | ± | 2.59 | 74.79 | ± | 5.31 | 62.53 | ± | 4.14 |
| Lentil QC 2 (n = 5) | 101.55 | ± | 0.62 | 96.74 | ± | 2.01 | 94.63 | ± | 0.89 | 91.12 | ± | 0.58 |
| BSA (n = 2) | 100.00 | ± | 0.27 | 98.74 | ± | 3.04 | 84.66 | ± | 9.04 | 81.09 | ± | 26.30 |
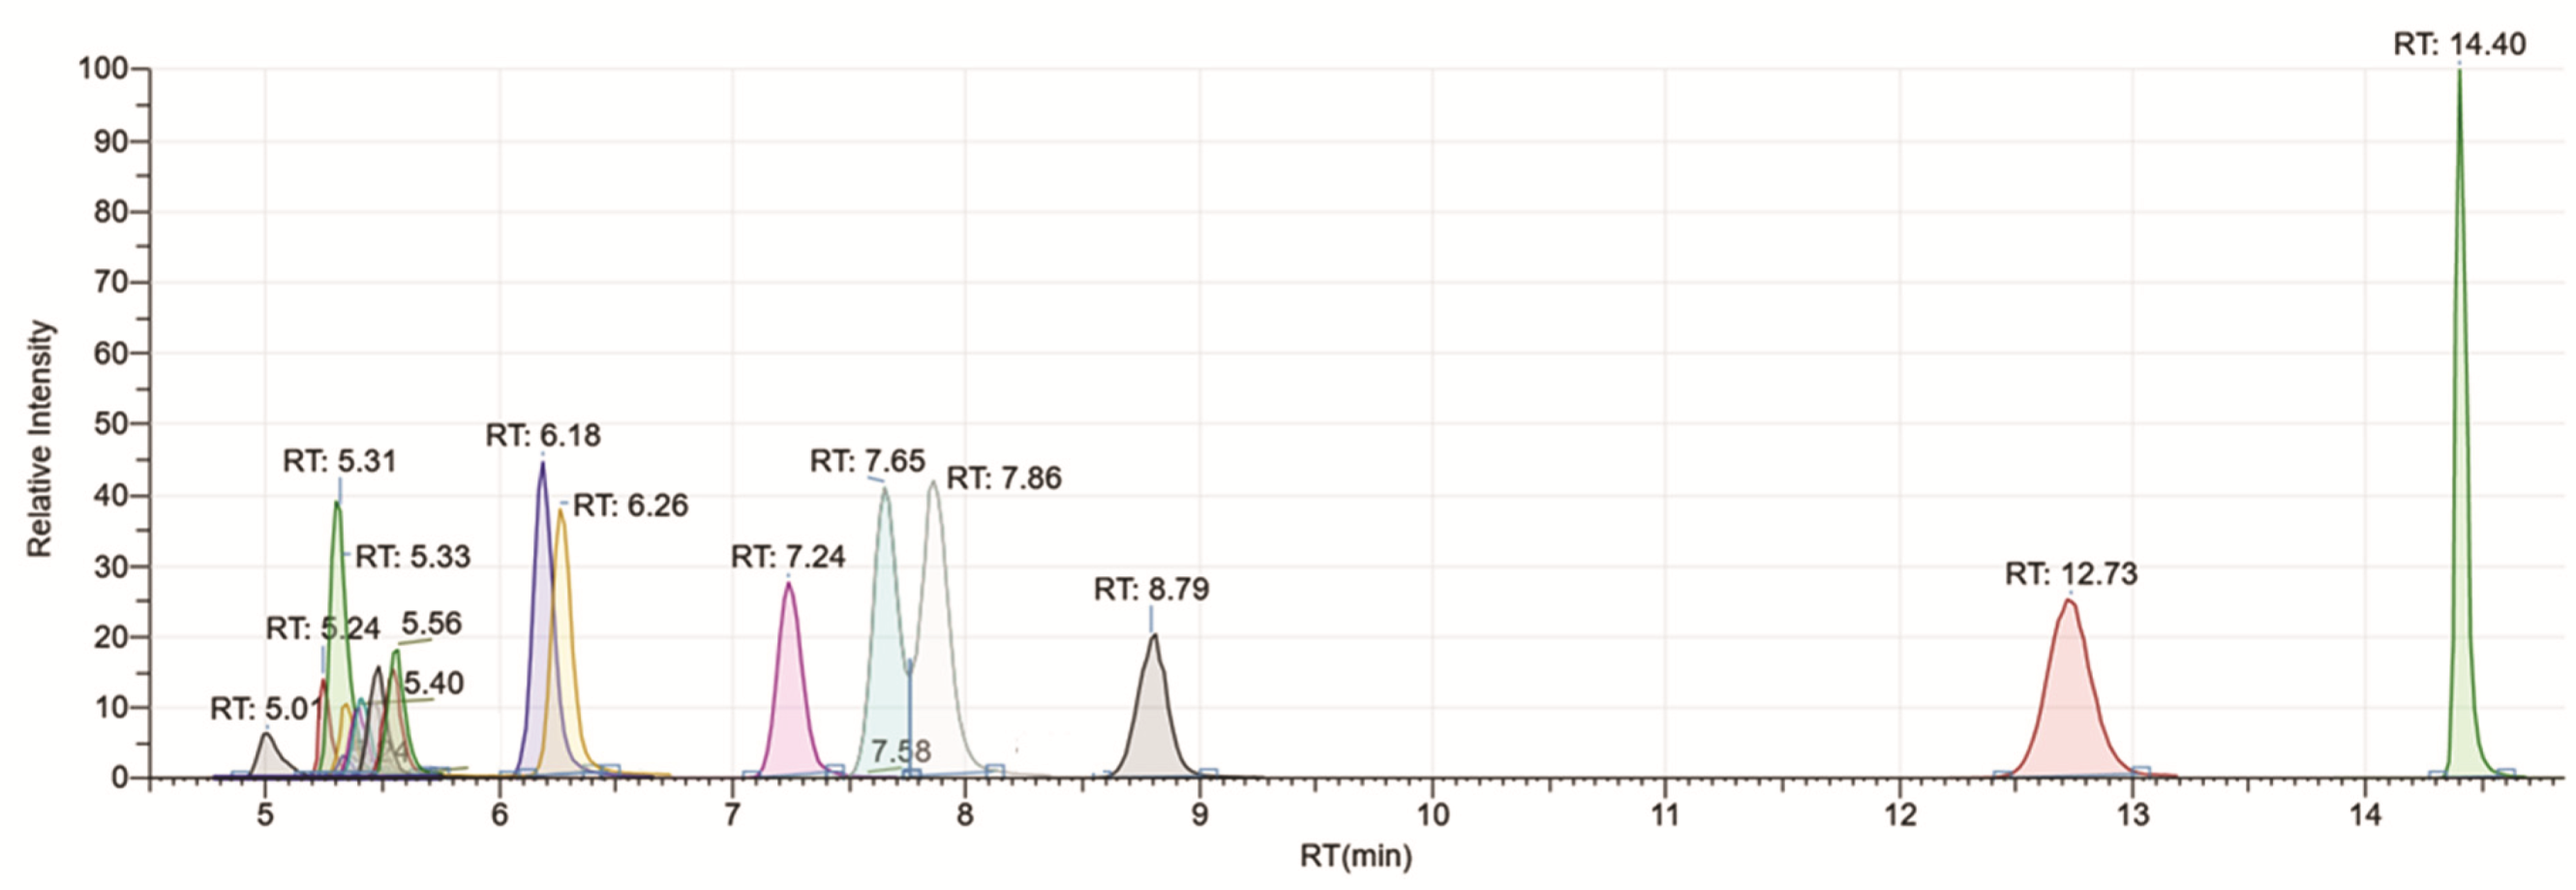
| Compounds | Ions Quantified | Ion Extraction Window (m/z) | RT (min) | Linearity (ppm) | LOD (µg /mL) | R2 |
|---|---|---|---|---|---|---|
| Lysine | [M + H]+ | 147.11–147.12 | 5.01 | 0.01–10.0 | 0.001 | 0.9998 |
| Histidine | [M + H]+ | 156.07–156.08 | 5.24 | 0.05–10.0 | 0.001 | 0.9986 |
| Cystine * | [M + H]+ | 241.02–241.04 | 5.26 | 0.1–10.0 | 0.01 | 0.9995 |
| Arginine | [M + H]+ | 175.11–175.12 | 5.29 | 0.1–10.0 | 0.001 | 0.9995 |
| Glycine | [M + H]+ | 76.03–76.05 | 5.32 | 0.25–10.0 | 0.1 | 0.9997 |
| Serine | [M + H]+ | 106.05–106.06 | 5.33 | 0.1–10.0 | 0.001 | 0.9995 |
| Aspartic acid | [M + H]+ | 134.04–134.05 | 5.38 | 0.1–10.0 | 0.001 | 0.9956 |
| Asparagine | [M + H]+ | 133.06–133.07 | 5.40 | 0.1–10.0 | 0.01 | 0.9998 |
| Alanine | [M + H]+ | 90.05–90.06 | 5.45 | 0.1–10.0 | 0.001 | 0.9997 |
| Threonine | [M + H]+ | 120.06–120.07 | 5.47 | 0.05–5.0 | 0.001 | 0.9991 |
| Glutamic acid | [M + H]+ | 148.06–148.07 | 5.53 | 0.05–5.0 | 0.1 | 0.9991 |
| Glutamine | [M + H]+ | 147.07–147.08 | 5.52 | 0.1–10.0 | 0.1 | 0.9996 |
| Proline | [M + H]+ | 116.07–116.08 | 6.16 | 0.01–10.0 | 0.001 | 0.9980 |
| Valine | [M + H]+ | 118.08–118.09 | 6.25 | 0.01–10.0 | 0.001 | 0.9972 |
| Methionine | [M + H]+ | 150.05–150.06 | 7.22 | 0.001–10.0 | <0.001 | 0.9995 |
| Isoleucine | [M + H]+ | 132.10–132.11 | 7.66 | 0.01–10.0 | 0.001 | 0.9986 |
| Leucine | [M + H]+ | 132.10–132.11 | 7.87 | 0.1–10.0 | 0.001 | 0.9982 |
| Tyrosine | [M + H]+ | 182.08–182.09 | 8.79 | 0.01–10.0 | 0.001 | 1.0000 |
| Phenylalanine | [M + H]+ | 166.09–166.09 | 12.71 | 0.01–10.0 | 0.001 | 1.0000 |
| Tryptophan | [M + H]+ | 205.09–205.10 | 14.35 | 0.01–10.0 | 0.01 | 0.9998 |
| Sample | Hydrolysis 1 (Week 1) | Hydrolysis 2 (Week 2) | Hydrolysis 3 (Week 3) | Hydrolysis 4 (Week 4) | ||||||
|---|---|---|---|---|---|---|---|---|---|---|
| BSA (n = 2) | Lentil (n = 2) | BSA (n = 2) | Lentil (n = 2) | BSA (n = 2) | Lentil (n = 2) | BSA (n = 2) | Lentil (n = 2) | Overall RSD: BSA | Overall RSD: Lentil | |
| Lysine | 6.0% | 0.9% | 7.9% | 2.8% | 10.5% | 1.6% | 3.4% | 0.4% | 8.7% | 12.2% |
| Histidine | 9.5% | 21.8% | 12.0% | 15.6% | 9.2% | 3.8% | 5.6% | 1.3% | 11.6% | 15.6% |
| Cystine * | 27.5% | - | 39.3% | - | 7.9% | - | - | - | 47.7% | - |
| Arginine | 0.7% | 4.3% | 2.4% | 1.0% | 2.4% | 3.2% | 5.1% | 0.4% | 6.6% | 10.3% |
| Glycine | 2.2% | 0.7% | 8.6% | 2.1% | 2.1% | 3.2% | 1.0% | 3.9% | 18.4% | 9.1% |
| Serine | 2.8% | 3.6% | 6.9% | 0.6% | 8.7% | 6.9% | 5.7% | 0.1% | 16.6% | 17.0% |
| Aspartic acid | 2.9% | 2.6% | 2.1% | 1.3% | 2.0% | 2.4% | 1.7% | 4.1% | 16.3% | 23.2% |
| Alanine | 1.9% | 1.1% | 0.4% | 4.3% | 10.1% | 1.1% | 6.3% | 5.4% | 14.7% | 14.0% |
| Threonine | 3.7% | 1.8% | 1.1% | 4.8% | 8.4% | 1.3% | 6.4% | 3.9% | 12.0% | 13.0% |
| Glutamic acid | 9.2% | 4.2% | 3.1% | 4.1% | 5.7% | 6.3% | 9.4% | 2.5% | 13.0% | 7.6% |
| Proline | 8.8% | 1.0% | 2.2% | 2.9% | 6.3% | 7.2% | 23.3% | 2.9% | 16.5% | 11.7% |
| Valine | 5.6% | 0.9% | 1.3% | 2.2% | 4.7% | 5.6% | 32.0% | 2.6% | 21.7% | 17.0% |
| Methionine | 4.8% | 0.8% | 2.1% | 1.4% | 15.4% | 4.0% | 16.6% | 3.7% | 41.5% | 55.4% |
| Isoleucine | 0.9% | 1.7% | 0.9% | 3.2% | 5.8% | 8.0% | 17.1% | 5.2% | 12.7% | 14.3% |
| Leucine | 10.2% | 0.4% | 2.3% | 1.1% | 1.2% | 1.3% | 9.7% | 6.5% | 17.2% | 23.4% |
| Tyrosine | 4.3% | 1.5% | 2.9% | 2.4% | 4.2% | 4.2% | 18.3% | 2.8% | 12.3% | 8.3% |
| Phenylalanine | 7.0% | 1.2% | 3.1% | 2.7% | 5.9% | 1.9% | 13.2% | 1.0% | 7.9% | 7.2% |
| Tryptophan | 6.4% | - | 2.3% | - | 7.3% | - | 18.4% | - | 11.3% | - |
| Total protein (mg/g) | 6.6% | 1.0% | 2.3% | 2.0% | 4.9% | 3.7% | 8.2% | 3.5% | 9.7% | 12.2% |
| Valine-d (IS ug/mL) | 4.7% | 0.4% | 1.0% | 0.5% | 1.0% | 3.4% | 15.5% | 0.3% | 14.5% | 5.0% |
| Sample | Hydrolysis 1 (Week 1) | Hydrolysis 2 (Week 2) | Hydrolysis 3 (Week 3) | Hydrolysis 4 (Week 4) | ||||||
|---|---|---|---|---|---|---|---|---|---|---|
| BSA (n = 2) | Lentil (n = 2) | BSA (n = 2) | Lentil (n = 2) | BSA (n = 2) | Lentil (n = 2) | BSA (n = 2) | Lentil (n = 2) | Overall RSD: BSA | Overall RSD: Lentil | |
| Lysine | 6.0% | 0.9% | 7.9% | 2.8% | 10.5% | 1.6% | 3.4% | 0.4% | 8.9% | 5.5% |
| Histidine | 9.5% | 21.8% | 12.0% | 15.6% | 9.2% | 3.8% | 5.6% | 1.3% | 9.1% | 13.4% |
| Cystine * | 27.5% | - | 39.3% | - | 7.9% | - | - | 0.4% | 24.9% | - |
| Arginine | 0.7% | 4.3% | 2.4% | 1.0% | 2.4% | 3.2% | 5.1% | 3.9% | 8.7% | 12.3% |
| Glycine | 2.2% | 0.7% | 8.6% | 2.1% | 2.1% | 3.2% | 1.0% | 0.1% | 7.3% | 4.9% |
| Serine | 2.8% | 3.6% | 6.9% | 0.6% | 8.7% | 6.9% | 5.6% | 3.7% | 8.9% | 10.6% |
| Aspartic acid | 2.7% | 2.3% | 2.1% | 1.3% | 2.0% | 2.4% | 1.6% | 5.4% | 8.6% | 14.9% |
| Alanine | 1.9% | 1.1% | 0.4% | 4.3% | 10.1% | 1.1% | 6.3% | 3.9% | 7.7% | 7.2% |
| Threonine | 3.7% | 1.8% | 1.1% | 4.8% | 8.4% | 1.3% | 6.4% | 1.9% | 5.1% | 6.0% |
| Glutamic acid | 7.7% | 3.3% | 2.2% | 2.3% | 4.0% | 3.3% | 7.7% | 1.7% | 8.0% | 5.5% |
| Proline | 6.6% | 0.7% | 1.4% | 1.6% | 3.7% | 3.9% | 15.2% | 1.7% | 10.7% | 7.5% |
| Valine | 3.8% | 0.6% | 0.8% | 1.3% | 2.4% | 4.1% | 15.7% | 0.3% | 9.0% | 8.8% |
| Valine-d (IS ug/mL) | 4.7% | 0.4% | 1.0% | 0.5% | 1.0% | 3.4% | 15.5% | 3.7% | 8.0% | 9.4% |
| Methionine | 4.8% | 0.8% | 2.1% | 1.4% | 15.4% | 4.0% | 16.6% | 5.2% | 34.9% | 43.8% |
| Isoleucine | 0.9% | 1.7% | 0.8% | 2.4% | 5.1% | 6.5% | 17.1% | 7.2% | 10.7% | 11.6% |
| Leucine | 4.7% | 0.3% | 2.2% | 1.0% | 1.2% | 1.3% | 7.6% | 2.8% | 7.8% | 5.5% |
| Tyrosine | 4.3% | 1.5% | 2.9% | 2.4% | 4.2% | 4.2% | 18.3% | 1.0% | 12.4% | 8.5% |
| Phenylalanine | 7.0% | 1.2% | 3.1% | 2.7% | 5.9% | 1.9% | 13.2% | 2.6% | 14.2% | 7.1% |
| Tryptophan | 6.4% | <LoQ | 2.3% | <LoQ | 7.3% | <LoQ | 18.4% | 0.4% | 11.8% | - |
| Average | 4.8% | 2.8% | 3.4% | 2.8% | 5.8% | 3.3% | 10.0% | 1.3% | 10.7% | 10.7% |
| Sample Name No. of Injections | BSA 1 (n = 2) | BSA 2 (n = 2) | BSA 3 (n = 2) | BSA 4 (n = 2) | QC 1 (n = 2) | QC 2 (n = 2) | QC 3 (n = 2) | QC 4 (n = 2) | Overall RSD (%) |
|---|---|---|---|---|---|---|---|---|---|
| Lysine | 0.0% | 0.1% | 0.1% | 0.1% | 0.1% | 0.1% | 0.0% | 0.2% | 0.2% |
| Histidine | 0.1% | 0.0% | 0.0% | 0.3% | 0.1% | 0.0% | 0.0% | 0.1% | 0.1% |
| Cystine * | 0.3% | 0.1% | 0.1% | - | - | - | - | 0.2% | 0.2% |
| Arginine | 0.0% | 0.0% | 0.1% | 0.1% | 0.1% | 0.0% | 0.0% | 0.1% | 0.1% |
| Glycine | 0.2% | 0.0% | 0.1% | 0.3% | 0.1% | 0.0% | 0.0% | 0.1% | 0.1% |
| Serine | 0.2% | 0.0% | 0.1% | 0.3% | 0.1% | 0.0% | 0.0% | 0.1% | 0.1% |
| Aspartic acid | 0.2% | 0.0% | 0.1% | 0.0% | 0.1% | 0.0% | 0.2% | 0.2% | 0.2% |
| Alanine | 0.0% | 0.0% | 0.1% | 0.2% | 0.1% | 0.0% | 0.0% | 0.1% | 0.1% |
| Threonine | 0.2% | 0.2% | 0.1% | 0.0% | 0.1% | 0.0% | 0.0% | 0.1% | 0.1% |
| Glutamic acid | 0.0% | 0.0% | 0.1% | 0.2% | 0.1% | 0.0% | 0.0% | 0.2% | 0.2% |
| Proline | 0.1% | 0.1% | 0.1% | 0.2% | 0.1% | 0.2% | 0.0% | 0.1% | 0.1% |
| Valine | 0.1% | 0.1% | 0.1% | 0.0% | 0.1% | 0.0% | 0.1% | 0.1% | 0.1% |
| Valine-d (IS ug/mL) | 0.1% | 0.1% | 0.1% | 0.0% | 0.1% | 0.0% | 0.1% | 0.1% | 0.1% |
| Methionine | 0.0% | 0.0% | 0.0% | 0.1% | 0.0% | 0.1% | 0.0% | 0.2% | 0.2% |
| Isoleucine | 0.0% | 0.1% | 0.0% | 0.2% | 0.2% | 0.1% | 0.1% | 0.1% | 0.1% |
| Leucine | 0.0% | 0.1% | 0.2% | 0.3% | 0.0% | 0.2% | 0.1% | 0.2% | 0.2% |
| Tyrosine | 0.1% | 0.1% | 0.6% | 0.1% | 0.0% | 0.1% | 0.0% | 0.7% | 0.7% |
| Phenylalanine | 0.1% | 0.3% | 0.2% | 0.3% | 0.4% | 0.4% | 0.0% | 0.4% | 0.4% |
| Tryptophan | 0.1% | 0.0% | 0.0% | 0.0% | 0.0% | 0.1% | 0.2% | 0.2% | 0.2% |
Publisher’s Note: MDPI stays neutral with regard to jurisdictional claims in published maps and institutional affiliations. |
© 2021 by the authors. Licensee MDPI, Basel, Switzerland. This article is an open access article distributed under the terms and conditions of the Creative Commons Attribution (CC BY) license (https://creativecommons.org/licenses/by/4.0/).
Share and Cite
Reddy, P.; Elkins, A.; Panozzo, J.; Rochfort, S.J. High-Throughput Analysis of Amino Acids for Protein Quantification in Plant and Animal-Derived Samples Using High Resolution Mass Spectrometry. Molecules 2021, 26, 7578. https://doi.org/10.3390/molecules26247578
Reddy P, Elkins A, Panozzo J, Rochfort SJ. High-Throughput Analysis of Amino Acids for Protein Quantification in Plant and Animal-Derived Samples Using High Resolution Mass Spectrometry. Molecules. 2021; 26(24):7578. https://doi.org/10.3390/molecules26247578
Chicago/Turabian StyleReddy, Priyanka, Aaron Elkins, Joe Panozzo, and Simone J. Rochfort. 2021. "High-Throughput Analysis of Amino Acids for Protein Quantification in Plant and Animal-Derived Samples Using High Resolution Mass Spectrometry" Molecules 26, no. 24: 7578. https://doi.org/10.3390/molecules26247578
APA StyleReddy, P., Elkins, A., Panozzo, J., & Rochfort, S. J. (2021). High-Throughput Analysis of Amino Acids for Protein Quantification in Plant and Animal-Derived Samples Using High Resolution Mass Spectrometry. Molecules, 26(24), 7578. https://doi.org/10.3390/molecules26247578