
Pharmacokinetic Characterization of LW6, a Novel Hypoxia-Inducible Factor-1α (HIF-1α) Inhibitor in Mice

 ,
,
Abstract
:1. Introduction
2. Results
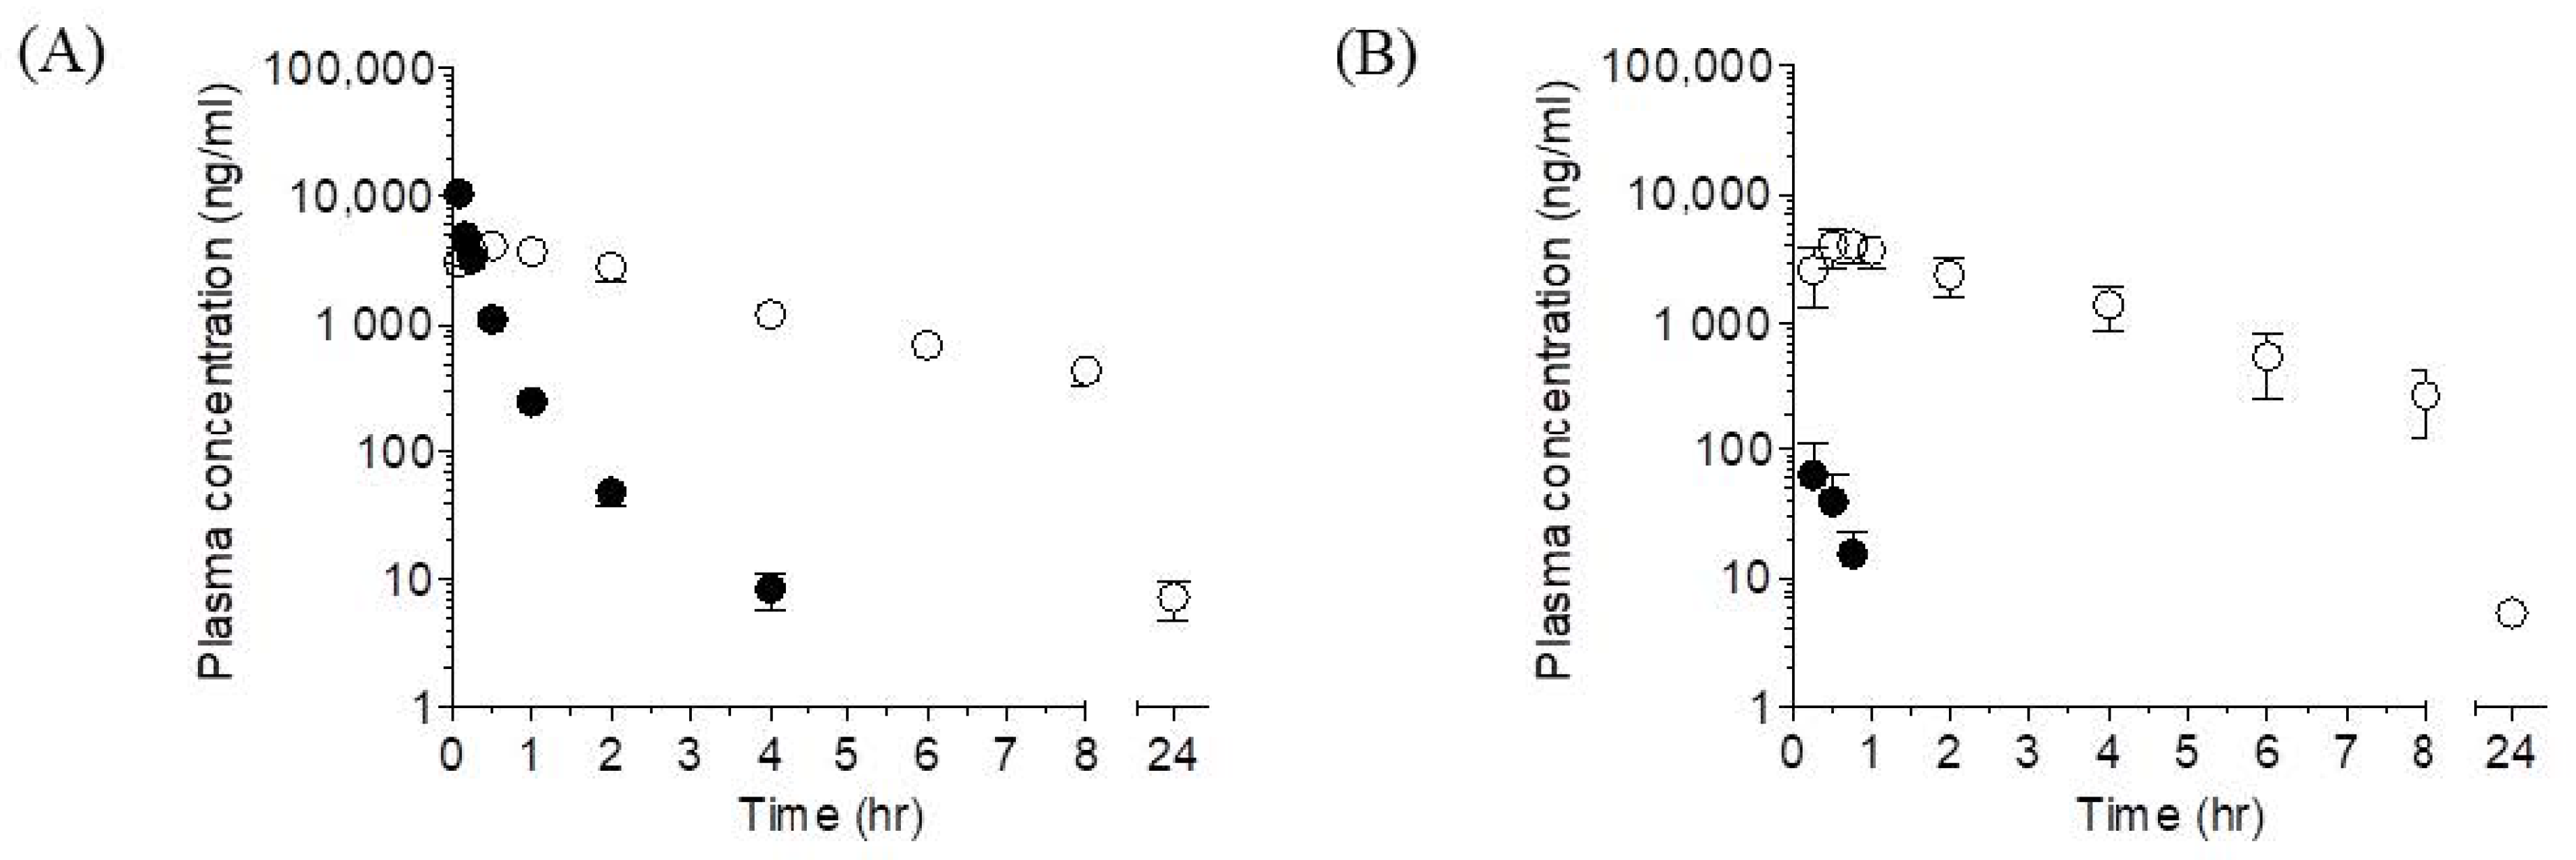
2.1. Plasma Pharmacokinetics of LW6 and Its Metabolite, APA in Mice
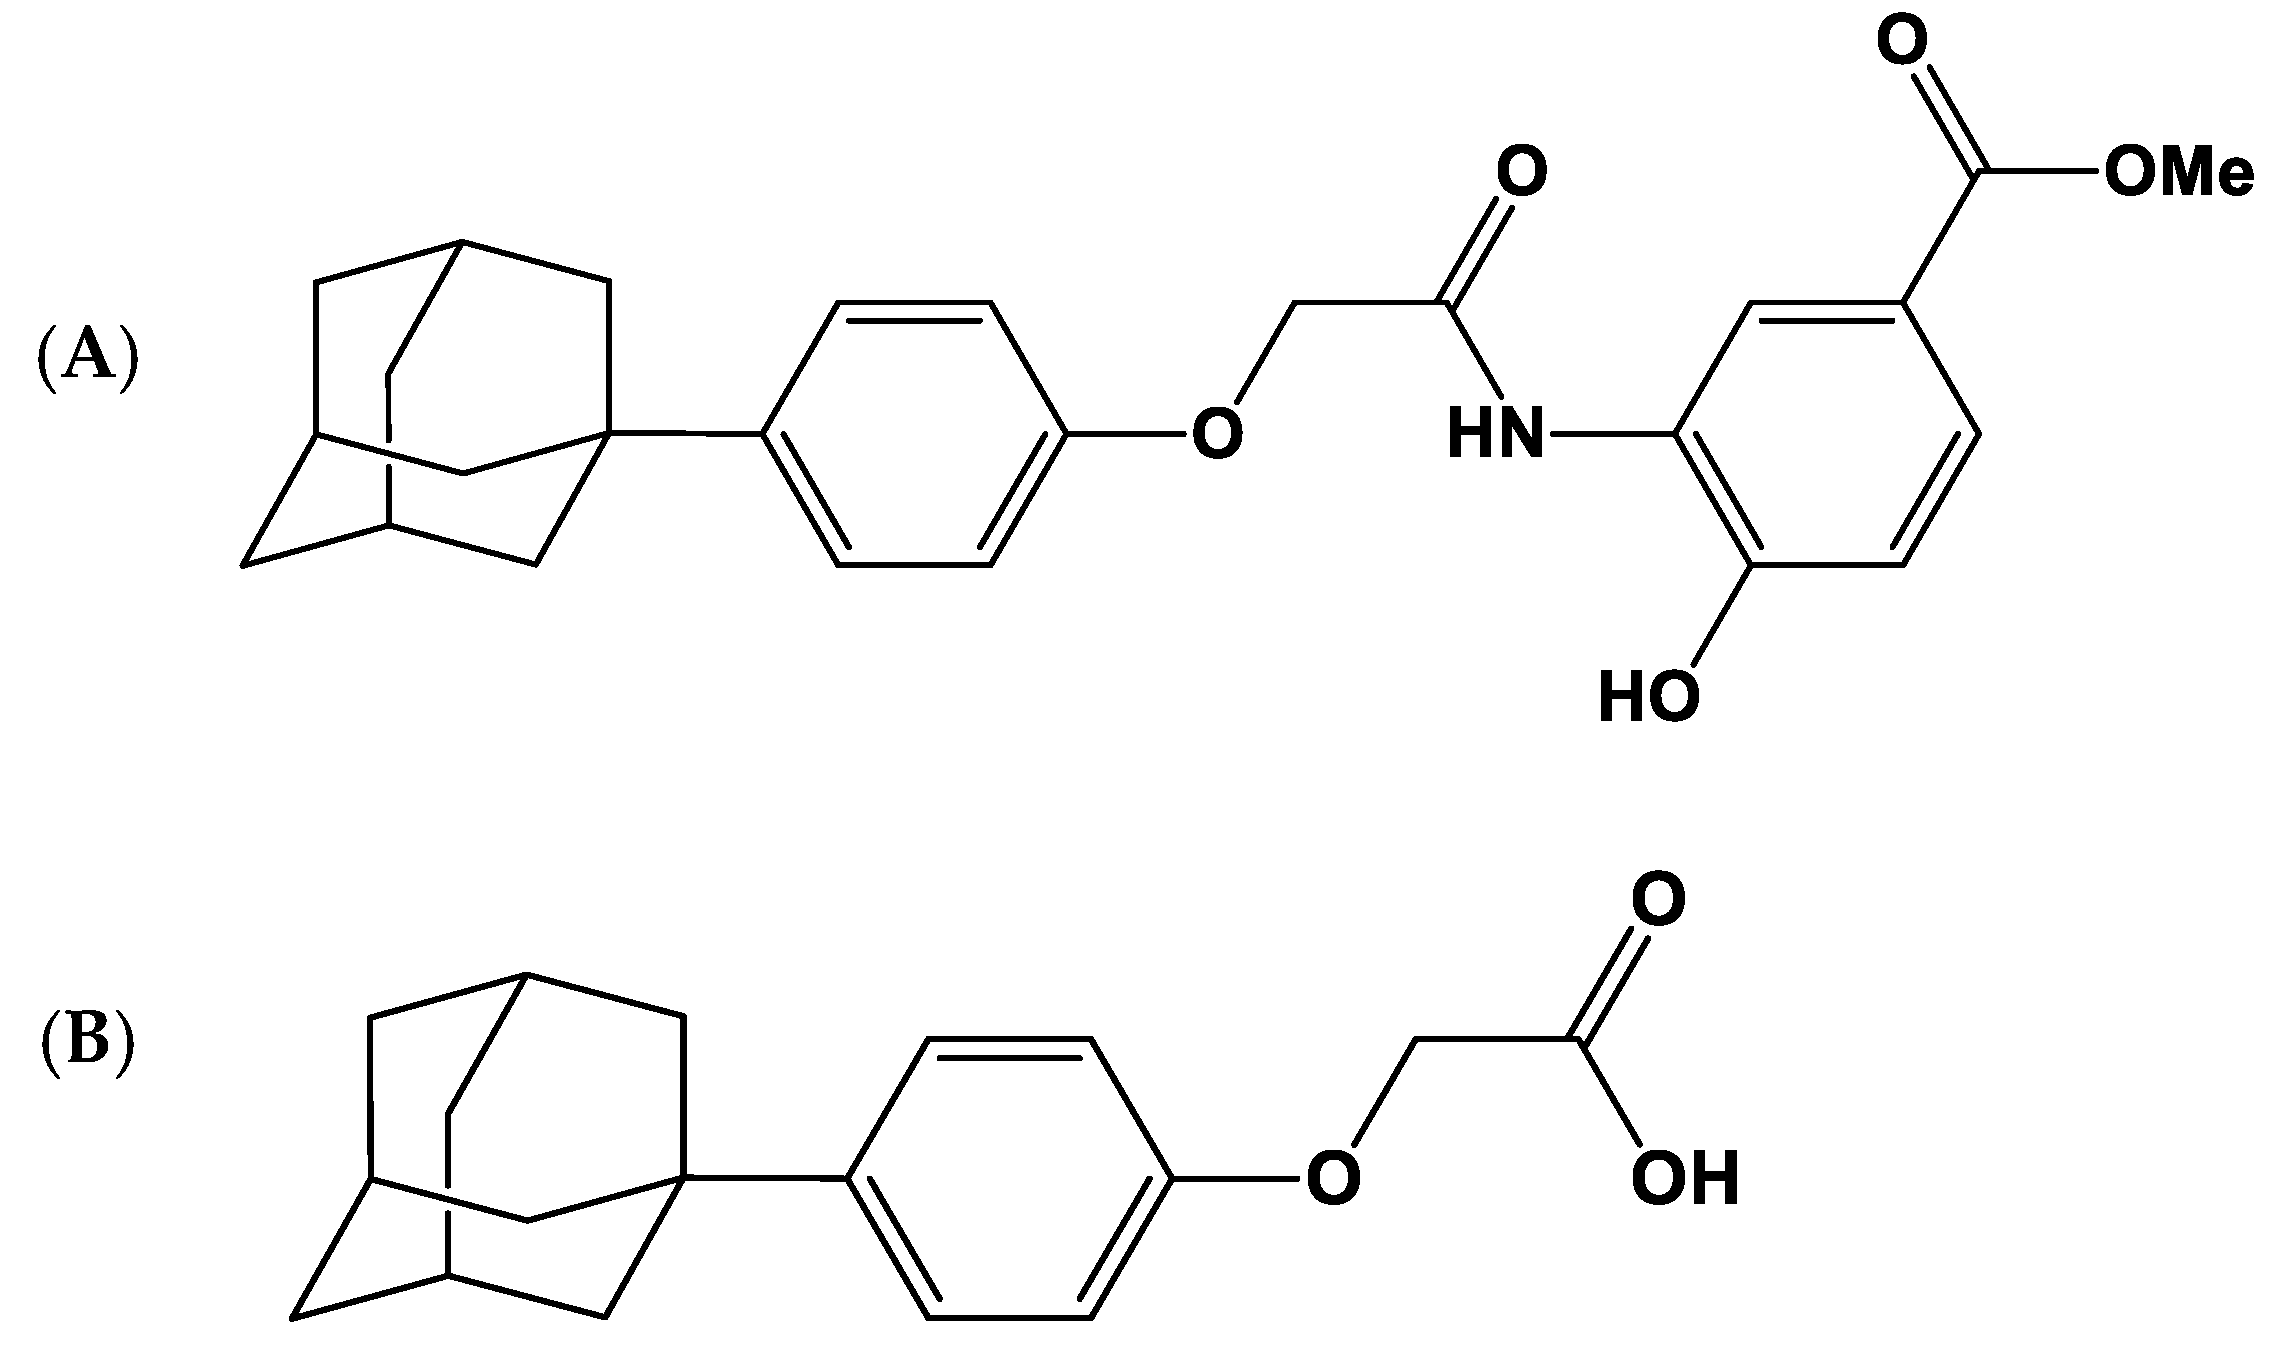
2.1.1. LW6
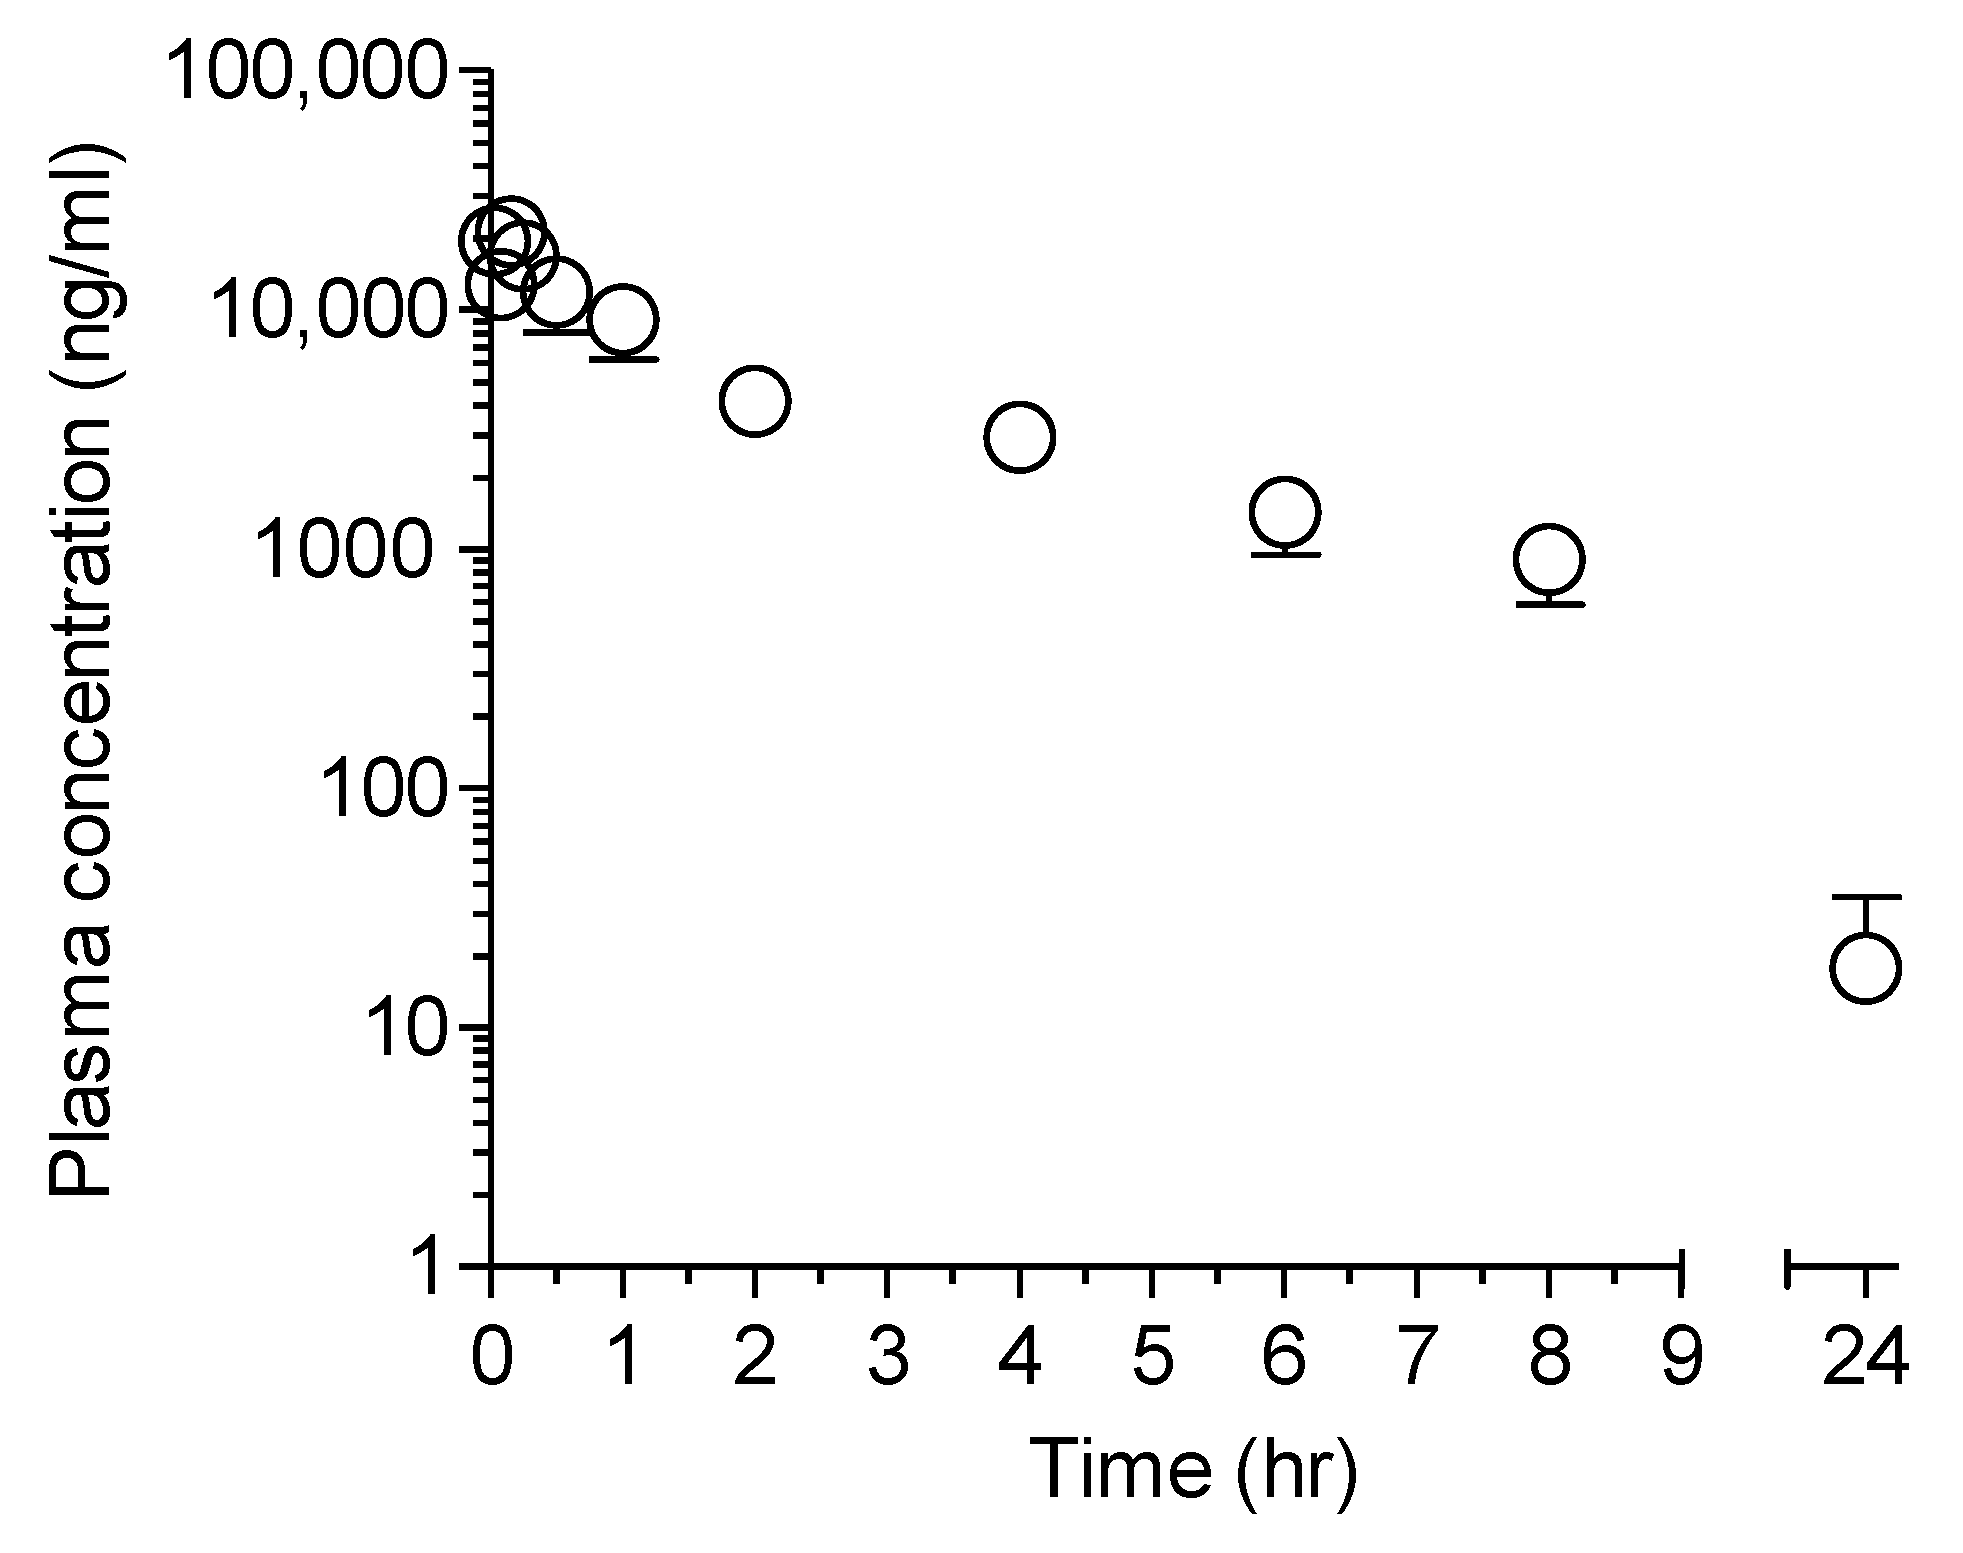
2.1.2. APA
2.2. Permeability of LW6 in Caco-2 Cells
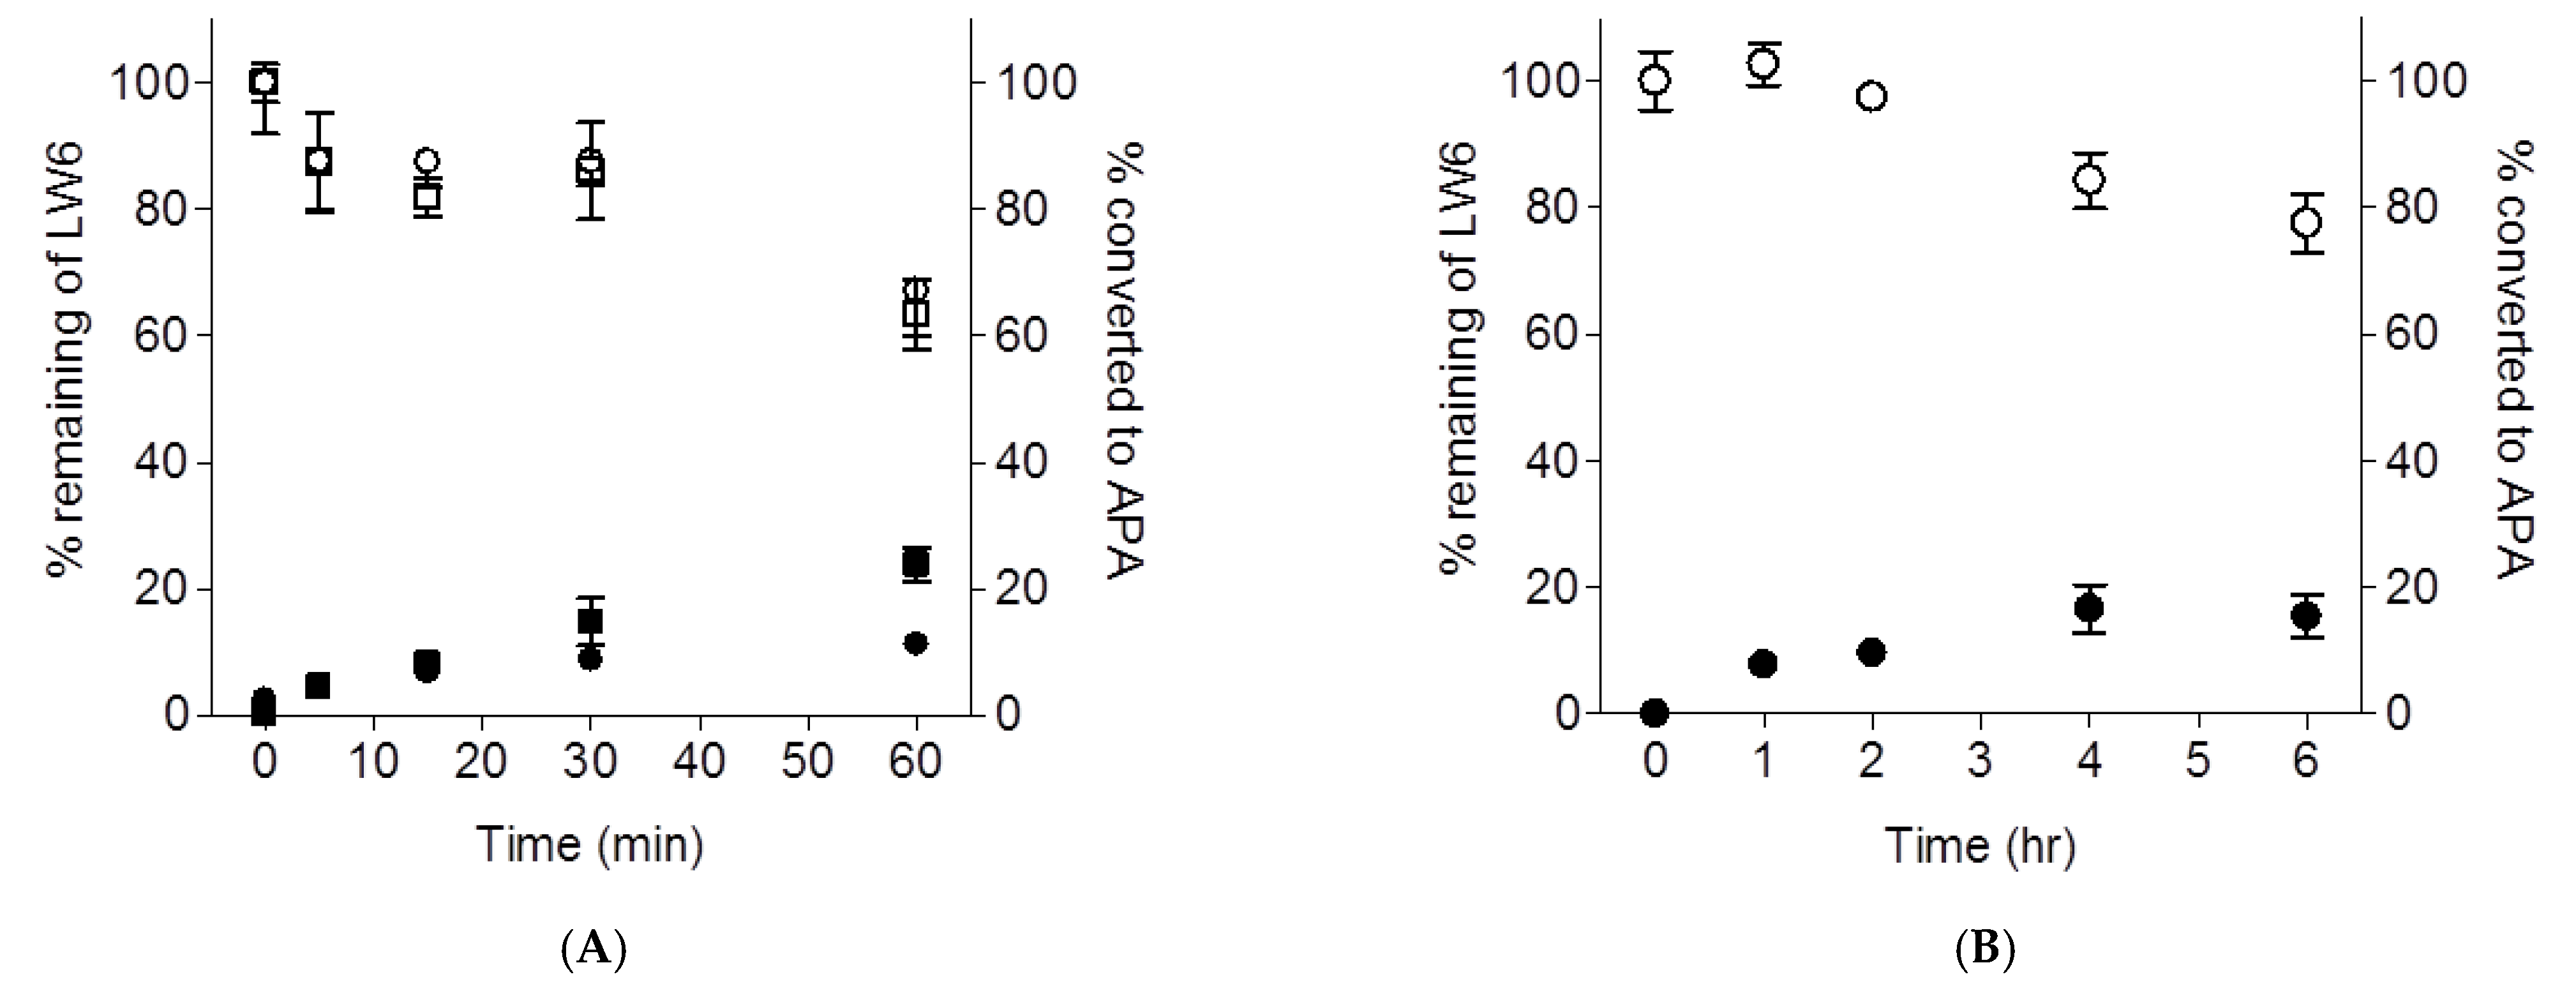
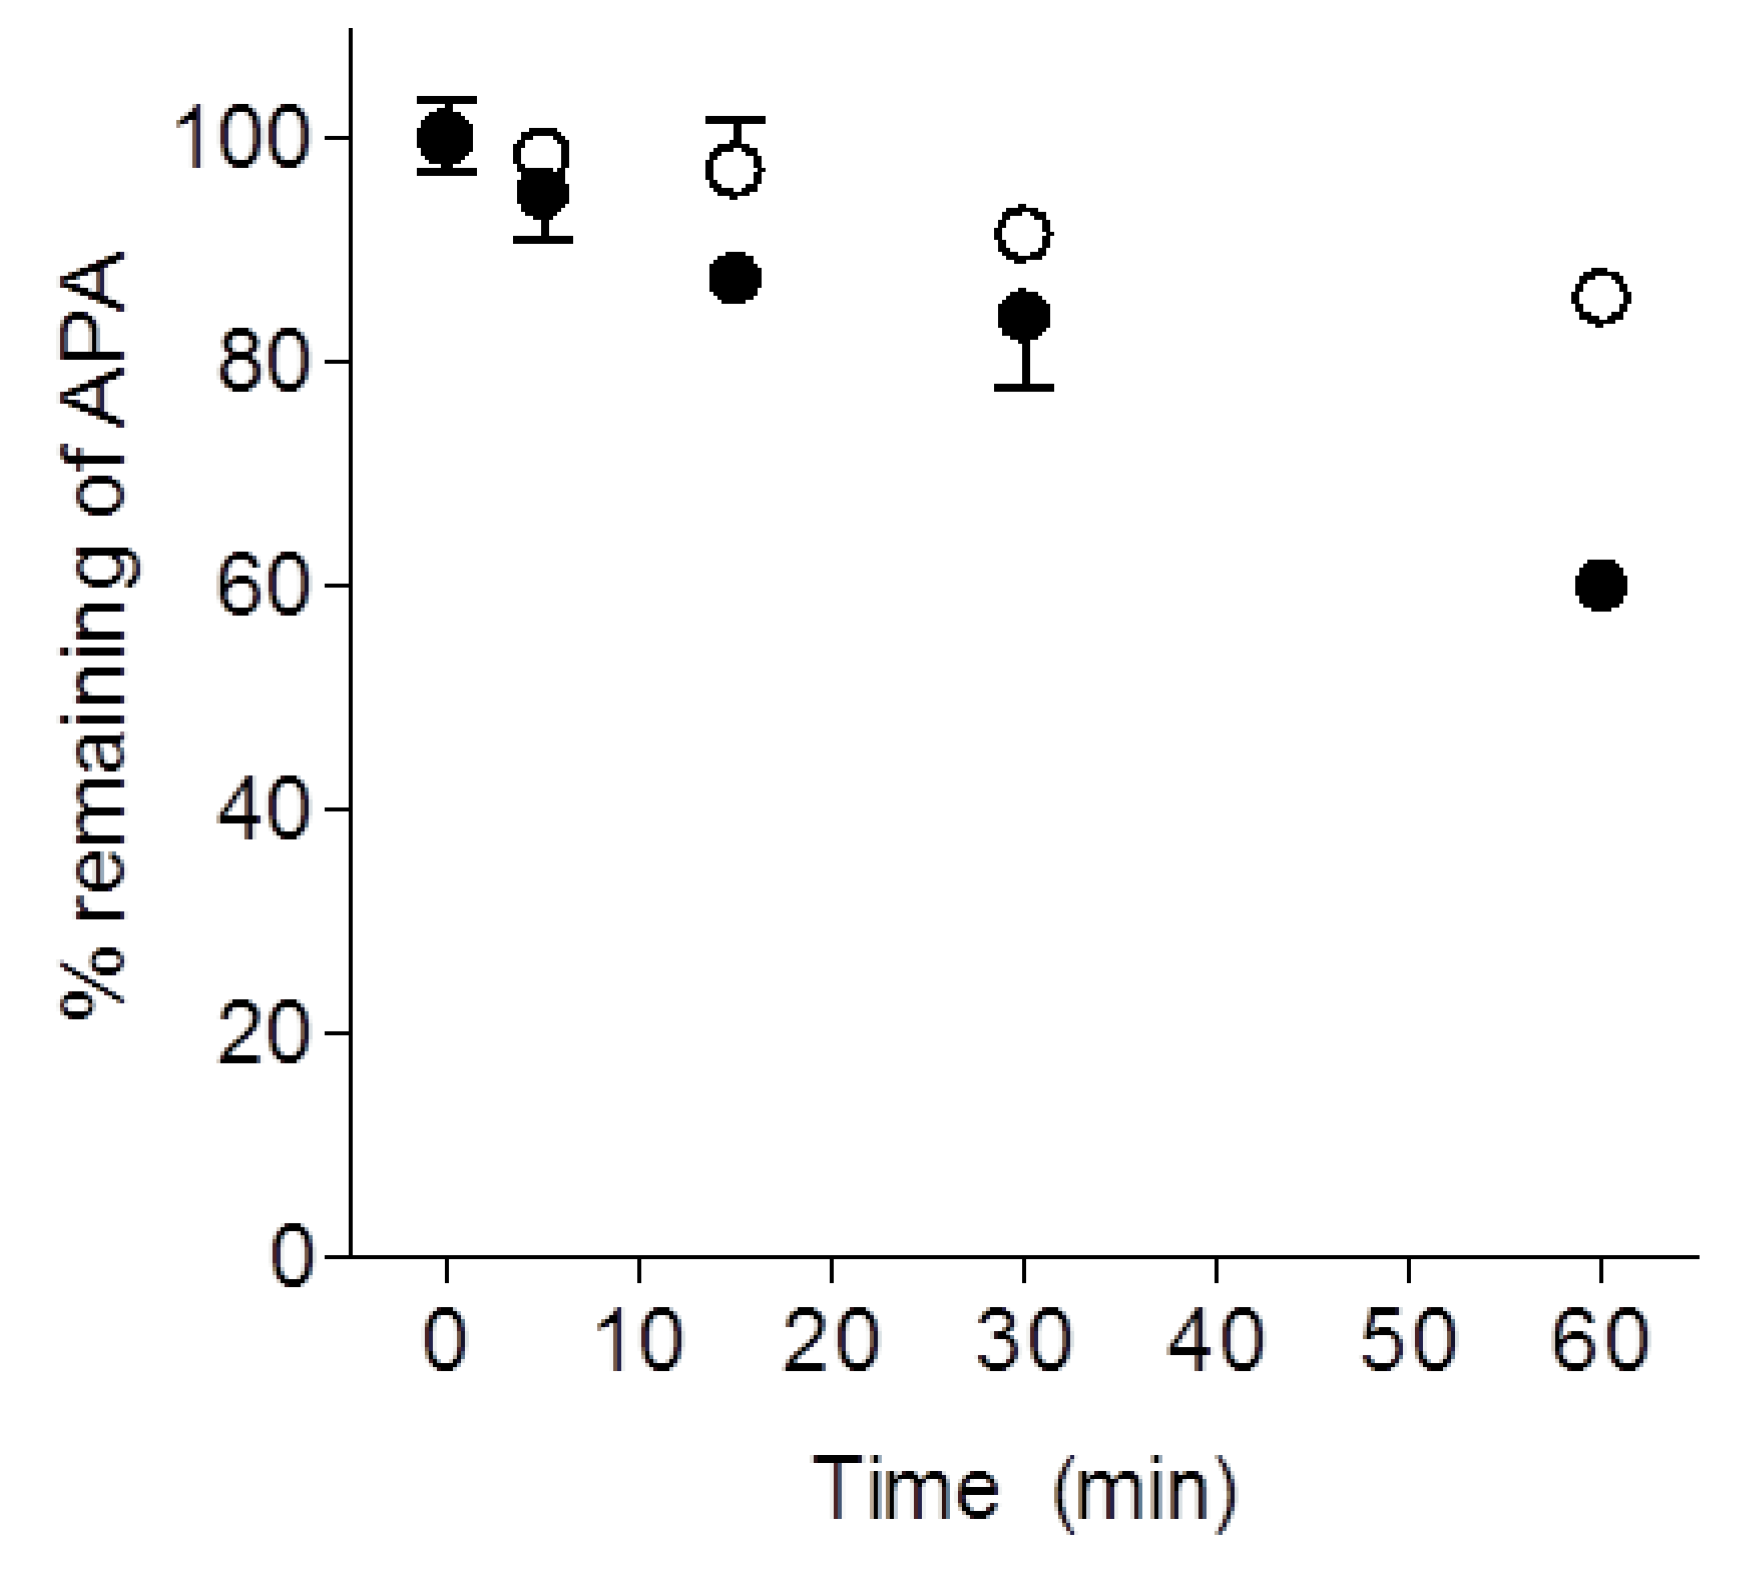
2.3. Metabolic Stability of LW6 in Mouse Liver Microsomes and Serum
3. Discussion
4. Materials and Methods
4.1. Chemicals and Reagents
4.2. In Vivo Pharmacokinetic Studies
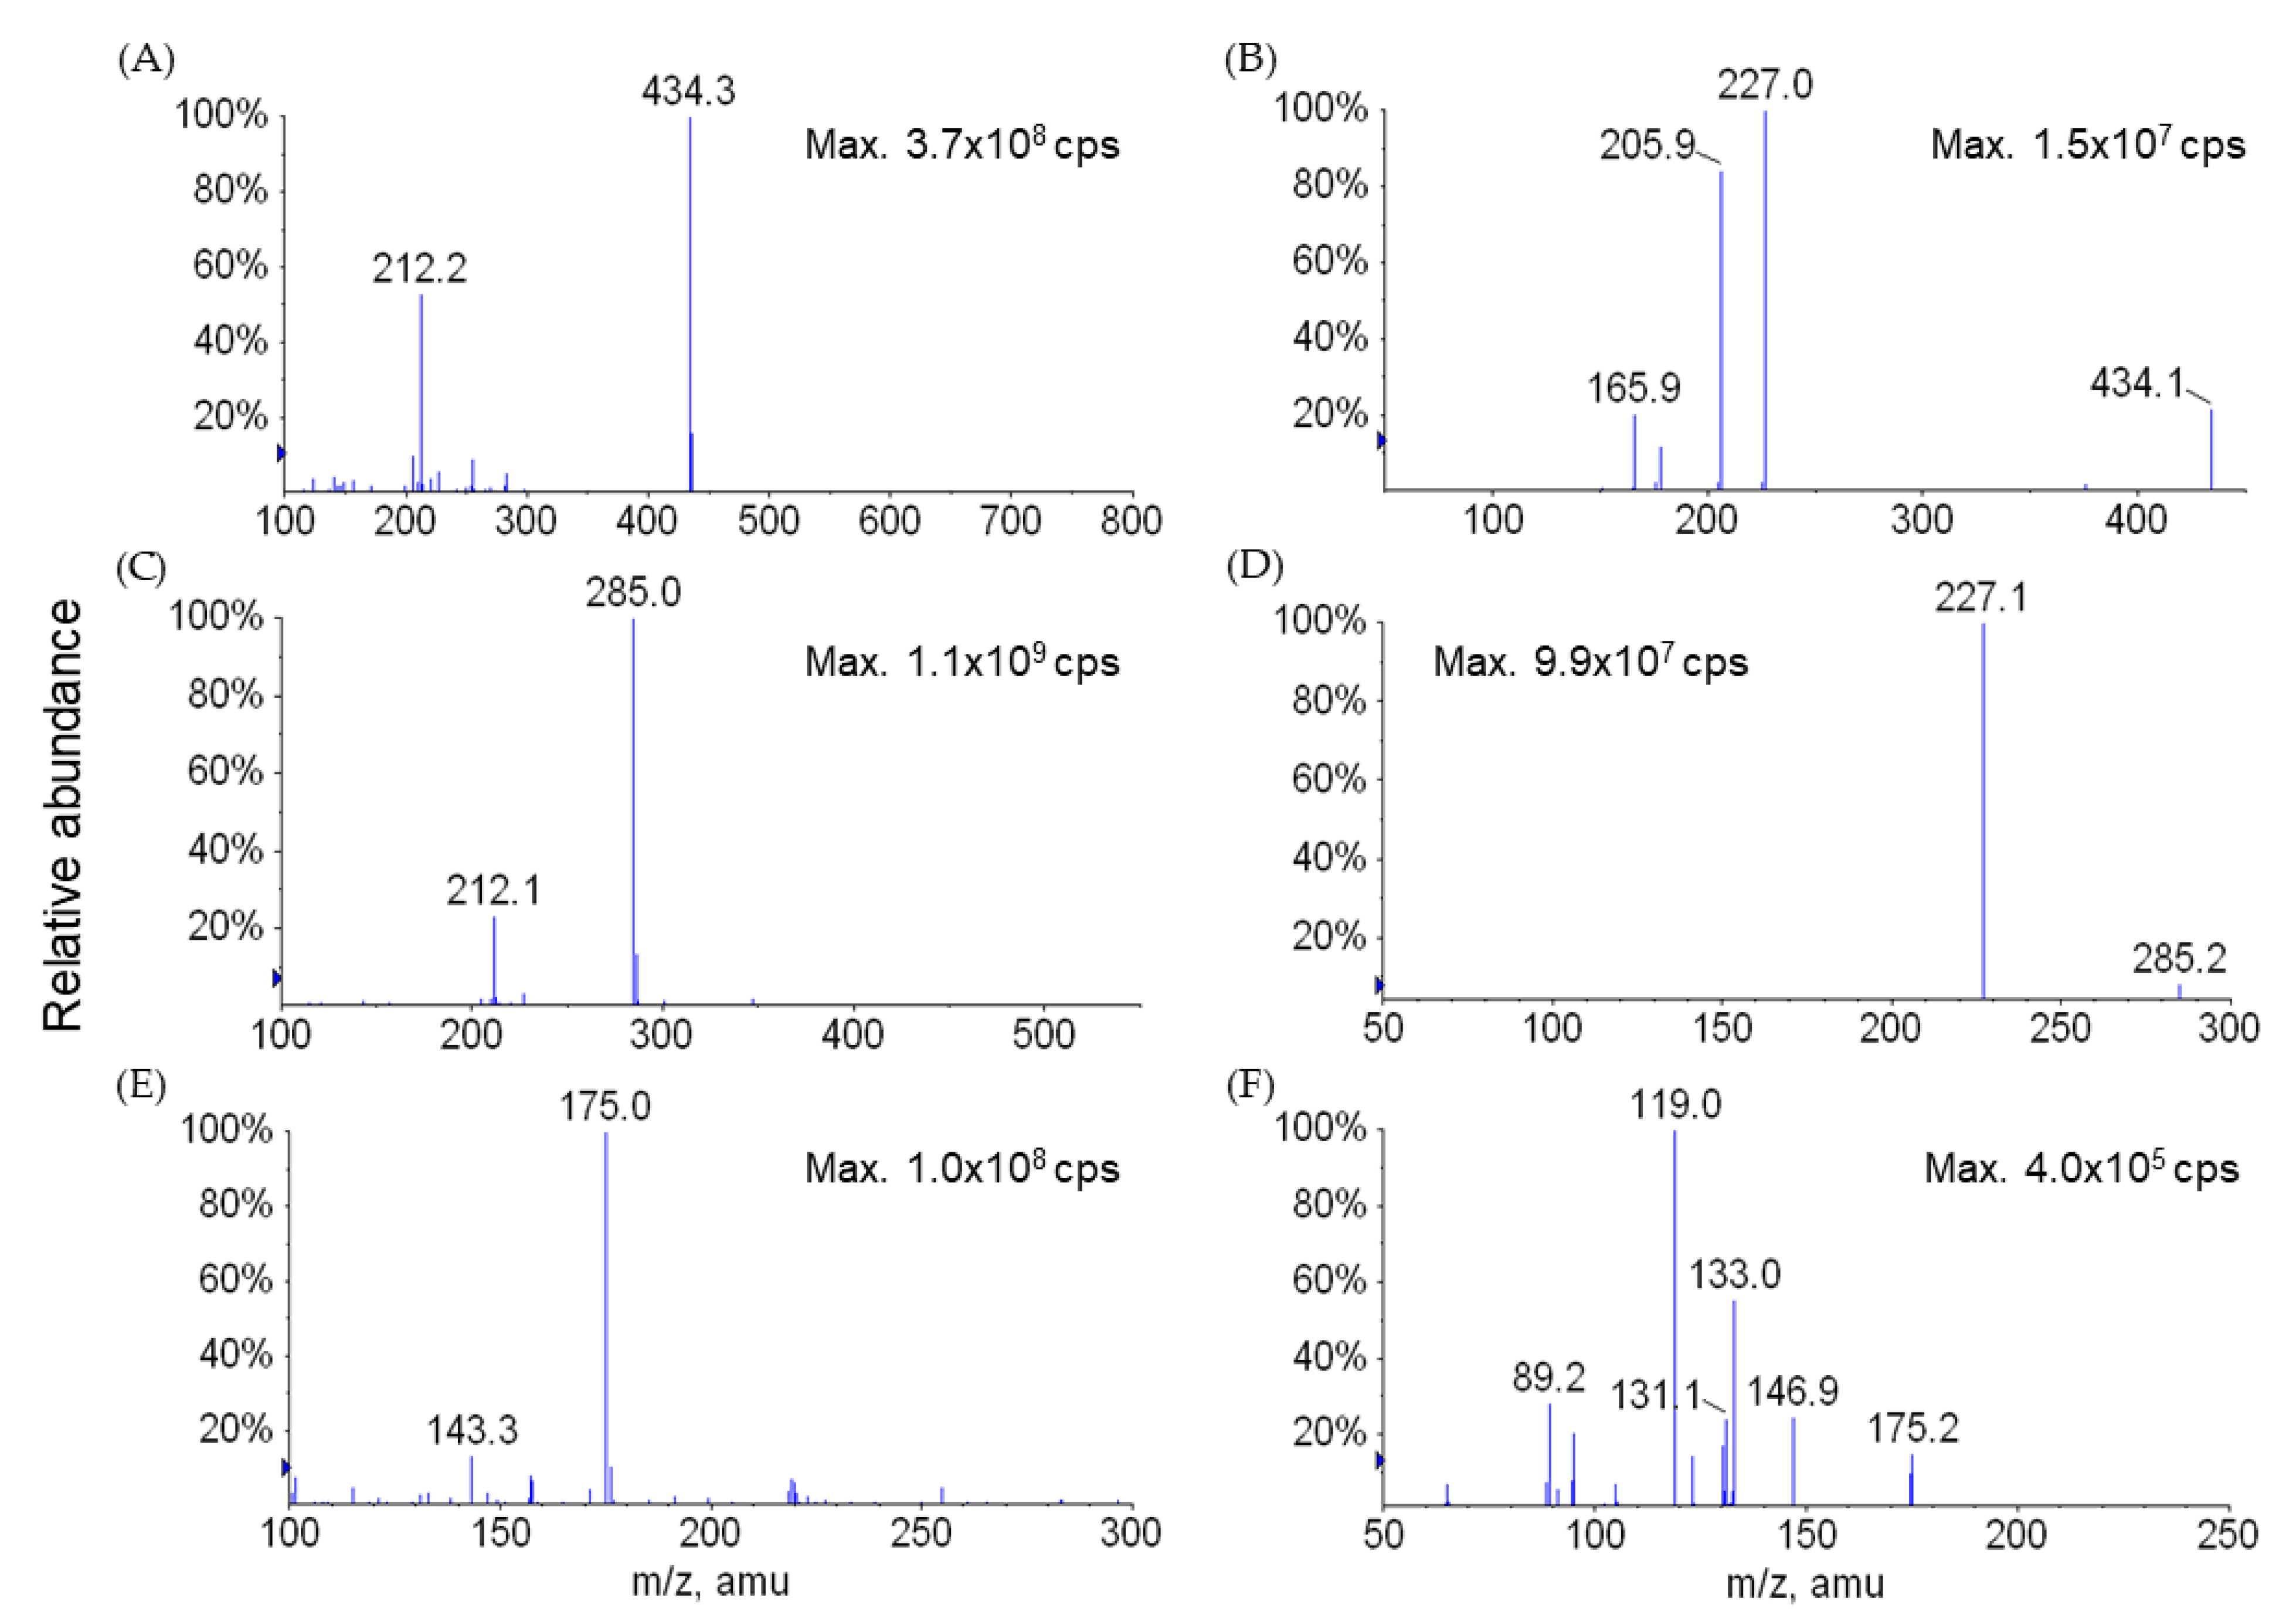
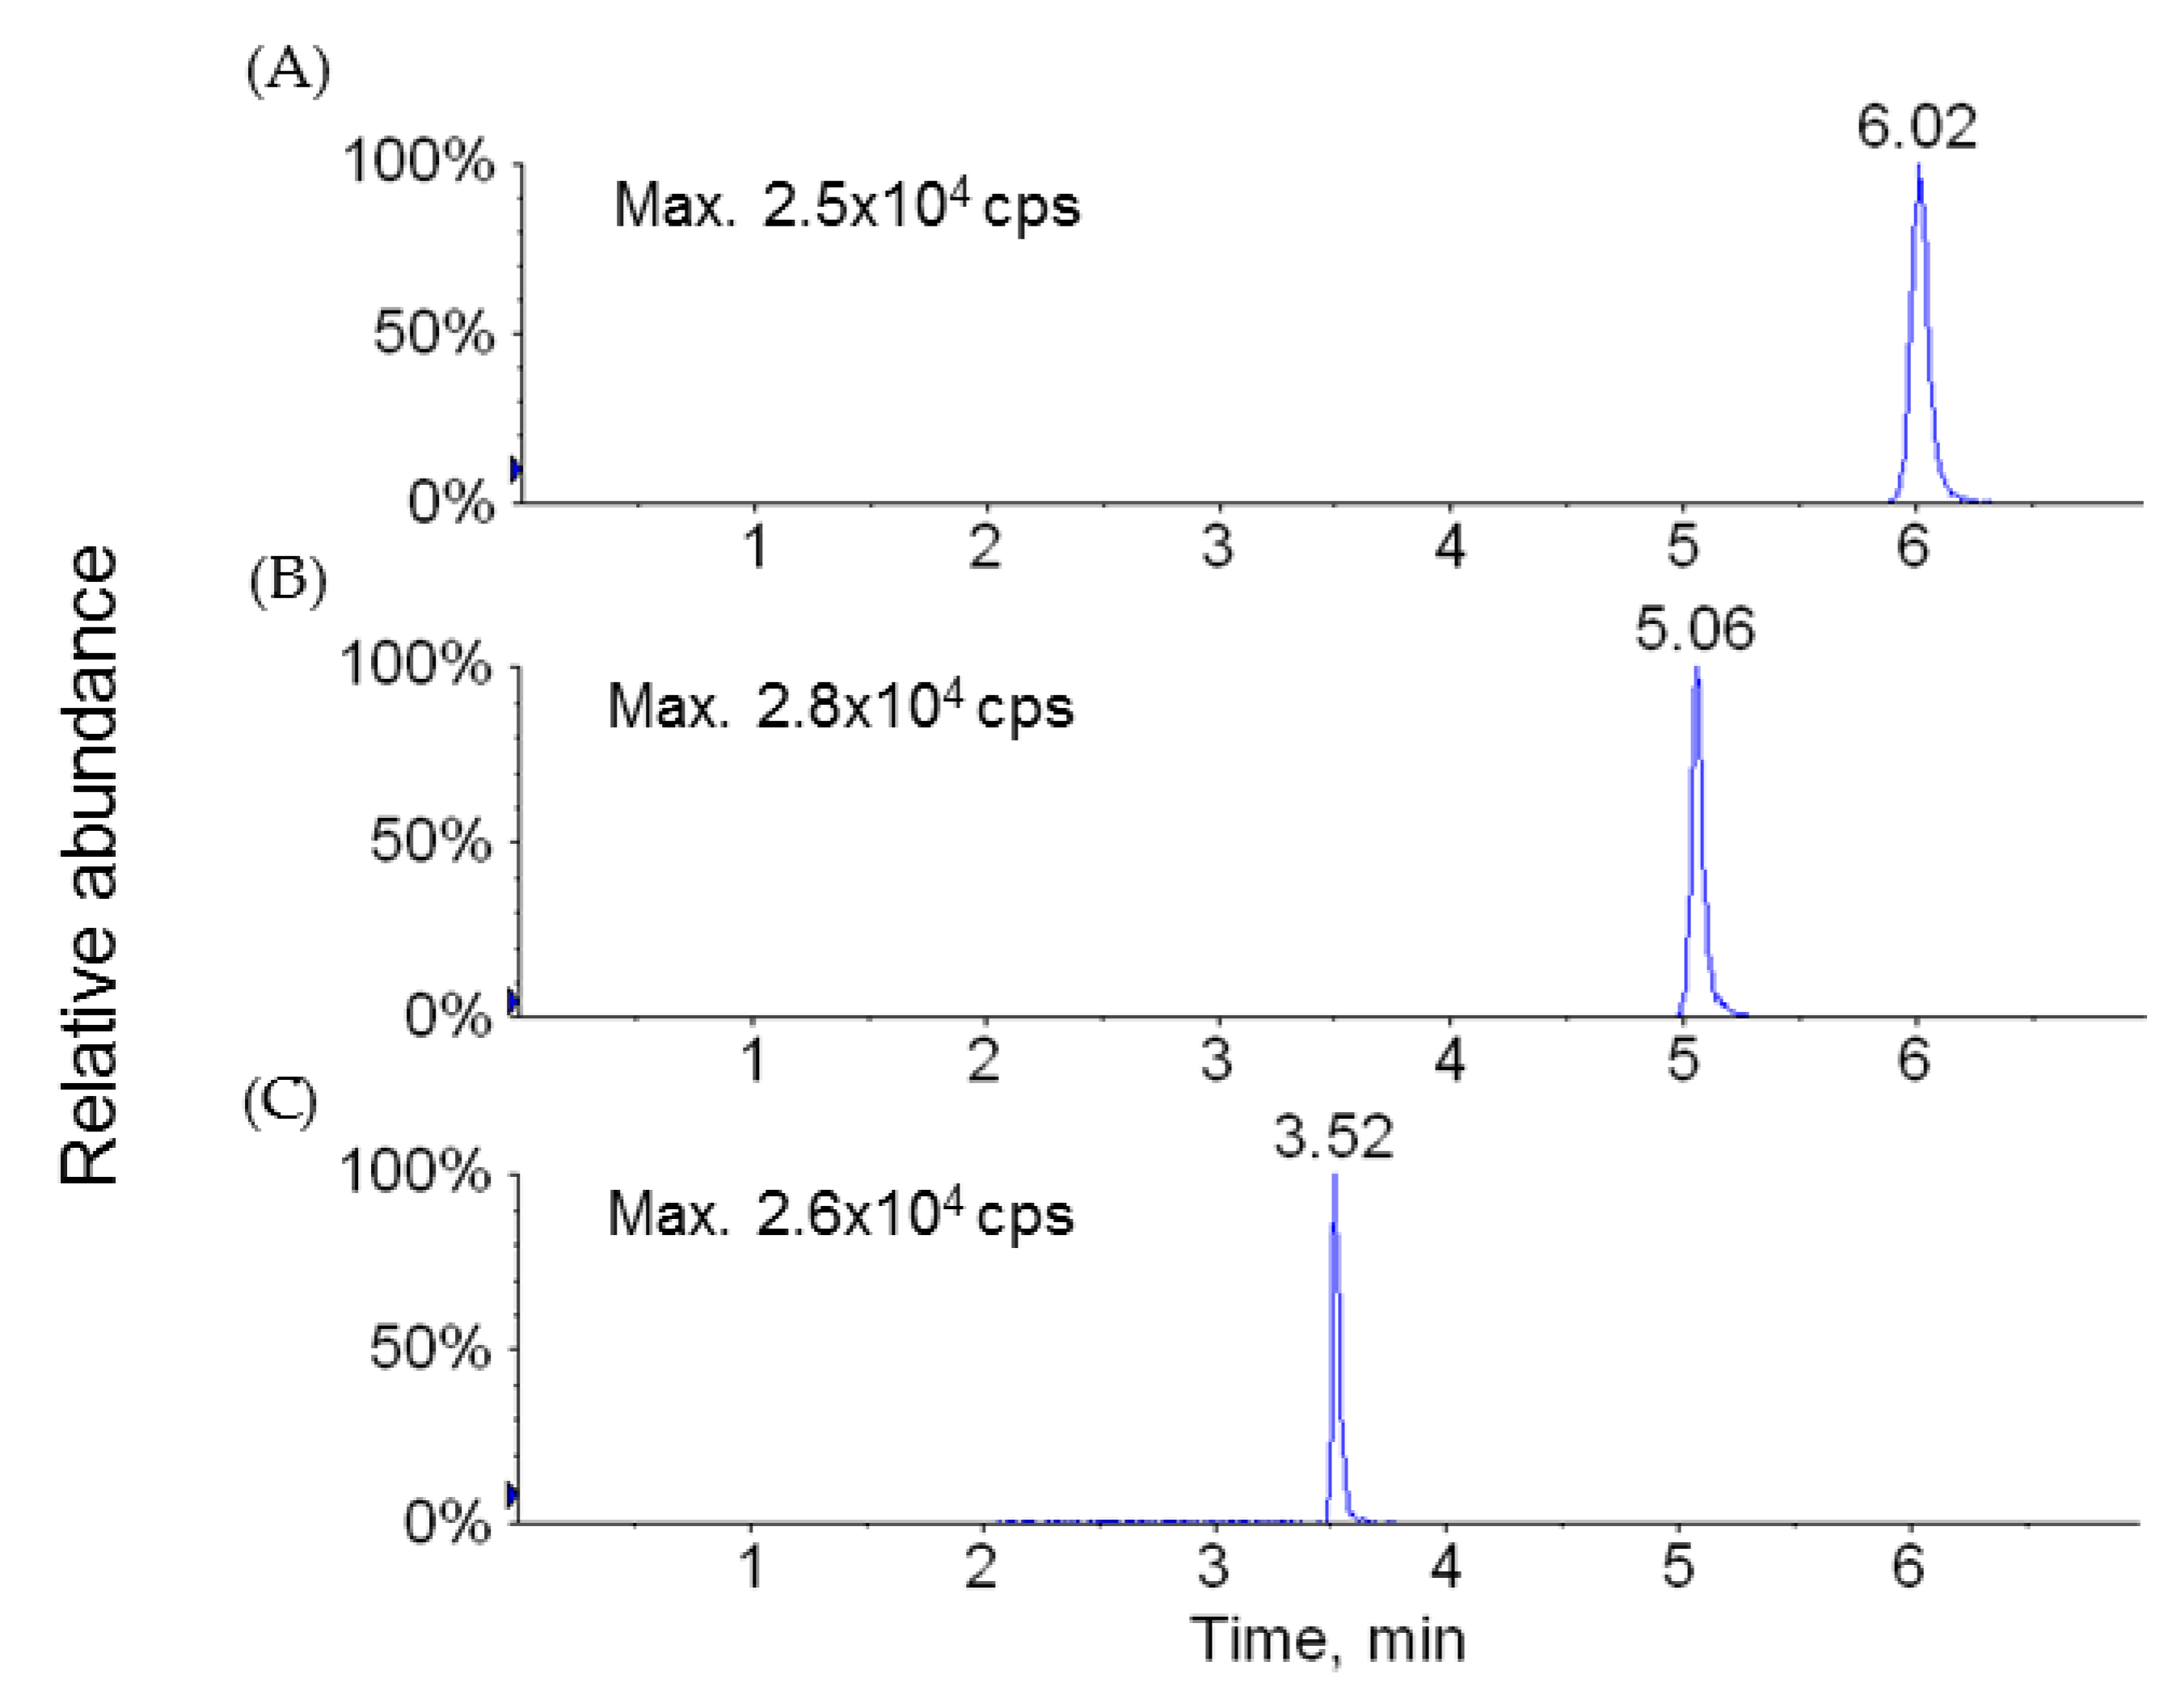
4.2.1. Sample Analysis
4.2.2. Data Analysis
4.3. Permeability Assay in Caco-2 Cell Monolayers
4.3.1. Transport Studies
4.3.2. Data Analysis
4.4. In Vitro Incubations
4.4.1. Mouse Serum
4.4.2. Mouse Liver Microsomes
4.5. Bioanalytical Methods
Author Contributions
Funding
Institutional Review Board Statement
Informed Consent Statement
Data Availability Statement
Acknowledgments
Conflicts of Interest
Sample Availability
References
- Smith, T.G.; Robbins, P.A.; Ratcliffe, P.J. The human side of hypoxia-inducible factor. Br. J. Haematol. 2008, 141, 325–334. [Google Scholar] [CrossRef]
- Bracken, C.P.; Whitelaw, M.L.; Peet, D.J. The hypoxia-inducible factors: Key transcriptional regulators of hypoxic responses. Cell. Mol. Life Sci. 2003, 60, 1376–1393. [Google Scholar] [CrossRef]
- Goda, N.; Dozier, S.J.; Johnson, R.S. HIF-1 in cell cycle regulation, apoptosis, and tumor progression. Antioxid. Redox Signal. 2003, 5, 467–473. [Google Scholar] [CrossRef]
- Wang, G.L.; Semenza, G.L. Purification and characterization of hypoxia-inducible factor 1. J. Biol. Chem. 1995, 270, 1230–1237. [Google Scholar] [CrossRef] [PubMed] [Green Version]
- Semenza, G.L.; Nejfelt, M.K.; Chi, S.M.; Antonarakis, S.E. Hypoxia-inducible nuclear factors bind to an enhancer element located 3′ to the human erythropoietin gene. Proc. Natl. Acad. Sci. USA 1991, 88, 5680–5684. [Google Scholar] [CrossRef] [PubMed] [Green Version]
- Salceda, S.; Caro, J. Hypoxia-inducible factor 1alpha (HIF-1alpha) protein is rapidly degraded by the ubiquitin-proteasome system under normoxic conditions. Its stabilization by hypoxia depends on redox-induced changes. J. Biol. Chem. 1997, 272, 22642–22647. [Google Scholar] [CrossRef] [PubMed] [Green Version]
- Maxwell, P.H.; Wiesener, M.S.; Chang, G.W.; Clifford, S.C.; Vaux, E.C.; Cockman, M.E.; Wykoff, C.C.; Pugh, C.W.; Maher, E.R.; Ratcliffe, P.J. The tumour suppressor protein VHL targets hypoxia-inducible factors for oxygen-dependent proteolysis. Nature 1999, 399, 271–275. [Google Scholar] [CrossRef] [PubMed]
- Wang, G.L.; Jiang, B.H.; Rue, E.A.; Semenza, G.L. Hypoxia-inducible factor 1 is a basic-helix-loop-helix-PAS heterodimer regulated by cellular O2 tension. Proc. Natl. Acad. Sci. USA 1995, 92, 5510–5514. [Google Scholar] [CrossRef] [Green Version]
- Bruick, R.K. Oxygen sensing in the hypoxic response pathway: Regulation of the hypoxia-inducible transcription factor. Genes Dev. 2003, 17, 2614–2623. [Google Scholar] [CrossRef] [Green Version]
- Semenza, G.L. HIF-1 and human disease: One highly involved factor. Genes Dev. 2000, 14, 1983–1991. [Google Scholar]
- Zhong, H.; De Marzo, A.M.; Laughner, E.; Lim, M.; Hilton, D.A.; Zagzag, D.; Buechler, P.; Isaacs, W.B.; Semenza, G.L.; Simons, J.W. Overexpression of hypoxia-inducible factor 1alpha in common human cancers and their metastases. Cancer Res. 1999, 59, 5830–5835. [Google Scholar]
- Semenza, G.L. Targeting HIF-1 for cancer therapy. Nat. Rev. Cancer 2003, 3, 721–732. [Google Scholar] [CrossRef] [PubMed]
- Pili, R.; Donehower, R.C. Is HIF-1 alpha a valid therapeutic target? J. Natl. Cancer Inst. 2003, 95, 498–499. [Google Scholar] [CrossRef] [PubMed] [Green Version]
- Kaelin, W.; Rapisarda, A.; Uranchimeg, B.; Scudiero, D.A.; Selby, M.; Sausville, E.A.; Shoemaker, R.H.; Melillo, G. Faculty of 1000 evaluation for Identification of small molecule inhibitors of hypoxia-inducible factor 1 transcriptional activation pathway. F1000 Post Publ. Peer Rev. Biomed. Lit. 2002, 62, 4316–4324. [Google Scholar] [CrossRef]
- Mabjeesh, N.J.; Post, D.E.; Willard, M.T.; Kaur, B.; Van Meir, E.G.; Simons, J.W.; Zhong, H. Geldanamycin induces degradation of hypoxia-inducible factor 1alpha protein via the proteosome pathway in prostate cancer cells. Cancer Res. 2002, 62, 2478–2482. [Google Scholar] [PubMed]
- Kung, A.L.; Zabludoff, S.D.; France, D.S.; Freedman, S.J.; Tanner, E.A.; Vieira, A.; Cornell-Kennon, S.; Lee, J.; Wang, B.; Wang, J.; et al. Small molecule blockade of transcriptional coactivation of the hypoxia-inducible factor pathway. Cancer Cell 2004, 6, 33–43. [Google Scholar] [CrossRef] [Green Version]
- Tan, C.; de Noronha, R.G.; Roecker, A.J.; Pyrzynska, B.; Khwaja, F.; Zhang, Z.; Zhang, H.; Teng, Q.; Nicholson, A.C.; Giannakakou, P.; et al. Identification of a novel small-molecule inhibitor of the hypoxia-inducible factor 1 pathway. Cancer Res. 2005, 5, 605–612. [Google Scholar]
- Narita, T.; Yin, S.; Gelin, C.F.; Moreno, C.S.; Yepes, M.; Nicolaou, K.C.; Van Meir, E.G. Identification of a novel small molecule HIF-1alpha translation inhibitor. Clin. Cancer Res. 2009, 15, 6128–6136. [Google Scholar] [CrossRef] [PubMed] [Green Version]
- Lee, K.; Lee, J.H.; Boovanahalli, S.K.; Jin, Y.; Lee, M.; Jin, X.; Kim, J.H.; Hong, Y.S.; Lee, J.J. (Aryloxyacetylamino)benzoic acid analogues: A new class of hypoxia-inducible factor-1 inhibitors. J. Med. Chem. 2007, 50, 1675–1684. [Google Scholar] [CrossRef] [PubMed]
- Lee, K.; Kang, J.E.; Park, S.K.; Jin, Y.; Chung, K.S.; Kim, H.M.; Lee, K.; Kang, M.R.; Lee, M.K.; Song, K.B.; et al. LW6, a novel HIF-1 inhibitor, promotes proteasomal degradation of HIF-1alpha via upregulation of VHL in a colon cancer cell line. Biochem. Pharmacol. 2010, 80, 982–989. [Google Scholar] [CrossRef]
- Ulu, A.; Davis, B.B.; Tsai, H.J.; Kim, I.H.; Morisseau, C.; Inceoglu, B.; Fiehn, O.; Hammock, B.D.; Weiss, R.H. Soluble epoxide hydrolase inhibitors reduce the development of atherosclerosis in apolipoprotein e-knockout mouse model. J. Cardiovasc. Pharmacol. 2008, 52, 314–323. [Google Scholar] [CrossRef] [PubMed] [Green Version]
- Grigoryev, A.; Kavanagh, P.; Melnik, A. The detection of the urinary metabolites of 3-[(adamantan-1-yl)carbonyl]-1-pentylindole (AB-001), a novel cannabimimetic, by gas chromatography-mass spectrometry. Drug Test. Anal. 2012, 4, 519–524. [Google Scholar] [CrossRef] [PubMed]
- Peng, S.X.; Rockafellow, B.A.; Skedzielewski, T.M.; Huebert, N.D.; Hafeman, W. Improved pharmacokinetic and bioavailability support of drug discovery using serial blood sampling in mice. J. Pharm. Sci 2009, 98, 1877–1884. [Google Scholar] [CrossRef]
- Lee, K.; Thakker, D.R. Saturable transport of H2-antagonists ranitidine and famotidine across Caco-2 cell monolayers. J. Pharm. Sci. 1999, 88, 680–687. [Google Scholar] [CrossRef] [PubMed]

| Parameter | i.v. | p.o. | ||
|---|---|---|---|---|
| LW6 | APA | LW6 | APA | |
| Dose (mg/kg) | 5 (n = 4) | 5 (n = 5) | ||
| tmax (hr) | NA | 0.6 ± 0.3 | 0.3 ± 0.1 | 0.7 ± 0.1 |
| Cmax (ng/mL) | NA | 4210.0 ± 823.1 | 65.5 ± 47.3 | 4236.0 ± 1262.0 |
| AUC0–t (ng/hr/mL) | 2949.3 ± 218.4 | 17,731.4 ± 3190.5 | 49.5 ± 52.5 | 14,615.3 ± 5507.8 |
| AUC0–inf (ng/hr/mL) | 2957.1 ± 215.4 | 17,759.9 ± 3194.1 | NC | 14,744.8 ± 5517.4 |
| CL (L/hr/kg) | 1.7 ± 0.1 | NA | NA | NA |
| Vss (L/kg) | 0.5 ± 0.1 | NA | NA | NA |
| Vz (Lkg) | 1.6 ± 0.3 | NA | NA | NA |
| t1/2 (hr) | 0.6 ± 0.1 | 2.7 ± 0.2 | NC | 2.4 ± 0.6 |
| MRT (hr) | 0.3 ± 0.0 | 3.6 ± 0.2 | NC | 3.2 ± 0.3 |
| F (%) | NA | NA | 1.7 ± 1.8 | NA |
| Parameter | APA Dosed |
|---|---|
| Dose (mg/kg) | 5 |
| AUC0–t (ng/hr/mL) | 37,703.8 ± 10,162.9 |
| AUC0–inf (ng/hr/mL) | 39,624.7 ± 9502.30 |
| CL (L/hr/kg) | 0.1 ± 0.0 |
| Vss (L/kg) | 0.4 ± 0.1 |
| Vz (L/kg) | 0.5 ± 0.2 |
| t1/2 (hr) | 2.4 ± 0.4 |
| Compound | Papp × 10−6 (cm/s) |
|---|---|
| LW6 | 2.1 ± 0.4 |
| Metoprolol | 35.3 ± 0.6 |
| Atenolol | 0.4 ± 0.1 |
| Ranitidine | 0.8 ± 0.0 |
| Produced Metabolite | Dose | AUC(m)0–inf | CL(m) | Fraction of Dose |
|---|---|---|---|---|
| (mg/kg) | (ng/hr/mL) | (L/hr/kg) | (%) | |
| LW6 dosed | ||||
| Intravenous | 5 | |||
| APA | NA | 17,759.9 ± 3194.1 | 0.1 ± 0.0 | 54.0 ± 9.7 |
| Oral | 5 | |||
| APA | NA | 14,744.8 ± 5517.4 | 0.1 ± 0.0 | 44.8 ± 16.8 |
Publisher’s Note: MDPI stays neutral with regard to jurisdictional claims in published maps and institutional affiliations. |
© 2021 by the authors. Licensee MDPI, Basel, Switzerland. This article is an open access article distributed under the terms and conditions of the Creative Commons Attribution (CC BY) license (https://creativecommons.org/licenses/by/4.0/).
Share and Cite
Lee, J.-Y.; Lee, K.; Lee, K.; Kang, J.S.; Kim, M.J.; Yoo, D.G.; Kim, J.A.; Shin, E.J.; Oh, S.J. Pharmacokinetic Characterization of LW6, a Novel Hypoxia-Inducible Factor-1α (HIF-1α) Inhibitor in Mice. Molecules 2021, 26, 2226. https://doi.org/10.3390/molecules26082226
Lee J-Y, Lee K, Lee K, Kang JS, Kim MJ, Yoo DG, Kim JA, Shin EJ, Oh SJ. Pharmacokinetic Characterization of LW6, a Novel Hypoxia-Inducible Factor-1α (HIF-1α) Inhibitor in Mice. Molecules. 2021; 26(8):2226. https://doi.org/10.3390/molecules26082226
Chicago/Turabian StyleLee, Ji-Yoon, Kiho Lee, Kyeong Lee, Jong Soon Kang, Min Ju Kim, Dong Gu Yoo, Jung Ah Kim, Eun Jin Shin, and Soo Jin Oh. 2021. "Pharmacokinetic Characterization of LW6, a Novel Hypoxia-Inducible Factor-1α (HIF-1α) Inhibitor in Mice" Molecules 26, no. 8: 2226. https://doi.org/10.3390/molecules26082226