
High Performance Liquid Chromatography versus Stacking-Micellar Electrokinetic Chromatography for the Determination of Potentially Toxic Alkenylbenzenes in Food Flavouring Ingredients

Abstract
1. Introduction
2. Material and Methods
2.1. Standards and Reagents
2.2. Instrumentation and Software
2.3. Sample Preparation
2.4. Reversed-Phase HPLC Conditions
2.5. MEKC Analysis
3. Results and Discussion
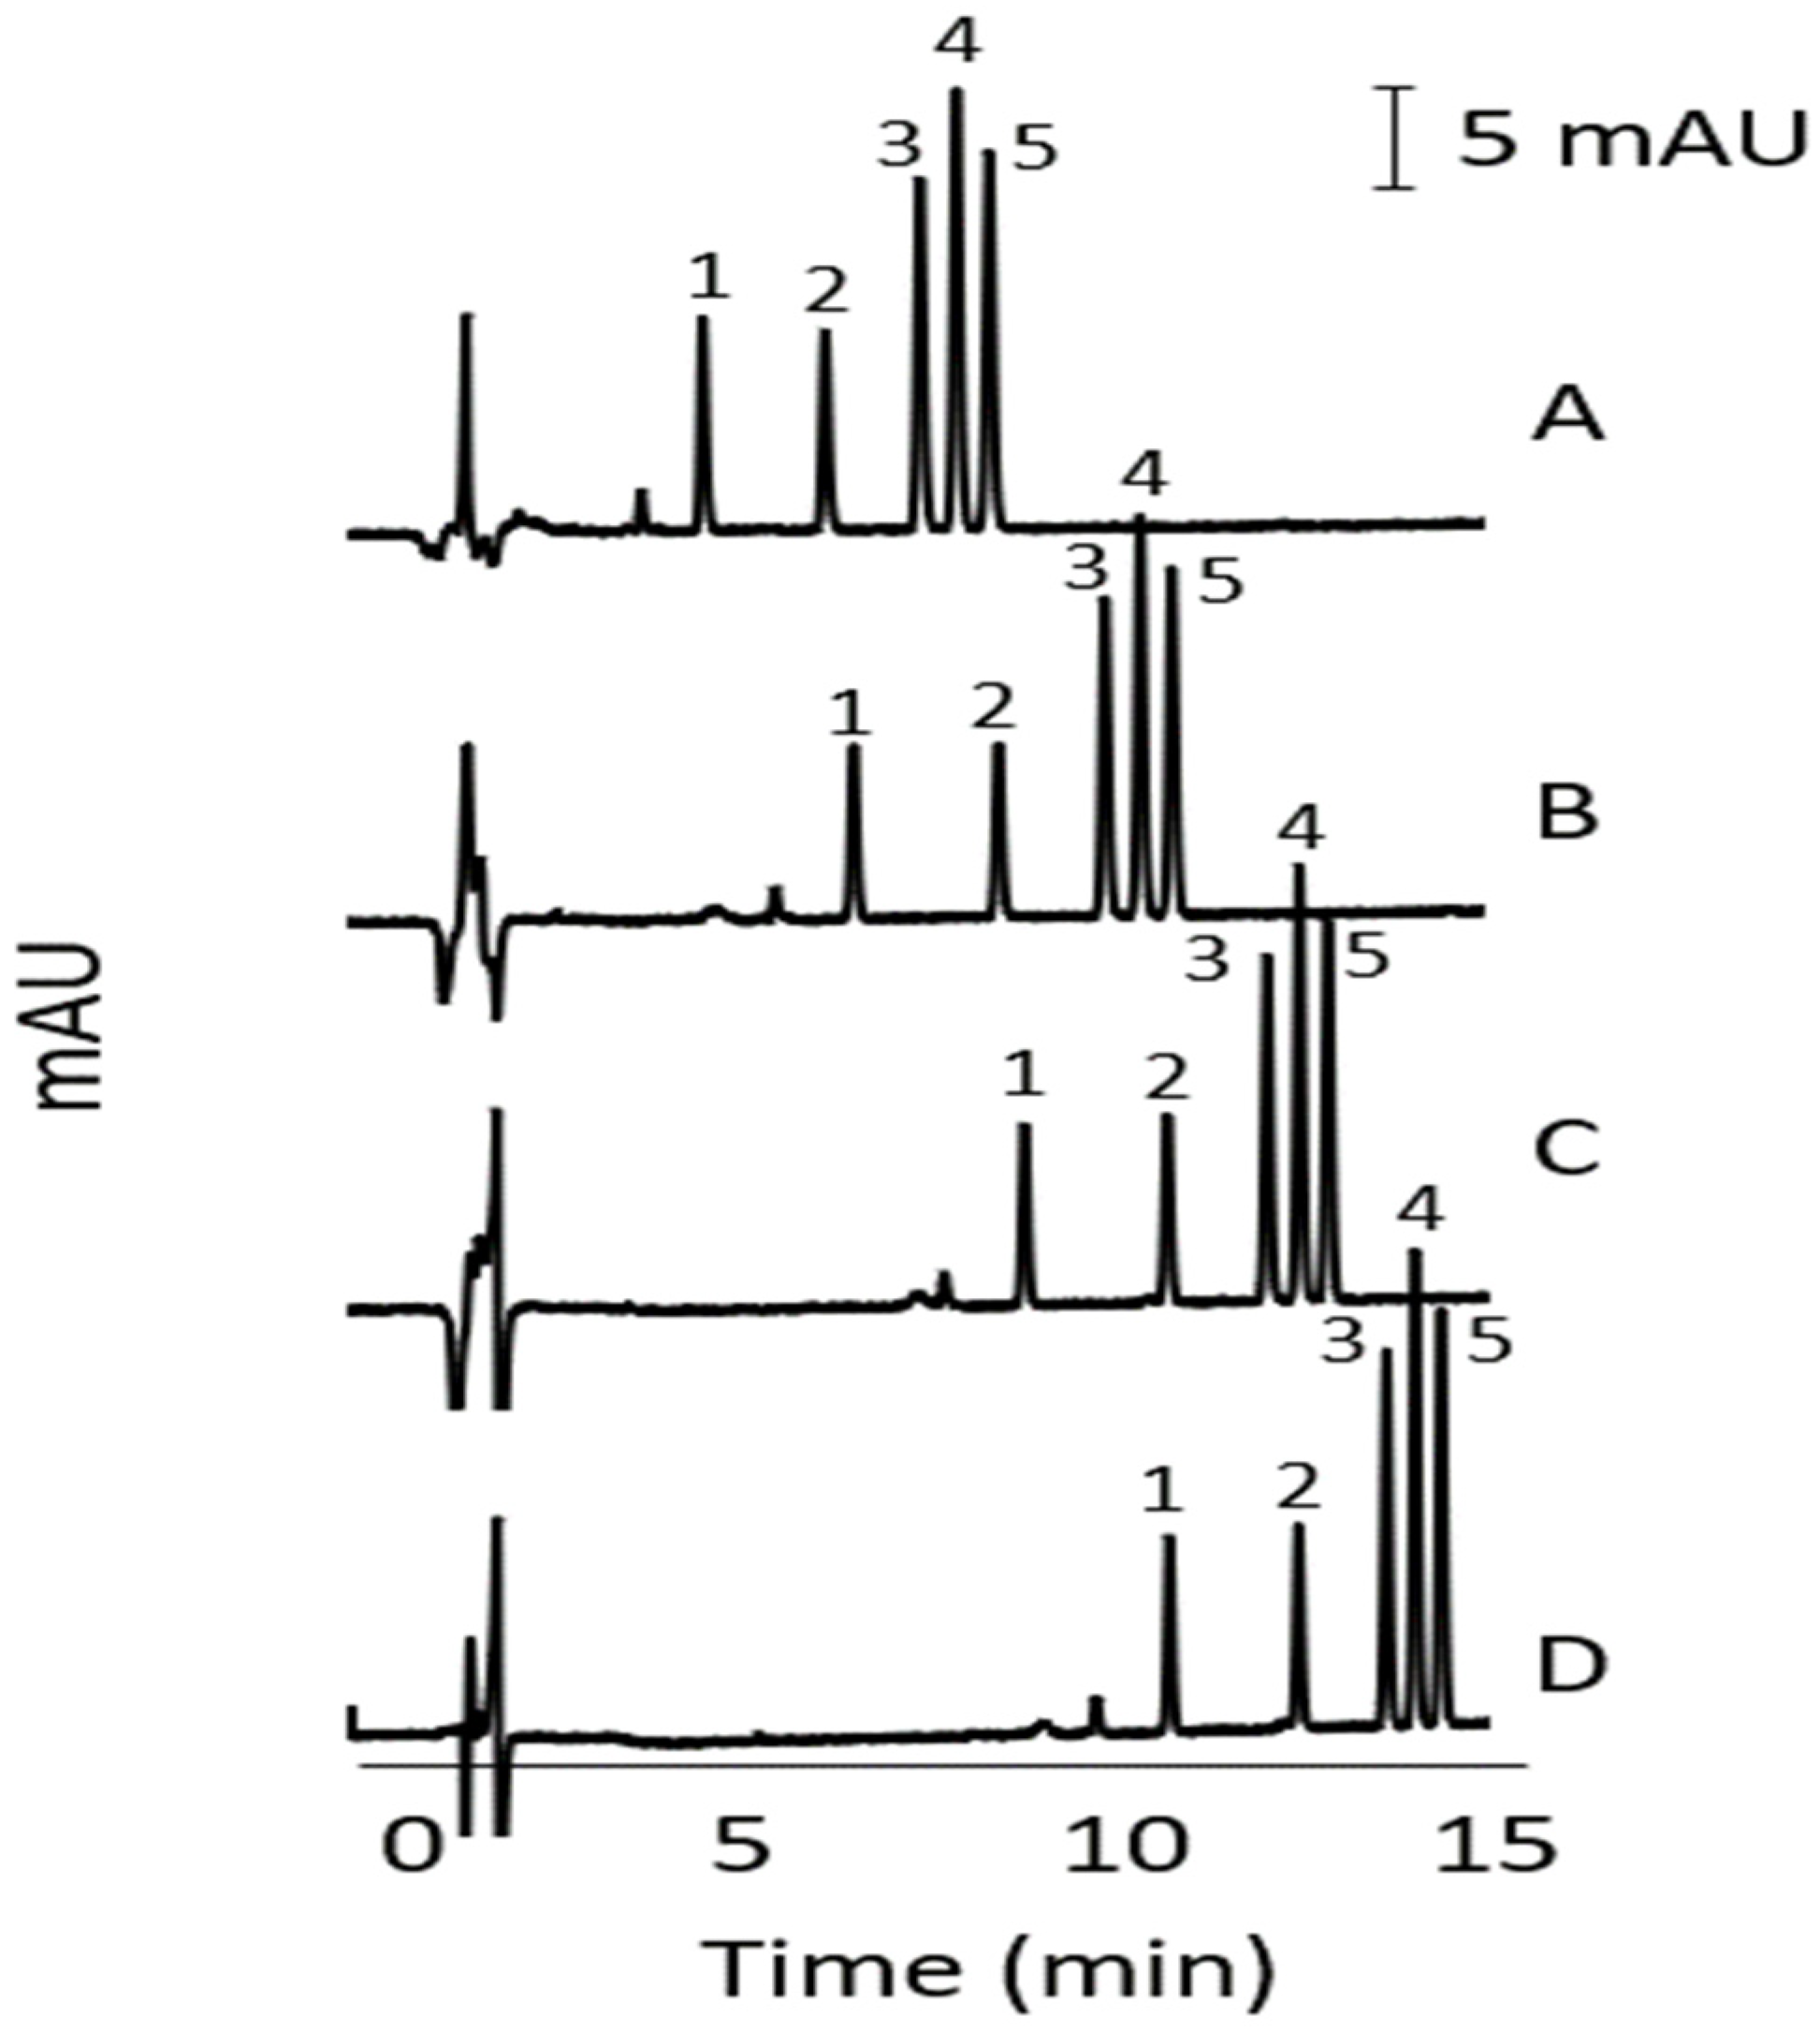
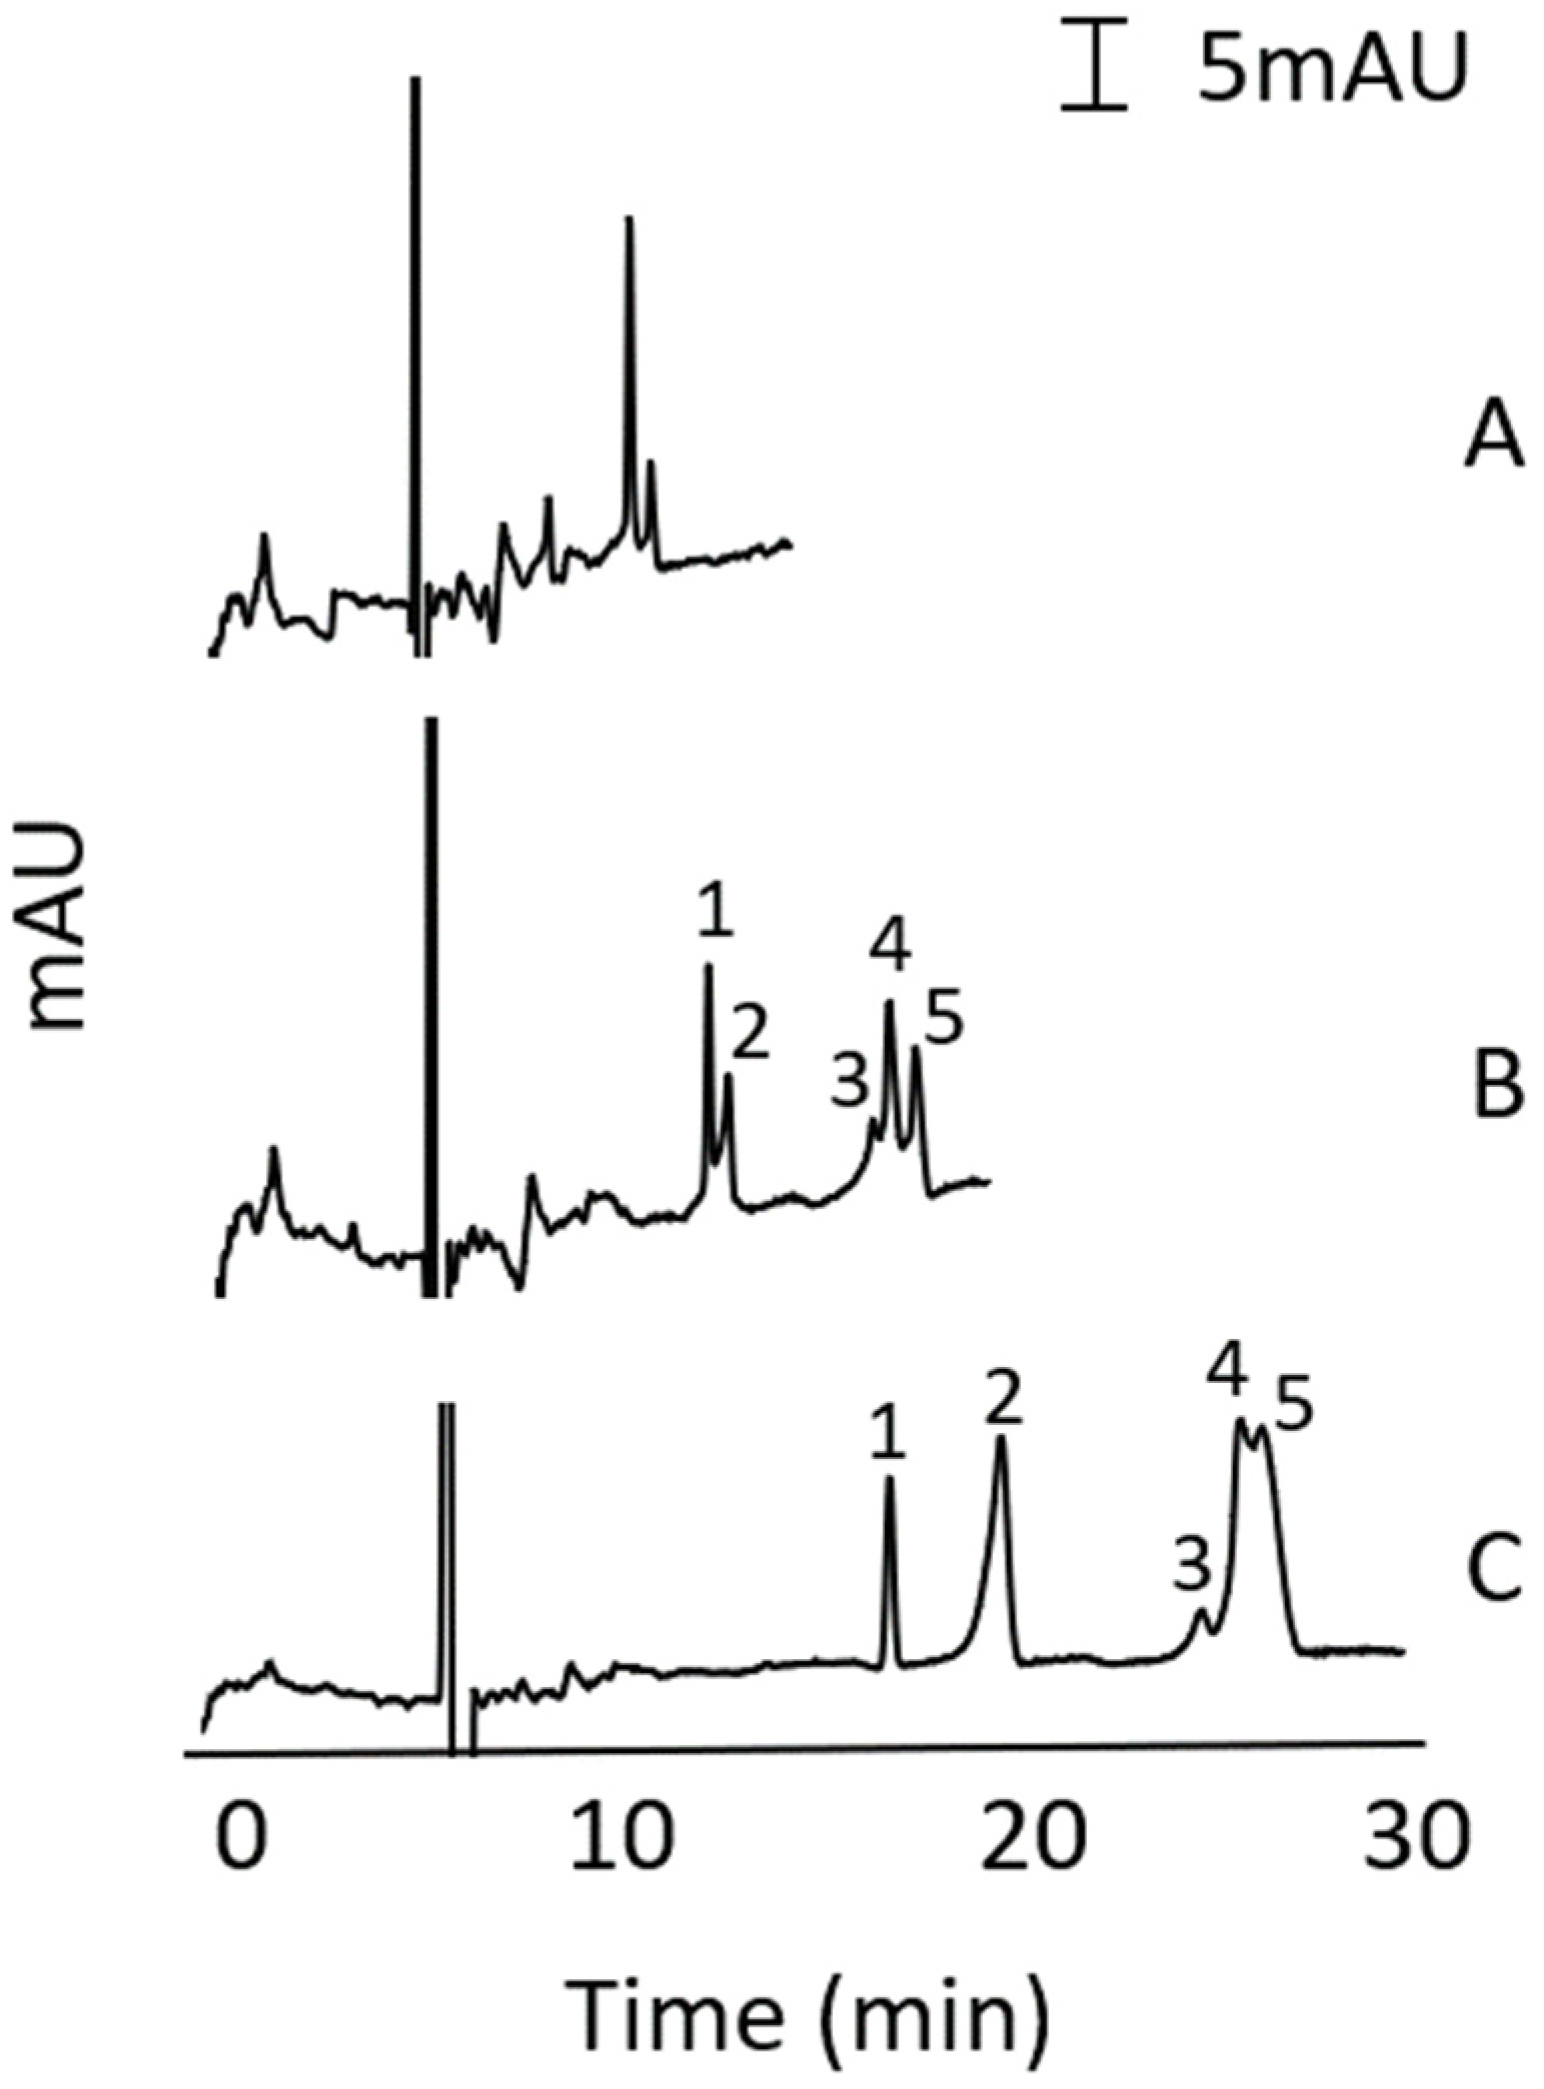
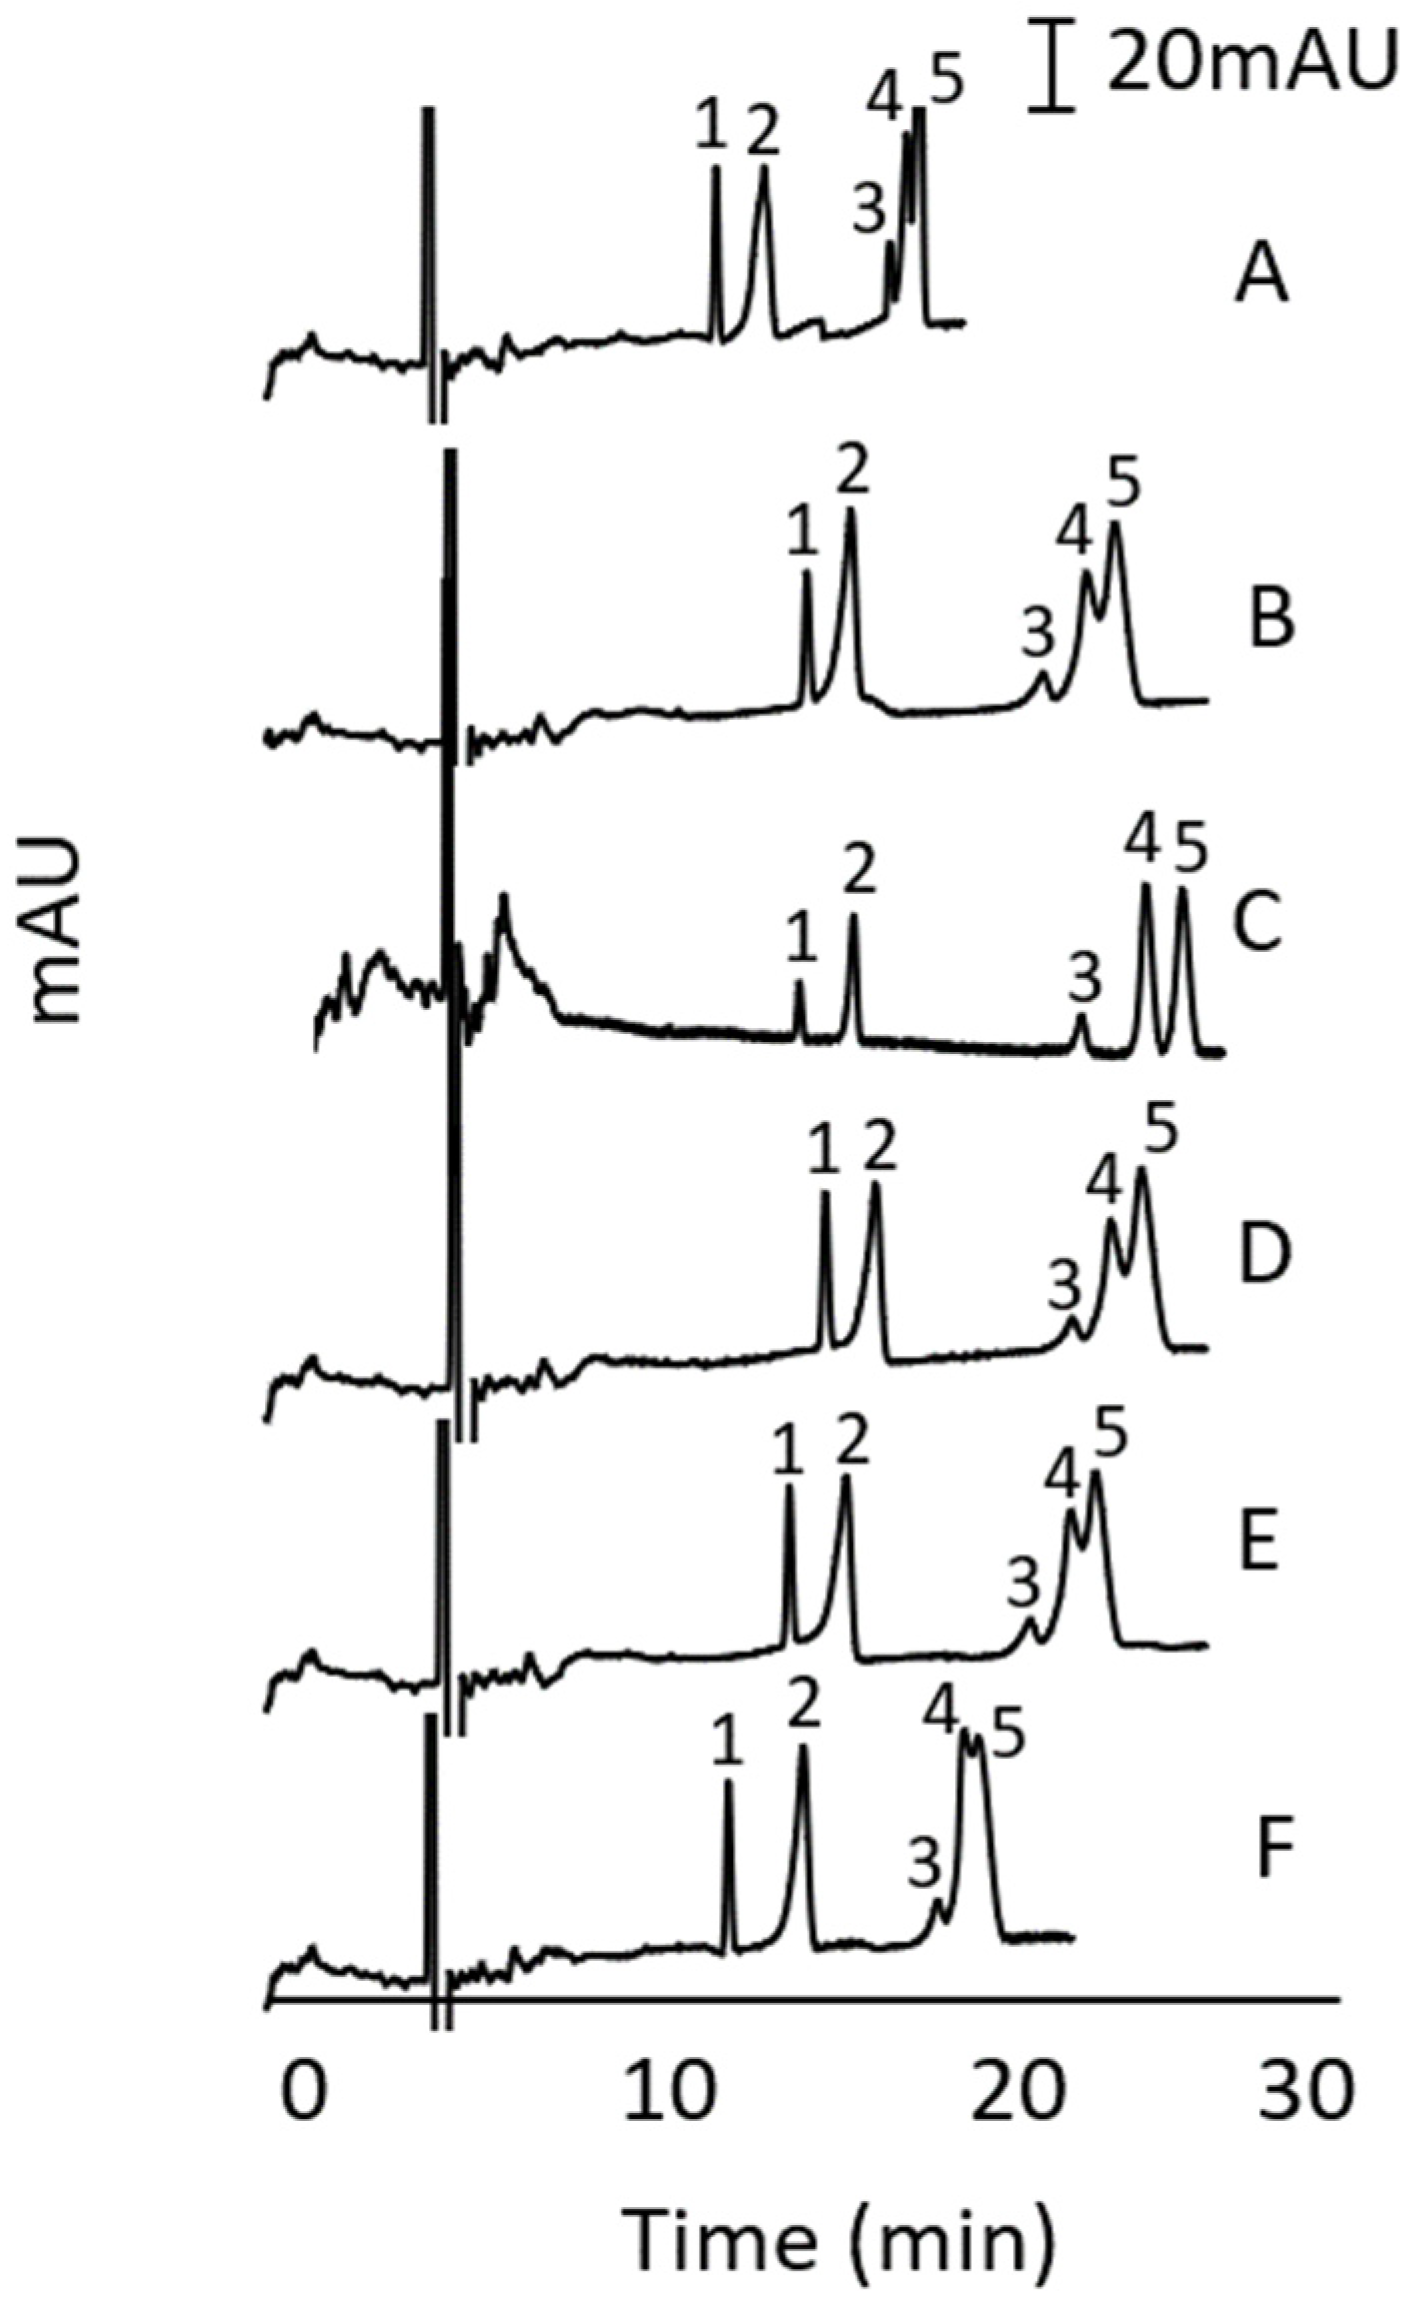
3.1. Reversed-Phase HPLC Method Development
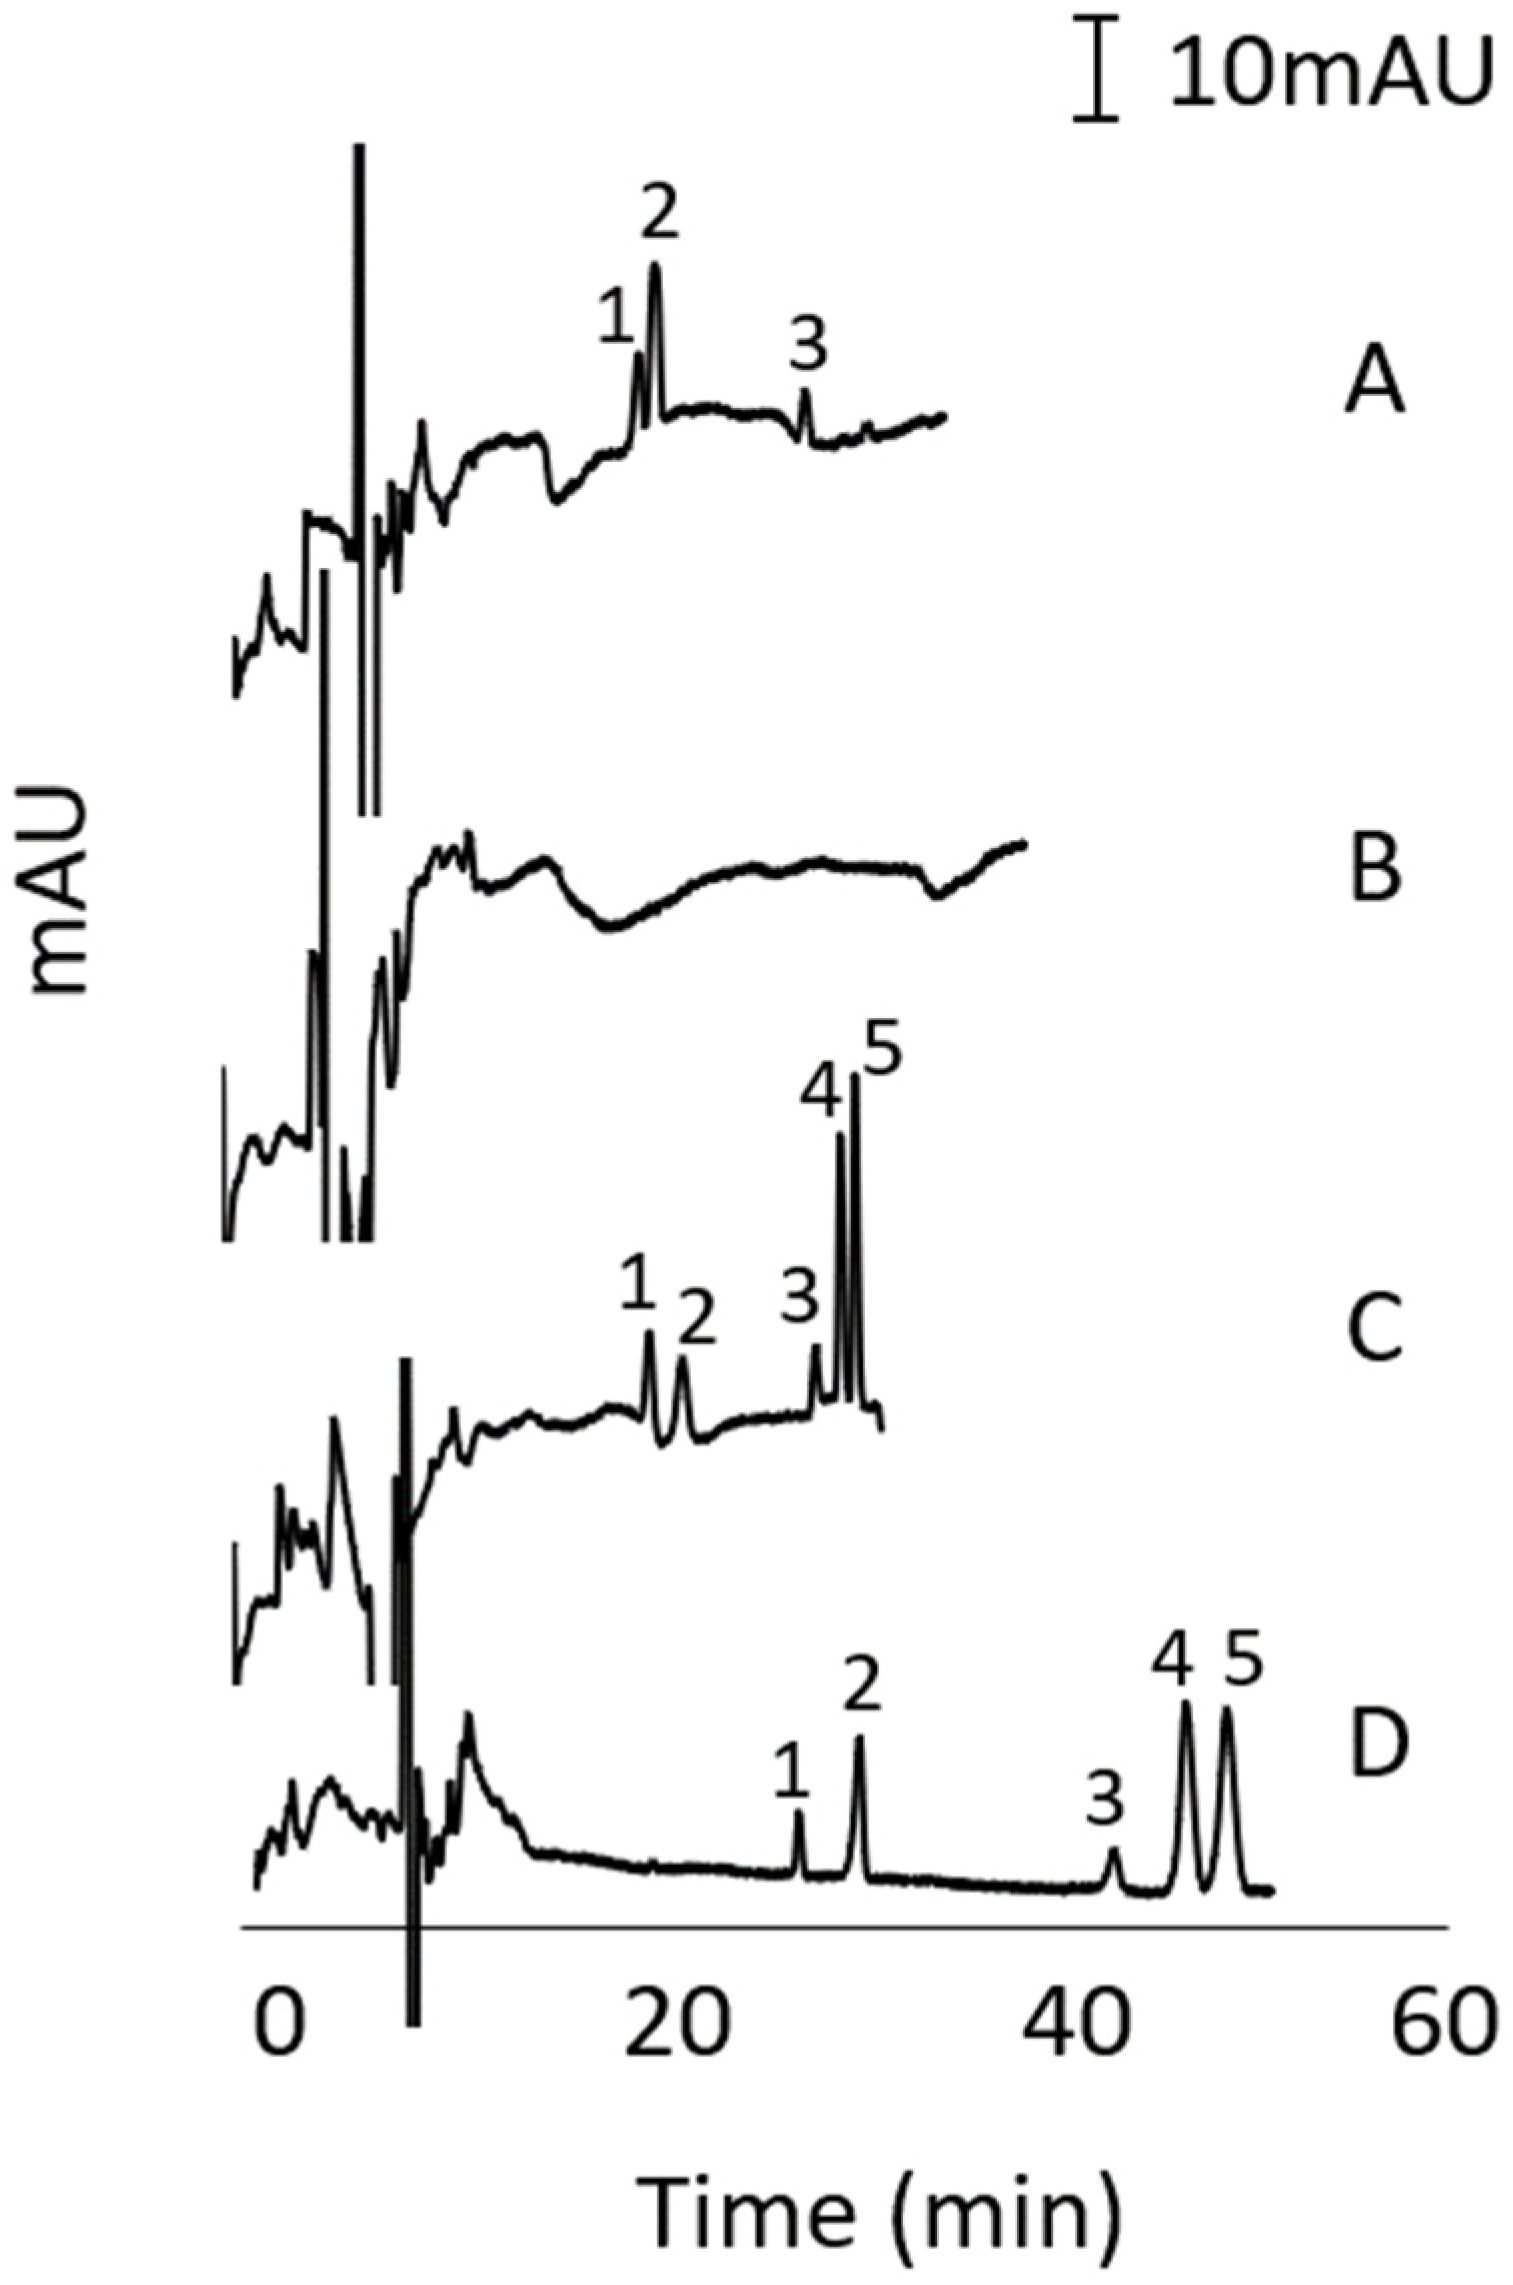
3.2. Stacking-MEKC Method Development
3.3. Stacking Method Development in MEKC
3.4. HPLC and Stacking-MEKC Comparison of Analytical Figures of Merit
3.4.1. Linearity
3.4.2. LOD and LOQ
3.4.3. Intra- and Inter-Day Repeatability
3.5. Optimisation of Sample Preparation via MeOH Extraction
3.6. Recovery
3.7. Method Application
4. Conclusions
Author Contributions
Funding
Conflicts of Interest
Sample Availability
Abbreviations
| HPLC | High performance liquid chromatography |
| MEKC | Micellar electrokinetic chromatography |
| GC | Gas chromatography |
References
- Martins, C.; Rueff, J.; Rodrigues, A.S. Genotoxic alkenylbenzene flavourings, a contribution to risk assessment. Food Chem. Toxicol. 2018, 118, 861–879. [Google Scholar] [CrossRef]
- Mohammadi Nejad, S.; Özgüneş, H.; Başaran, N. Pharmacological and Toxicological Properties of Eugenol. Turk. J. Pharm. Sci. 2017, 14, 201–206. [Google Scholar] [CrossRef] [PubMed]
- Scientific Committee on Food. Opinion of the Scientific Committee on Food on Estragole (1-Allyl-4-Methoxybenzene); European Commission Health and Consumer Protection Directorate-General: Brussel, Belgium, 2001; pp. 1–10. [Google Scholar]
- Scientific Committee on Food. Opinion of the Scientific Committee on Food on the Safety of the Presence of Safrole (1-Allyl-3,4-Methylene Dioxy Benzene) in Flavourings and Other Food Ingredients with Flavouring Properties; European Commission Health and Consumer Protection Directorate-General: Brussel, Belgium, 2002. [Google Scholar]
- Scientific Committee on Food; European Commission. Opinion of the Scientific Committee on Food on Methyleugenol (4-Allyl-1,2-Dimethoxybenzene); European Commission Health and Consumer Protection Directorate-General: Brussel, Belgium, 2001. [Google Scholar]
- Alajlouni, A.M.; Al-Malahmeh, A.J.; Isnaeni, F.N.; Wesseling, S.; Vervoort, J.; Rietjens, I.M.C.M. Level of Alkenylbenzenes in Parsley and Dill Based Teas and Associated Risk Assessment Using the Margin of Exposure Approach. J. Agric. Food Chem. 2016, 64, 8640–8646. [Google Scholar] [CrossRef] [PubMed]
- Alajlouni, A.M.; Al-Malahmeh, A.J.; Wesseling, S.; Kalli, M.; Vervoort, J.; Rietjens, I.M.C.M. Risk assessment of combined exposure to alkenylbenzenes through consumption of plant food supplements containing parsley and dill. Food Addit. Contam.-Part A Chem. Anal. Control Expo. Risk Assess. 2017, 34, 2201–2211. [Google Scholar] [CrossRef] [PubMed]
- Suparmi, S.; Wahidin, D.; Rietjens, I.M.C.M. Risk characterisation of constituents present in jamu to promote its safe use. Crit. Rev. Toxicol. 2021, 51, 183–191. [Google Scholar] [CrossRef]
- Choong, Y.M.; Lin, H.J. A rapid and simple gas chromatography method for direct determination of safrole in soft drinks. J. Food Drug Anal. 2001, 9, 27–32. [Google Scholar]
- Raffo, A.; D’Aloise, A.; Magrì, A.L.; Leclercq, C. Quantitation of tr-cinnamaldehyde, safrole and myristicin in cola-flavoured soft drinks to improve the assessment of their dietary exposure. Food Chem. Toxicol. 2013, 59, 626–635. [Google Scholar] [CrossRef] [PubMed]
- Ávila, M.; Zougagh, M.; Escarpa, A.; Ríos, Á. Determination of alkenylbenzenes and related flavour compounds in food samples by on-column preconcentration-capillary liquid chromatography. J. Chromatogr. A 2009, 1216, 7179–7185. [Google Scholar] [CrossRef] [PubMed]
- Lee, J.Y.; Park, W. Anti-inflammatory effect of myristicin on RAW 264.7 macrophages stimulated with polyinosinic-polycytidylic acid. Molecules 2011, 16, 7132–7142. [Google Scholar] [CrossRef] [PubMed]
- Woehrlin, F.; Fry, H.; Abraham, K.; Preiss-Weigert, A. Quantification of Flavoring Constituents in Cinnamon: High Variation of Coumarin in Cassia Bark from the German Retail Market and in Authentic Samples from Indonesia. J. Agric. Food Chem. 2010, 58, 10568–10575. [Google Scholar] [CrossRef]
- Khalil, A.A.; ur Rahman, U.; Khan, M.R.; Sahar, A.; Mehmood, T.; Khan, M. Essential oil eugenol: Sources, extraction techniques and nutraceutical perspectives. RSC Adv. 2017, 7, 32669–32681. [Google Scholar] [CrossRef]
- Environment Canada Health Canada. Benzenes, 1,2-Dimethoxy-4-(2-Propenyl)-(Methyl Eugenol); Environment Canada Health Canada: Ottawa, ON, Canada, 2010. [Google Scholar]
- Stein, U.; Greyer, H.; Hentschel, H. Nutmeg (myristicin) poisoning—report on a fatal case and a series of cases recorded by a poison information centre. Forensic Sci. Int. 2001, 118, 87–90. [Google Scholar] [CrossRef]
- Febrina, A.; Mutakin, M.; Lestari, K.; Levita, J. Determination of Safrole in Ethanol Extract of Nutmeg (Myristica fragrans Houtt) Using Reversed-Phase High Performance Liquid Chromatography. Int. J. Chem. 2014, 6. [Google Scholar] [CrossRef]
- Southwell, I.A.; Russell, M.F.; Davies, N.W. Detecting traces of methyl eugenol in essential oils: Tea tree oil, a case study. Flavour Fragr. J. 2011, 26, 336–340. [Google Scholar] [CrossRef]
- Cook, W.; Howard, A. The essential oil of Illicium anisatum Linn. Can. J. Chem. 2011, 44, 2461–2464. [Google Scholar] [CrossRef]
- National Toxicology Program. NTP Technical Report on the Toxicology Studies of Myristicin (CASRN 607-91-0) Administered by Gavage to F344/NTac Rats and B6C3F1/N Mice. In Toxicity Report 95; National Toxicology Program: Research Triangle Park, NC, USA, 2019. [Google Scholar]
- Marabini, L.; Neglia, L.; Monguzzi, E.; Galli, C.; Marinovich, M. Assessment of Toxicity of Myristicin and 1′-Hydroxymyristicin in HepG2 Cell Line. J. Pharmacol. Toxicol. 2017, 12, 170–179. [Google Scholar] [CrossRef][Green Version]
- Malhotra, S.; Singh, A.P. Medicinal Properties of Ginger (Zingiber Officinale Rosc.); NISCAIR-CSIR: New Delhi, India, 2003. [Google Scholar]
- Suparmi, S.; Ginting, A.J.; Mariyam, S.; Wesseling, S.; Rietjens, I.M.C.M. Levels of methyleugenol and eugenol in instant herbal beverages available on the Indonesian market and related risk assessment. Food Chem. Toxicol. 2019, 125, 467–478. [Google Scholar] [CrossRef]
- Farag, S.E.A.; Abo-Zeid, M. Degradation of the natural mutagenic compound safrole in spices by cooking and irradiation. Food/Nahr. 1997, 41, 359–361. [Google Scholar] [CrossRef]
- Zeller, A.; Rychlik, M. Impact of estragole and other odorants on the flavour of anise and tarragon. Flavour Fragr. J. 2007, 22, 105–113. [Google Scholar] [CrossRef]
- Eisenreich, A.; Götz, M.E.; Sachse, B.; Monien, B.H.; Herrmann, K.; Schäfer, B. Alkenylbenzenes in Foods: Aspects Impeding the Evaluation of Adverse Health Effects. Foods 2021, 10, 2139. [Google Scholar] [CrossRef] [PubMed]
- Wong, C.; Crystal, K.; Coats, J. Three molecules found in rosemary or nutmeg essential oils repel ticks (Dermacentor variabilis) more effectively than DEET in a no-human assay. Pest Manag. Sci. 2021, 77, 1348–1354. [Google Scholar] [CrossRef]
- Carlson, M.; Thompson, R. Liquid chromatographic determination of safrole in sassafras-derived herbal products. J. AOAC Int. 1997, 80, 1023–1028. [Google Scholar] [CrossRef] [PubMed]
- Batool, S.; Khera, R.A.; Hanif, M.A.; Ayub, M.A. Bay Leaf. Med. Plants South Asia 2020, 63–74. [Google Scholar] [CrossRef]
- Yahyaa, M.; Berim, A.; Nawade, B.; Ibdah, M.; Dudareva, N.; Ibdah, M. Biosynthesis of methyleugenol and methylisoeugenol in Daucus carota leaves: Characterization of eugenol/isoeugenol synthase and O-Methyltransferase. Phytochemistry 2019, 159, 179–189. [Google Scholar] [CrossRef] [PubMed]
- Carman, A.S.; Kuan, S.S.; Francis, O.J.; Ware, G.M.; Luedtke, A.E. Rapid Screening Method for Determining Myristicin in Fresh and Frozen Carrots by Gas Chromatography. Anal. Lett. 1985, 18, 1167–1175. [Google Scholar] [CrossRef]
- Rivera-Pérez, A.; López-Ruiz, R.; Romero-González, R.; Garrido Frenich, A. A new strategy based on gas chromatography–high resolution mass spectrometry (GC–HRMS-Q-Orbitrap) for the determination of alkenylbenzenes in pepper and its varieties. Food Chem. 2020, 321, 126727. [Google Scholar] [CrossRef] [PubMed]
- Dang, H.N.P.; Quirino, J.P. Analytical separation of carcinogenic and genotoxic alkenylbenzenes in foods and related products (2010–2020). Toxins 2021, 13, 387. [Google Scholar] [CrossRef] [PubMed]
- Terabe, S.; Otsuka, K.; Ichikawa, K.; Tsuchiya, A.; Ando, T. Electrokinetic Separations with Micellar Solutions and Open-Tubular Capillaries. Anal. Chem. 1984, 56, 111–113. [Google Scholar] [CrossRef]
- Yu, R.B.; Quirino, J.P. Ionic liquids in electrokinetic chromatography. J. Chromatogr. A 2021, 1637. [Google Scholar] [CrossRef] [PubMed]
- Huhn, C.; Pütz, M.; Pyell, U. Separation of very hydrophobic analytes by micellar electrokinetic chromatography. III. Characterization and optimization of the composition of the separation electrolyte using carbon number equivalents. Electrophoresis 2008, 29, 783–795. [Google Scholar] [CrossRef]
- Ranasinghe, M.; Quirino, J.P. Can we replace liquid chromatography with the greener capillary electrophoresis? Curr. Opin. Green Sustain. Chem. 2021, 31. [Google Scholar] [CrossRef]
- Laing, T.D.; Marenco, A.J.; Moore, D.M.; Moore, G.J.; Mah, D.C.W.; Lee, W.E. Capillary electrophoresis laser-induced fluorescence for screening combinatorial peptide libraries in assays of botulinum neurotoxin A. J. Chromatogr. B Anal. Technol. Biomed. Life Sci. 2006, 843, 240–246. [Google Scholar] [CrossRef] [PubMed]
- Ranasinghe, M.; Karunaratne, H.; Quirino, J.P. Sweeping-micellar electrokinetic chromatography versus reversed phase liquid chromatography for the determination of coumarin in curry. J. Chromatogr. A 2021, 1657. [Google Scholar] [CrossRef]
- Simó, C.; Moreno-Arribas, M.V.; Cifuentes, A. Ion-trap versus time-of-flight mass spectrometry coupled to capillary electrophoresis to analyze biogenic amines in wine. J. Chromatogr. A 2008, 1195, 150–156. [Google Scholar] [CrossRef] [PubMed]
- Quirino, J.P.; Terabe, S. Exceeding 5000-fold concentration of dilute analytes in micellar electrokinetic chromatography. Science 1998, 282, 465–468. [Google Scholar] [CrossRef] [PubMed]
- Quirino, J.P.; Terabe, S. Sweeping of analyte zones in electrokinetic chromatography. Anal. Chem. 1999, 71, 1638–1644. [Google Scholar] [CrossRef]
- Quirino, J.P.; Terabe, S. On-line concentration of neutral analytes for micellar electrokinetic chromatography. 5. Field-enhanced sample injection with reverse migrating micelles. Anal. Chem. 1998, 70, 1893–1901. [Google Scholar] [CrossRef]
- Liu, Z.; Sam, P.; Sirimanne, S.R.; McClure, P.C.; Grainger, J.; Patterson Jr, D.G. Field-amplified sample stacking in micellar electrokinetic chromatography for on-column sample concentration of neutral molecules. J. Chromatogr. A 1994, 673, 125–132. [Google Scholar] [CrossRef]
- Gursale, A.; Dighe, V.; Parekh, G. Simultaneous Quantitative Determination of Cinnamaldehyde and Methyl Eugenol From Stem Bark of Cinnamomum zeylanicum Blume Using RP-HPLC. J. Chromatogr. Sci. 2010, 48, 59–62. [Google Scholar] [CrossRef]


| Plants | Alkenylbenzenes | Food | ||||
|---|---|---|---|---|---|---|
 Eugenol Eugenol |  Methyleugenol Methyleugenol |  Myristicin Myristicin |  Safrole Safrole |  Estragole Estragole | ||
| cloves | 28.5 ± 0.4 mg/g [11] | Detected † [12] | Detected † [12] | various curries, jams, cooking rice | ||
| cinnamon | 0.19–1.65 g/kg [13] | Detected † [12] | various curries, churros, donut, various pastries | |||
| nutmeg | 0.32 mg/g [14] | 8 mg/g [15] | 280–420 mg/kg [16] | 109.8 mg/mL of extract [17] | various curries, alfredo pasta, soufflés, beef stew, various baked products | |
| sweet/holy basil, basil | 540 mg/kg [11] | Detected † [18] | Detected † [12] | 710 mg/kg [11] | various pesto sauces, Thai noodle and curry, caprese salad | |
| star anise | 98 mg/g [19] | Detected † [12] | 66 mg/g [19] | Thai noodle, Chinese soups and stews | ||
| dill | 28.1–76.3 mg/g [20] | various curries and soups, salad dressing, sandwich fillings | ||||
| celery | Detected † [21] | chicken noodle soup, various stir fry dishes, various vegetarian dishes | ||||
| ginger | Detected † [22] | 14.0 ± 1.6 µg/g [23] | 500 ± 36 mg/kg [24] | various teas, sushi, congee, various soups, various curries | ||
| tarragon | Detected † [25] | 0.5–28.9% v/v [26] | 17–75% v/v [26] | pasta, mojito, Béarnaise sauce | ||
| rosemary | Detected † [27] | various soups, salads, stews, and pasta sauces | ||||
| thyme | 0.021 mg/g [14] | detected† [28] | seasoned roasted vegetables, various pasta sauces and soups, pizza toppings | |||
| bay leaves | 110–120 mg/g [29] | 90–120 mg/g [29] | beef stew, pate, various curries and soups | |||
| carrot | Detected † [30] | 1.1–16.6 µg/g [31] | various soups, salads, noodle dishes, and curries, cakes, salads, coleslaw | |||
| pepper | 11–120 mg/kg [32] | 0.5–20.1 mg/kg [32] | 0.2–6.1 mg/kg [32] | 955 ± 80 mg/kg [24] | 2.2–45.7 mg/kg [32] | various pasta and curry dishes, and sauces |
| fennel | Detected † [12] | 2.0–3.0% v/v [26] | various pasta dishes, various salads and slaws, sausages | |||
| Column. | Specifications (Particle Size) | Flow Rate (mL/min) | Injection Volume (µL) |
|---|---|---|---|
| Thermo Fischer Hypersil GOLD C18 | 50 mm × 2.1 mm i.d. (3 µm) | 0.2 | 5 |
| Acclaim C18 | 100 mm × 2.1 mm i.d. (2.2 µm) | 0.5 | 10 |
| Phenomenex GEMINI C18 | 150 mm × 4.6 mm i.d. (5 µm) | 1.0 | 20 |
| Method | Eugenol | Methyleugenol | Myristicin | Safrole | Estragole | |
|---|---|---|---|---|---|---|
| HPLC | concentration range (µg/mL) | 0.18–12 | 0.07–4.3 | 0.79–50 | 0.36–23 | 0.73–46 |
| slope of the line | 251.27 | 1005.70 | 84.26 | 261.06 | 108.30 | |
| intercept of the line | −0.0169 | −0.0171 | −0.0162 | −0.0310 | −0.0362 | |
| correlation coefficient (R2) | 0.9970 | 0.9967 | 0.9966 | 0.9968 | 0.9965 | |
| LOD (µg/mL) | 0.09 | 0.03 | 0.39 | 0.18 | 0.36 | |
| LOQ (µg/mL) | 0.18 | 0.07 | 0.79 | 0.36 | 0.73 | |
| stacking | concentration range (µg/mL) | 1.6–50 | 1.5–24 | 3.7–29 | 7.1–21 | 6.0–37 |
| MEKC | slope of the line | 8590.2 | 6087.6 | 595.87 | 3020.2 | 1537.7 |
| intercept of the line | −13.801 | +3.279 | +0.374 | −22.81 | −10.36 | |
| correlation coefficient (R2) | 0.9972 | 0.9947 | 0.9964 | 0.9724 | 0.9975 | |
| LOD (µg/mL) | 0.41 | 0.38 | 1.8 | 2.7 | 4.3 | |
| LOQ (µg/mL) | 1.6 | 1.5 | 3.7 | 7.1 | 6.0 |
| Method | Analyte | Concentration Levels (µg/mL) | % RSD (Retention Time 1/Migration Time 2) | % RSD (Peak Area/Corrected Peak Area 5) | |||
|---|---|---|---|---|---|---|---|
| Intra-Day (n = 10) 3 | Inter-Day (n = 15) 4 | Intra-Day (n = 10) 3 | 1nter-Day (n = 15) 4 | ||||
| HPLC | LOQ | Eugenol | 0.2 | 0.2 | 0.4 | 4.0 | 3.3 |
| methyleugenol | 0.1 | 0.1 | 0.4 | 3.8 | 3.9 | ||
| myristicin | 0.8 | 0.2 | 0.5 | 0.0 | 0.0 | ||
| safrole | 0.4 | 0.1 | 0.4 | 0.0 | 3.3 | ||
| estragole | 0.7 | 0.1 | 0.4 | 3.2 | 1.7 | ||
| 8 × LOQ | eugenol | 1.4 | 0.4 | 0.3 | 0.7 | 1.1 | |
| methyleugenol | 5.4 | 0.4 | 0.3 | 0.5 | 0.9 | ||
| myristicin | 6.3 | 0.3 | 0.3 | 0.0 | 0.1 | ||
| safrole | 2.9 | 0.3 | 0.3 | 0.0 | 3.5 | ||
| estragole | 5.8 | 0.3 | 0.3 | 0.5 | 7.0 | ||
| stacking-MEKC | LOQ | eugenol | 1.6 | 2.9 | 4.4 | 0.6 | 0.8 |
| methyleugenol | 1.5 | 2.9 | 5.2 | 0.4 | 0.3 | ||
| myristicin | 3.7 | 2.4 | 2.0 | 1.1 | 3.0 | ||
| safrole | 7.1 | 1.5 | 1.4 | 3.4 | 3.6 | ||
| estragole | 6.0 | 1.8 | 1.6 | 5.0 | 6.3 | ||
| 8 × LOQ | eugenol | 13.0 | 1.3 | 1.6 | 4.8 | 1.1 | |
| methyleugenol | 6.1 | 3.2 | 1.7 | 0.7 | 1.9 | ||
| myristicin | 15.0 | 1.9 | 3.8 | 0.4 | 2.1 | ||
| safrole | 11.0 | 1.4 | 1.9 | 4.4 | 6.1 | ||
| estragole | 18.0 | 2.4 | 2.5 | 4.8 | 7.8 | ||
| Analyte | Sample Concentration (µg/mL) | Added Concentration (µg/mL) | Nominal Concentration (µg/mL) | Found Concentration (µg/mL) | % Recovery |
|---|---|---|---|---|---|
| eugenol | 1.08 | 0.54 | 1.62 | 1.32 ± 0.00 | 81.5 ± 0.0 |
| 1.08 | 2.16 | 1.79 ± 0.00 | 82.9 ± 0.0 | ||
| 2.16 | 3.24 | 2.75 ± 0.01 | 84.9 ± 0.0 | ||
| 4.32 | 5.40 | 4.92 ± 0.00 | 91.1 ± 0.0 | ||
| 8.64 | 9.72 | 8.02 ± 0.01 | 82.5 ± 0.0 | ||
| 17.28 | 18.36 | 16.19 ± 0.04 | 88.2 ± 0.0 | ||
| 34.56 | 35.64 | 24.73 ± 0.06 | 69.4 ± 0.1 | ||
| methyleugenol | 0 | 0.21 | 0.21 | 0.12 ± 0.00 | 57.1 ± 0.0 |
| 0.42 | 0.42 | 0.25 ± 0.00 | 59.5 ± 0.0 | ||
| 0.84 | 0.84 | 0.56 ± 0.01 | 66.7 ± 0.0 | ||
| 1.68 | 1.68 | 1.25 ± 0.00 | 74.4 ± 0.0 | ||
| 3.36 | 3.36 | 2.46 ± 0.01 | 73.2 ± 0.0 | ||
| 6.72 | 6.72 | 4.18 ± 0.04 | 62.2 ± 0.0 | ||
| 13.44 | 13.44 | 7.72 ± 0.07 | 57.4 ± 0.1 | ||
| myristicin | 0 | 2.37 | 2.37 | 1.93 ± 0.00 | 81.4 ± 0.0 |
| 4.74 | 4.74 | 2.98 ± 0.00 | 62.9 ± 0.0 | ||
| 9.48 | 9.48 | 6.38 ± 0.00 | 67.3 ± 0.0 | ||
| 18.96 | 18.96 | 12.72 ± 0.03 | 67.1 ± 0.0 | ||
| 37.92 | 37.92 | 22.22 ± 0.01 | 58.6 ± 0.0 | ||
| 75.84 | 75.84 | 47.66 ± 0.03 | 62.8 ± 0.0 | ||
| 151.68 | 151.68 | 95.85 ± 0.05 | 63.2 ± 0.1 | ||
| safrole | 0 | 1.08 | 1.08 | 0.84 ± 0.00 | 77.8 ± 0.0 |
| 2.16 | 2.16 | 1.38 ± 0.01 | 63.9 ± 0.0 | ||
| 4.32 | 4.32 | 2.76 ± 0.00 | 63.9 ± 0.0 | ||
| 8.64 | 8.64 | 5.63 ± 0.03 | 65.2 ± 0.0 | ||
| 17.28 | 17.28 | 10.32 ± 0.03 | 59.7 ± 0.0 | ||
| 34.56 | 34.56 | 23.37 ± 0.04 | 67.6 ± 0.0 | ||
| 69.12 | 69.12 | 45.55 ± 0.07 | 65.9 ± 0.1 | ||
| estragole | 0.59 | 2.19 | 2.78 | 2.06 ± 0.00 | 74.1 ± 0.0 |
| 4.38 | 4.97 | 3.83 ± 0.01 | 77.1 ± 0.0 | ||
| 8.76 | 9.35 | 7.07 ± 0.01 | 75.6 ± 0.0 | ||
| 17.52 | 18.11 | 14.00 ± 0.02 | 77.3 ± 0.0 | ||
| 35.04 | 35.63 | 27.68 ± 0.02 | 77.7 ± 0.0 | ||
| 70.08 | 70.67 | 56.14 ± 0.05 | 79.4 ± 0.1 | ||
| 140.16 | 140.75 | 106.17 ± 0.06 | 75.4 ± 0.1 |
| Sample | Amount Found (mg/g) | ||||
|---|---|---|---|---|---|
| Eugenol | Methyleugenol | Myristicin | Safrole | Estragole | |
| basil leaves | 0.27 ± 0.01 | 0.07 ± 0.01 | ND | ND | 0.72 ± 0.11 |
| Galiko basil sauce | 0.12 ± 0.01 | 0.004 ± 0.00 | ND | ND | 0.07 ± 0.01 |
| cloves | 8.71 ± 0.09 | ND | ND | ND | ND |
Publisher’s Note: MDPI stays neutral with regard to jurisdictional claims in published maps and institutional affiliations. |
© 2021 by the authors. Licensee MDPI, Basel, Switzerland. This article is an open access article distributed under the terms and conditions of the Creative Commons Attribution (CC BY) license (https://creativecommons.org/licenses/by/4.0/).
Share and Cite
Dang, H.N.P.; Quirino, J.P. High Performance Liquid Chromatography versus Stacking-Micellar Electrokinetic Chromatography for the Determination of Potentially Toxic Alkenylbenzenes in Food Flavouring Ingredients. Molecules 2022, 27, 13. https://doi.org/10.3390/molecules27010013
Dang HNP, Quirino JP. High Performance Liquid Chromatography versus Stacking-Micellar Electrokinetic Chromatography for the Determination of Potentially Toxic Alkenylbenzenes in Food Flavouring Ingredients. Molecules. 2022; 27(1):13. https://doi.org/10.3390/molecules27010013
Chicago/Turabian StyleDang, Huynh N. P., and Joselito P. Quirino. 2022. "High Performance Liquid Chromatography versus Stacking-Micellar Electrokinetic Chromatography for the Determination of Potentially Toxic Alkenylbenzenes in Food Flavouring Ingredients" Molecules 27, no. 1: 13. https://doi.org/10.3390/molecules27010013
APA StyleDang, H. N. P., & Quirino, J. P. (2022). High Performance Liquid Chromatography versus Stacking-Micellar Electrokinetic Chromatography for the Determination of Potentially Toxic Alkenylbenzenes in Food Flavouring Ingredients. Molecules, 27(1), 13. https://doi.org/10.3390/molecules27010013