
Identification of New Non-BBB Permeable Tryptophan Hydroxylase Inhibitors for Treating Obesity and Fatty Liver Disease

 , , , , , ,
  ,
,
Abstract
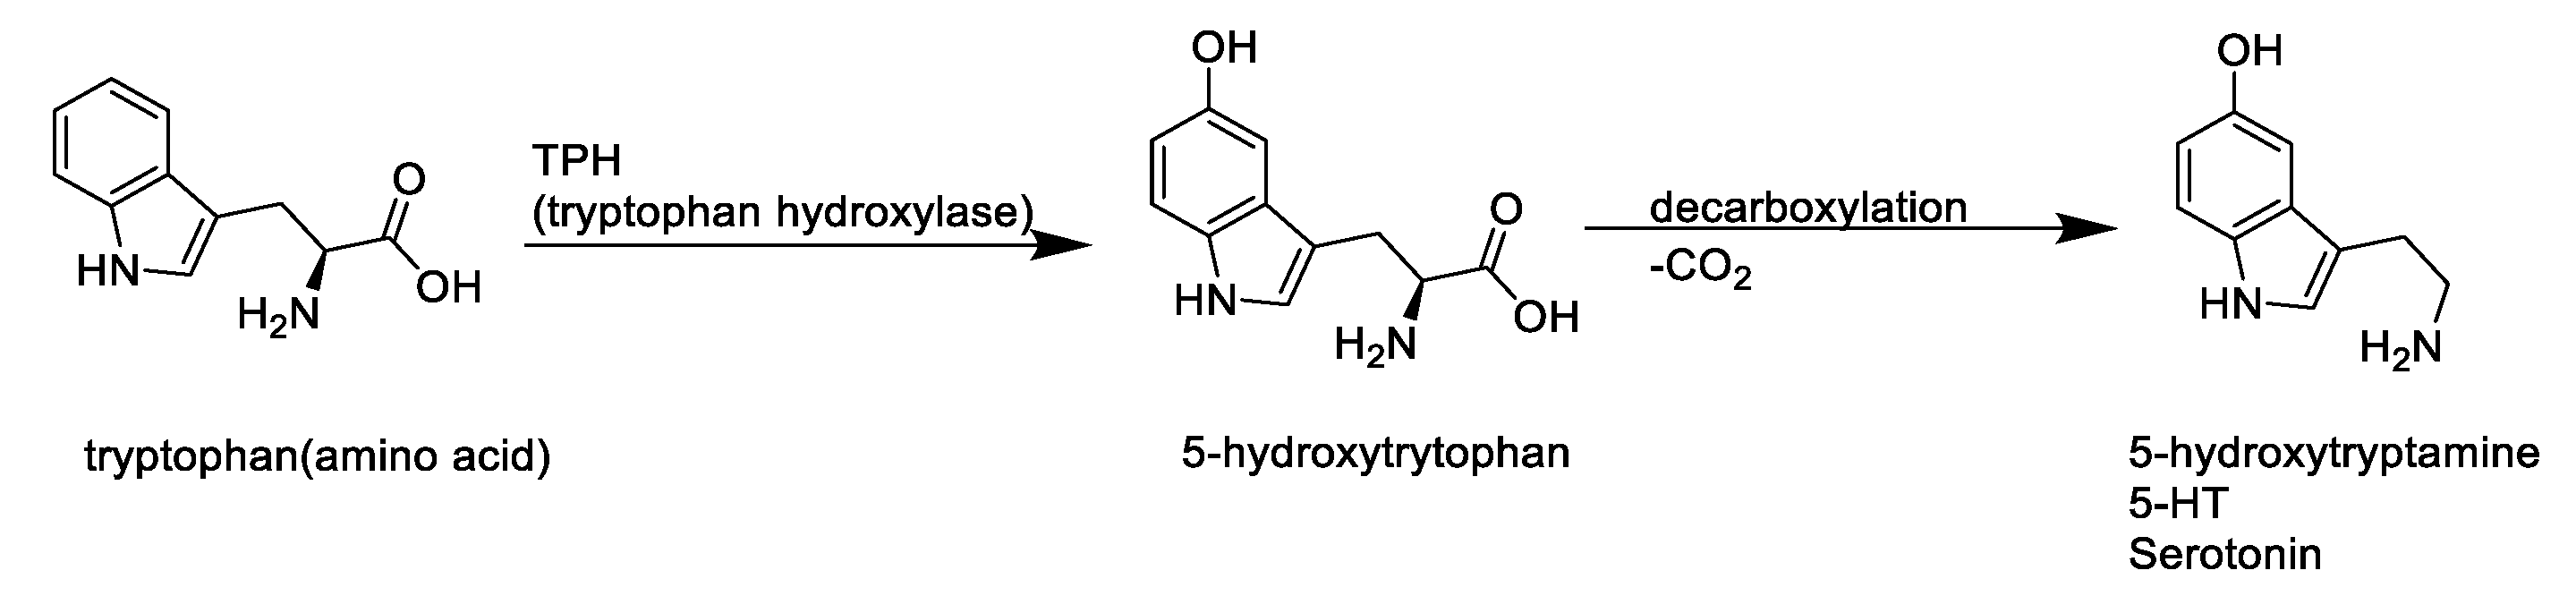
:1. Introduction
2. Results and Discussion
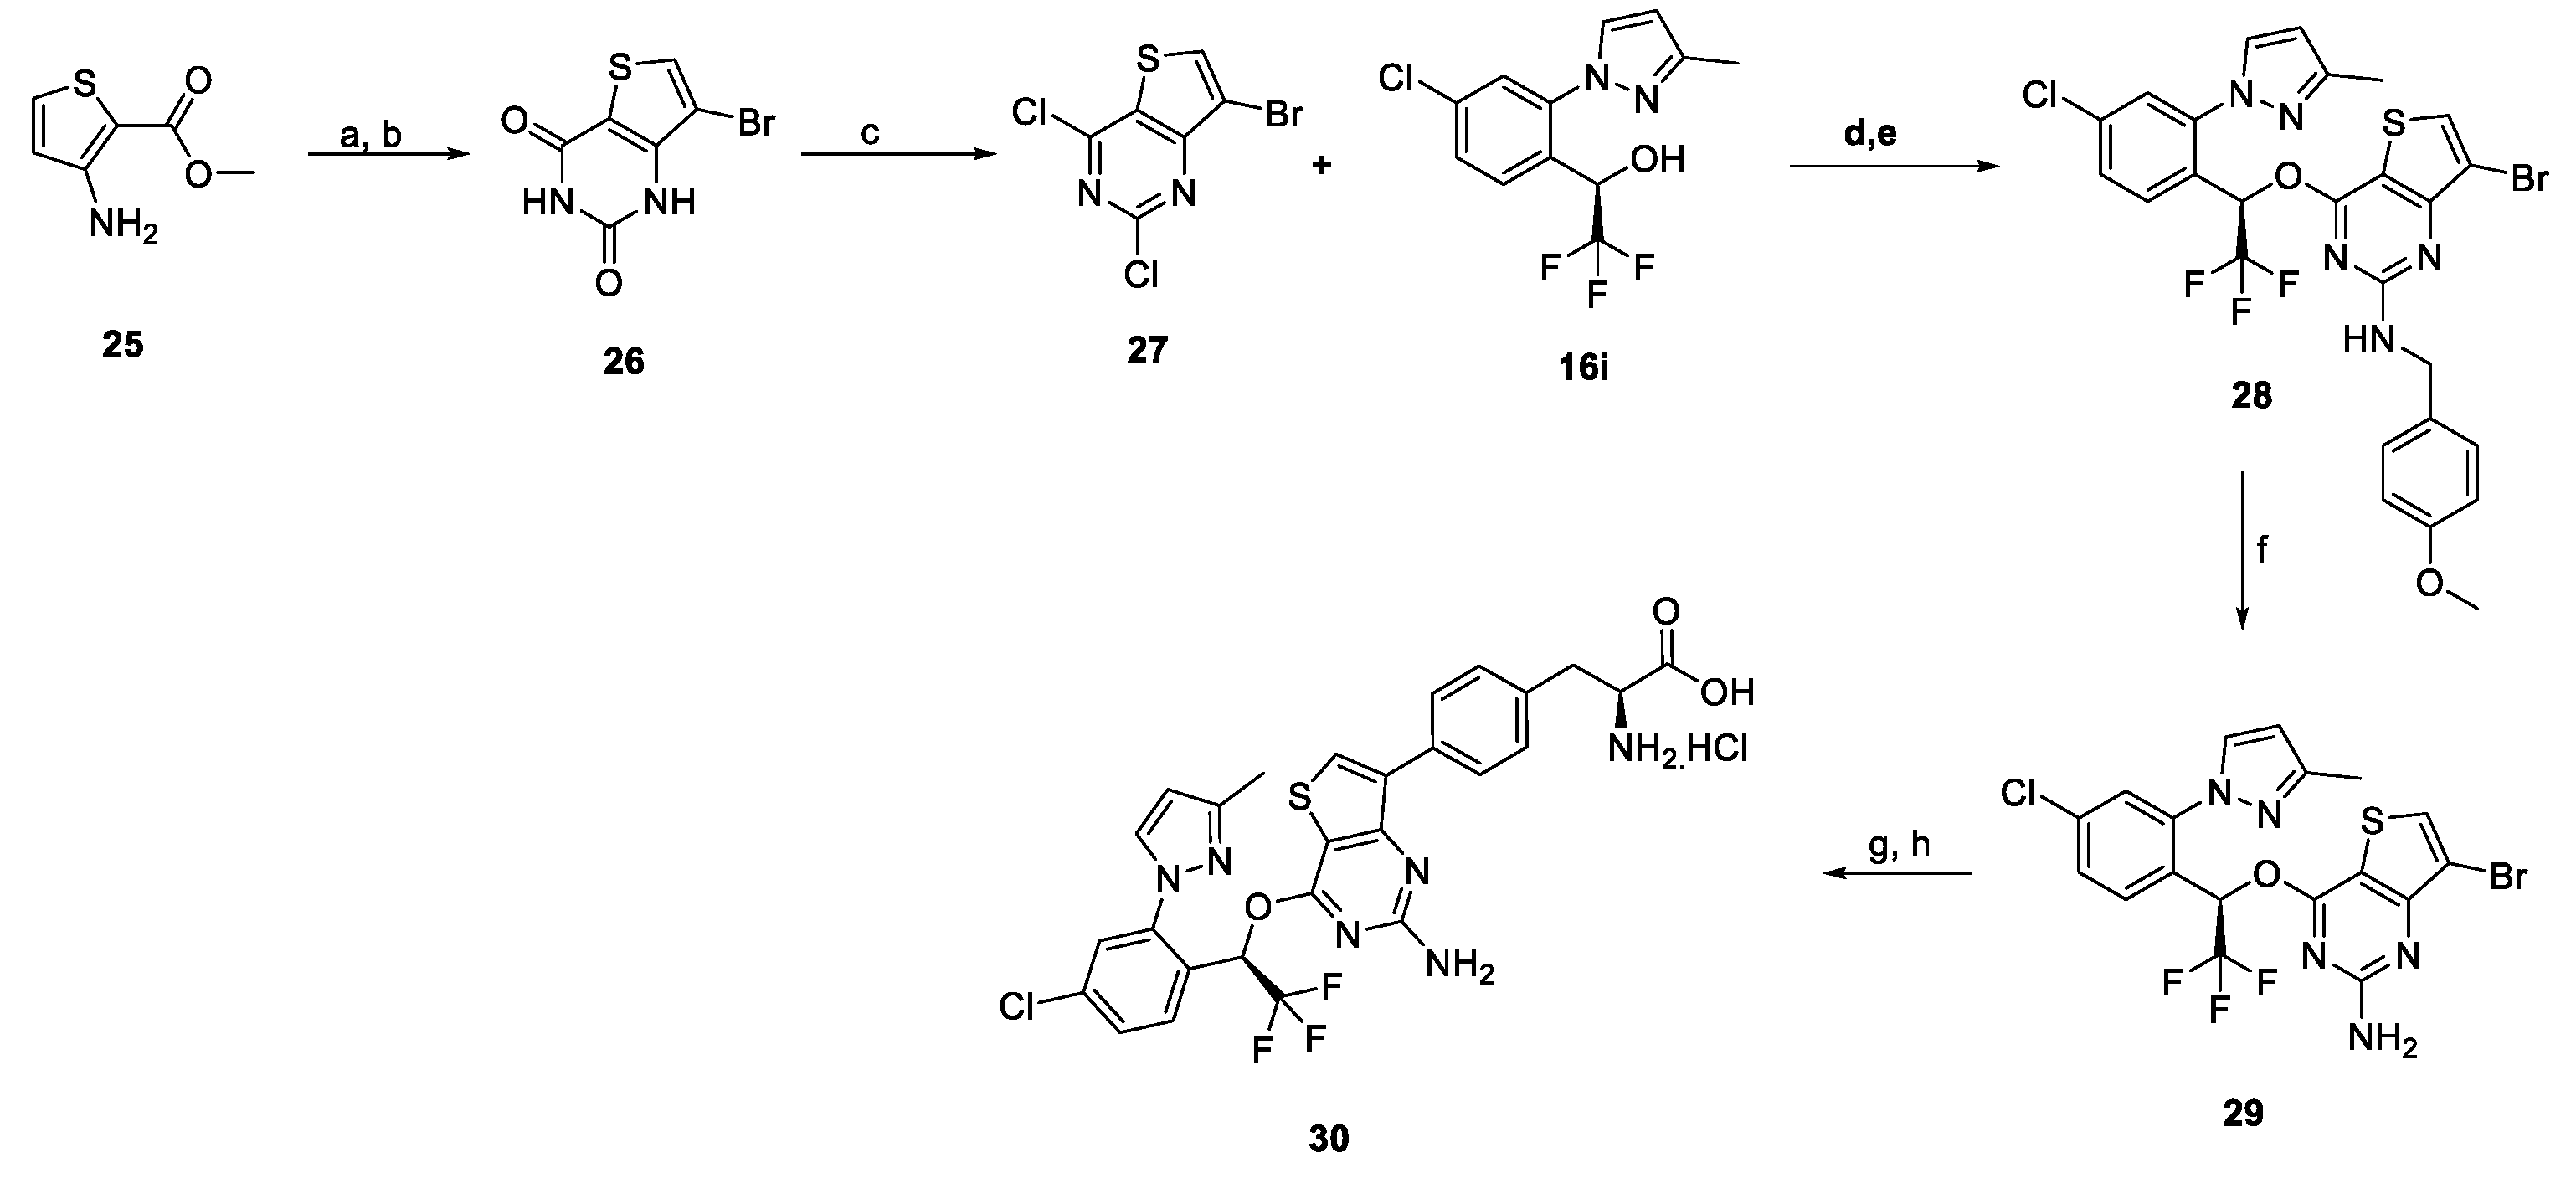
2.1. Chemistry
2.2. Biological Evaluations
3. Experimental Section
3.1. Chemistry
3.2. Synthesis of (S)-2-amino-3-(4-(4-((R)-1-(4-chloro-2-(3-methyl-1H-pyrazol-1-yl)phenyl)-2,2,2-trifluoroethoxy)thieno[3,2-d]pyrimidin-7-yl)phenyl)propanoic acid hydrochloride (18i)
3.2.1. Ethyl (S)-2-((tert-butoxycarbonyl)amino)-3-(4-(4-((R)-1-(4-chloro-2-(3-methyl-1H-pyrazol-1-yl)phenyl)-2,2,2-trifluoroethoxy)thieno[3,2-d]pyrimidin-7-yl)phenyl)propanoate (17i)
3.2.2. (S)-2-Amino-3-(4-(4-((R)-1-(4-chloro-2-(3-methyl-1H-pyrazol-1-yl)phenyl)-2,2,2-trifluoro ethoxy)thieno[3,2-d]pyrimidin-7-yl)phenyl)propanoic acid hydrochloride (18i)
3.3. Synthesis of ethyl (S)-2-amino-3-(4-(4-((R)-1-(4-chloro-2-(3-methyl-1H-pyrazol-1-yl)phenyl)-2,2,2-trifluoroethoxy)thieno[3,2-d]pyrimidin-7-yl)phenyl)propanoate hydrochloride (19)
3.4. Synthesis of ethyl (S)-2-amino-3-(4-(4-((R)-1-(4-chloro-2-(3-methyl-1H-pyrazol-1-yl)phenyl)-2,2,2-trifluoroethoxy)thieno[3,2-d]pyrimidin-7-yl)phenyl)propanoate (20)
3.5. Synthesis of ethyl (S)-2-amino-3-(4-(4-((R)-1-(4-chloro-2-(3-methyl-1H-pyrazol-1-yl)phenyl)-2,2,2-trifluoroethoxy)thieno[3,2-d]pyrimidin-7-yl)phenyl)propanoate hippurate (21)
3.6. Biology
3.6.1. Microsomal Activity
3.6.2. CYP Inhibition Assay
3.6.3. The hERG Inhibition Activity
3.6.4. Blood Brain Barriers PK
3.6.5. Parallel Artificial Membrane Permeability Assay (PAMPA)
3.6.6. Pharmacokinetic Study
3.6.7. LC-MS/MS Analysis
3.6.8. In Vitro Screening Test
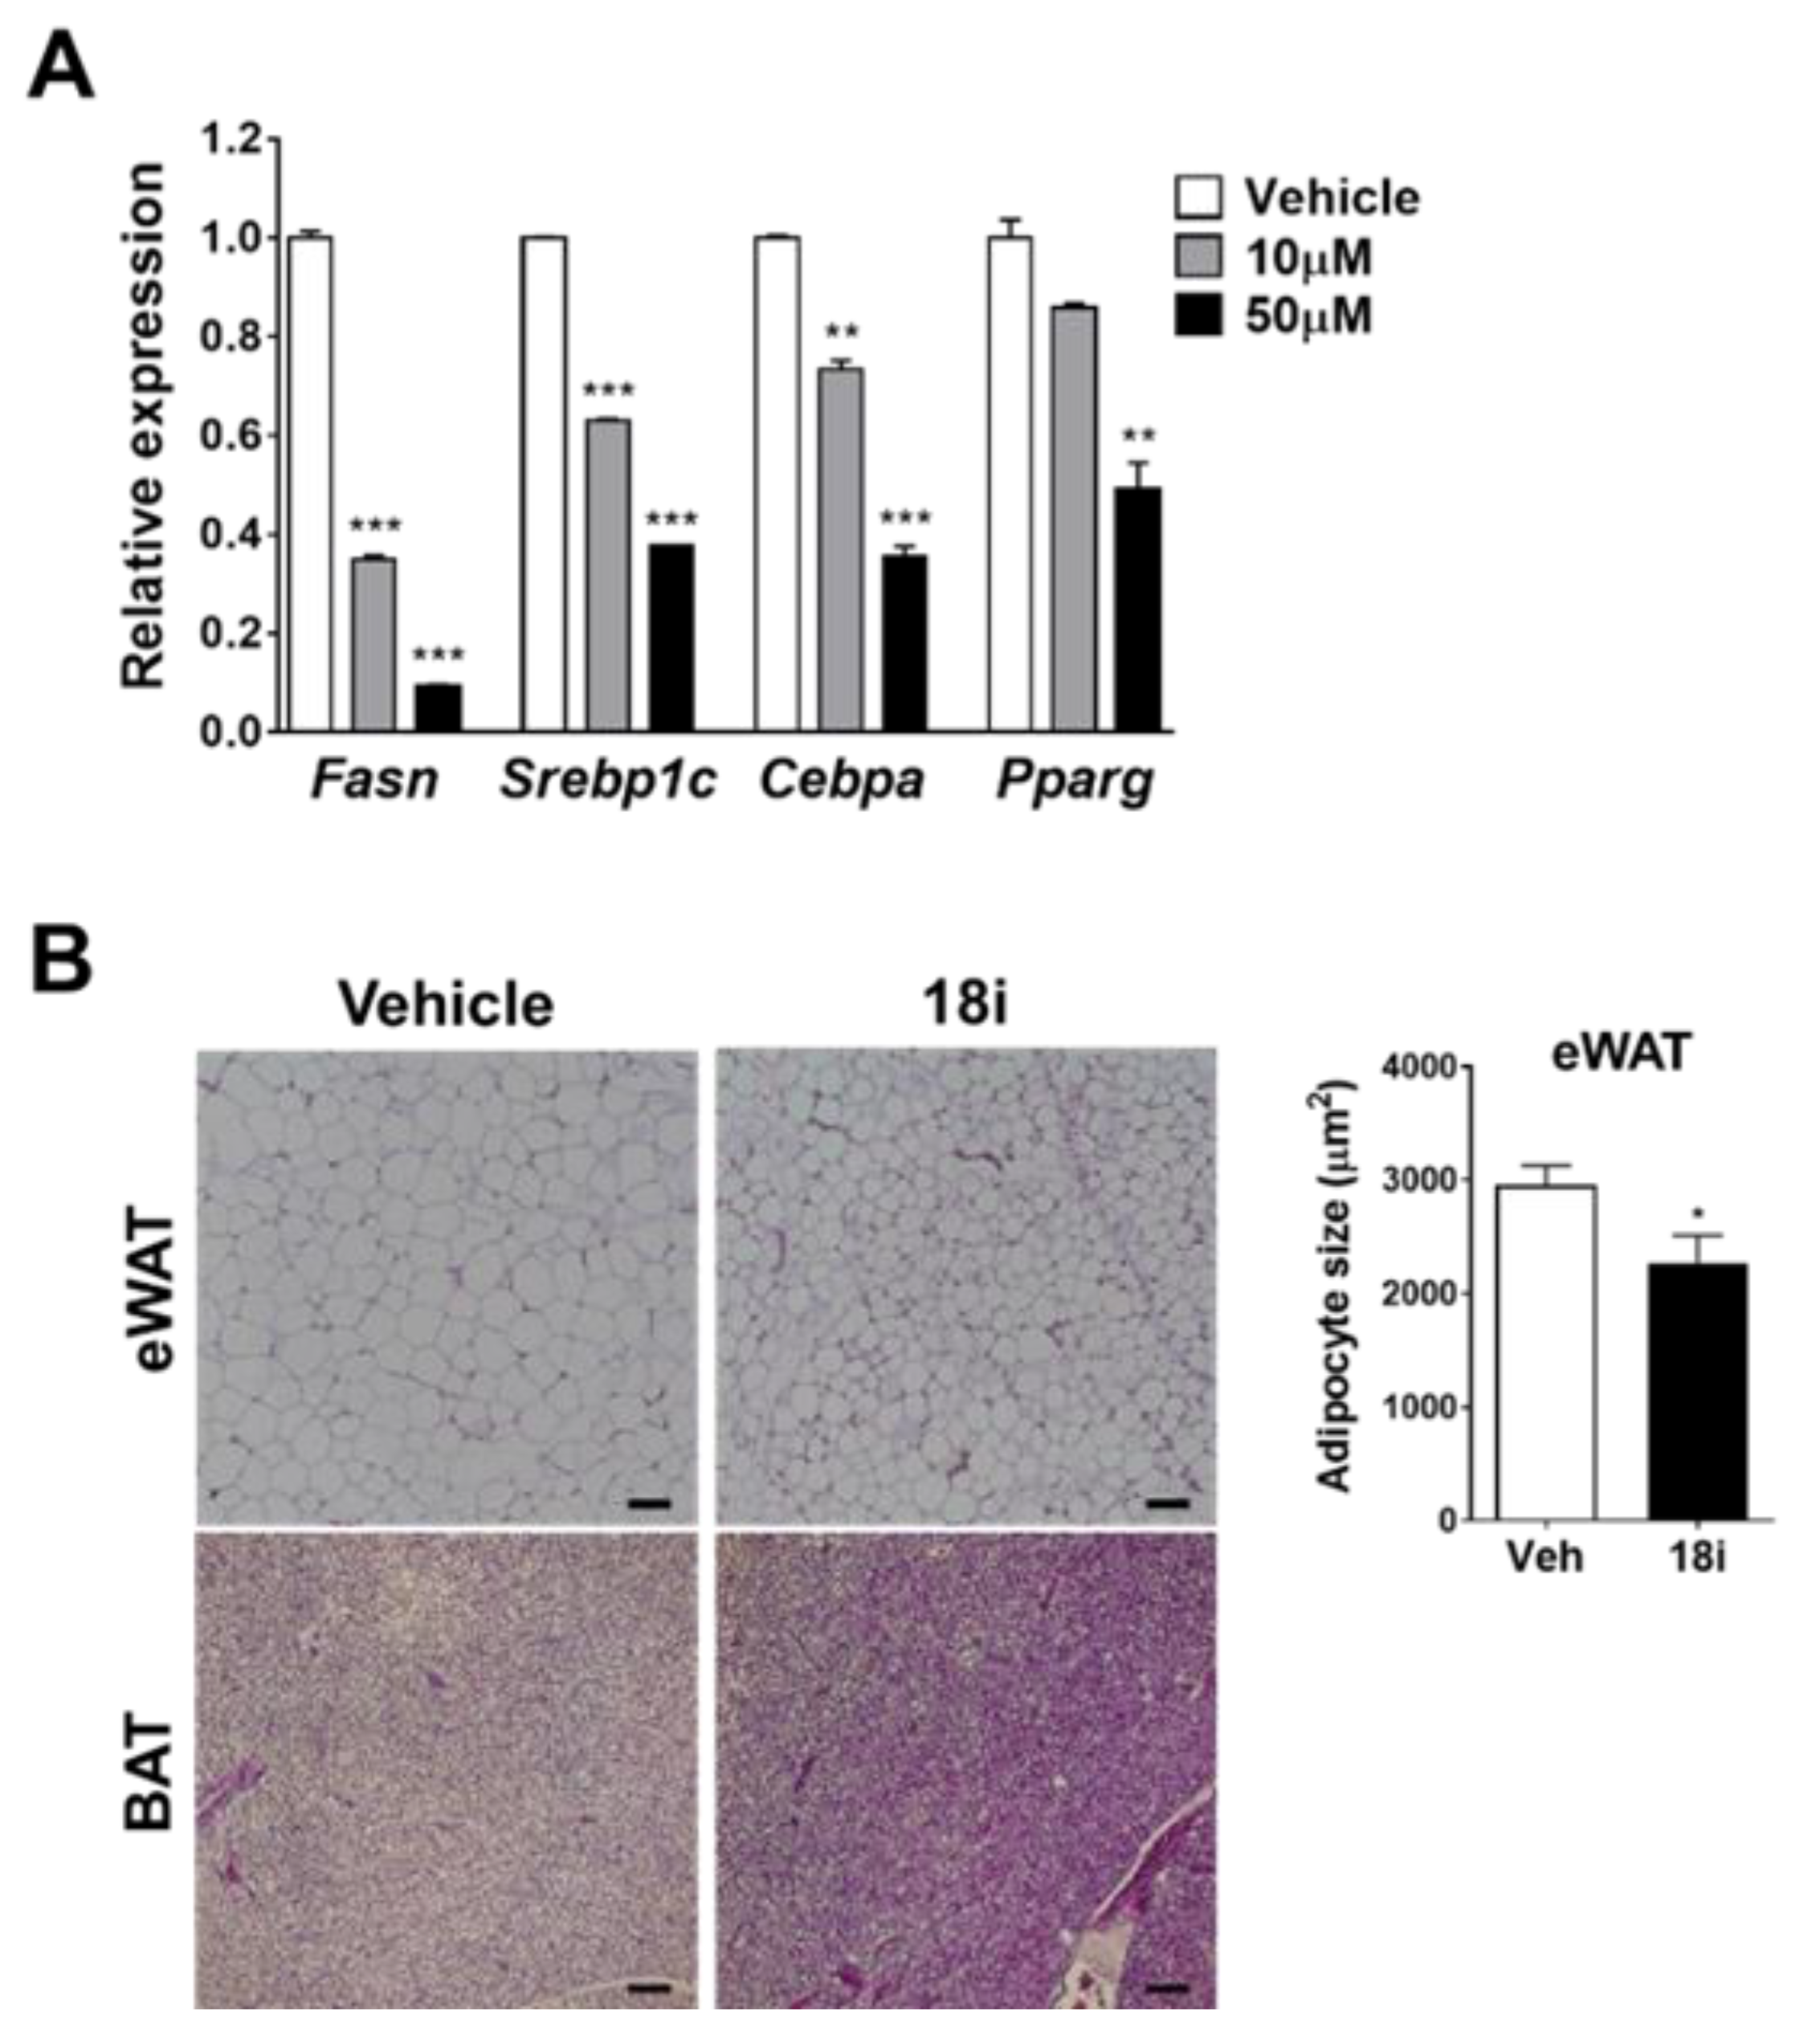
3.6.9. In Vitro Efficacy Test
3.6.10. In Vivo Efficacy Test
3.6.11. Histological Analysis and Immunohistochemistry
3.6.12. Liver Oil-Red O Staining
3.6.13. RNA Isolation and Real-Time Quantitative PCR (RT-qPCR)
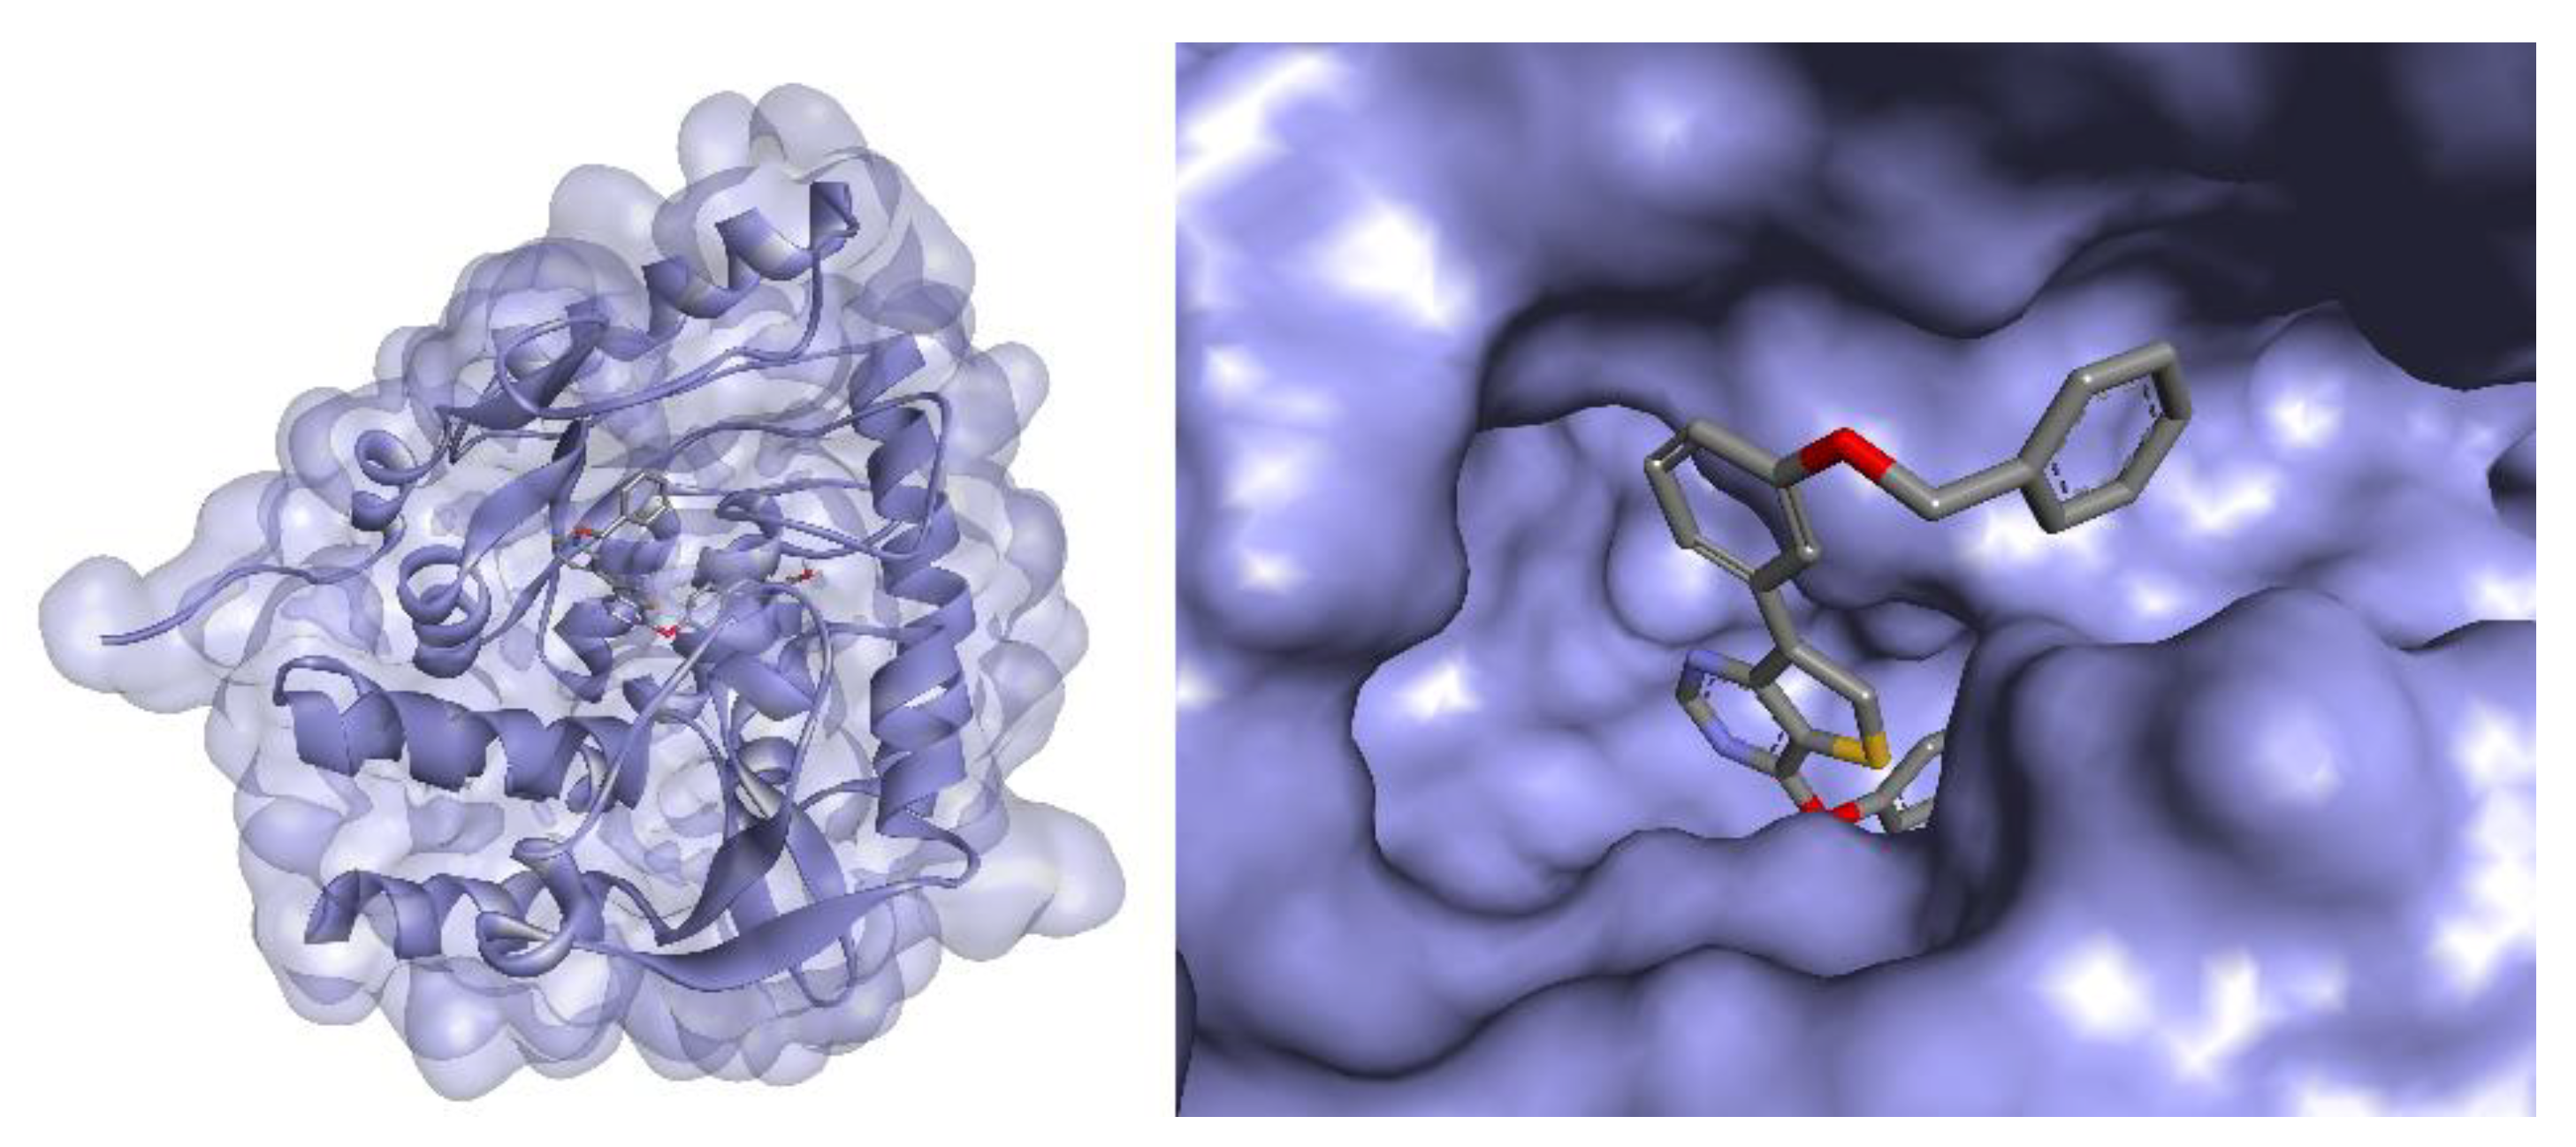
3.7. Docking Studies
4. Conclusions
Supplementary Materials
Author Contributions
Funding
Institutional Review Board Statement
Acknowledgments
Conflicts of Interest
Abbreviations
References
- Berger, M.; Gray, J.A.; Roth, B.L. The Expanded Biology of Serotonin. Annu. Rev. Med. 2009, 60, 355–366. [Google Scholar] [CrossRef] [PubMed] [Green Version]
- Merens, W.; Willem Van der Does, A.J.; Spinhoven, P. The effects of serotonin manipulations on emotional information processing and mood. J. Affect. Disord. 2007, 103, 43–62. [Google Scholar] [CrossRef] [PubMed]
- Young, S.N.; Leyton, M. The role of serotonin in human mood and social interaction: Insight from altered tryptophan levels. Pharmacol. Biochem. Behav. 2002, 71, 857–865. [Google Scholar] [CrossRef]
- Monti, J.M. Serotonin control of sleep-wake behavior. Sleep Med. Rev. 2011, 15, 269–281. [Google Scholar] [CrossRef] [PubMed]
- Lam, D.D.; Garfield, A.S.; Marston, O.J.; Shaw, J.; Heisler, L.K. Brain serotonin system in the coordination of food intake and body weight. Pharmacol. Biochem. Behav. 2010, 97, 84–91. [Google Scholar] [CrossRef]
- Namkung, J.; Kim, H.; Park, S. Peripheral Serotonin: A New Player in Systemic Energy Homeostasis. Mol. Cells 2015, 38, 1023–1028. [Google Scholar]
- Oh, C.M.; Namkung, J.; Go, Y.; Shong, K.E.; Kim, K.; Kim, H.; Park, B.-Y.; Lee, H.W.; Jeon, Y.H.; Song, J.; et al. Regulation of systemic energy homeostasis by serotonin in adipose tissues. Nat. Commun. 2015, 6, 6794. [Google Scholar] [CrossRef]
- Available online: https://en.wikipedia.org/wiki/Fenclonine (accessed on 1 March 2022).
- Markham, A. Telotristat Ethyl: First Global Approval. Drugs 2017, 77, 793–798. [Google Scholar] [CrossRef]
- Goldberg, D.R.; De Lombaert, S.; Aiello, R.; Bourassa, P.; Barucci, N.; Zhang, Q.; Paralkar, V.; Stein, A.J.; Holt, M.; Valentine, J.; et al. Optimization of spirocyclic proline tryptophan hydroxylase-1 inhibitors. Bioorg. Med. Chem. Lett. 2017, 27, 413–419. [Google Scholar] [CrossRef]
- Morris, G.M.; Huey, R.; Lindstrom, W.; Sanner, M.F.; Belew, R.K.; Goodsell, D.S.; Olson, A.J. Autodock4 and AutoDockTools4: Automated docking with selective receptor flexiblity. J. Comput. Chem. 2009, 30, 2785–2791. [Google Scholar] [CrossRef] [Green Version]
- Cianchetta, G.; Stouch, T.; Yu, W.; Shi, Z.C.; Tari, L.W.; Swanson, R.V.; Hunter, M.J.; Hoffman, I.D.; Liu, Q. Mechanism of Inhibition of Novel Tryptophan Hydroxylase Inhibitors Revealed by Co-Crystal Structures and Kinetic Analysis. Curr. Chem. Genom. 2010, 4, 19–26. [Google Scholar] [CrossRef] [PubMed] [Green Version]
- Bae, E.J.; Choi, W.G.; Pagire, H.S.; Pagire, S.H.; Parameswaran, S.; Choi, J.H.; Yoon, J.H.; Choi, W.I.; Lee, J.H.; Song, J.S.; et al. Peripheral Selective Oxadiazolylphenyl Alanine Derivatives as Tryptophan Hydroxylase 1 Inhibitors for Obesity and Fatty Liver Disease. J. Med. Chem. 2021, 64, 1037–1053. [Google Scholar] [CrossRef] [PubMed]
- Shi, Z.C.; Devasagayaraj, A.; Gu, K.; Jin, H.; Marinelli, B.; Samala, L.; Scott, S.; Stouch, T.; Tunoori, A.; Wang, Y.; et al. Modulation of Peripheral Serotonin Levels by Novel Tryptophan Hydroxylase Inhibitors for the Potential Treatment of Functional Gastrointestinal Disorders. J. Med. Chem. 2008, 51, 3684–3687. [Google Scholar] [CrossRef] [PubMed]
- Levin, V.A. Relationship of octanol/water partition coefficient and molecular weight to rat brain capillary permeability. J. Med. Chem. 1980, 23, 682–684. [Google Scholar] [CrossRef] [PubMed]
- Young, R.C.; Mitchell, R.C.; Brown, T.H.; Ganellin, C.R.; Griffiths, R.; Jones, M.; Rana, K.K.; Saunders, D.; Smith, I.R.; Sore, N.E.; et al. Development of a new physicochemical model for brain penetration and its application to the design of centrally acting H2 receptor histamine antagonists. J. Med. Chem. 1988, 31, 656–671. [Google Scholar] [CrossRef]
- Clark, D.E. Rapid calculation of polar molecular surface area and its application to the prediction of transport phenomena. 2. Prediction of blood–brain barrier penetration. J. Pharm. Sci. 1999, 88, 815–821. [Google Scholar] [CrossRef]
- Platts, J.A.; Abraham, M.H.; Zhao, Y.H.; Hersey, A.; Ijaz, L.; Butina, D. Correlation and prediction of a large blood–brain distribution data set—An LFER study. Eur. J. Med. Chem. 2001, 36, 719–730. [Google Scholar] [CrossRef]
- Seelig, A.; Gottschlich, R.; Devant, R.M. A method to determine the ability of drugs to diffuse through the blood-brain barrier. Proc. Natl. Acad. Sci. USA 1994, 91, 68–72. [Google Scholar] [CrossRef] [Green Version]
- Audus, K.L.; Ng, L.; Wang, W.; Borchardt, R.T. Brain Microvessel Endothelial Cell Culture Systems. In Models for Assessing Drug Absorption and Metabolism; Springer: Boston, MA, USA, 1996; pp. 239–258. [Google Scholar]
- Di, L.; Kerns, E.H.; Fan, K.; McConnell, O.J.; Carter, G.T. High throughput artificial membrane permeability assay for blood–brain barrier. Eur. J. Med. Chem. 2003, 38, 223–232. [Google Scholar] [CrossRef]
- Crane, J.D.; Palanivel, R.; Mottillo, E.P.; Bujak, A.L.; Wang, H.; Ford, R.J.; Collin, A.; Blümer, R.M.; Fullerton, M.D.; Yabut, J.M.; et al. Inhibiting peripheral serotonin synthesis reduces obesity and metabolic dysfunction by promoting brown adipose tissue thermogenesis. Nat. Med. 2015, 21, 166–172. [Google Scholar] [CrossRef] [Green Version]
- Zhi, X.; Wang, J.; Lu, P.; Shen, H.-B.; Ning, G. AdipoCount: A new software for automatic adipocyte counting. Front. Physiol. 2018, 9, 85. [Google Scholar] [CrossRef] [PubMed]


| Compound | Structure | TPH1 Inhibition (% Inhibition at 100 µM) |
|---|---|---|
| pCPA | 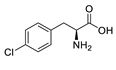 | 25% |
| 6 | 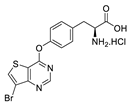 | 64% |
| 9a |  | 45% |
| 9b | 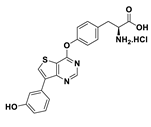 | 82% |
| 11a |  | 58% |
| 11b |  | 92% |
| 15a |  | 49% |
| 15b | 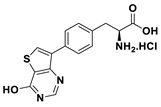 | 33% |
| 18a | 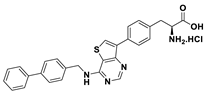 | 90% |
| Compound | Structure | TPH1 Inhibition (% Inhibition at 1 µM) | IC50 (nM) |
|---|---|---|---|
| pCPA |  | <5% (25% at 100 µM) | |
| 18a | 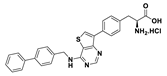 | 25% (90% at 100 µM) | |
| 18b | 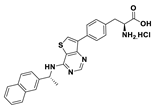 | 10% | |
| 18c | 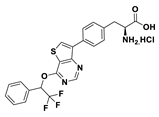 | 2.5% (10 µM) | |
| 18d | 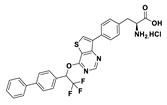 | 1.2% (10 µM) | |
| 18e | 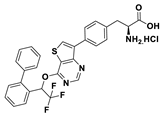 | 76% | |
| 18f | 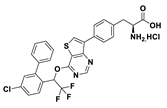 | 41% | |
| 18g | 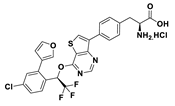 | 12% | |
| 18h | 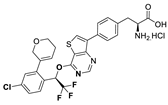 | 78% | 263 |
| 18i | 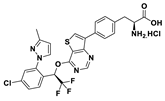 | 95% | 37 |
| Compound | Structure | TPH1 Inhibition (% Inhibition at 1 µM) | IC50 (nM) |
|---|---|---|---|
| LP533401 | 60% | 583 | |
| 18i | 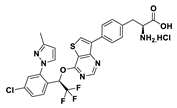 | 95% | 37 |
| 30 | 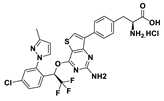 | 91% | 208 |
| 19 |  | 60% | 994 |
| 20 |  | 79% | |
| 21 | 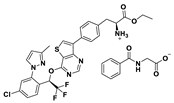 | 92% |
| Compound | Structure | BBB Permeability | |
|---|---|---|---|
| Pe(10−6 cm/s) | logPe | ||
| pCPA |  | 1.85 a | −5.73 |
| 18i | 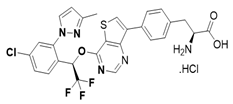 | 0.00 | −10.00 |
| Assay | Result |
|---|---|
| Liver microsomal stability (rat) a | 99% parent remained after 30 min incubation |
| Liver microsomal stability (human) | 99% parent remained after 30 min incubation |
| CYP inhibition | 1A2: 0.1% inhibition at 10 uM |
| 2C19: 46.5% inhibition at 10 uM | |
| 2D6: 24.6% inhibition at 10 uM | |
| 3A4: 45.3% inhibition at 10 uM | |
| Herg inhibition | <1% inhibition at 10 uM |
| Assay | Results |
|---|---|
| BBB penetration | Plasma: 0.5 h: 2266 ng/mL |
| 3 h: 1439 ng/mL | |
| Brain: 0.5 h: BQL a | |
| 3 h: BQL | |
| In vivo PK (iv, 5 mpk) | T1/2 (h): 1.85 ± 0.325 |
| AUCt (μg·h/mL): 1.21 ± 0.058 | |
| AUC∞ (μg·h/mL): 1.22 ± 0.057 | |
| CL (L/h/kg): 4.09 ± 0.186 | |
| Vss (L/kg): 2.16 ± 1.62 | |
| (po, 5 mpk, prodrug 21) | T1/2 (h): 7.95 ± 0.017 |
| AUCt (μg·h/mL): 0.189 ± 0.009 | |
| AUC∞ (μg·h/mL): 0.216 ± 0.022 | |
| F = 16% |
Publisher’s Note: MDPI stays neutral with regard to jurisdictional claims in published maps and institutional affiliations. |
© 2022 by the authors. Licensee MDPI, Basel, Switzerland. This article is an open access article distributed under the terms and conditions of the Creative Commons Attribution (CC BY) license (https://creativecommons.org/licenses/by/4.0/).
Share and Cite
Pagire, S.H.; Pagire, H.S.; Park, K.-Y.; Bae, E.J.; Kim, K.-e.; Kim, M.; Yoon, J.; Parameswaran, S.; Choi, J.-H.; Park, S.; et al. Identification of New Non-BBB Permeable Tryptophan Hydroxylase Inhibitors for Treating Obesity and Fatty Liver Disease. Molecules 2022, 27, 3417. https://doi.org/10.3390/molecules27113417
Pagire SH, Pagire HS, Park K-Y, Bae EJ, Kim K-e, Kim M, Yoon J, Parameswaran S, Choi J-H, Park S, et al. Identification of New Non-BBB Permeable Tryptophan Hydroxylase Inhibitors for Treating Obesity and Fatty Liver Disease. Molecules. 2022; 27(11):3417. https://doi.org/10.3390/molecules27113417
Chicago/Turabian StylePagire, Suvarna H., Haushabhau S. Pagire, Kun-Young Park, Eun Jung Bae, Kwang-eun Kim, Minhee Kim, Jihyeon Yoon, Saravanan Parameswaran, Jun-Ho Choi, Sungmi Park, and et al. 2022. "Identification of New Non-BBB Permeable Tryptophan Hydroxylase Inhibitors for Treating Obesity and Fatty Liver Disease" Molecules 27, no. 11: 3417. https://doi.org/10.3390/molecules27113417