Abstract
A novel dual-template magnetic molecularly imprinted polymer (MMIP) was synthesized to extract normetanephrine (NMN), metanephrine (MN) and 3-methoxytyramine (3-MT) from spot urine samples. As the adsorbent of dispersive solid-phase extraction (d-SPE), the MMIP was prepared using dopamine and MN as dual templates, methacrylic acid as the functional monomer, ethylene glycol dimethacrylate as the crosslinking reagent and magnetic nanoparticles as the magnetic core. NMN, MN, 3-MT and creatinine (Cr) in spot urine samples were selectively enriched by d-SPE and detected by HPLC-fluorescence detection/ultraviolet detection. The peak area (A) ratios of NMN, MN and 3-MT to Cr were used for the diagnosis of pheochromocytomas and paragangliomas (PPGLs). The results showed that the adsorption efficiencies of MMIP for target analytes were all higher than 89.0%, and the coefficient variation precisions of intra-assay and inter-assay for the analytes were within 4.9% and 6.3%, respectively. The recoveries of the analytes were from 93.2% to 112.8%. The MMIP was still functional within 14 days and could be reused at least seven times. The d-SPE and recommended solid-phase extraction (SPE) were both used to pretreat spot urine samples from 18 PPGLs patients and 22 healthy controls. The correlation coefficients of ANMN/ACr and AMN/ACr between d-SPE and SPE were both higher than 0.95. In addition, the areas under the receiver operator curves for spot urine ANMN/ACr, AMN/ACr and plasma free NMN and MN were 0.975, 0.773 and 0.990, 0.821, respectively, indicating the two methods had the similar performances. The d-SPE method took only 20 min, which was effective in clinical application.
1. Introduction
Pheochromocytomas and paragangliomas (PPGLs) are neoplasms arising from adrenal and extra-adrenal chromaffin tissues, respectively [1]. Typically, PPGLs usually secrete excessive catecholamines including dopamine (DA), epinephrine (E) and norepinephrine (NE). Overproduced catecholamines could seriously damage patients’ cardiovascular system, which leads to symptoms such as hypertension, headache and sweating. Some PPGLs patients even develop hypertensive crises, which are the primary cause of death for PPGLs patients [2,3]. Most PPGLs are nonmalignant and can be cured by operative treatment [4]. Therefore, a fast and accurate diagnosis of PPGLs is important.
Normetanephrine (NMN) and metanephrine (MN) are O-methylated metabolites of NE and E, respectively. Plasma free and 24 h-fractionated metanephrines (MNs) are recommended by the Endocrine society for patients suspected of PPGLs [5]. In addition, elevated NMN is concerned with neuroblastoma [6,7,8]. 3-methoxytyramine (3-MT) is the O-methylated metabolite of DA and is conventionally determined for the differential diagnosis of dopamine hypersecretory tumors. Liu’s group [7] found that MNs and 3-MT used as a combined biomarker could increase the diagnostic sensitivity of PPGLs, and several groups have reported that 3-MT was useful for the diagnosis of neuroblastoma [9,10].
Plasma and 24 h-fractionated urine MNs detected by HPLC-mass spectrometry/electrochemical detection (ECD) were recommended in clinic. However, blood sampling requires patients to lie still for at least 30 min, and 24 h urine samples were inconvenient to collect for outpatients. To solve this problem, our previous work established a method using HPLC-fluorescence detection/ultraviolet detection (FLD/UVD) to determine chromatographic peak area (A) ratios of MNs and 3-MT to Cr (creatinine) (AMNs/ACr and A3-MT/ACr) in spot urine samples for the accurate diagnosis of PPGLs. The collection of spot urine samples is fast and convenient. Moreover, the diagnostic efficiencies of spot urine AMNs/ACr were higher than those of plasma MN levels, and spot urine A3-MT/ACr was valuable in diagnosing malignant PPGLs [11].
The present sample pretreatment method for detecting plasma free MNs and 24 h-fractionated MNs is solid-phase extraction (SPE) [12,13,14,15,16]. However, SPE is tedious and time consuming. As a result, the turnaround time of this test was too long, which made patients spend more on treatment costs and time [17,18].
Molecular imprinted polymer (MIP) is a three-dimensional polymer containing recognition cavities complementary to templates in size, shape and structure, which could mimic the antigen–antibody reaction [19,20,21,22], and it has been proven to offer excellent selectivity for compounds with similar structures as the template used in synthesis, which makes it appropriate for complex sample pretreatments [23,24,25,26,27,28,29,30,31,32].
In recent years, dispersive solid-phase extraction (d-SPE) has been one of the most popular and applicable techniques in sample preparation because it can easily separate analytes from aqueous mediums such as urine samples [33,34,35,36,37,38,39]. Magnetic molecularly imprinted polymer (MMIP) is a compound prepared by encapsulating inorganic magnetic nanoparticles with polymers. MMIP possesses the merits of magnetic nanoparticles and MIP, which is an ideal adsorbent for d-SPE [20,21,32]. Application of d-SPE based on MMIP can extract specific molecules selectively and effectively from diverse matrices. Compared with SPE, d-SPE can shorten the time of pretreatment and simplify the pretreatment process significantly. Moreover, MMIP is a stable material and can be regenerated several times [40,41,42,43]. Therefore, d-SPE is simple, fast and cost-effective compared with SPE.
Herein, a novel kind of MMIP based on magnetic nanoparticles using DA and MN as dual templates, methacrylic acid (MAA) as functional monomers, ethylene glycol dimethacrylate (EGDMA) as the crosslinking reagent and azobisisobutyronitrile (AIBN) as the initiator was prepared. Furthermore, it was used as sorbent in the d-SPE process to pretreat spot urine samples. Then, HPLC-FLD/UVD was used to detect spot urine AMNs, A3-MT and ACr. The spot urine AMNs/ACr had similar diagnostic efficiencies for the diagnosis of PPGLs as plasma free MNs.
2. Materials and Methods
2.1. Chemicals and Material
Magnetic nanoparticles (20–30 nm) were purchased from Jinpan biotech (Shanghai, China). HPLC-grade methanol and acetonitrile were purchased from Tedia (Fairfield, OH, USA).
3-methacryloxypropyltrimethoxysilane (MPS), AIBN, MAA and EGDMA were purchased from Aladdin (Shanghai, China).
Creatinine (Cr), dopamine hydrochloride (DA·HCl), DL-E·HCl, DL-NE·HCl, 3-MT·HCl and DL-NMN·HCl were purchased from Sigma-Aldrich (Saint Louis, USA). DL-MN·HCl was purchased from Mucklin (Shanghai, China).
Ethanol, acetic acid, sodium dihydrogen phosphate, disodium hydrogen phosphate, trisodium phosphate and acetic acid were purchased from Chuandong chemical (Chongqing, China), and water was purified by a Milli-Q system from Merck (Darmstadt, Germany). All other chemicals were of analytical grade.
2.2. Patients
Spot urine samples of 18 PPGLs patients and 22 healthy controls were collected from July 2018 to February 2020 in the First Affiliated Hospital of Chongqing Medical University. Patients were asked not to take anti-depression and acetaminophen medicine for 5 days before the sample collection. In addition, the intake of apples, bananas, tea and coffee was forbidden for 12 h to guarantee the accuracy of the results. All of the spot urine samples were stored at −20 °C before use.
The study was approved by the ethical committee of the First Affiliated Hospital of Chongqing Medical University. The concentrations of patients’ plasma free MNs were detected by HPLC—ECD [15] before the urine collection. Meanwhile, computed tomography was used in the auxiliary diagnosis of PPGLs. The definite diagnosis of PPGLs was performed by postoperative pathological examinations.
2.3. Synthesis of MMIP and Magnetic Non-Imprinted Polymer
First, 50.0 mg magnetic nanoparticles, 2.0 mL of water and 2.0 mL of ethanol were successively added into a 50 mL centrifuge tube, respectively. The tube was shaken violently until the particles were evenly distributed in the solution, then 4.0 mL of MPS was dropwise added into the tube. In a nitrogen atmosphere, the tube was placed into a thermostatic water bath at 40 °C shaking for 12 h to modify magnetic nanoparticles with a double bond. After the reaction, the modified magnetic nanoparticles were cleaned with ethanol 3 times and then placed in an incubator at 37 °C to dry.
After dehydration overnight, 50.0 mg Fe3O4@SiO2-CH=CH2 nanoparticles were accurately weighed and added with 9.5 mL of acetonitrile and 0.5 mL of water, respectively. Then, 0.015 mmol DA and 0.010 mmol MN as templates, 1.000 mmol MAA as functional monomer, 1.000 mmol EGDMA as crosslinking reagent and 13.0 mg AIBN as initiator were successively added to 50 mL tubes. In a nitrogen atmosphere, the tubes were put into a thermostatic water bath at 65 °C shaking for 24 h. After the synthesis, MMIP was eluted with acetic acid (2.0%, v/v) 3 times for template removal and placed in the incubator at 37 °C before use. The synthesis of magnetic non-imprinted polymer (MNIP) was carried out without templates and the rest protocols were the same as MMIP.
2.4. Performance of d-SPE
First, 500 μL of spot urine sample and 40 mg of MMIP were added to 2.5 mL of PBS (0.1 mmol/L, pH 9.0), respectively. After shaking violently for 30 s and incubating for 8 min, MMIP was separated from the matrix, and the supernatant was discarded. Finally, 200 μL of acetic acid (2%, v/v) was added. After shaking violently for 30 s and incubating for 7.5 min, MMIP was separated from the matrix, and 50 μL of the supernatant was detected by HPLC-FLD/UVD. MMIP was rinsed with water and dried for regeneration.
2.5. Chromatographic Conditions
The chromatographic experiment was performed on Agilent 1100 HPLC equipped with a G1321A fluorescence detector and a G1314A ultraviolet detector (Palo Alto, CA, USA). The chromatographic conditions were established based on our previous work with a slight modification [11]. Separation of analytes was achieved at 30 °C with a Shim-Pack VP-ODS column (150 mm × 4.6 mm i.d., 4.6 µm, Shimadzu, Kyoto, Japan), which was attached to a C18 security guard column (4 mm × 3 mm i.d., 5 µm, Phenomenex, California, USA). The mobile phase consisted of 70 mmol/L sodium dihydrogen phosphate (solvent A) and methanol (solvent B). The mobile phase was set at 0.8 mL/min with the gradients as follows: The content of B increased from 5% to 10% within 4.0 min and maintained for 8.0 min. The excitation and emission wavelengths of fluorescence detection were set at 278 nm and 320 nm, respectively. The wavelength of ultraviolet detection was set at 235 nm.
3. Results and Discussion
3.1. MMIP Synthesis
The synthesis of MMIP consisted of three steps including modification, thermal radical polymerization and template removal, as shown in Figure 1. The MPS was used as a modifier to induce double bonds on magnetic nanoparticles, and then MIP was coated with nanoparticles by thermal radical polymerization. After the reaction, templates were removed by breaking the hydrogen bonds using acetic acid to reduce the pH value. After template removal, specific three-dimensional caves complementary to the templates were exposed, which could specifically adsorb analytes.
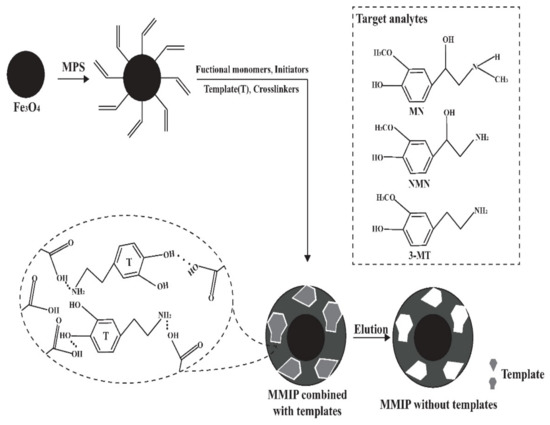
Figure 1.
Schematic diagram of MMIP synthesis.
3.2. Optimization of MMIP Synthesis
E, NE, DA, MN, NMN and 3-MT were selected as templates in the synthesis of MMIP, and the results showed that when using a single kind of template, MMIP using DA as the template had the best adsorption efficiencies (EA), as shown in Table 1. This is because DA contains the structure of catechol, which is capable of forming hydrogen bonds. As a result, the MMIP using DA as the template had the highest EA when extracting analytes in standard solution. However, when used to extract spot urine samples, the EA of MN by MMIP using MN as the template was far better than that of MMIP using DA as the template. The reason may be that the MMIP using DA was low in the selectivity to MN, and the matrix in spot urine samples competitively combined the adsorption sites on MMIP. As a result, DA and MN were chosen as dual templates to synthesize MMIP in order to increase the EA of MN in spot urine samples. The results of MMIP and MNIP adsorbing spot urine samples were shown in Table 2. Different ratios of templates to functional monomers were explored, and the highest EA was obtained when the ratio was selected at 1:20, as shown in Supplemental Table S1. The ideal ratio of functional monomers to crosslinking reagent was selected at 1:1, as shown in Supplemental Table S2.

Table 1.
The adsorption efficiency of synthesized MMIP of different template molecules. ( ± s, n = 3).
Table 2.
Enrichment results of spot urine samples by MMIP synthesized with different template molecules. ( s, n = 3).
EA was calculated based on Formula 1
EA = (x1 − x2)/x1 × 100%
x1 means the peak area of analytes standards before the adsorption.
x2 means the peak area of analytes standards in the supernatant after the adsorption.
3.3. The Characteristics of MMIP
Fourier Transform Infrared Spectroscopy (FTIR) was conducted on SU8020 (Hitachi, Tokyo, Japan) and a scanning electron microscope (SEM) was performed on IS10 (Nicolet, Thermo Fisher Scientific, Waltham, MA, USA), respectively. As shown in Figure 2, the MMIP and magnetic nanoparticles were scanned by FTIR between the wavelengths of 450 to 4000 nm; the absorption peaks at 560.64 nm, 1011.59 nm, 1628.29 nm and 3391.87 nm are the vibrations of Fe-O, C-O, C=O and –OH, respectively. Fe-O exists in magnetic nanoparticles, C-O and C=O exist in MPS, MAA and EGDMA, while -OH exists in water and MAA. The FTIR results showed that the MMIP was successfully synthesized based on magnetic nanoparticles. The SEM picture showed that the MIP with a porous structure was evenly coated with nanoparticles, which made it conducive to the specific adsorption of target analytes.
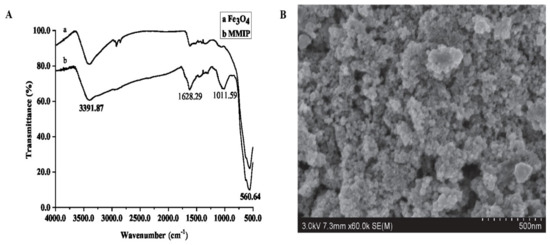
Figure 2.
The characteristics of MMIP ((A). FTIR; (B). SEM).
3.4. The Optimization of d-SPE Conditions
The specific recognition between analytes and MMIP is based on hydrogen bonds, which are highly affected by pH value. To evaluate the adsorption efficiencies of MMIP to analytes at different pH values, a series of 0.01 mol/L PBS with different pH values were prepared for d-SPE. When pH ≥ 8.0, the EA of NMN, MN and 3-MT were stable and satisfactory. As the pKa of NMN, MN and 3-MT are 9.06, 9.25 and 9.64, respectively, the analytes will ionize, which makes it difficult to form hydrogen bonds with MMIP at pH < 8.0. However, at pH ≥ 8.0, the analytes mainly exist as molecular forms, which makes it easier to form hydrogen bonds with MMIP and, therefore, improves the EA of analytes. As MMIP is unstable in strong alkaline environments, pH 9.0 was chosen as the optimal condition for the adsorption. Different adsorption times of d-SPE were explored. The EA of MMIP increased over time before 8.0 min. When MMIP was saturated for over 8.0 min, the EA was stabilized and time-independent. Therefore, 8.0 min was chosen as the optimal adsorption time. Acetic acid aqueous was used to regulate the pH value of eluant in d-SPE in order to break the hydrogen bonds between MMIP and the analytes. Different concentrations of acetic acid aqueous solution were used to determine the elution efficiency (EB) of MMIP, and EB was calculated according to Formula 2. When the concentration of acetic acid aqueous was ≥2.0%, the elution efficiency became stable at a high level. Because of the instability of MMIP in strongly acidic environments, the optimal concentration of acetic acid aqueous was selected at 2.0%. Different elution times were performed in the d-SPE process. When the elution time was less than 7.5 min, the EB of MMIP increased with time. When the EB of MMIP became saturated at 7.5 min, it remained stable. Therefore, the optimal time was selected at 7.5 min. The results of the optimization are shown in Supplemental Figure S1.
EB = x4/x3 × 100%
x3 means the peak area of analytes standards adsorbed on MMIP (x1 − x2).
x4 means the peak area of analytes standards in eluant.
3.5. Precision, Usage Count and Stability of MMIP
The pooled spot urine samples of PPGLs patients and healthy controls were used to test the precision of MMIP five times, respectively. The coefficients of variations (CV) of MNs and 3-MT in spot urine samples from healthy controls and PPGLs patients using MMIP from the same batch were all less than 4.9%. When using MMIP from different batches, the CVs of MNs and 3-MT were all less than 6.3%, as shown in Supplemental Table S3. To test the reuse times of the MMIP, the pooled spot urine samples from healthy controls and PPGLs patients were divided into seven parts, respectively, and the MMIP was used to extract these samples in a blind order. As shown in Supplemental Table S4, the CVs of PPGLs patients and the healthy control were lower than 4.6% and 5.5%, respectively, which meant that the MMIP could be used at least 14 times. In addition, the results showed no cross contamination between the PPGLs group and the control group. Then, to test its long-term stability, MMIP was placed in a dry area for 1, 14 and 28 days, respectively. The MMIP stored for different times was used in the d-SPE process to extract spot urine samples three times, and as shown in Supplemental Table S5, the adsorption amount of MMIP reduced by 0.7–5.2% and 11.6–17.6% in 14 days and 28 days compared with MMIP stored for 1 day, respectively, which illustrated that MMIP was stable for at least 14 days. The chromatograms of spot urine samples from a patient with PPGLs and a healthy volunteer are shown in Figure 3.
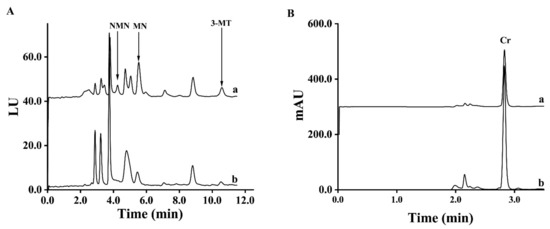
Figure 3.
Chromatograms of spot urine samples from a PPGLs patient (a) and a healthy control (b) ((A). FLD; (B). UVD).
3.6. Recoveries and Calibration Curves
Calibration samples were prepared by adding 20 μL of standard solution at a series of concentrations (25–1000 μg) to 480 μL of the pooled spot urine, respectively. The value Y in the calibration curve was obtained by the subtraction of the peak areas of the analytes after the calibration addition to the peak areas of the analytes before the calibration addition; the value X in the calibration curve represented the concentration of the analytes added to the samples. As shown in Supplemental Table S6, the peak area of MNs and 3-MT showed a linear relation with its concentration in the range of 25 to 1000 μg/L, R2 > 0.999. The limits of detection of NMN, MN and 3-MT were 4.2 μg/L, 9.6 μg/L and 7.7 μg/L, respectively, and the limits of quantification were 15.3 μg/L for NMN, 24.2 μg/L for MN and 21.3 μg/L for 3-MT. To test the recoveries of the analytes, the standard solution of NMN, MN and 3-MT at high (800 μg/L), medium (250 μg/L) and low (50 μg/L) levels were added to the pooled spot urine samples, respectively, and each concentration was performed three times. As shown in Supplemental Table S7, the recoveries of the analytes in the spot urine samples were in the range of 93.2–112.8%, which indicates satisfactory recoveries.
3.7. The Methods Comparison between SPE and d-SPE
The developed method was applied for analyzing the spot urine samples from 18 PPGLs patients and 22 healthy controls. To compare the AMNs/ACr and A3-MT/ACr results of the spot urine samples pretreated by d-SPE and SPE [11], Spearman’s correlation test was performed. The coefficients of AMNs/ACr were both higher than 0.95 (r = 0.961 and 0.993), as shown in Figure 4, indicating that the AMNs/ACr results by two methods were highly related; the A3-MT/ACr results of the two methods were moderately related, showing no significant difference between the PPGLs group and the control group (p > 0.05). The results are shown in Supplemental Table S8. Compared with SPE, d-SPE takes only 20 min, which largely shortens the sample turnaround time and increases the efficiencies of the pretreatment. Moreover, MMIP can be reused at least 14 times. SPE columns are disposable consumables, which means d-SPE is more cost-effective.
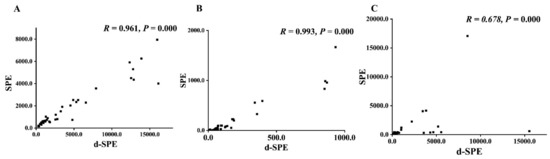
Figure 4.
The comparison of SPE and d-SPE ((A). ANMN/ACr; (B). AMN/ACr; (C). A3-MT/ACr).
3.8. The Diagnosis of PPGLs
To evaluate the diagnostic efficiency of the established method, the spot urine AMNs/ACr and plasma free MNs from 18 PPGLs and 22 healthy controls were determined by the established method and the recommended SPE-HPLC-ECD [1] method, respectively, as shown in Figure 5; the data were used to draw the receiver operator characteristic curve, as shown in Figure 6. The diagnostic efficiencies were obtained by the areas under the operator characteristic curves (AUC). The diagnostic efficiencies of spot urine ANMN/ACr and AMN/ACr were 0.975 and 0.773, respectively, and the diagnostic efficiencies of plasma free NMN and MN were 0.990 and 0.821, respectively, which shows that the two methods had the similar performances. The sensitivity and specificity of plasma MNs and the spot urine free AMNs/ACr for the diagnosis of PPGLs are shown in Supplemental Table S9, indicating that the spot urine AMNs/ACr determined by d-SPE-HPLC-FLD/UVD was effective for the diagnosis of PPGLs.
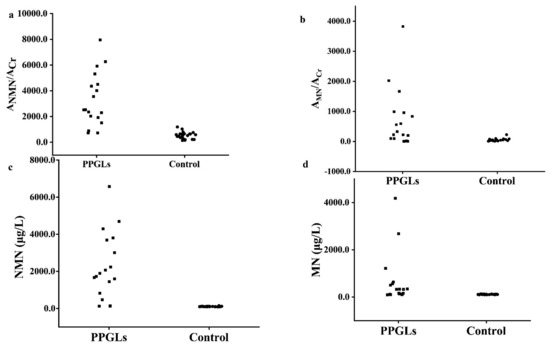
Figure 5.
The spot urine AMNs/ACr results and plasma free MNs results of PPGLs and control ((a). spot urine ANMN/ACr; (b). spot urine AMN/ACr (c). plasma free NMN (d). plasma free MN).
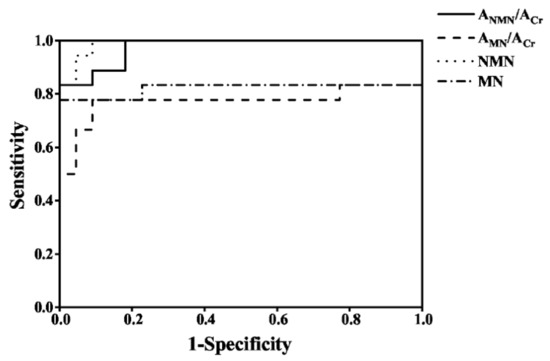
Figure 6.
The operator characteristic curves of spot urine AMNs/ACr and plasma free MNs for the diagnosis of PPGLs.
4. Conclusions
In this study, MMIP was prepared by the thermal radical polymerization using DA and MN as dual templates, MAA as the functional monomers, EGDMA as the crosslinking reagent, AIBN as an initiator and nanoparticles as carriers. The synthesis of MMIP is simple and cost effective. The d-SPE process based on MMIP can realize simultaneous enrichment of MNs, 3-MT and Cr in spot urine samples. Furthermore, AMNs/ACr determined by d-SPE-HPLC-FLD/UVD had similar diagnostic efficiencies for the diagnosis of PPGLs as plasma free MNs determined by SPE-HPLC-ECD. The d-SPE process took only 20 min, superior to the traditional SPE, and therefore has a great potential in clinical application.
Supplementary Materials
The following supporting information can be downloaded at: https://www.mdpi.com/article/10.3390/molecules27113520/s1, Figure S1: The optimization of experimental conditions for d-SPE; Table S1: The effect of different ratios of the functional monomer to the template molecule on the adsorption efficiency of synthesized MMIP; Table S2: The effect of different ratios of the functional monomer and the cross-linking reagent on the adsorption efficiency of synthesized MMIP; Table S3: The precision of MMIP; Table S4: The reuse times of MMIP; Table S5: The stability of MMIP; Table S6: Calibration curves for NMN, MN and 3-MT in urine samples; Table S7: Recoveries of the assay; Table S8: The spot urine AMNs/ACr results of PPGLs group and control group pretreated by SPE and d-SPE. Table S9: The sensitivity and specificity of plasma MNs and spot urine free MNs for the diagnosis of PPGLs.
Author Contributions
Conceptualization, M.D. and X.Z.; methodology, H.Z.; software, Q.S.; validation, Y.Z., M.D. and X.Z.; formal analysis, H.W.; investigation, H.Z.; resources, Q.Z. and Y.H.; data curation, H.Z.; writing—original draft preparation, H.Z.; writing—review and editing, X.Z. and M.D.; visualization, H.W.; supervision, M.D.; project administration, M.D.; funding acquisition, M.D. All authors have read and agreed to the published version of the manuscript.
Funding
This work was sponsored by the Natural Science Foundation of Chongqing, China (cstc2019jcyj-msxmX0103, cstc2020jcyj-msxmX0141).
Institutional Review Board Statement
The study was conducted in accordance with the Declaration of Helsinki and approved by the Ethics Committee of the First Affiliated Hospital of Chongqing Medical University (2021-630).
Informed Consent Statement
Informed consent was obtained from all subjects involved in the study and written informed consent has been obtained from the patients to publish this paper.
Data Availability Statement
The data presented in this study are available on request from the corresponding author. The data are not publicly available due to it was protected by patent ‘CN 2017107169315′.
Acknowledgments
The authors acknowledge all healthy volunteers and patients for their cooperation in this study. We thank the contributions of physicians and other medical personnel in the First Affiliated Hospital of Chongqing Medical University to this study.
Conflicts of Interest
The authors declare that they have no known competing financial interests or personal relationships that could have appeared to influence the work reported in this paper.
Sample Availability
The plasma and spot urine samples of PPGLs patients and controls are available from the authors.
References
- Lenders, J.W.M.; Eisenhofer, G.; Mannelli, M.; Pacak, K. Phaeochromocytoma. Lancet 2005, 366, 665–675. [Google Scholar] [CrossRef]
- Prejbisz, A.; Lenders, J.; Eisenhofer, G.; Januszewicz, A. Cardiovascular manifestations of phaeochromocytoma. J. Hypertens. 2011, 29, 2049–2060. [Google Scholar] [CrossRef] [PubMed]
- Manger, W. The protean manifestations of pheochromocytoma. Horm. Metab. Res. 2009, 41, 658–663. [Google Scholar] [CrossRef] [PubMed]
- Manger, W. The vagaries of pheochromocytomas. Am. J. Hypertens. 2005, 18, 1266–1270. [Google Scholar] [CrossRef] [PubMed]
- Lenders, J.W.M.; Duh, Q.-Y.; Eisenhofer, G.; Gimenez-Roqueplo, A.-P.; Grebe, S.K.G.; Murad, M.H.; Naruse, M.; Pacak, K.; Young, W.F., Jr. Pheochromocytoma and Paraganglioma: An Endocrine Society Clinical Practice Guideline. J. Clin. Endocrinol. Metab. 2014, 99, 1915–1942. [Google Scholar] [CrossRef] [PubMed]
- Van Duinen, N.; Corssmit, E.P.M.; De Jong, W.H.A.; Brookman, D.; Kema, I.P.; Romijn, J.A. Plasma levels of free metanephrines and 3-methoxytyramine indicate a higher number of biochemically active HNPGL than 24-h urinary excretion rates of catecholamines and metabolites. Eur. J. Endocrinol. 2013, 169, 377–382. [Google Scholar] [CrossRef] [PubMed][Green Version]
- Liu, L.; Xie, W.; Song, Z.; Wang, T.; Li, X.; Gao, Y.; Li, Y.; Zhang, J.; Guo, X. Addition of 3-methoxytyramine or chromogranin A to plasma free metanephrines as the initial test for pheochromocytoma and paraganglioma: Which is the best diagnostic strategy. Clin. Endocrinol. 2022, 96, 132–138. [Google Scholar] [CrossRef]
- Eisenhofer, G.; Lenders, J.W.M.; Siegert, G.; Bornstein, S.R.; Friberg, P.; Milosevic, D.; Mannelli, M.; Linehan, W.M.; Adams, K.; Timmers, H.J.; et al. Plasma methoxytyramine: A novel biomarker of metastatic pheochromocytoma and paraganglioma in relation to established risk factors of tumour size, location and SDHB mutation status. Eur. J. Cancer 2012, 48, 1739–1749. [Google Scholar] [CrossRef]
- Lefeuvre, S.; Bois-Maublanc, J.; Mongeois, E.; Policarpo, V.; Formaux, L.; Francia, T.; Billaud, E.; Got, L. Quantitation using HRMS: A new tool for rapid, specific and sensitive determination of catecholamines and deconjugated methanephrines metanephrines in urine. J. Chromatogr. B 2021, 1166, 122391. [Google Scholar] [CrossRef]
- Richard, V.; Zahedi, R.; Eintracht, S.; Borchers, C. An LC-MRM assay for the quantification of metanephrines from dried blood spots for the diagnosis of pheochromocytomas and paragangliomas. Anal. Chim. Acta 2020, 1128, 140–148. [Google Scholar] [CrossRef]
- Wang, H.; Zhang, X.; Zhen, Q.; Zou, W.; Chen, H.; Luo, C.; Ding, M. Detection of spot urinary free metanephrines and 3-methoxytyramine with internal reference correction for the diagnosis of pheochromocytomas and paragangliomas. J. Chromatogr. B 2020, 1156, 122306. [Google Scholar] [CrossRef] [PubMed]
- Zuber, S.; Kantorovich, V.; Pacak, K. Hypertension in pheochromocytoma: Characteristics and treatment. Endocrinol. Metab. Clin. 2011, 40, 295–311. [Google Scholar] [CrossRef] [PubMed]
- Petrák, O.; Haluzíková, D.; Kaválková, P.; Štrauch, B.; Rosa, J.; Holaj, R.; Brabcová Vránková, A.; Michalsky, D.; Haluzík, M.; Zelinka, T.; et al. Changes in energy metabolism in pheochromocytoma. J. Clin. Endocrinol. Metab. 2013, 98, 1651–1658. [Google Scholar] [CrossRef]
- Grouzmann, E.; Fathi, M.; Gillet, M.; de Torrenté, A.; Cavadas, C.; Brunner, H.; Buclin, T. Disappearance rate of catecholamines, total metanephrines, and neuropeptide Y from the plasma of patients after resection of pheochromocytoma. Clin. Chem. 2001, 47, 1075–1082. [Google Scholar] [CrossRef]
- Zuo, M.; Zhen, Q.; Zhang, X.; Zou, W.; Yang, X.; Tian, G.; Shi, Z.; Li, Q.; Ding, M. High specificity of spot urinary free metanephrines in diagnosis and prognosis of pheochromocytomas and paragangliomas by HPLC with electrochemical detection. Clin. Chim. Acta 2018, 478, 82–89. [Google Scholar] [CrossRef] [PubMed]
- De Jong, W.; Graham, K.; van der Molen, J.; Links, T.; Morris, M.; Ross, H.; de Vries, E.; Kema, I. Plasma free metanephrine measurement using automated online solid-phase extraction HPLC tandem mass spectrometry. Clin. Chem. 2007, 53, 1684–1693. [Google Scholar] [CrossRef] [PubMed]
- Lei, Y.; Xu, G.; Wei, F.; Yang, J.; Hu, Q. Preparation of a stir bar coated with molecularly imprinted polymer and its application in analysis of dopamine in urine. J. Pharm. Biomed. Anal. 2014, 94, 118–124. [Google Scholar] [CrossRef]
- Dramou, P.; Zuo, P.; He, H.; Pham-Huy, L.A.; Zou, W.; Xiao, D.; Pham-Huy, C. Development of novel amphiphilic magnetic molecularly imprinted polymers compatible with biological fluids for solid phase extraction and physicochemical behavior study. J. Chromatogr. A 2013, 1317, 110–120. [Google Scholar] [CrossRef]
- Vasapollo, G.; Sole, R.D.; Mergola, L.; Lazzoi, M.R.; Scardino, A.; Scorrano, S.; Mele, G. Molecularly imprinted polymers: Present and future prospective. Int. J. Mol. Sci. 2011, 12, 5908–5945. [Google Scholar] [CrossRef]
- Płotka-Wasylka, J.; Szczepańska, N.; de La Guardia, M.; Namieśnik, J. Modern trends in solid phase extraction: New sorbent media. TrAC Trends Anal. Chem. 2016, 77, 23–43. [Google Scholar] [CrossRef]
- Speltini, A.; Scalabrini, A.; Maraschi, F.; Sturini, M.; Profumo, A. Newest applications of molecularly imprinted polymers for extraction of contaminants from environmental and food matrices: A review. Anal. Chim. Acta 2017, 974, 1–26. [Google Scholar] [CrossRef] [PubMed]
- Beyazit, S.; Bui, B.T.S.; Haupt, K.; Gonzato, C. Molecularly imprinted polymer nanomaterials and nanocomposites by controlled/living radical polymerization. Prog. Polym. Sci. 2016, 62, 1–21. [Google Scholar] [CrossRef]
- Xu, T.; Tang, H.; Chen, D.; Dong, H.; Li, L. Simultaneous determination of 24 polycyclic aromatic hydrocarbons in edible oil by tandem solid-phase extraction and gas chromatography coupled/tandem mass spectrometry. J. AOAC Int. 2015, 98, 529–537. [Google Scholar] [CrossRef] [PubMed]
- Yaripour, S.; Mohammadi, A.; Nojavan, S. Electromembrane extraction of tartrazine from food samples: Effects of nano-sorbents on membrane performance. J. Sep. Sci. 2016, 39, 2642–2651. [Google Scholar] [CrossRef] [PubMed]
- Kopperi, M.; Riekkola, M.-L. Non-targeted evaluation of selectivity of water-compatible class selective adsorbents for the analysis of steroids in wastewater. Anal. Chim. Acta 2016, 920, 47–53. [Google Scholar] [CrossRef]
- Pesavento, M.; D’Agostino, G.; Biesuz, R.; Alberti, G.; Profumo, A. Ion selective electrode for dopamine based on a molecularly imprinted polymer. Electroanalysis 2012, 24, 813–824. [Google Scholar] [CrossRef]
- Chen, L.; Xu, S.; Li, J. Recent advances in molecular imprinting technology: Current status, challenges and highlighted applications. Chem. Soc. Rev. 2011, 40, 2922–2942. [Google Scholar] [CrossRef]
- Sturini, M.; Speltini, A.; Maraschi, F.; Pretali, L.; Profumo, A.; Fasani, E.; Albini, A. Environmental photochemistry of fluoroquinolones in soil and in aqueous soil suspensions under solar light. Environ. Sci. Pollut. Res. 2014, 21, 13215–13221. [Google Scholar] [CrossRef]
- Wen, Y.; Chen, L.; Li, J.; Liu, D.; Chen, L. Recent advances in solid-phase sorbents for sample preparation prior to chromatographic analysis. TrAC Trends Anal. Chem. 2014, 59, 26–41. [Google Scholar] [CrossRef]
- Volkert, A.A.; Haes, A.J. Advancements in nanosensors using plastic antibodies. Analyst 2014, 139, 21–31. [Google Scholar] [CrossRef]
- Pichon, V.; Chapuis-Hugon, F. Role of molecularly imprinted polymers for selective determination of environmental pollutants—A review. Anal. Chim. Acta 2008, 622, 48–61. [Google Scholar] [CrossRef] [PubMed]
- Kubo, T.; Otsuka, K. Recent progress for the selective pharmaceutical analyses using molecularly imprinted adsorbents and their related techniques: A review. J. Pharm. Biomed. Anal. 2016, 130, 68–80. [Google Scholar] [CrossRef] [PubMed]
- Marzi Khosrowshahi, E.; Ghalkhani, M.; Afshar Mogaddam, M.; Farajzadeh, M.; Sohouli, E.; Nemati, M. Evaluation of MXene as an adsorbent in dispersive solid phase extraction of several pesticides from fresh fruit juices prior to their determination by HPLC-MS/MS. Food Chem. 2022, 386, 132773. [Google Scholar] [CrossRef] [PubMed]
- González-Gómez, L.; Gañán, J.; Morante-Zarcero, S.; Pérez-Quintanilla, D.; Sierra, I. Mesostructured Silicas as Cation-Exchange Sorbents in Packed or Dispersive Solid Phase Extraction for the Determination of Tropane Alkaloids in Culinary Aromatics Herbs by HPLC-MS/MS. Toxins 2022, 14, 218. [Google Scholar] [CrossRef] [PubMed]
- Rattanakunsong, N.; Jullakan, S.; Płotka-Wasylka, J.; Bunkoed, O. A hierarchical porous composite magnetic sorbent of reduced graphene oxide embedded in polyvinyl alcohol cryogel for solvent assisted-solid phase extraction of polycyclic aromatic hydrocarbons. J. Sep. Sci. 2022, 45, 1774–1783. [Google Scholar] [CrossRef]
- Lv, S.; Gao, Y.; Zhao, M.; Jiang, X.; Li, X.; Yang, J.; Chen, S.; Cui, S. Biomass-derived porous material synthesized by one-step calcination method for the magnetic solid phase extraction of polychlorinated biphenyls in water. J. Sep. Sci. 2022, 45, 1693–1701. [Google Scholar] [CrossRef]
- Chen, R.; Qiao, X.; Liu, F. Ionic liquid-based magnetic nanoparticles for magnetic dispersive solid-phase extraction: A review. Anal. Chim. Acta 2022, 1201, 339632. [Google Scholar] [CrossRef]
- Liu, M.; Zhu, C.; Li, X.; Wang, F. 3DG Functionalized Magnetic Solid Phase Extraction Materials for the Efficient Enrichment of Hexamethylenetetramine in Vermicelli. Molecules 2022, 27, 1548. [Google Scholar] [CrossRef]
- Nemati, M.; Tuzen, M.; Farazajdeh, M.; Kaya, S.; Afshar Mogaddam, M. Development of dispersive solid-liquid extraction method based on organic polymers followed by deep eutectic solvents elution; application in extraction of some pesticides from milk samples prior to their determination by HPLC-MS/MS. Anal. Chim. Acta 2022, 1199, 339570. [Google Scholar] [CrossRef]
- Bouri, M.; Lerma-García, M.J.; Salghi, R.; Zougagh, M.; Ríos, A. Selective extraction and determination of catecholamines in urine samples by using a dopamine magnetic molecularly imprinted polymer and capillary electrophoresis. Talanta 2012, 99, 897–903. [Google Scholar] [CrossRef]
- Kumar, N.; Narayanan, N.; Gupta, S. Application of magnetic molecularly imprinted polymers for extraction of imidacloprid from eggplant and honey. Food Chem. 2018, 255, 81–88. [Google Scholar] [CrossRef] [PubMed]
- Su, X.; Li, X.; Li, J.; Liu, M.; Lei, F.; Tan, X.; Li, P.; Luo, W. Synthesis and characterization of core–shell magnetic molecularly imprinted polymers for solid-phase extraction and determination of Rhodamine B in food. Food Chem. 2015, 171, 292–297. [Google Scholar] [CrossRef] [PubMed]
- Wei, S.; Li, J.; Liu, Y.; Ma, J. Development of magnetic molecularly imprinted polymers with double templates for the rapid and selective determination of amphenicol antibiotics in water, blood, and egg samples. J. Chromatogr. A 2016, 1473, 19–27. [Google Scholar] [CrossRef] [PubMed]


Publisher’s Note: MDPI stays neutral with regard to jurisdictional claims in published maps and institutional affiliations. |
© 2022 by the authors. Licensee MDPI, Basel, Switzerland. This article is an open access article distributed under the terms and conditions of the Creative Commons Attribution (CC BY) license (https://creativecommons.org/licenses/by/4.0/).