
A Capillary Electrophoresis-Based Method for the Measurement of Hydroxychloroquine and Its Active Metabolite Desethyl Hydroxychloroquine in Whole Blood in Patients with Rheumatoid Arthritis

 , ,
, ,  ,
,  and
and
Abstract
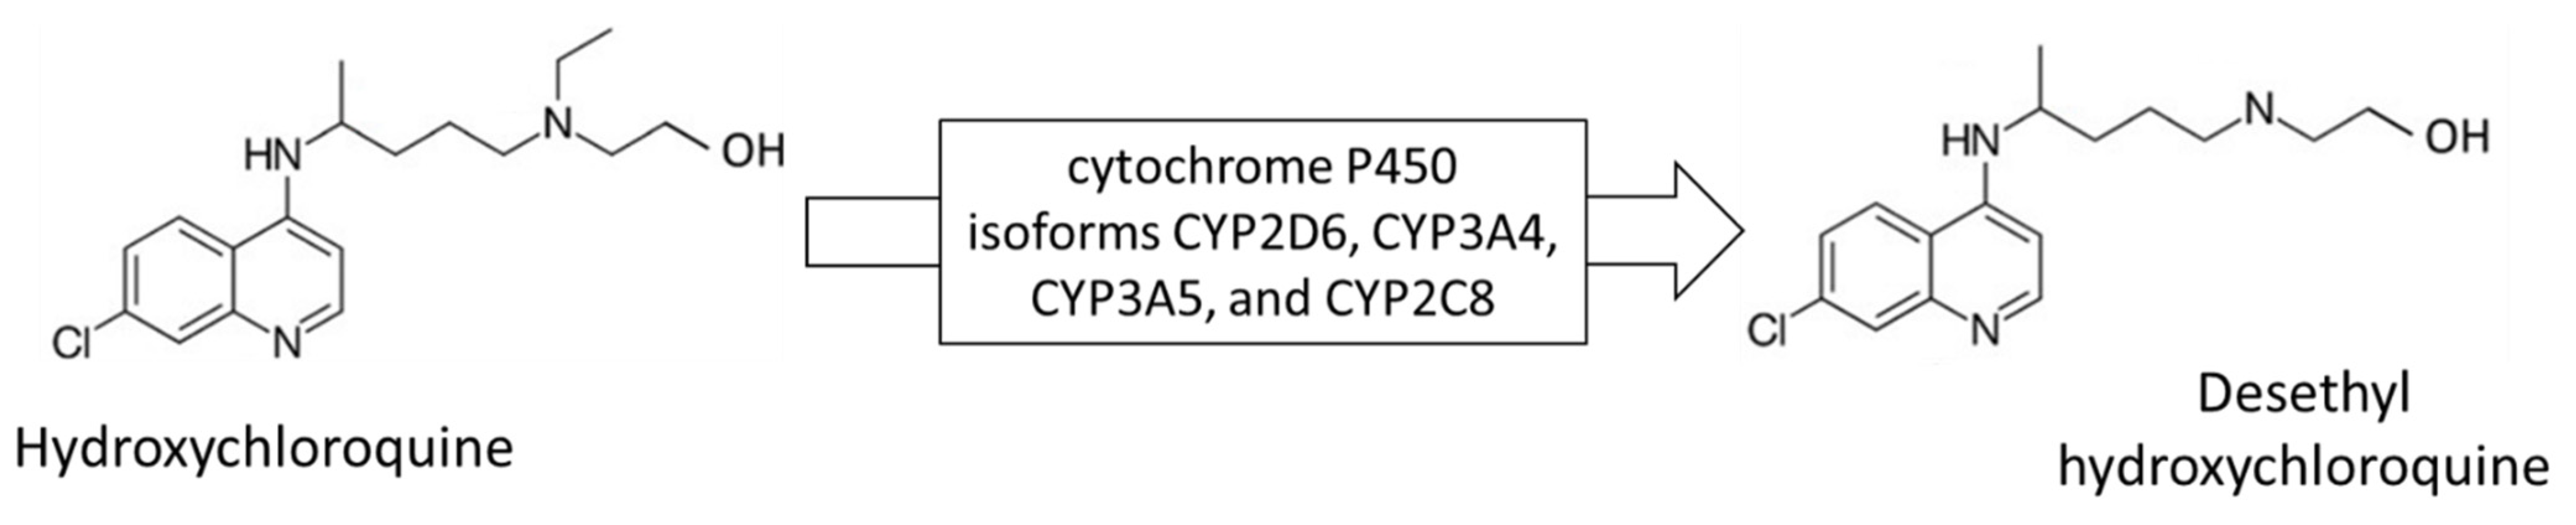
:1. Introduction
2. Materials and Methods
2.1. Chemicals and Reagents
2.2. Apparatus and CE Conditions
2.3. Participants in Study and Sample Collection
2.4. Sample Treatment
2.5. Solutions
3. Results
3.1. Sample Treatment
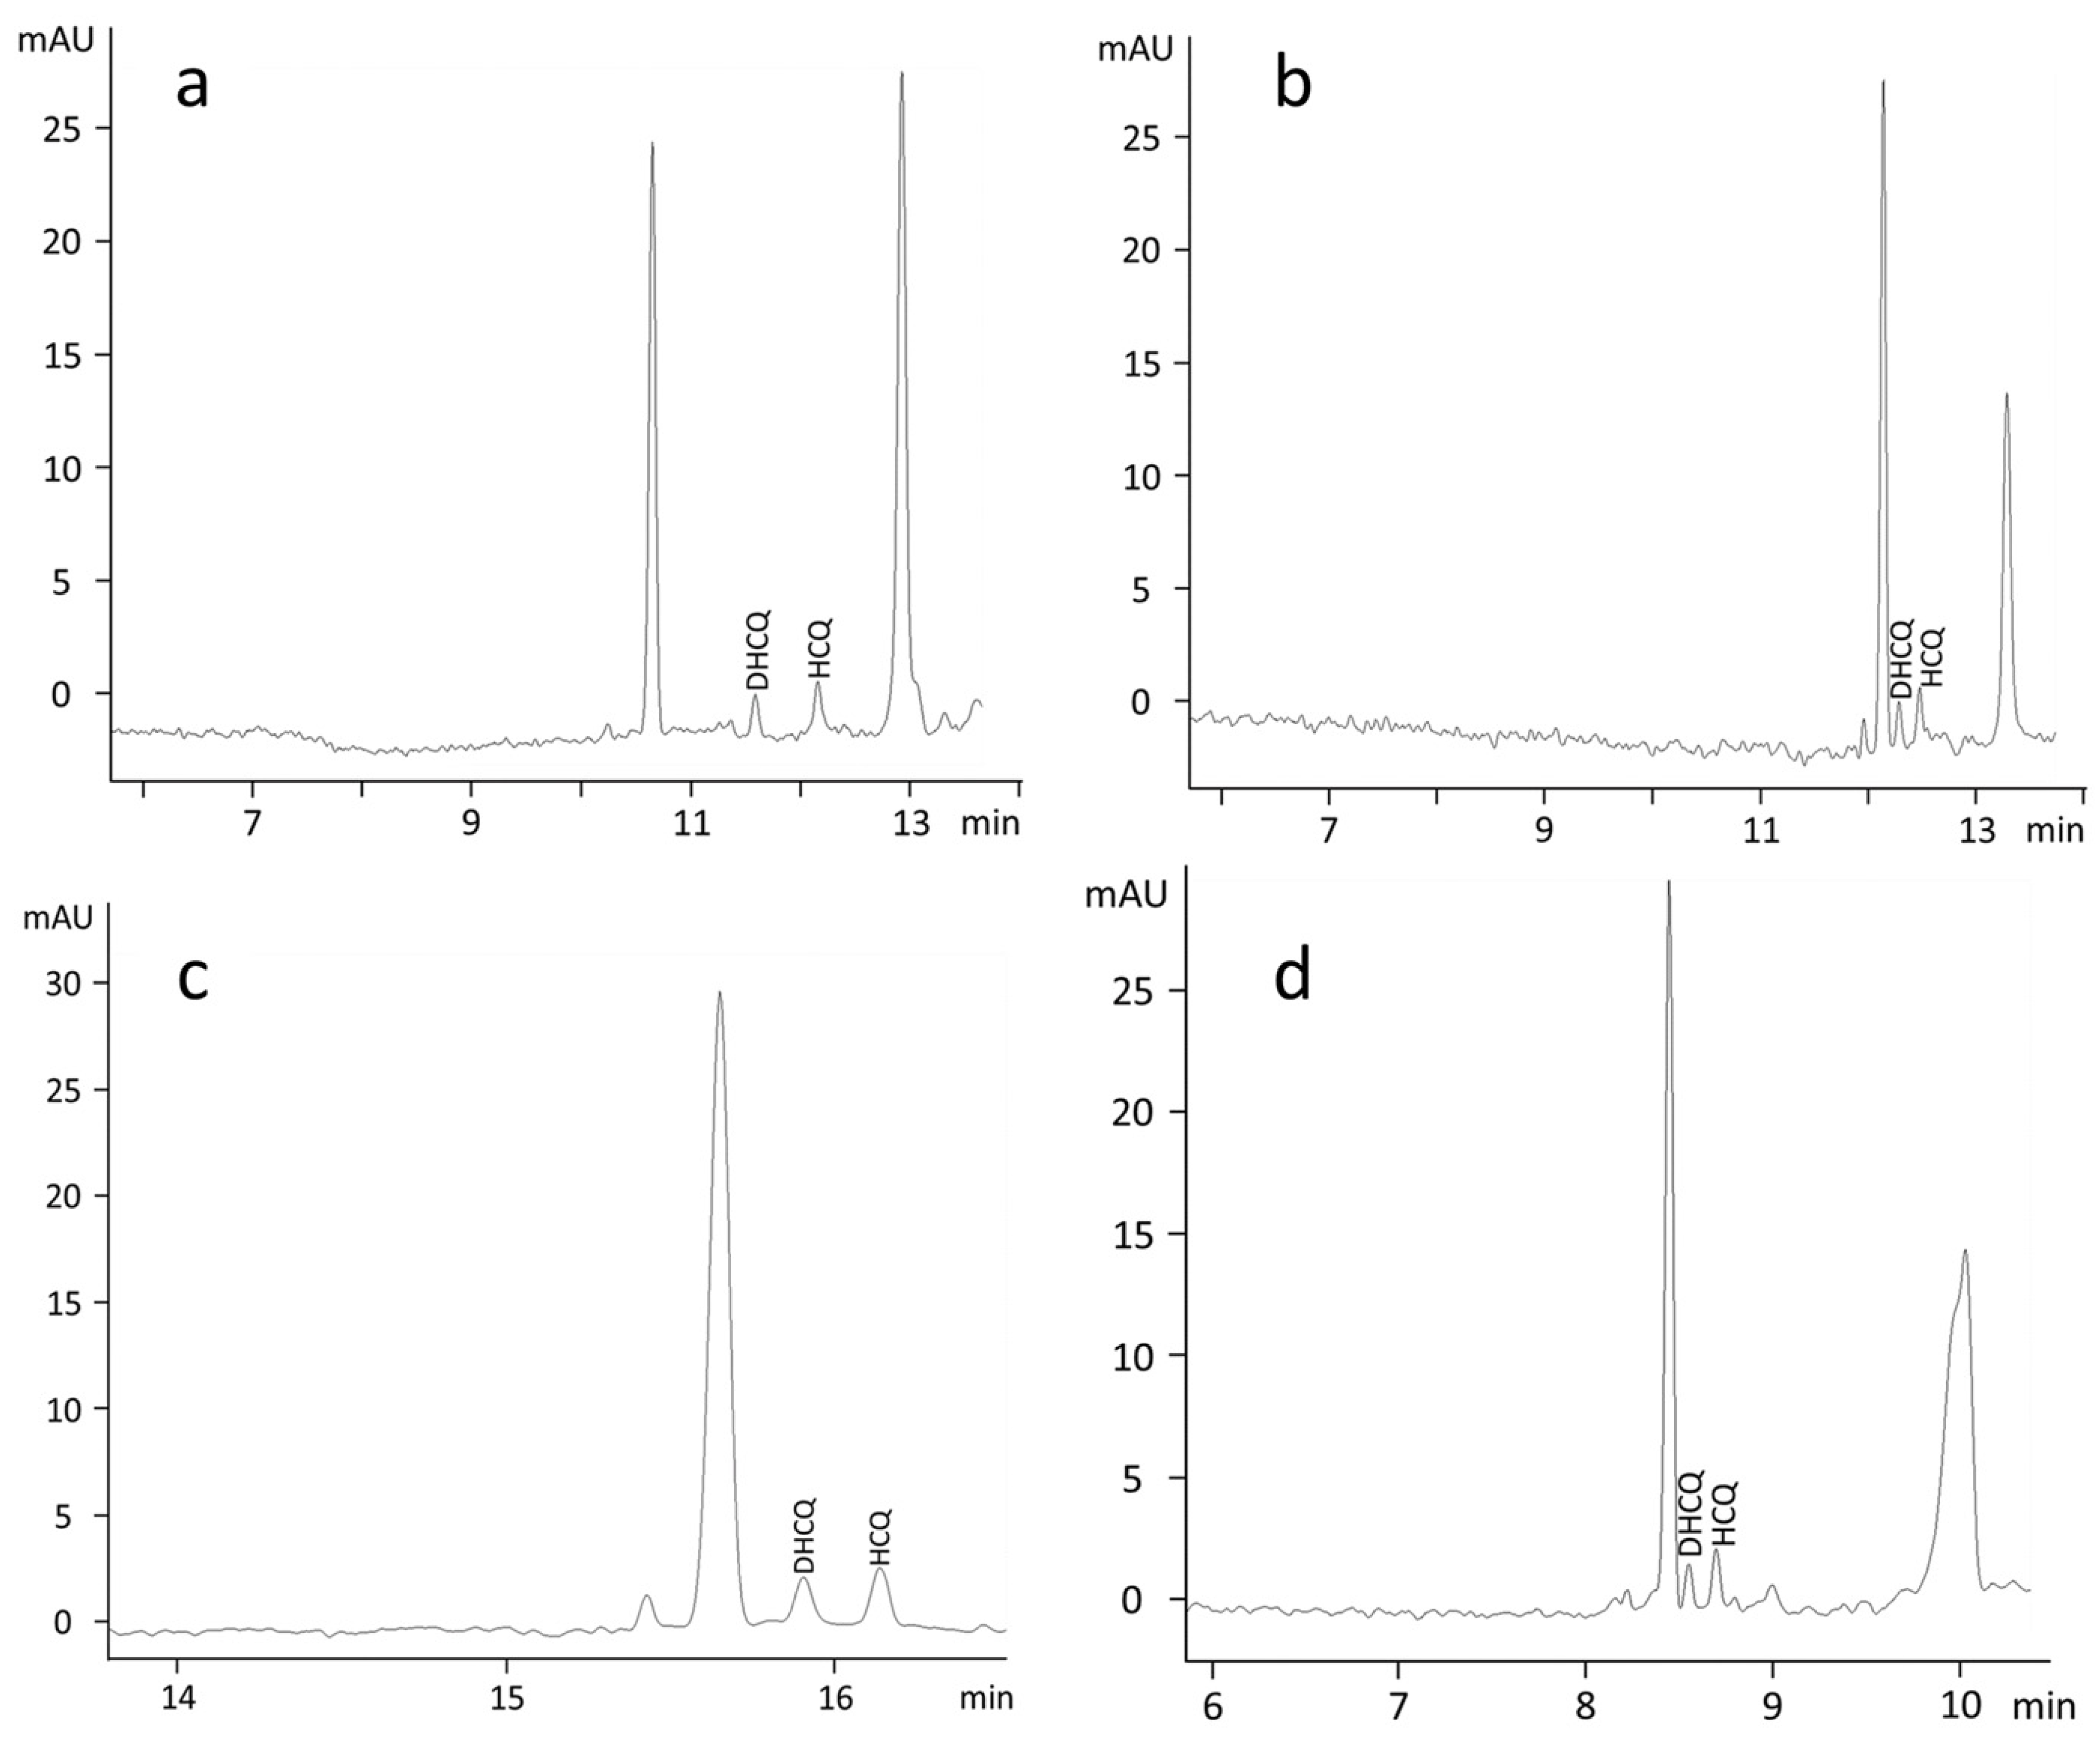
3.2. Electrophoretic Conditions
3.3. Linearity, Accuracy, Precision and Sensitivity
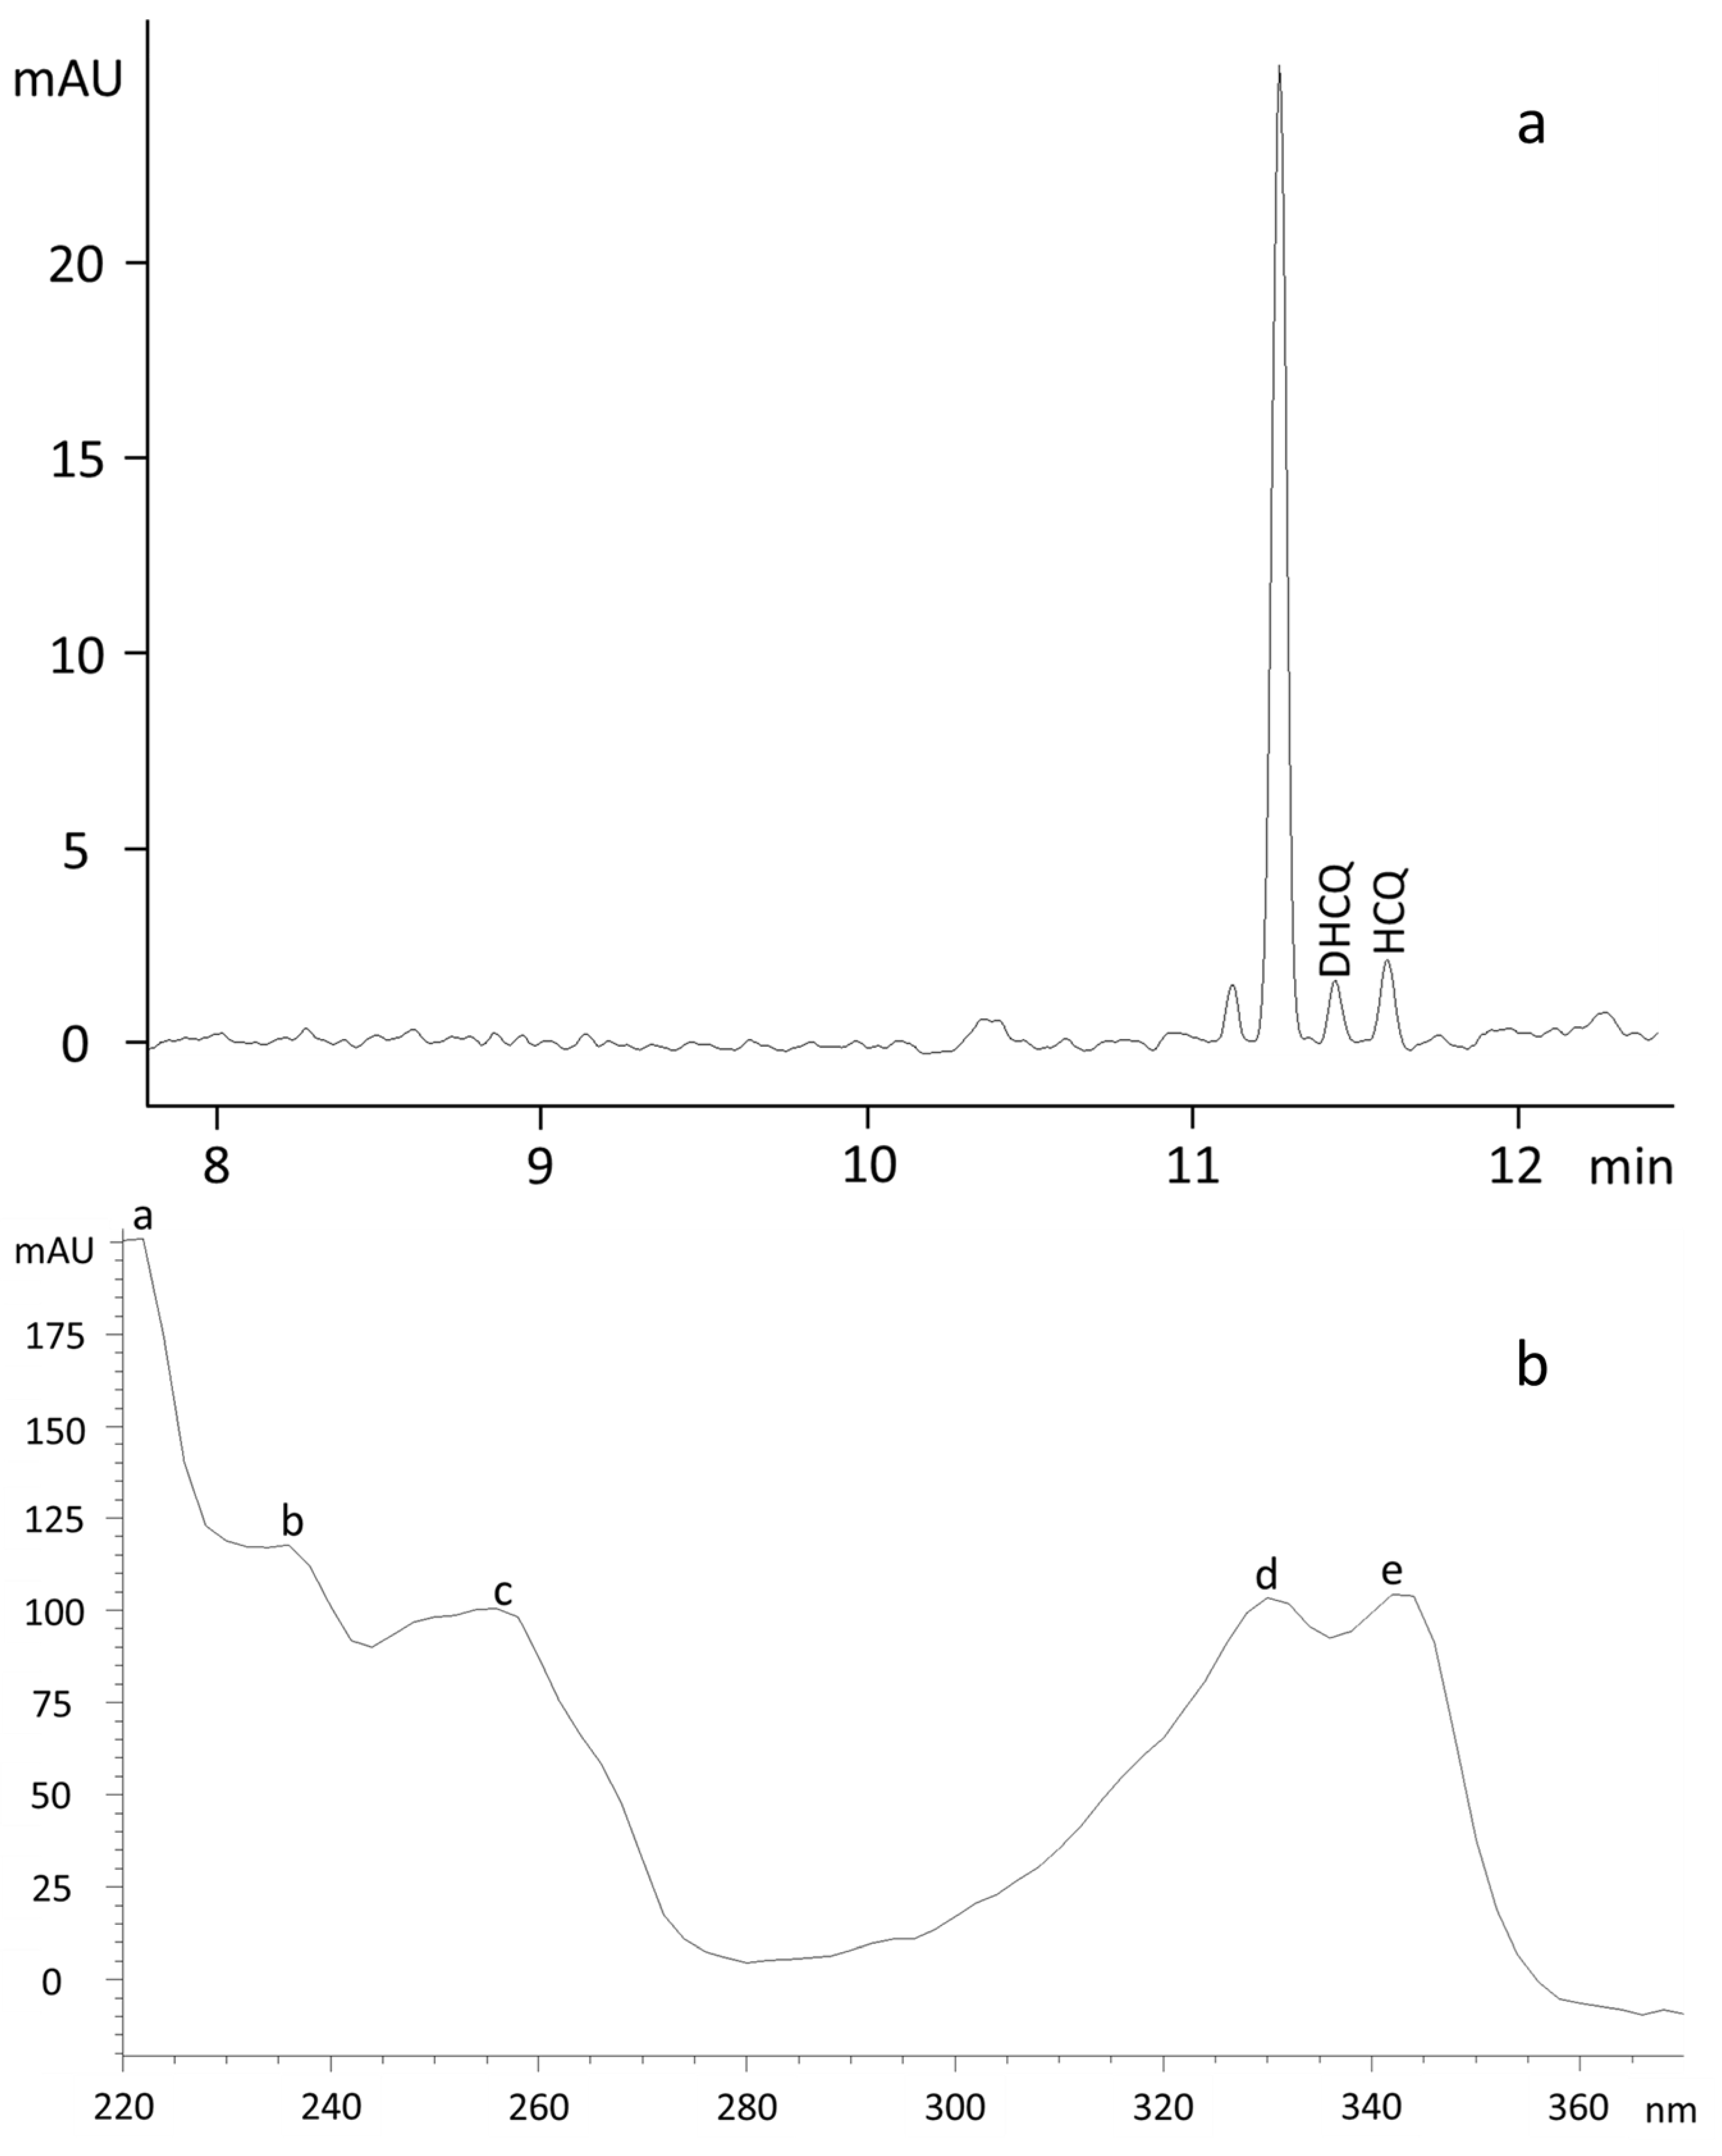
3.4. Clinical Application
4. Discussion
5. Conclusions
Author Contributions
Funding
Institutional Review Board Statement
Informed Consent Statement
Data Availability Statement
Conflicts of Interest
Sample Availability
References
- Hoekenga, M.T. The treatment of malaria with hydroxychloroquine. Am. J. Trop. Med. Hyg. 1955, 4, 221–223. [Google Scholar] [CrossRef]
- Benjamin, O.; Goyal, A.; Lappin, S.L. Disease Modifying Anti-Rheumatic Drugs (DMARD). In StatPearls; StatPearls Publishing: Treasure Island, FL, USA, 2022. [Google Scholar]
- Ponticelli, C.; Moroni, G. Hydroxychloroquine in systemic lupus erythematosus (SLE). Expert Opin. Drug Saf. 2017, 16, 411–419. [Google Scholar] [CrossRef] [PubMed]
- Sharma, O.P. Effectiveness of chloroquine and hydroxychloroquine in treating selected patients with sarcoidosis with neurological involvement. Arch. Neurol. 1998, 55, 1248–1254. [Google Scholar] [CrossRef] [PubMed]
- Kruize, A.A.; Hene, R.J.; Kallenberg, C.G.; van Bijsterveld, O.P.; van der Heide, A.; Kater, L.; Bijlsma, J.W. Hydroxychloroquine treatment for primary Sjogren’s syndrome: A two year double blind crossover trial. Ann. Rheum. Dis. 1993, 52, 360–364. [Google Scholar] [CrossRef] [Green Version]
- Bell, C.L. Hydroxychloroquine sulfate in rheumatoid arthritis: Long-term response rate and predictive parameters. Am. J. Med. 1983, 75, 46–51. [Google Scholar] [CrossRef]
- Warhurst, D.C.; Steele, J.C.; Adagu, I.S.; Craig, J.C.; Cullander, C. Hydroxychloroquine is much less active than chloroquine against chloroquine-resistant Plasmodium falciparum, in agreement with its physicochemical properties. J. Antimicrob. Chemother. 2003, 52, 188–193. [Google Scholar] [CrossRef]
- Pahan, P.; Pahan, K. Smooth or Risky Revisit of an Old Malaria Drug for COVID-19? J. Neuroimmune Pharm. 2020, 15, 174–180. [Google Scholar] [CrossRef]
- Sinha, N.; Balayla, G. Hydroxychloroquine and COVID-19. Postgrad. Med. J. 2020, 96, 550–555. [Google Scholar] [CrossRef] [Green Version]
- Satarker, S.; Ahuja, T.; Banerjee, M.; E, V.B.; Dogra, S.; Agarwal, T.; Nampoothiri, M. Hydroxychloroquine in COVID-19: Potential Mechanism of Action Against SARS-CoV-2. Curr. Pharm. Rep. 2020, 6, 203–211. [Google Scholar] [CrossRef]
- Shrivastava, A. Analytical methods for the determination of hydroxychloroquine in various matrices. Int. J. Appl. Pharm. 2020, 4, 55–61. [Google Scholar] [CrossRef]
- Tett, S.E.; Cutler, D.J.; Day, R.O.; Brown, K.F. Bioavailability of hydroxychloroquine tablets in healthy volunteers. Br. J. Clin. Pharm. 1989, 27, 771–779. [Google Scholar] [CrossRef] [PubMed] [Green Version]
- Shippey, E.A.; Wagler, V.D.; Collamer, A.N. Hydroxychloroquine: An old drug with new relevance. Cleve. Clin. J. Med. 2018, 85, 459–467. [Google Scholar] [CrossRef] [PubMed]
- Derendorf, H. Excessive lysosomal ion-trapping of hydroxychloroquine and azithromycin. Int. J. Antimicrob. Agents 2020, 55, 106007. [Google Scholar] [CrossRef] [PubMed]
- Liu, X.; Jusko, W.J. Physiologically Based Pharmacokinetics of Lysosomotropic Chloroquine in Rat and Human. J. Pharm. Exp. 2021, 376, 261–272. [Google Scholar] [CrossRef]
- Rendic, S.; Guengerich, F.P. Metabolism and Interactions of Chloroquine and Hydroxychloroquine with Human Cytochrome P450 Enzymes and Drug Transporters. Curr. Drug Metab. 2020, 21, 1127–1135. [Google Scholar] [CrossRef]
- Tett, S.E.; Cutler, D.J.; Day, R.O.; Brown, K.F. A dose-ranging study of the pharmacokinetics of hydroxy-chloroquine following intravenous administration to healthy volunteers. Br. J. Clin. Pharm. 1988, 26, 303–313. [Google Scholar] [CrossRef] [Green Version]
- Tett, S.; Cutler, D.; Day, R. Antimalarials in rheumatic diseases. Baillieres Clin. Rheumatol. 1990, 4, 467–489. [Google Scholar] [CrossRef]
- Bodur, S.; Erarpat, S.; Gunkara, O.T.; Bakirdere, S. One step derivatization and dispersive liquid-liquid microextraction of hydroxychloroquine sulfate for its sensitive and accurate determination using GC-MS. J. Pharm. Toxicol. Methods 2022, 113, 107130. [Google Scholar] [CrossRef]
- Bodur, S.; Erarpat, S.; Gunkara, O.T.; Bakirdere, S. Accurate and sensitive determination of hydroxychloroquine sulfate used on COVID-19 patients in human urine, serum and saliva samples by GC-MS. J. Pharm. Anal. 2021, 11, 278–283. [Google Scholar] [CrossRef]
- Tett, S.E.; Cutler, D.J.; Brown, K.F. High-performance liquid chromatographic assay for hydroxychloroquine and metabolites in blood and plasma, using a stationary phase of poly(styrene divinylbenzene) and a mobile phase at pH 11, with fluorimetric detection. J. Chromatogr. 1985, 344, 241–248. [Google Scholar] [CrossRef]
- Brown, R.R.; Stroshane, R.M.; Benziger, D.P. High-performance liquid chromatographic assay for hydroxychloroquine and three of its major metabolites, desethylhydroxychloroquine, desethylchloroquine and bidesethylchloroquine, in human plasma. J. Chromatogr. 1986, 377, 454–459. [Google Scholar] [CrossRef]
- Wang, L.Z.; Ong, R.Y.; Chin, T.M.; Thuya, W.L.; Wan, S.C.; Wong, A.L.; Chan, S.Y.; Ho, P.C.; Goh, B.C. Method development and validation for rapid quantification of hydroxychloroquine in human blood using liquid chromatography-tandem mass spectrometry. J. Pharm. Biomed. Anal. 2012, 61, 86–92. [Google Scholar] [CrossRef] [PubMed]
- Soichot, M.; Megarbane, B.; Houze, P.; Chevillard, L.; Fonsart, J.; Baud, F.J.; Laprevote, O.; Bourgogne, E. Development, validation and clinical application of a LC-MS/MS method for the simultaneous quantification of hydroxychloroquine and its active metabolites in human whole blood. J. Pharm. Biomed. Anal. 2014, 100, 131–137. [Google Scholar] [CrossRef] [PubMed]
- Ferraz, L.R.M.; Santos, F.L.A.; Ferreira, P.A.; Maia-Junior, R.T.L.; Rosa, T.A.; Costa, S.P.M.; Melo, C.M.; Rolim, L.A.; Rolim-Neto, P.J. Quality by design in the development and validation of analytical method by ultraviolet-visible spectrophotometry for quantification of hydroxychloroquine sulfate. Int. J. Pharm. Sci. Res. 2014, 5, 4666–4676. [Google Scholar]
- Singh, A.; Kishora, R.; Sharma, P.K.; Gupta, R.; Mondal, N.; Kumar, S.; Kumar, M. Development and validation of UV-spectrophotometric method for the estimation of hydroxychloroquine sulphate. Indian J. Chem. Technol. 2016, 23, 237–239. [Google Scholar]
- Mehta, S.S.; Patel, M.B. Development and validation of UV spectrophotometric method for the determination of hydroxychloroquine in bulk and tablet formulation. Pharma Sci. Monit. 2012, 3, 2959–2967. [Google Scholar]
- Dickow Cardoso, C.; Polisel Jabor, V.A.; Sueli Bonato, P. Capillary electrophoretic chiral separation of hydroxychloroquine and its metabolites in the microsomal fraction of liver homogenates. Electrophoresis 2006, 27, 1248–1254. [Google Scholar] [CrossRef]
- De Oliveira, A.R.; Cardoso, C.D.; Bonato, P.S. Stereoselective determination of hydroxychloroquine and its metabolites in human urine by liquid-phase microextraction and CE. Electrophoresis 2007, 28, 1081–1091. [Google Scholar] [CrossRef]
- Sotgia, S.; Fois, A.G.; Sotgiu, E.; Zinellu, A.; Paliogiannis, P.; Mangoni, A.A.; Carru, C. Micellar electrokinetic capillary chromatographic determination of pirfenidone and 5-carboxy-pirfenidone by direct injection of plasma from patients receiving treatment for idiopathic pulmonary fibrosis (IPF). Microchem. J. 2020, 154, 104536. [Google Scholar] [CrossRef]
- Zinellu, A.; Carru, C.; Sotgia, S.; Porqueddu, E.; Enrico, P.; Deiana, L. Separation of aceclofenac and diclofenac in human plasma by free zone capillary electrophoresis using N-methyl-D-glucamine as an effective electrolyte additive. Eur. J. Pharm. Sci. 2005, 24, 375–380. [Google Scholar] [CrossRef]
- Thormann, W.; Zhang, C.X.; Schmutz, A. Capillary electrophoresis for drug analysis in body fluids. Drug Monit. 1996, 18, 506–520. [Google Scholar] [CrossRef] [PubMed]
- Schroeder, R.L.; Gerber, J.P. Chloroquine and hydroxychloroquine binding to melanin: Some possible consequences for pathologies. Toxicol. Rep. 2014, 1, 963–968. [Google Scholar] [CrossRef] [PubMed] [Green Version]
- Wehr, T. Capillary Zone Electrophoresis. In Encyclopedia of Physical Science and Technology, 3rd ed.; Meyers, R.A., Ed.; Academic Press: San Diego, CA, USA, 2003; pp. 355–368. [Google Scholar]
- Stalcup, A.M.; Agyei, N.M. Heparin: A chiral mobile-phase additive for capillary zone electrophoresis. Anal. Chem. 1994, 66, 3054–3059. [Google Scholar] [CrossRef] [PubMed]
- Lee, Y.J.; Price, W.E.; Sheil, M. Effect of organic solvents on the separation of benzoic acids by capillary electrophoresis. Analyst 1995, 120, 2689–2694. [Google Scholar] [CrossRef] [Green Version]
- Munster, T.; Gibbs, J.P.; Shen, D.; Baethge, B.A.; Botstein, G.R.; Caldwell, J.; Dietz, F.; Ettlinger, R.; Golden, H.E.; Lindsley, H.; et al. Hydroxychloroquine concentration-response relationships in patients with rheumatoid arthritis. Arthritis Rheum. 2002, 46, 1460–1469. [Google Scholar] [CrossRef]
- Somer, M.; Kallio, J.; Pesonen, U.; Pyykko, K.; Huupponen, R.; Scheinin, M. Influence of hydroxychloroquine on the bioavailability of oral metoprolol. Br. J. Clin. Pharm. 2000, 49, 549–554. [Google Scholar] [CrossRef]

| Analyte | Linear Range (µmol/L) | LOD (µmol/L) | LOQ (µmol/L) | Intra-Day Precision (%RSD) | Inter-Day Precision (%RSD) | Recovery (%) | ||
|---|---|---|---|---|---|---|---|---|
| HCQ | 0.5–8 | 0.13 ± 0.04 | 0.37 ± 0.03 | LoQC | 4.4 | LoQC | 7.1 | 99–101 |
| MeQC | 2.8 | MeQC | 5.2 | |||||
| HiQC | 5.0 | HiQC | 4.9 | |||||
| DHCQ | 0.5–8 | 0.13 ± 0.06 | 0.43 ± 0.04 | LoQC | 5.1 | LoQC | 5.1 | 98–99 |
| MeQC | 3.2 | MeQC | 5.2 | |||||
| HiQC | 4.3 | HiQC | 6.9 | |||||
Publisher’s Note: MDPI stays neutral with regard to jurisdictional claims in published maps and institutional affiliations. |
© 2022 by the authors. Licensee MDPI, Basel, Switzerland. This article is an open access article distributed under the terms and conditions of the Creative Commons Attribution (CC BY) license (https://creativecommons.org/licenses/by/4.0/).
Share and Cite
Sotgia, S.; Zinellu, A.; Mundula, N.; Mangoni, A.A.; Carru, C.; Erre, G.L. A Capillary Electrophoresis-Based Method for the Measurement of Hydroxychloroquine and Its Active Metabolite Desethyl Hydroxychloroquine in Whole Blood in Patients with Rheumatoid Arthritis. Molecules 2022, 27, 3901. https://doi.org/10.3390/molecules27123901
Sotgia S, Zinellu A, Mundula N, Mangoni AA, Carru C, Erre GL. A Capillary Electrophoresis-Based Method for the Measurement of Hydroxychloroquine and Its Active Metabolite Desethyl Hydroxychloroquine in Whole Blood in Patients with Rheumatoid Arthritis. Molecules. 2022; 27(12):3901. https://doi.org/10.3390/molecules27123901
Chicago/Turabian StyleSotgia, Salvatore, Angelo Zinellu, Nicola Mundula, Arduino A. Mangoni, Ciriaco Carru, and Gian Luca Erre. 2022. "A Capillary Electrophoresis-Based Method for the Measurement of Hydroxychloroquine and Its Active Metabolite Desethyl Hydroxychloroquine in Whole Blood in Patients with Rheumatoid Arthritis" Molecules 27, no. 12: 3901. https://doi.org/10.3390/molecules27123901
APA StyleSotgia, S., Zinellu, A., Mundula, N., Mangoni, A. A., Carru, C., & Erre, G. L. (2022). A Capillary Electrophoresis-Based Method for the Measurement of Hydroxychloroquine and Its Active Metabolite Desethyl Hydroxychloroquine in Whole Blood in Patients with Rheumatoid Arthritis. Molecules, 27(12), 3901. https://doi.org/10.3390/molecules27123901