Article

The Expression Profiles of the Salvia miltiorrhiza 3-Hydroxy-3-methylglutaryl-coenzyme A Reductase 4 Gene and Its Influence on the Biosynthesis of Tanshinones

1
Department of Biology and Pharmaceutical Botany, Medical University of Lodz, Muszyńskiego 1, 90-151 Lodz, Poland
2
Laboratory of Molecular Diagnostics and Pharmacogenomics, Department of Pharmaceutical Biochemistry and Molecular Diagnostics, Medical University of Lodz, Muszyńskiego 1, 90-151 Lodz, Poland
*
Authors to whom correspondence should be addressed.
Molecules 2022, 27(14), 4354; https://doi.org/10.3390/molecules27144354
Submission received: 4 May 2022 / Revised: 17 June 2022 / Accepted: 29 June 2022 / Published: 7 July 2022
(This article belongs to the Section Medicinal Chemistry)

Abstract

:
Salvia miltiorrhiza is a medicinal plant that synthesises biologically-active tanshinones with numerous therapeutic properties. An important rate-limiting enzyme in the biosynthesis of their precursors is 3-hydroxy-3-methylglutaryl-coenzyme A reductase (HMGR). This study presents the organ-specific expression profile of the S. miltiorrhiza HMGR4 gene and its sensitivity to potential regulators, viz. gibberellic acid (GA3), indole-3-acetic acid (IAA) and salicylic acid (SA). In addition, it demonstrates the importance of the HMGR4 gene, the hormone used, the plant organ, and the culture environment for the biosynthesis of tanshinones. HMGR4 overexpression was found to significantly boost the accumulation of dihydrotanshinone I (DHTI), cryptotanshinone (CT), tanshinone I (TI) and tanshinone IIA (TIIA) in roots by 0.44 to 5.39 mg/g dry weight (DW), as well as TIIA in stems and leaves. S. miltiorrhiza roots cultivated in soil demonstrated higher concentrations of the examined metabolites than those grown in vitro. GA3 caused a considerable increase in the quantity of CT (by 794.2 µg/g DW) and TIIA (by 88.1 µg/g DW) in roots. In turn, IAA significantly inhibited the biosynthesis of the studied tanshinones in root material.

1. Introduction

Salvia miltiorrhiza Bunge, also known as Chinese sage or Red sage, is one of the basic elements of traditional Chinese medicine used in treating diverse conditions, such as cardiovascular diseases, menstrual disorders and insomnia [1,2]. The medical properties of this plant result from the biosynthesis of various bioactive compounds, including tanshinones. Recent research indicates that tanshinones provide cardiovascular protection [3], regulate metabolic functions [4], and possess a range of anticancer [5], neuroprotective [6], anti-inflammatory [7], antioxidant [8], phytoestrogenic [9], antiosteoporotic [10], antibacterial [11] and anti-aggregation [12] properties.
Among the several dozen tanshinones isolated from S. miltiorrhiza so far [13], the most studied are dihydrotanshinone I (DHTI), cryptotanshinone (CT), tanshinone I (TI) and tanshinone IIA (TIIA). The starting point for the production of the tanshinone diterpene backbone is the synthesis of isopentenyl pyrophosphate (IPP) and dimethylallyl pyrophosphate (DMAPP) precursors through the mevalonate (MVA) and methylerythritol phosphate (MEP) pathways [14]. The key rate-limiting enzyme in the MVA pathway, catalysing the conversion of 3-hydroxy-3-methylglutaryl-coenzyme A (HMG-CoA) to MVA, is HMG-CoA reductase (HMGR) [14]. A recent search found five sequences of S. miltiorrhiza HMGR genes (HMGR to HMGR4) currently deposited in the GenBank database [15,16,17]. Among them is HMGR4, which, unlike other genes, has not been extensively studied, and its importance in the biosynthesis of tanshinones has not been investigated.
Whereas the annual consumption of S. miltiorrhiza in China exceeds 16 million kg, the low concentration of tanshinones in plant material and limited arable land available for cultivation, make the meeting of growing demand more and more problematic [14]. Therefore, alternative sources of S. miltiorrhiza plant material, such as hairy roots or cell and callus cultures are under development [18]. These sources offer continuous biosynthesis of tanshinones, and their concentration may be boosted by the application of chemical or physical components known as elicitors [19,20,21].
Gibberellic acid (GA3) regulates vegetative and reproductive growth by triggering the degradation of DELLA proteins, these being master repressors of its signaling [22,23]. Initially, a bioactive hormone binds to the gibberellin-insensitive DWARF 1 (GID1) receptor and induces a conformational change in its N-terminal fragment, enabling DELLA binding. The DELLA proteins are then polyubiquitinated by E3 ubiquitin ligases such as SLEEPY1 and constitutively photomorphogenic 1 (COP1), and directed towards the destruction in 26S proteasome [24]. Removing the DELLA proteins releases repressed transcription factors (TFs), enabling gene expression regulation. Dominant TFs regulated by GA3 are GAI-RGA-SCR (GRAS) proteins [25]. In S. miltiorrhiza most of the 35 identified GRAS TFs are induced by GA3 [25]. It has been proven that the overexpression of GRAS1 and GRAS2 in S. miltiorrhiza hairy roots increases the accumulation of DHTI, CT, TI and TIIA [26].
In the auxin signaling pathway, the transcription of effector genes is controlled by the interaction of auxin/indole-3-acetic acid (Aux/IAA) repressor with transport inhibitor resistant 1/auxin signaling F-box (TIR1/AFB) proteins [27]. Ubiquitination of these complexes by suppressor of kinetochore protein 1 (SKP1)/cullin1/F-box (SCF) E3 ubiquitin ligase complex and subsequent proteasome-dependent degradation, enable auxin response factors (ARFs) to regulate gene transcription [28]. The proper initiation of gene expression usually requires dimerization of ARFs, that bind to closely-located TGTCGG inverted repeats and TGTCTC or TGTCGG direct repeats [29]. The complexity of auxin-dependent gene regulation in S. miltiorrhiza is increased by the fact that most of the 25 studied ARFs have an inhibitory effect on the transcription rate [30].
In the salicylic acid (SA) signaling route, the non-expressor of pathogenesis-related genes 1 (NPR1) acts as the master regulator of the plant response [31]. In the absence of SA, the N-terminal BTB domain of NPR1 interacts with the C-terminal transactivation domain to inhibit NPR1 transcription activity [32]. NPR1 is activated through copper-dependent binding of SA [32]. This protein lacks its own DNA-binding domain and expresses its trans-activatory function through interaction with bZIP family TFs [33]. Such SA-responsive TGACG transcription factor binding sites (TFBSs) have been found in numerous plant promoters [34,35,36]. Another group of TFs controlled by SA are WRKY; among these, WRKY1 strongly induces the genes of the tanshinone biosynthesis pathway through interaction with the W-box (T)TGAC(C/T) element [37].
This work examines the organ-specific expression pattern of the S. miltiorrhiza HMGR4 gene and the influence of selected phytohormones (GA3, indole-3-acetic acid (IAA), SA) on its transcription level. These experiments were carried out on wild, in vitro-grown plants. In silico analysis of the S. miltiorrhiza HMGR4 promoter performed with PlantPan 2.0 tool was used to select the appropriate hormones. Moreover, this study investigates the importance of the HMGR4 gene, the hormone used, the plant organ and the growth environment for the biosynthesis of DHTI, CT, TI, TIIA and total tanshinone using transgenic S. miltiorrhiza plants grown in vitro and in soil. The use of hormones is aimed at modulating the HMGR4 gene expression and thus obtaining information on the presumed role of this gene in the biosynthesis of tanshinones, as well as influencing their content.

2. Results

2.1. Organ-Specific Expression of S. miltiorrhiza HMGR4 Gene

Real-time qPCR results showed that HMGR4 gene was expressed in all analysed S. miltiorrhiza organs, but with different intensities. The leaves and stems demonstrated higher levels of the HMGR4 transcript than the reference, with R = 1.14 ± 0.08 and R = 1.05 ± 0.01, respectively; in roots, the level was lower than in the reference with R = 0.95 ± 0.07.
Due to their level of transcript and high availability of material for research, it was decided to use the leaves to study the effect of hormones on S. miltiorrhiza HMGR4 activity.

2.2. Potential Regulators of S. miltiorrhiza HMGR4 Gene Expression

Sequence analysis of the S. miltiorrhiza HMGR4 promoter using the PlantPan 2.0 tool showed the existence of 5369 potential TFBSs and 365 interacting TFs previously detected in the Arabidopsis thaliana model plant. The similarity score between the TFBSs found in HMGR4 promoter and those identified in A. thaliana was set to 0.7–1.0. Of all the TFs detected, a large group was able to respond to hormonal agents; many of these were sensitive to GA3, IAA and SA (Table 1, Tables S1–S3). It is worth emphasising that these TFs also had potential binding sites in the HMGR4 proximal promoter region (Tables S1–S3), where most functional TFBSs are believed to be located [38,39]. Therefore, it was decided to investigate the importance of these hormones on the expression of S. miltiorrhiza HMGR4.

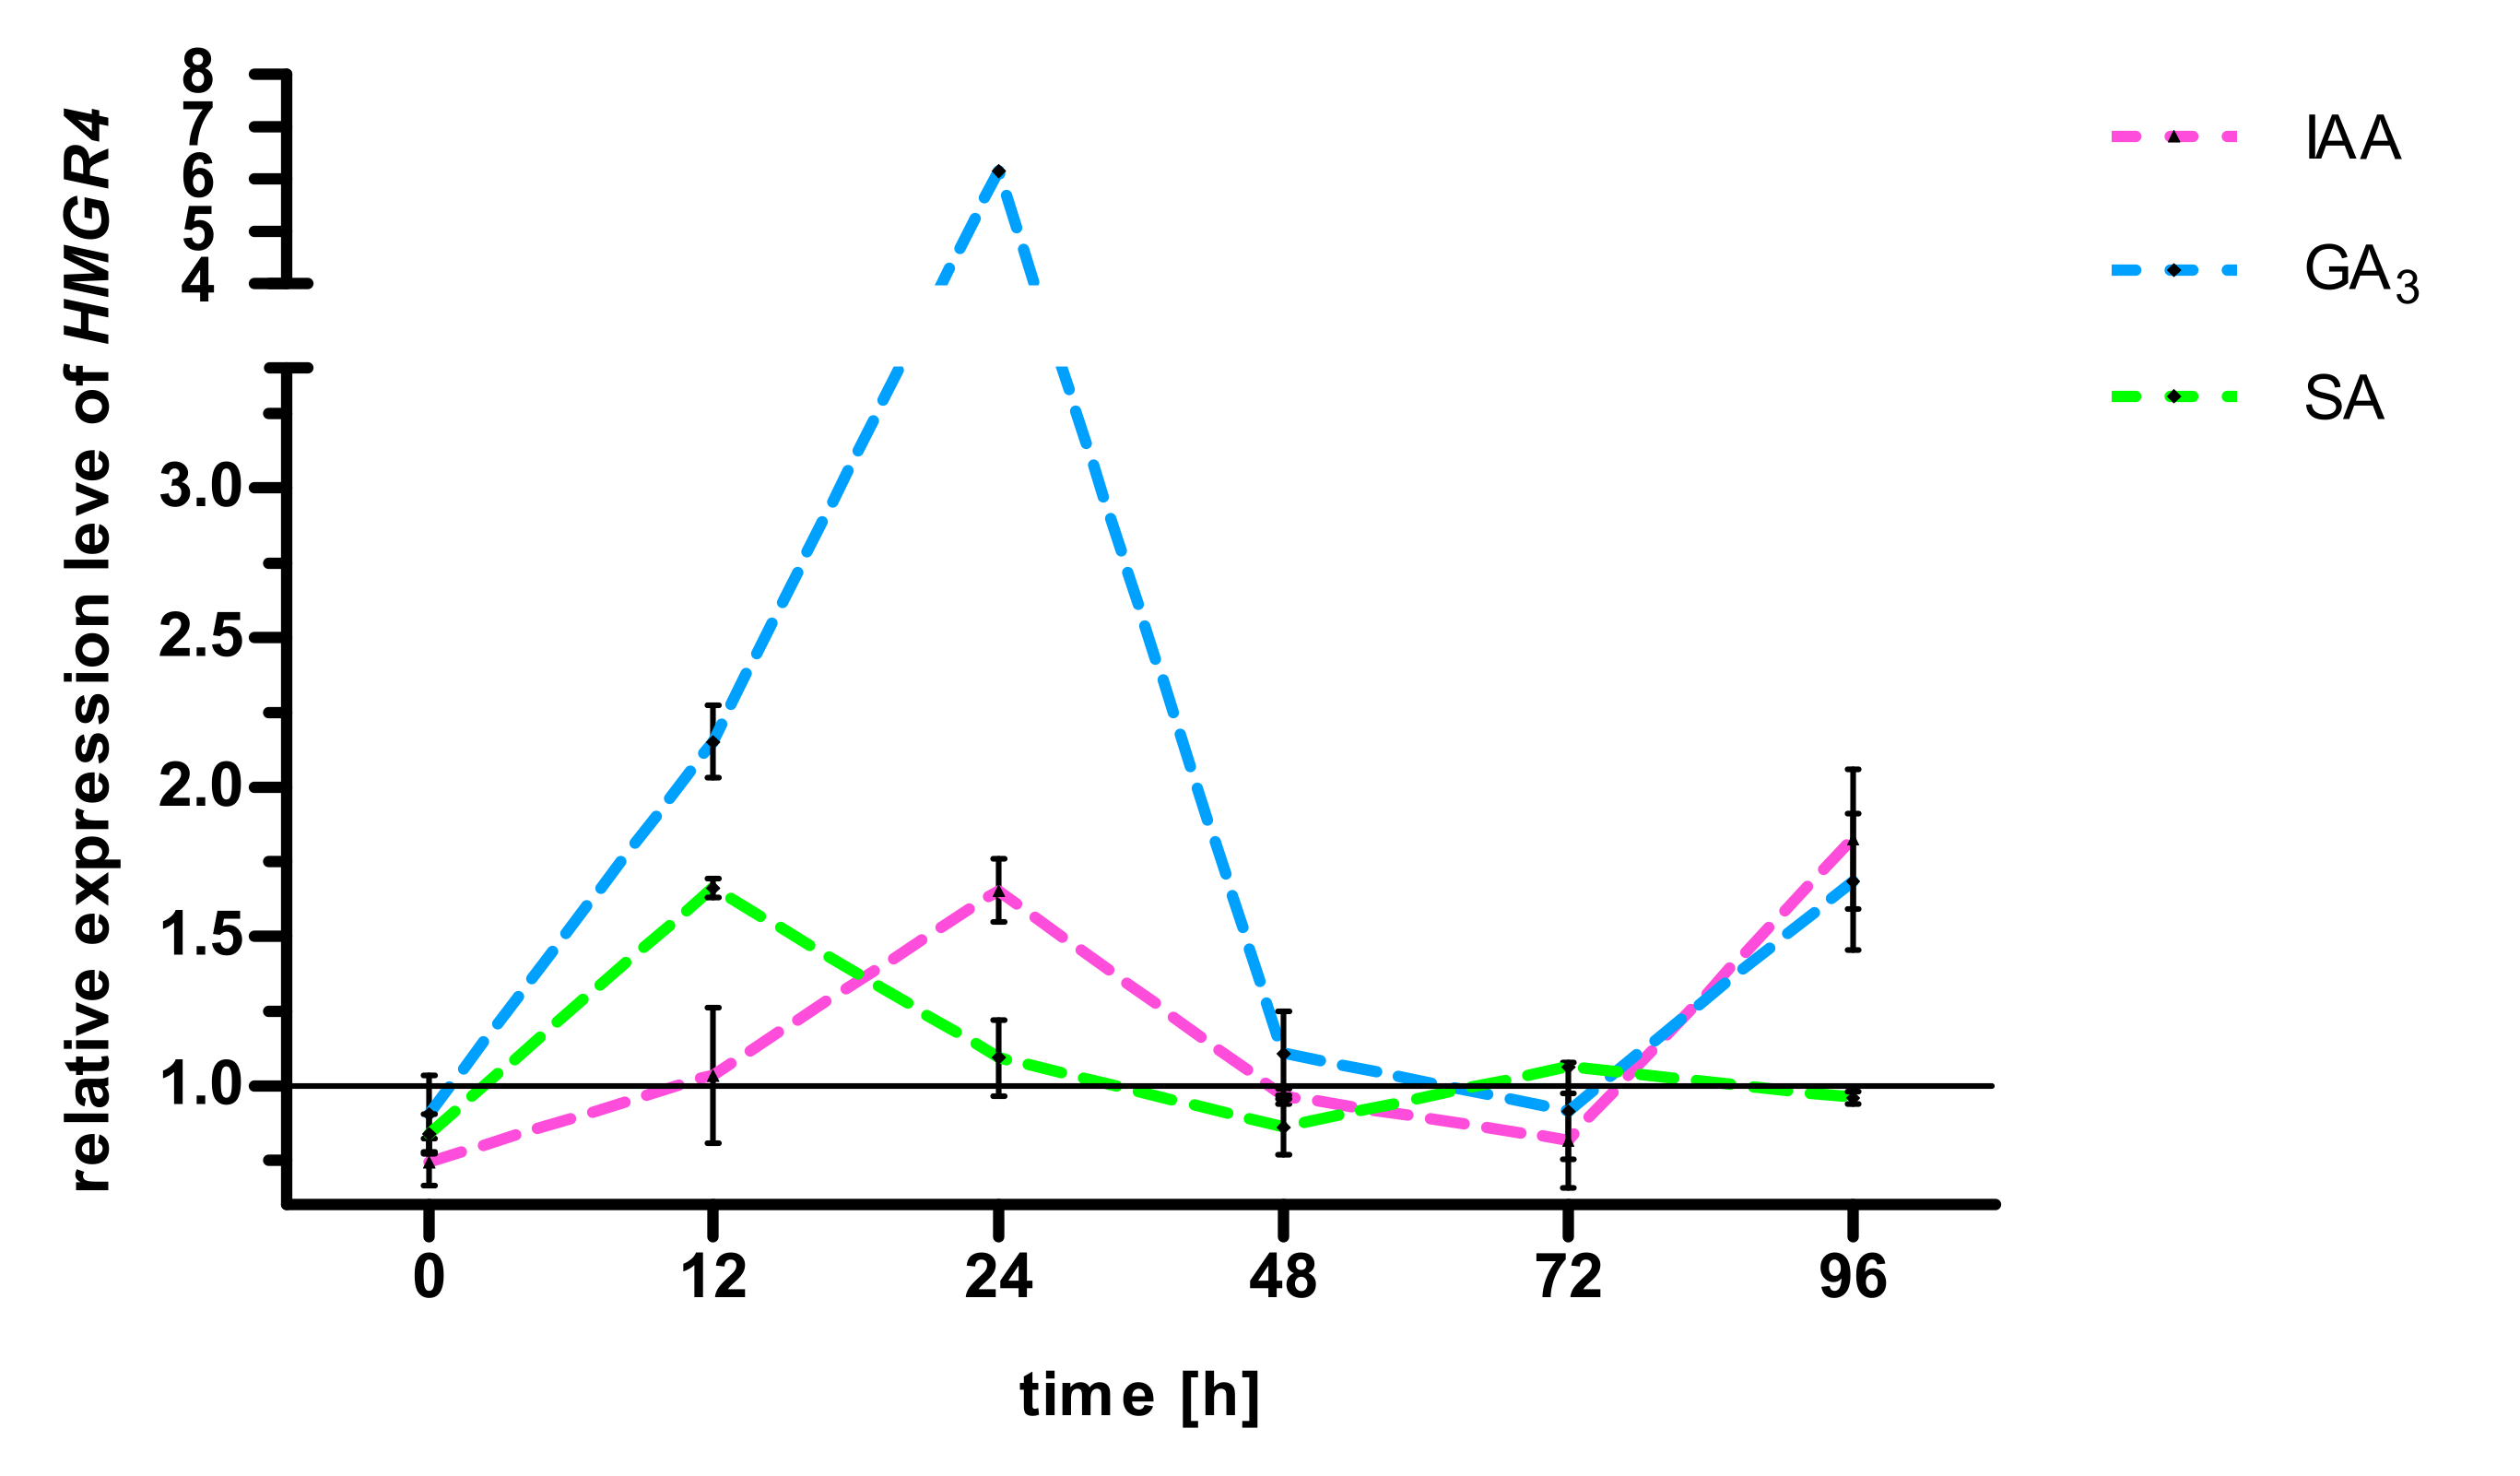
2.3. Effect of GA3, IAA, SA on S. miltiorrhiza HMGR4 Gene Expression

The hormones used in the experiment changed the expression of HMGR4 in treated leaves compared to control (leaves not incubated with hormones) (Figure 1). At the beginning of each study, a lower HMGR4 transcript level was observed in the test materials than in corresponding control (R < 1). Treatment with GA3 or IAA or SA for 12 and 24 h resulted in the stimulation of HMGR4 expression against untreated samples (R > 1). It is worth noting that the exposure of leaves to GA3 resulted in an approximately 2.86-fold increase in HMGR4 expression between 12 and 24 h, and the stimulation effect was also maintained at 48 h. From 48 h, the level of HMGR4 transcript in the hormone-treated samples decreased compared to the control (R < 1). In the final part of the testing (72 h for SA and 96 h for GA3 and IAA) the level of HMGR4 mRNA increased again in leaves incubated with hormones compared to untreated samples (R > 1).
Based on the obtained results, GA3 and IAA were selected for experiments determining the tanshinone content.

2.4. Impact of pRI201-AN-HMGR4 Transformation on S. miltiorrhiza HMGR4 Gene Expression

Higher levels of the HMGR4 transcript were observed in all S. miltiorrhiza organs taken from plants transformed with the pRI201-AN-HMGR4 construct compared to control (R > 1). The R values for stems, roots and leaves, were 1.28 ± 0.19, 1.25 ± 0.14 and 1.10 ± 0.14, respectively.

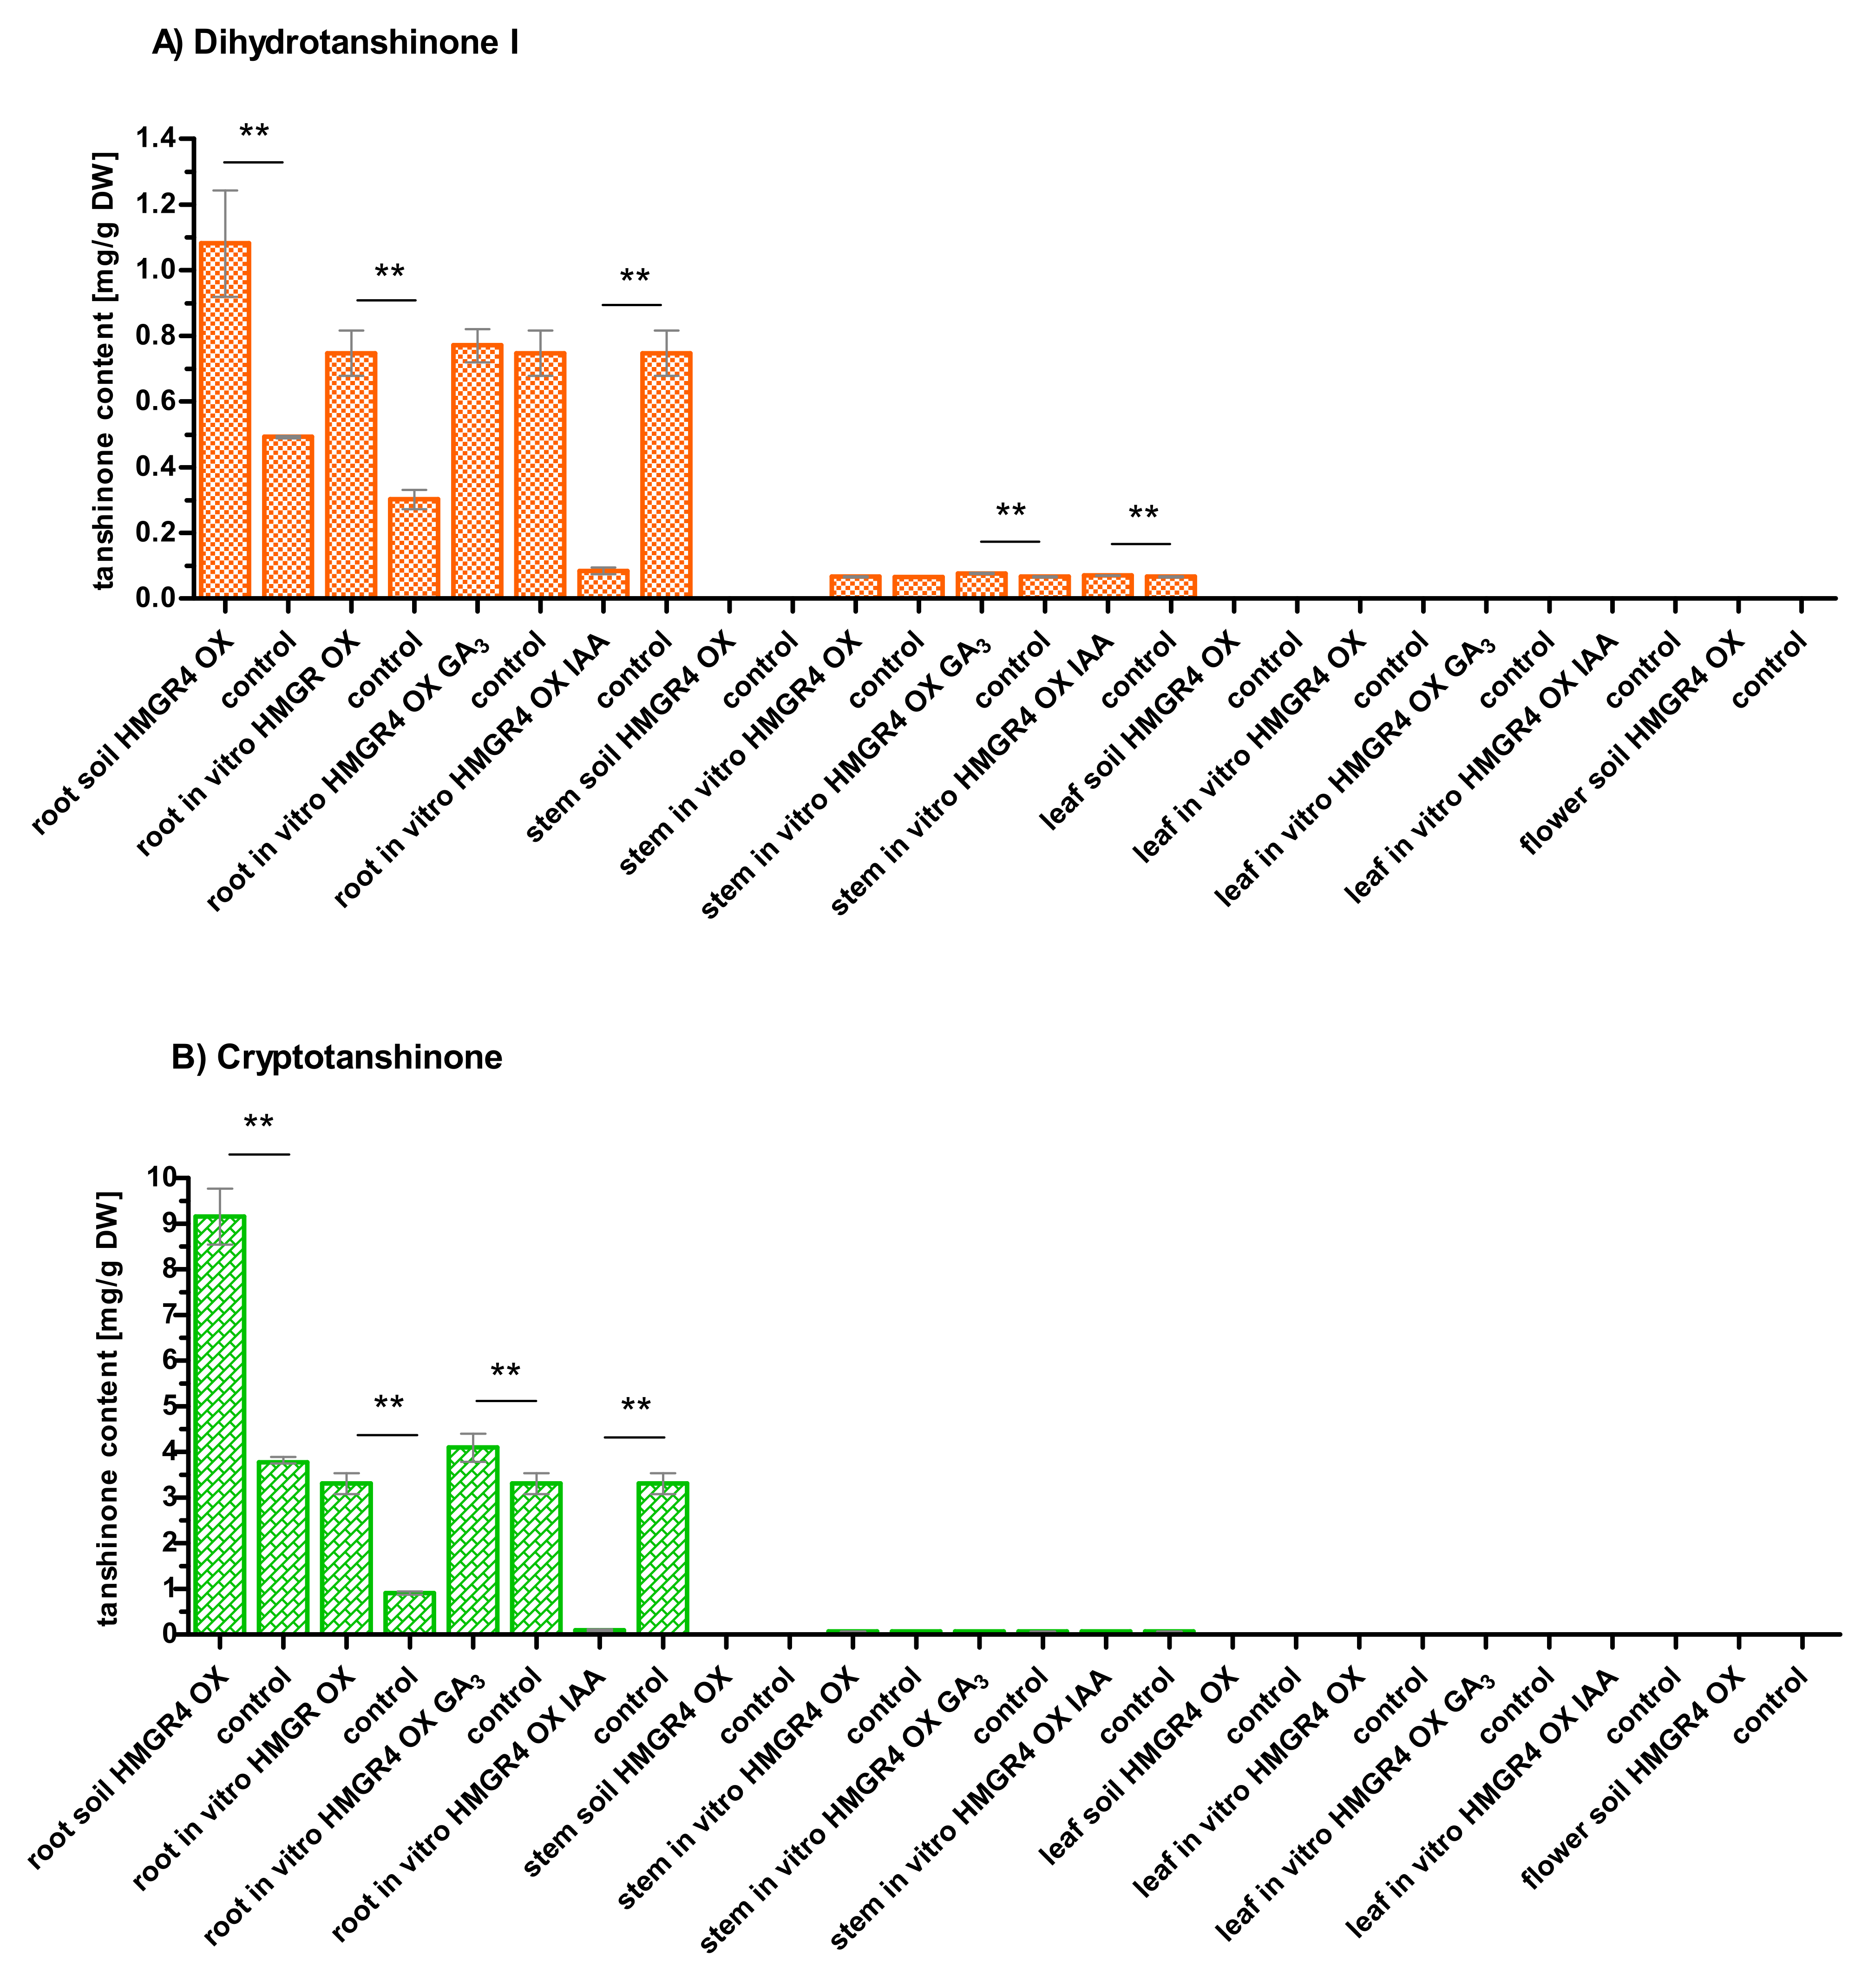
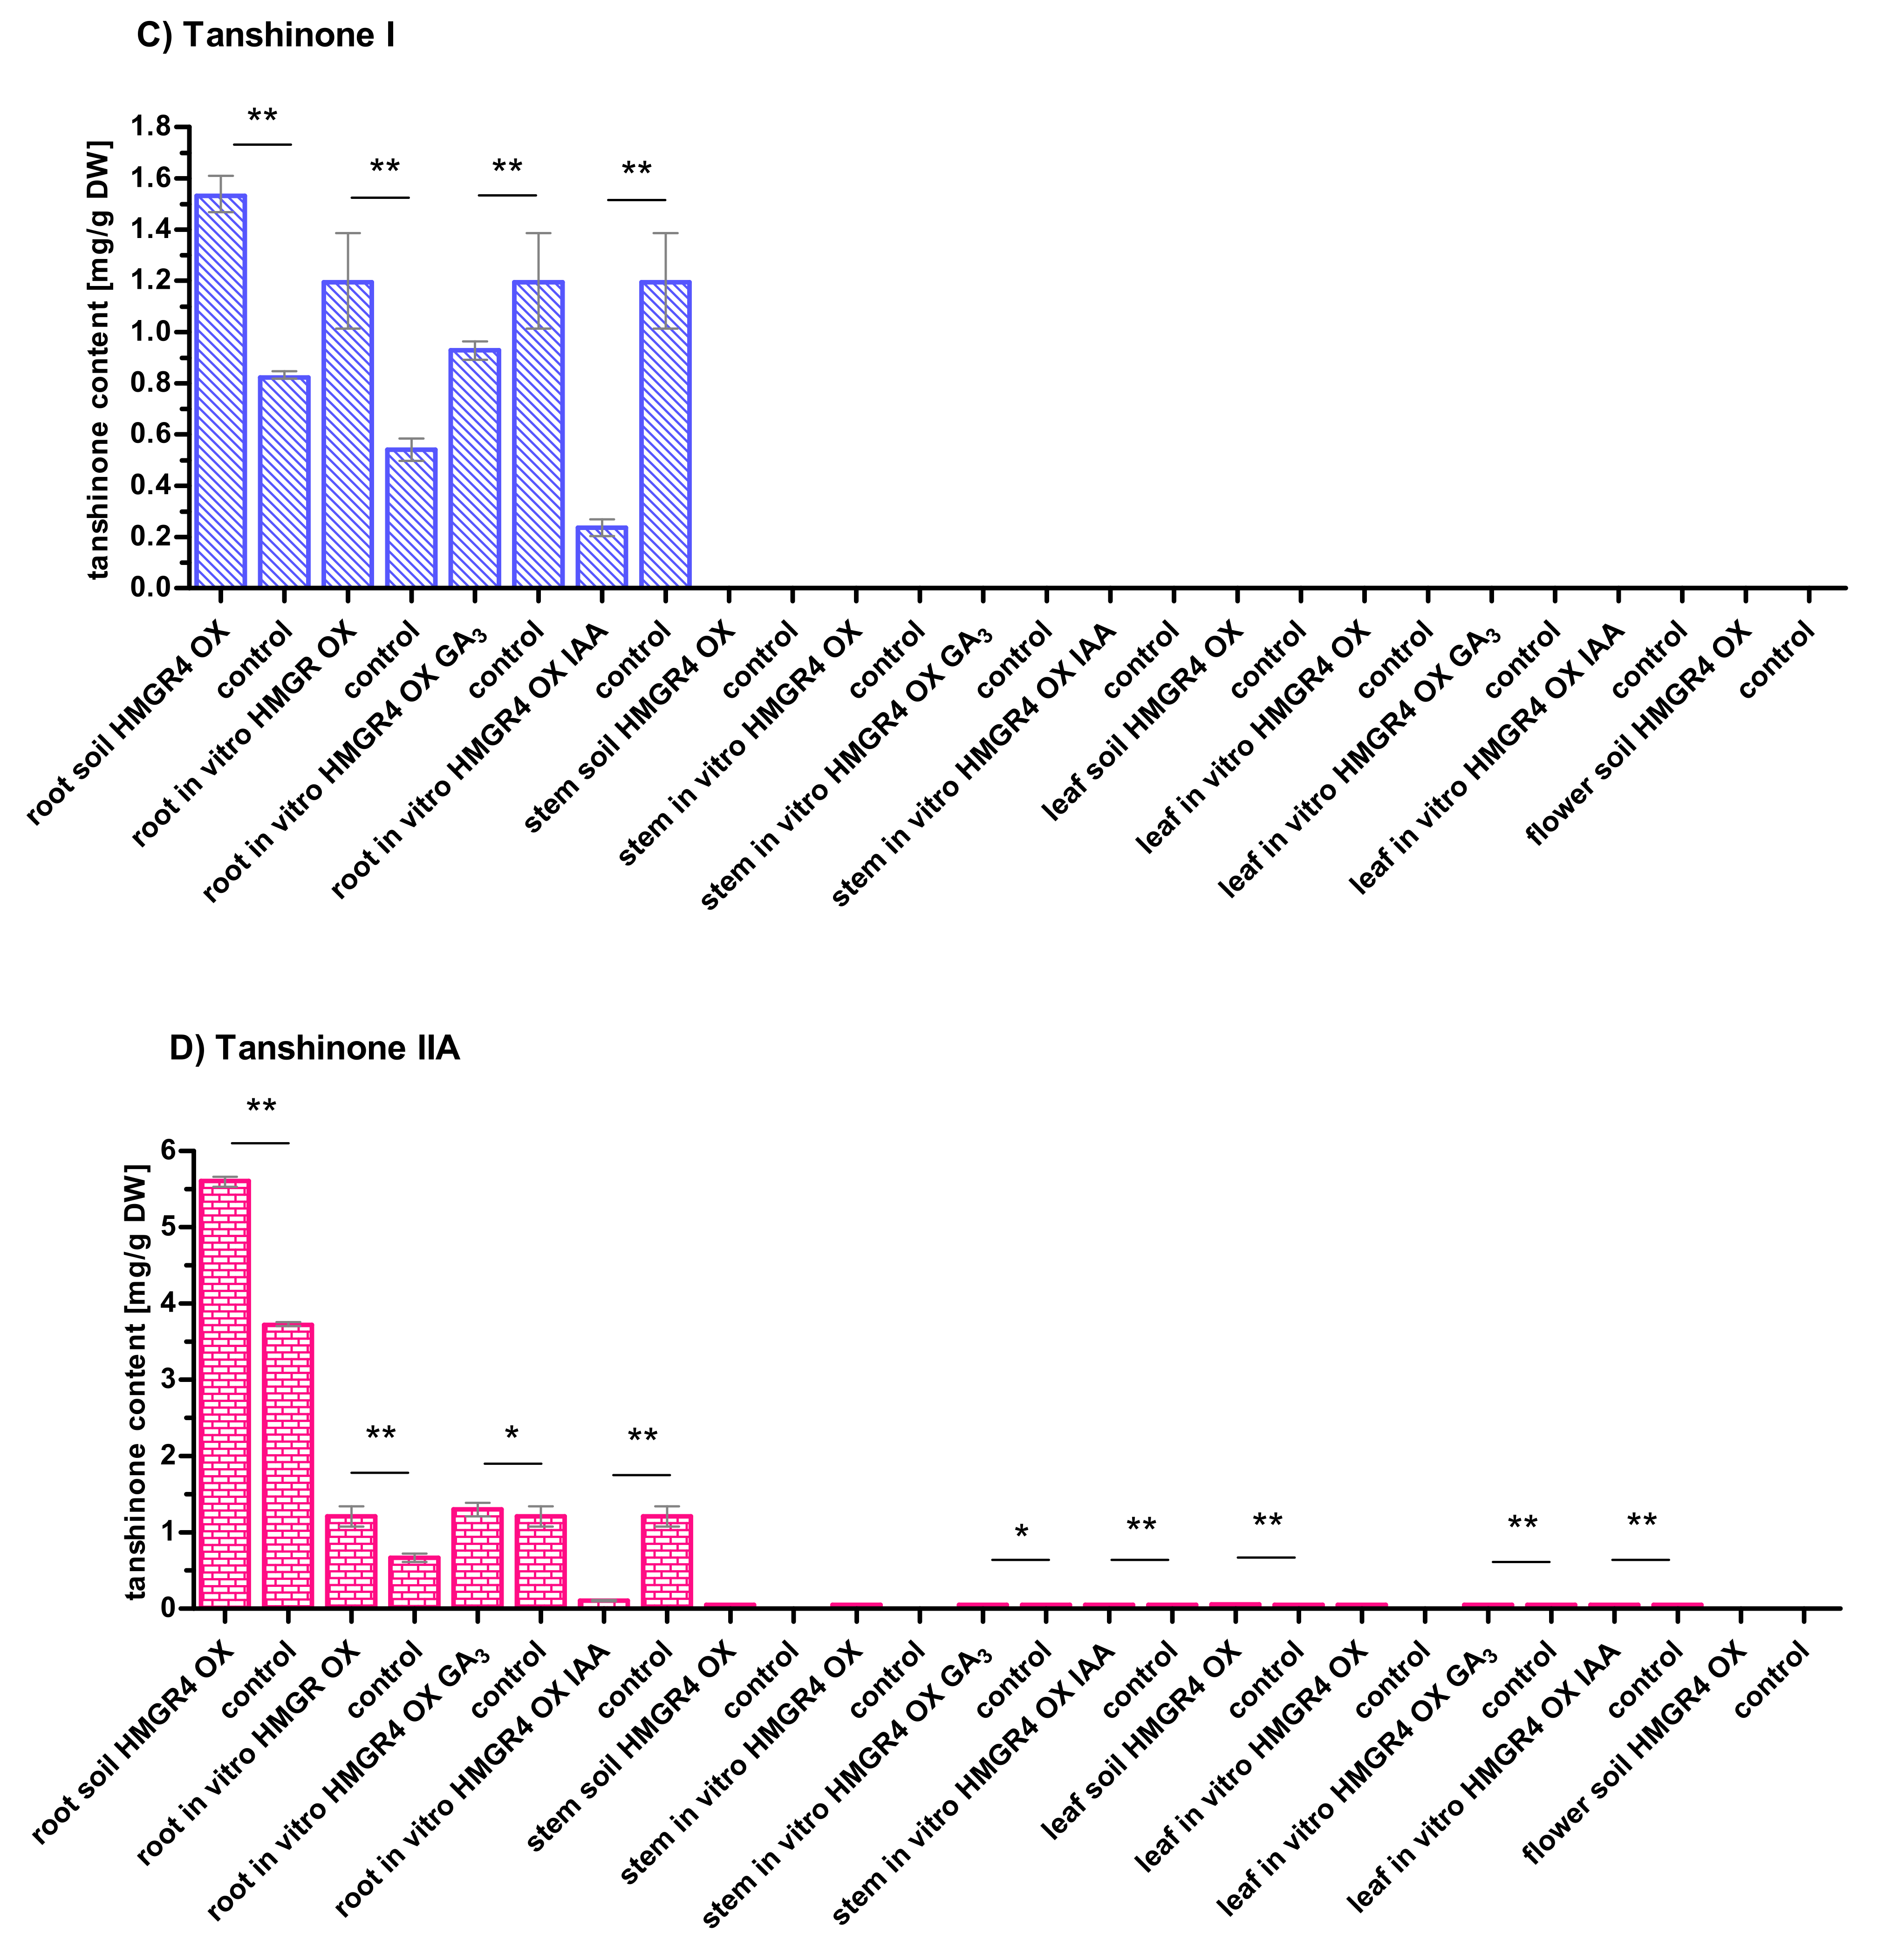
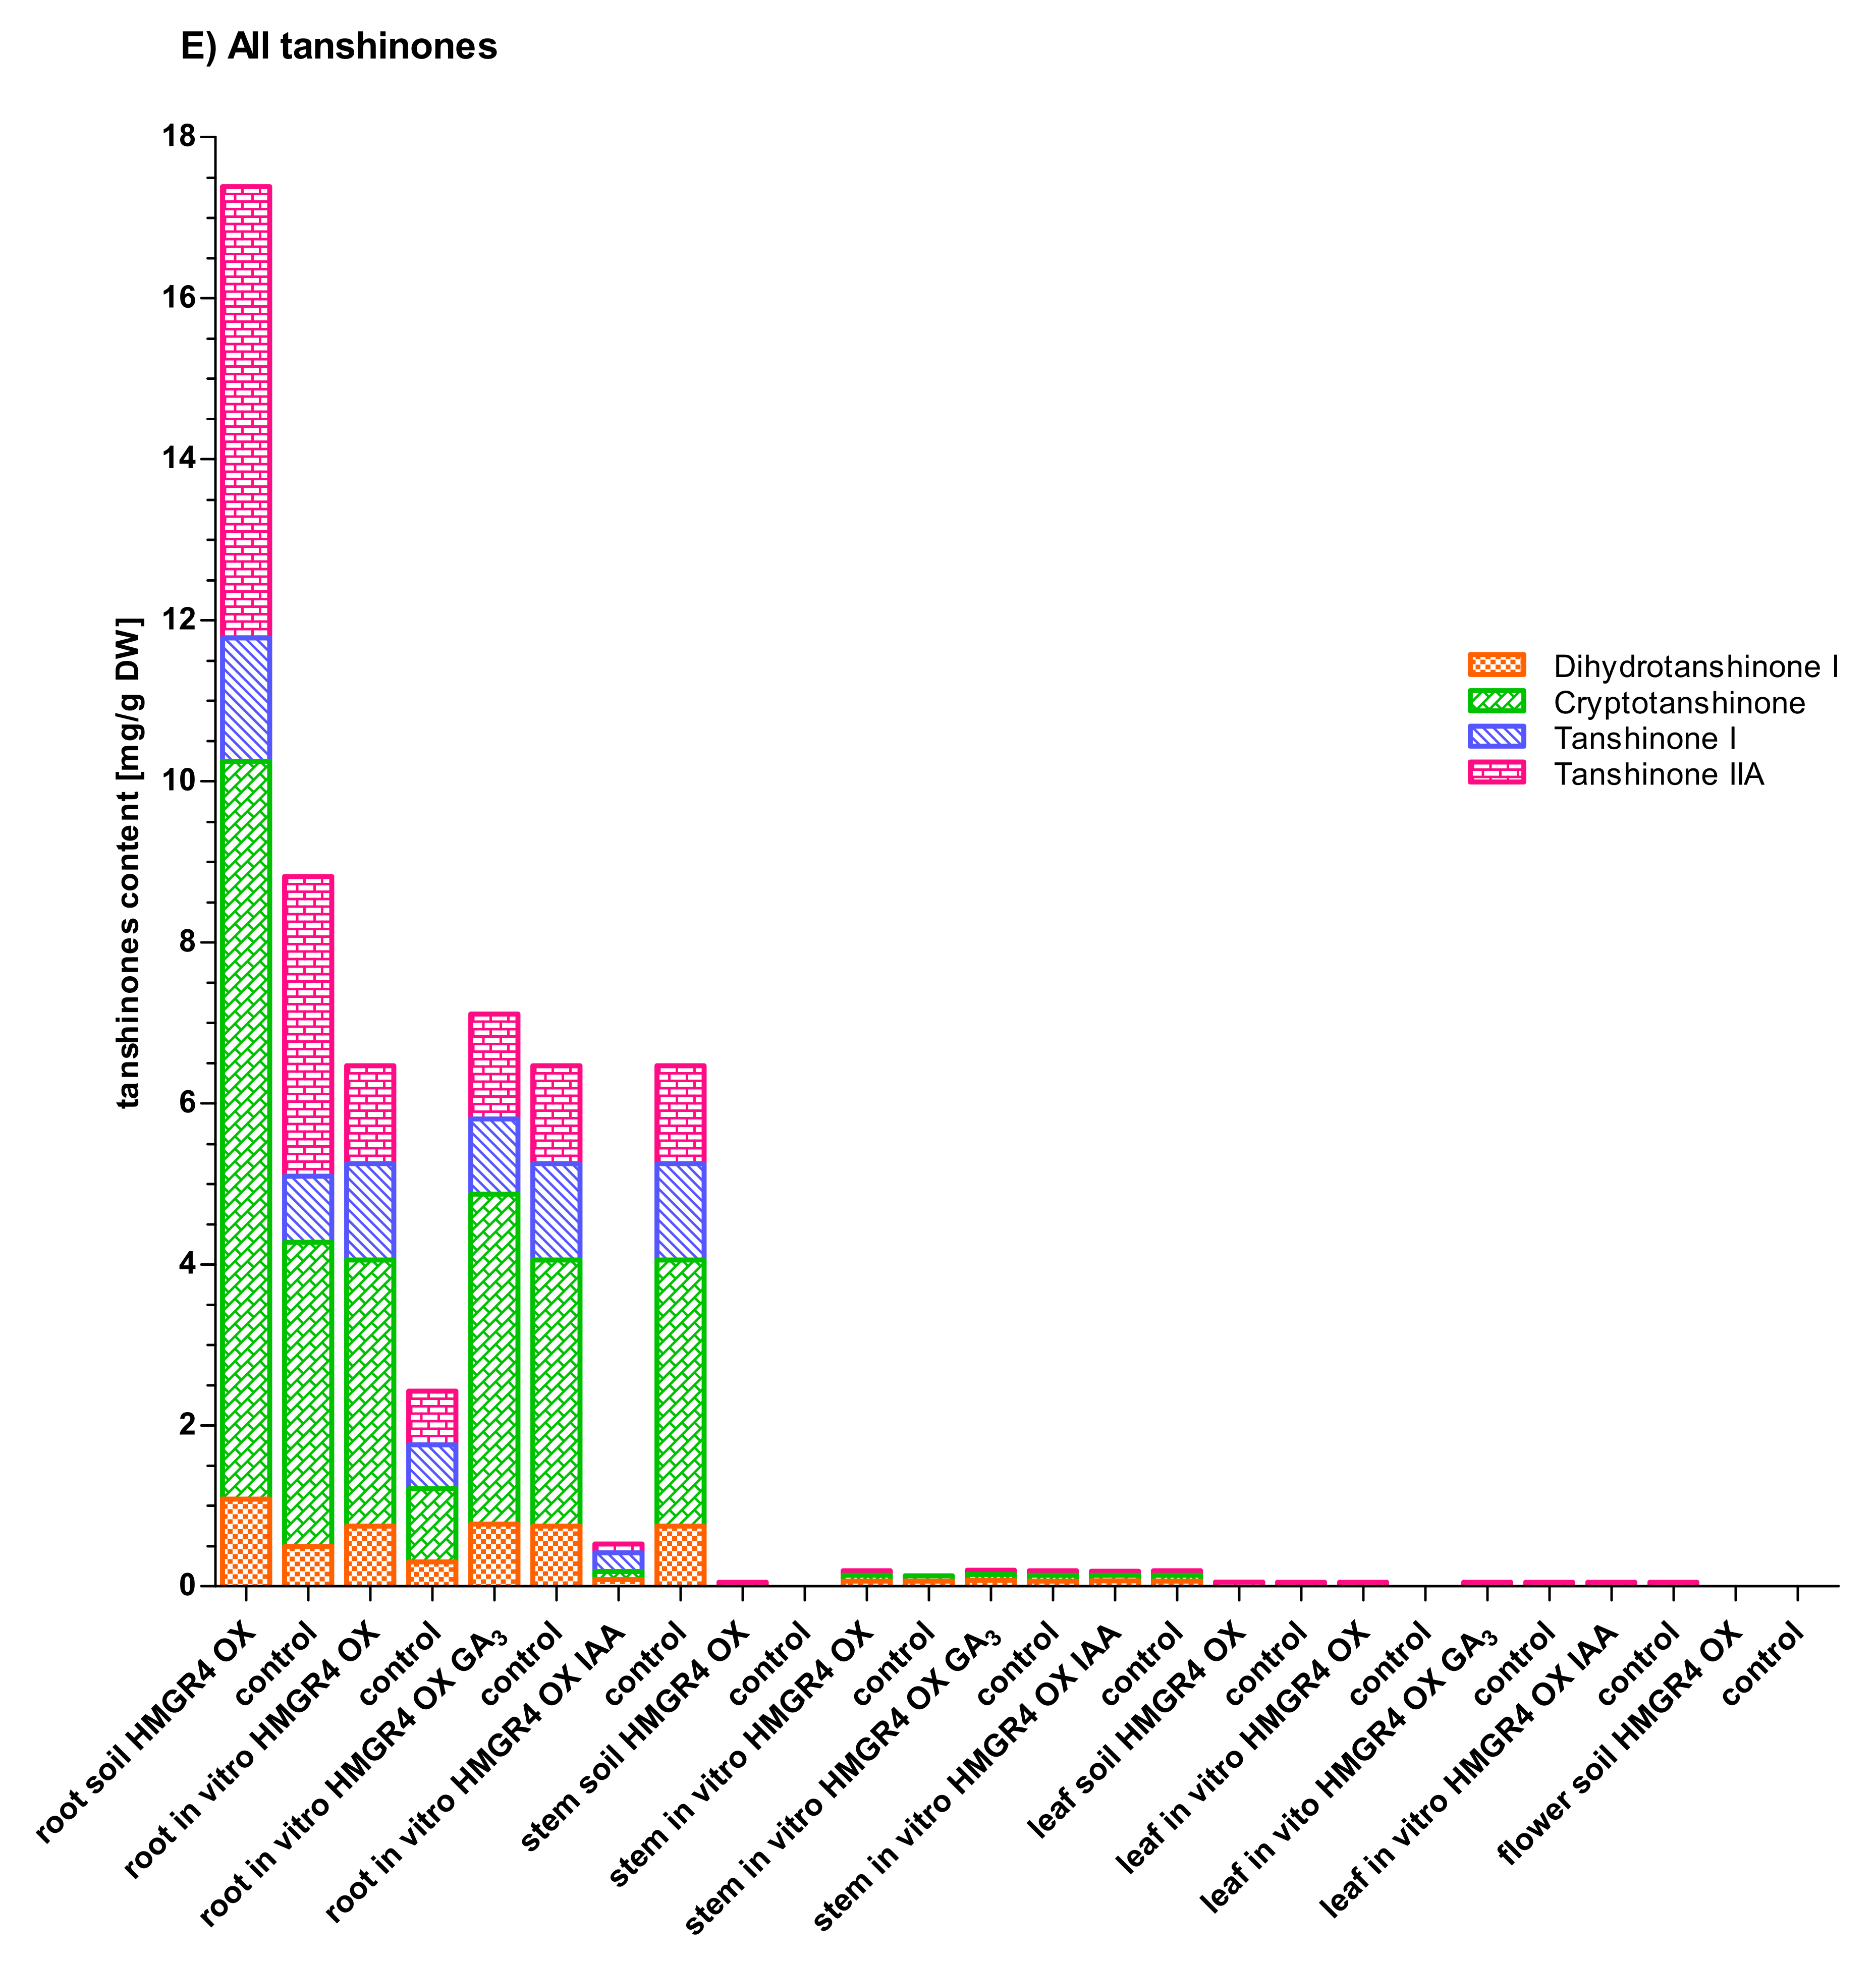
2.5. Influence of HMGR4 Overexpression on the Biosynthesis of Tanshinones in S. miltiorrhiza

The conducted studies indicate that S. miltiorrhiza HMGR4 overexpression had a significant influence on the quantity of measured tanshinones.
Roots with HMGR4 overexpression, both soil-grown and cultivated in vitro, demonstrated significantly higher accumulation of DHTI, CT, TI, TIIA and higher total tanshinone content compared to control roots without HMGR4 overexpression (p < 0.01) (Figure 2A–E). The differences described above ranged from 1.51-fold to 2.43-fold, i.e., 0.59–5.39 mg/g dry weight (DW), and from 1.82- to 3.62-fold (0.44–2.40 mg/g DW), respectively, depending on the type of tanshinone.
Clear differences in the levels of individual tanshinones were observed between roots with HMGR4 overexpression and those without. More specifically, these values were as follows (the first value indicating soil conditions and the second in vitro): 2.43- or 3.62-fold (5.39 or 2.40 mg/g DW) for CT, 2.19- or 2.47-fold (0.59 or 0.44 mg/g DW) for DHTI, 1.86- or 2.21-fold (0.71 or 0.65 mg/g DW) for TI, 1.51- or 1.82-fold (1.88 or 0.55 mg/g DW) for TIIA, and reflected the place of cultivation.
Moreover, overexpression of HMGR4 gene induced the quantity of TIIA to about 50 µg/g DW in in vitro and in soil-grown stems and leaves (Figure 2D).

2.6. Organ-Dependent Accumulation of Tanshinones in S. miltiorrhiza

Roots appeared to be the main site of accumulation of all studied metabolites in S. miltiorrhiza. All of the examined roots were found to contain all tested tanshinones (Figure 2A–D). CT was present at the highest levels (0.91–9.17 mg/g DW), while lower amounts were found for TIIA (0.67–5.61 mg/g DW), TI (0.54–1.53 mg/g DW) and DHI (0.30–1.08 mg/g DW) (Figure 2A–D). The quantity of the identified metabolites was highest in soil-grown roots overexpressing HMGR4.
Some tanshinones were detected in stems and leaves with median values ranging from 50 to 73.5 µg/g DW (Figure 2A,B,D,E). The most common tanshinone present in the tested stems and leaves was TIIA. The TIIA content was typically 104.5-fold higher (by 5.55 mg/g DW) in roots than in stems or leaves in the soil-grown plants, and 23.4-fold higher (by 1.16 mg/g DW) in in vitro roots (Figure 2D). No tanshinones were detected in flowers (Figure 2A–E). Hence, apart from slight changes in TIIA level in stems and leaves, HMGR4 overexpression did not appear to significantly change the organ-specific pattern of accumulation of the compounds in S. miltiorrhiza.

2.7. Impact of Growth Environment on the Biosynthesis of Tanshinones in S. miltiorrhiza

The soil environment favoured a significantly higher production of all tested tanshinones in the root material compared to in vitro conditions (p < 0.01). This was true both in the group of roots with and without HMGR4 overexpression, and the differences were from 1.45- to 4.62-fold (0.34–5.86 mg/g DW) and from 1.63- to 5.58-fold (0.19–3.06 mg/g DW), respectively, depending on the type of metabolite. The quantities of individual tanshinones varied considerably between the soil-grown roots and those grown in vitro. More specifically, these differences were as follows (first value = HMGR4 overexpression; the second value = without): 4.62- or 5.58-fold (4.39 or 3.06 mg/g DW) for TIIA, 2.77- or 4.14-fold (5.86 or 2.87 mg/g DW) for CT, 1.45- or 1.63-fold (0.34 or 0.19 mg/g DW) for DHTI, 1.28- or 1.52-fold (0.34 or 0.28 mg/g DW) for TI. It is worth noting that the in vitro roots with HMGR4 overexpression demonstrated 1.51-fold higher DHTI (0.25 mg/g DW) and 1.45-fold higher TI (0.37 mg/g DW) than the soil-grown roots without overexpression.
In leaf material, the content of TIIA was significantly higher in soil than in in vitro conditions (p = 0.0000), amounting to 50 or 56.8 µg/g DW, depending on HMGR4 overexpression status.
DHTI and CT were detected in stems grown in vitro but not in stems grown in soil (Figure 2A,B). Median levels were 66.8 or 65.9 µg/g DW for DHTI, and 72 or 67.3 µg/g DW for CT, depending on the presence or absence of HMGR4 overexpression.

2.8. Effect of GA3 and IAA on the Biosynthesis of Tanshinones in S. miltiorrhiza

The addition of GA3 to S. miltiorrhiza in vitro root culture significantly increased CT, TIIA and total tanshinone levels in comparison to untreated roots (p = 0.0000, p = 0.0404, p = 0.0404, respectively) (Figure 2B,D). The observed increases were 1.24-fold (0.79 mg/g DW) for CT and 1.07-fold (88.1 µg/g DW) for TIIA. Treatment had no effect on DHTI and significantly decreased the amount of TI by 1.29-fold (0.27 mg/g DW) (p = 0.0000) (Figure 2A,C).
In vitro cultivation of stems grown in the presence of GA3 showed a significant 1.15-fold (9.9 µg/g DW) rise in DHTI (p = 0.0000) and a significant 1.04-fold (1.9 µg/g DW) reduction in TIIA (p = 0.0235) compared to untreated controls (Figure 2A,D). However, in vitro cultivation of leaves with GA3 resulted in a significant 1.02-fold (1.2 µg/g DW) increase in TIIA compared to control (p = 0.0000) (Figure 2D).
The use of IAA resulted in a significant decrease in the content of all tested tanshinones in in vitro root culture compared to untreated roots (p = 0.0000) (Figure 2A–D): 34.06-fold (3.21 mg/g DW) for CT, 11.49-fold (1.11 mg/g DW) for TIIA, 8.84-fold (0.66 mg/g DW) for DHTI and 5.05-fold (0.96 mg/g DW) for TI.
IAA treatment only appeared to have a slight influence on the quantity of tanshinones in stems and leaves: a significant 1.05-fold (3.2 µg/g DW) rise in DHTI and a significant 1.05-fold (2.3 µg/g DW) fall in TIIA were observed in stems compared to control (p = 0.0000) (Figure 2A,D), while a significant 1.01-fold (0.7 µg/g DW) increase in TIIA was noted in leaves relative to control (p = 0.0001) (Figure 2D).

3. Discussion

This work analyses the expression profiles of the S. miltiorrhiza HMGR4 gene and its influence on the biosynthesis of tanshinones.
Previous studies have shown that S. miltiorrhiza HMGR genes are expressed in the roots, stems and leaves, but with different intensities in each organ. HMGR showed the strongest activity in roots, and weaker in stems and leaves [17]. The level of the HMGR2 transcript was about four-fold higher in leaves than in stems, and about two-fold higher in stems than in roots [15]. HMGR3 was vigorously expressed in stems and root steles, and to a much greater degree than in root cortices and leaves [16]. HMGR4 activity was the highest in flowers, lower in stems and leaves, and lowest in root steles and root cortices [16]. In the present study, a higher level of HMGR4 mRNA was noted in leaves and stems than in the control; however, this was not observed in roots. Previous transcriptomic analyses have indicated that within the S. miltiorrhiza root, the strongest expression of HMGR4 occurred in xylem [40].
The S. miltiorrhiza HMGR4 gene showed a biphasic response to GA3 treatment. After initial stimulation of its expression relative to the control at 12, 24 and 48 h, it then decreased and subsequently increased at 96 h (Figure 1). It has been found that 2.89 µM GA3 has a similar influence on the S. miltiorrhiza HMGR2 gene; however, in this case, HMGR2 expression increased compared to control at 12 h, followed by a fall and a second increase at 72 and 96 h [41]. Elsewhere, stimulation with 400 µM GA3 resulted in an initial rise in Malus domestica HMGR1 transcripts against control until four hours, followed by a decrease at six h [42]. We hypothesise that stimulation of S. miltiorrhiza HMGR4 gene expression by GA3 and subsequent enzyme production could activate the next stages of the MVA pathway and the production of mediators necessary for the biosynthesis of endogenous gibberellins, such as ent-kaurene [43]. The newly-produced endogenous GA3 could stimulate the HMGR4 transcription which decreased as a result of metabolising the exogenous hormone. However, this hypothesis needs to be verified by monitoring endogenous GA3 levels during the course of an experiment.
The impact of IAA on S. miltiorrhiza HMGR4 expression was very similar to that induced by GA3 (Figure 1). Although the effect of IAA on plant HMGR genes has not been widely studied, we have noticed some similarities in our results with previous research. IAA at a final concentration of 100 µM first raised the level of M. domestica HMGR4 transcripts relative to control, and then lowered them [42]. The biphasic effect, which we observed in our experiment, may result from the stimulation of various TFs, some of which increase expression of the gene, while others reduce it.
The use of SA caused a rise in HMGR4 expression at 12, 24 and 72 h and a fall at 48 and 96 h in relation to untreated material (Figure 1). A similar effect was observed for 10 mM SA against HMGR3 in Ginkgo biloba leaves; however, in contrast to our present findings, the level of HMGR3 mRNA rose against control values in the final phase of the study (96 and 120 h) [44]. Elsewhere, SA treatment was found to result in continually elevated HMGR transcript levels versus untreated controls in S. miltiorrhiza hairy roots throughout the experiment [20] and Salvia przewalskii hairy roots [45]. A maximum three-fold increase in HMGR expression was noted after 36 h of stimulation [20], and an eight-fold rise after six days [45].
The present study is the first investigation of the role of HMGR4 in the biosynthesis of tanshinones in S. miltiorrhiza. Overexpression of this gene resulted in a significant increase in DHTI, CT, TI and TIIA content: by 1.51- to 2.43-fold (0.59–5.39 mg/g DW) in soil-grown roots, and by 1.82- to 3.62-fold (0.44–2.40 mg/g DW) in in vitro roots (Figure 2A–D). Of all tanshinones tested, CT showed the highest rise relative to control: 2.43-fold (5.39 mg/g DW) for roots grown in soil and 3.62-fold (2.40 mg/g DW) for in vitro roots. The results are in agreement with data received for other S. miltiorrhiza HMGR enzymes. Kai et al. reported that overexpression of the HMGR gene led to an increase in CT, TI, TIIA quantity in hairy root culture ranging from 1.17- to 3.19-fold (0.844–1.515 mg/g DW) compared to control [46]. As in our research, CT showed the highest rise in all seven transgenic lines tested. In another study, HMGR2 overexpression significantly enhanced the amount of DHTI, CT, TI, TIIA by 1.23- to 2.46-fold (0.99–3.16 mg/L) at day 40 of root culture relative to control [15]. In the experiment, CT demonstrated the greatest increase, i.e., by 2.46-fold (3.16 mg/L).
Our results indicate that tanshinone accumulation in S. miltiorrhiza was organ-dependent, with roots as the primary storage place for DHTI, CT, TI, TIIA (Figure 2E). Li et al. specifically indicate the root periderm of S. miltiorrhiza as the main site of accumulation of all tested tanshinones, viz. DHTI, CT, TI, TIIA, Tanshinone IIB, Dehydrotanshinone IIA, Dashenxinkun B, Trijuganone A, Trijuganone C; the inner layer of the roots and the outer part of stems contained much smaller amounts [47]. Subsequent research also pointed to S. miltiorrhiza root periderm as the main storage place for TIIA, although traces were also detected in root phloem [40]. In addition, transcriptomic analyses of the MVA and MEP pathway genes and other enzymes leading to the production of tanshinones indicated that the strongest expression of most of the tested genes (AACT1 to AACT6, HMGS2, HMGR1, HMGR2, MK, PMK, MDC1, MDC2, IPI1, GGPPS3, DXS2, DXS4, DXR, MCT, CMK, MDS, HDS, HDR1 to HDR3, CPS1, CPS5, KSL1, KSL7, KSL8, CYP76AH1) occurred in the periderm of S. miltiorrhiza roots [40]. Hence, the root periderm layer appears to be not only the main storage site, but also the main place of biosynthesis of tanshinones. The examined stems turned out to be a better source of the metabolites than leaves, but their content was quite low (several dozen µg/g DW) (Figure 2E). These results are in line with previously-performed studies [48]. Organ-specific accumulation and production of tanshinones may result from the existence of various mechanisms regulating the activity of enzymes involved in the biosynthesis of these compounds [49].
Our findings indicate that soil cultivation favoured 1.28- to 5.58-fold (0.19–5.86 mg/g DW) higher production of DHTI, CT, TI and TIIA in roots and 1.12-fold (6.2 µg/g DW) greater production of TIIA in leaves compared to in vitro conditions. This may be due to the community of microorganisms naturally present in the rhizosphere, phyllosphere and endosphere; it is possible that these may affect the biosynthesis of metabolites [50,51]. According to Yan et al., the endophytic bacteria Pseudomonas brassicacearum subsp. neoauraniaca raised the activity of HMGR and DXS enzymes by 2.1- and 4.2-fold, respectively, in S. miltiorrhiza hairy root culture. This resulted in a significant increase in the content of all tanshinones tested, with particular gains found for DHTI (19.2-fold) CT (11.3-fold) and total tanshinones (3.7-fold) compared to controls [52]. In addition, the polysaccharide fraction isolated from rhizobacterium Bacillus cereus stimulated the accumulation of tanshinones in S. miltiorrhiza root culture by about seven-fold (1.59 vs. 0.19 mg/g DW) compared to control [53]. Another potential reason for the lower in vitro yields of tanshinones may be changes occurring in the morphology, anatomy and physiology of plants during in vitro cultivation [54,55].
Additionally, our findings provide further information about the influence of hormones on the biosynthesis of tanshinones in S. miltiorrhiza. GA3 stimulated CT and TIIA production, but had no significant effect on DHTI content and decreased TI in in vitro root culture compared to untreated controls (Figure 2A–D). We hypothesize that the presence of GA3 may strongly induce the expression of some key enzyme/-s involved in the terminal stage of CT biosynthesis. This could be the reason for the higher TIIA content which arises from CT; however, as GA3 may not have a similar effect on DHTI production, the resulting TI does not rise, and may even fall [14]. GA3 has been found to increase DHTI, CT, TI and TIIA levels in most GRAS3-overexpressing S. miltiorrhiza hairy root culture lines and in untransformed controls [56]; however, these results cannot be directly compared to ours, as the experiment used a 34.6-fold higher concentration of the hormone (100 µM) and a much shorter incubation time with GA3, of only six days. The second hormone used, IAA, significantly reduced the accumulation of CT by 34.06-fold (3.21 mg/g DW), TIIA by 11.49-fold (1.11 mg/g DW), DHTI by 8.84-fold (0.66 mg/g DW) and TI by 5.05-fold (0.96 mg/g DW) in an in vitro root culture versus control (Figure 2A–D). Reduced CT, TI and TIIA synthesis was also observed in S. miltiorrhiza hairy roots treated with 5.71 µM IAA: 1.61-fold decrease (82 µg/g DW) for TI, 1.50-fold decrease (125 µg/g DW) for CT, and 1.24-fold decrease (23 µg/g DW) for TIIA, compared to control [57].

4. Materials and Methods

4.1. Establishment of S. miltiorrhiza Culture and Treatments

S. miltiorrhiza plants were cultivated from seeds provided by the Garden of Medicinal Plants of the Medical University of Lodz. To establish in vitro plant cultures, the seeds were surface sterilised utilising 70% ethanol for 1 min and subsequent 1% sodium hypochlorite solution for 5 min, and then rinsed three times with sterile distilled water for 5 min. The seeds were thereafter transferred aseptically onto Murashige and Skoog (MS) basal medium [58] with 3% sucrose (Chempur, Piekary Śląskie, Poland) and 0.65% agar (Sigma-Aldrich, Saint Louis, MO, USA) and a final pH of 5.7. Germination was carried out in the dark at 26 ± 2 °C. After germination, aerial parts of S. miltiorrhiza were grown in solid MS medium at 26 ± 2 °C under 16/8 h (light/dark) photoperiod at a cool fluorescent light with intensity of 40 μmol m2 s1. Roots were cultivated in the dark at 26 ± 2 °C in Gamborg B5 liquid medium [59] agitated at 70 rpm. Subcultures were carried out every five weeks.
Five-week-old leaves, stems and roots, grown as described above, were used to study organ-specific expression of the HMGR4 gene.
The effect of hormones on HMGR4 activity was determined in five-week-old leaves. S. miltiorrhiza plants were incubated in sterile distilled water containing 1 mg/L (2.89 µM) GA3 or 0.5 mg/L (2.85 µM) IAA or 20 mg/L (144.80 µM) SA and 0.01% non-ionic detergent Triton X-100 (Sigma-Aldrich, Saint Louis, MO, USA). Plants treated with sterile distilled water supplemented with 0.01% Triton X-100 were used as controls. Samples were collected after 0, 12, 24, 48, 72 and 96 h.

4.2. Selection of Potential Regulators of S. miltiorrhiza HMGR4 Gene Expression

The S. miltiorrhiza HMGR4 promoter sequence deposited in GenBank under accession number KT921337.1 was scanned with PlantPan 2.0 tool (http://plantpan2.itps.ncku.edu.tw/, accessed on 5 June 2021) for TFBSs and interacting TFs [60]. UniProt database (https://www.uniprot.org/, accessed on 5 June 2021) was used to acquire information on received TFs [61].

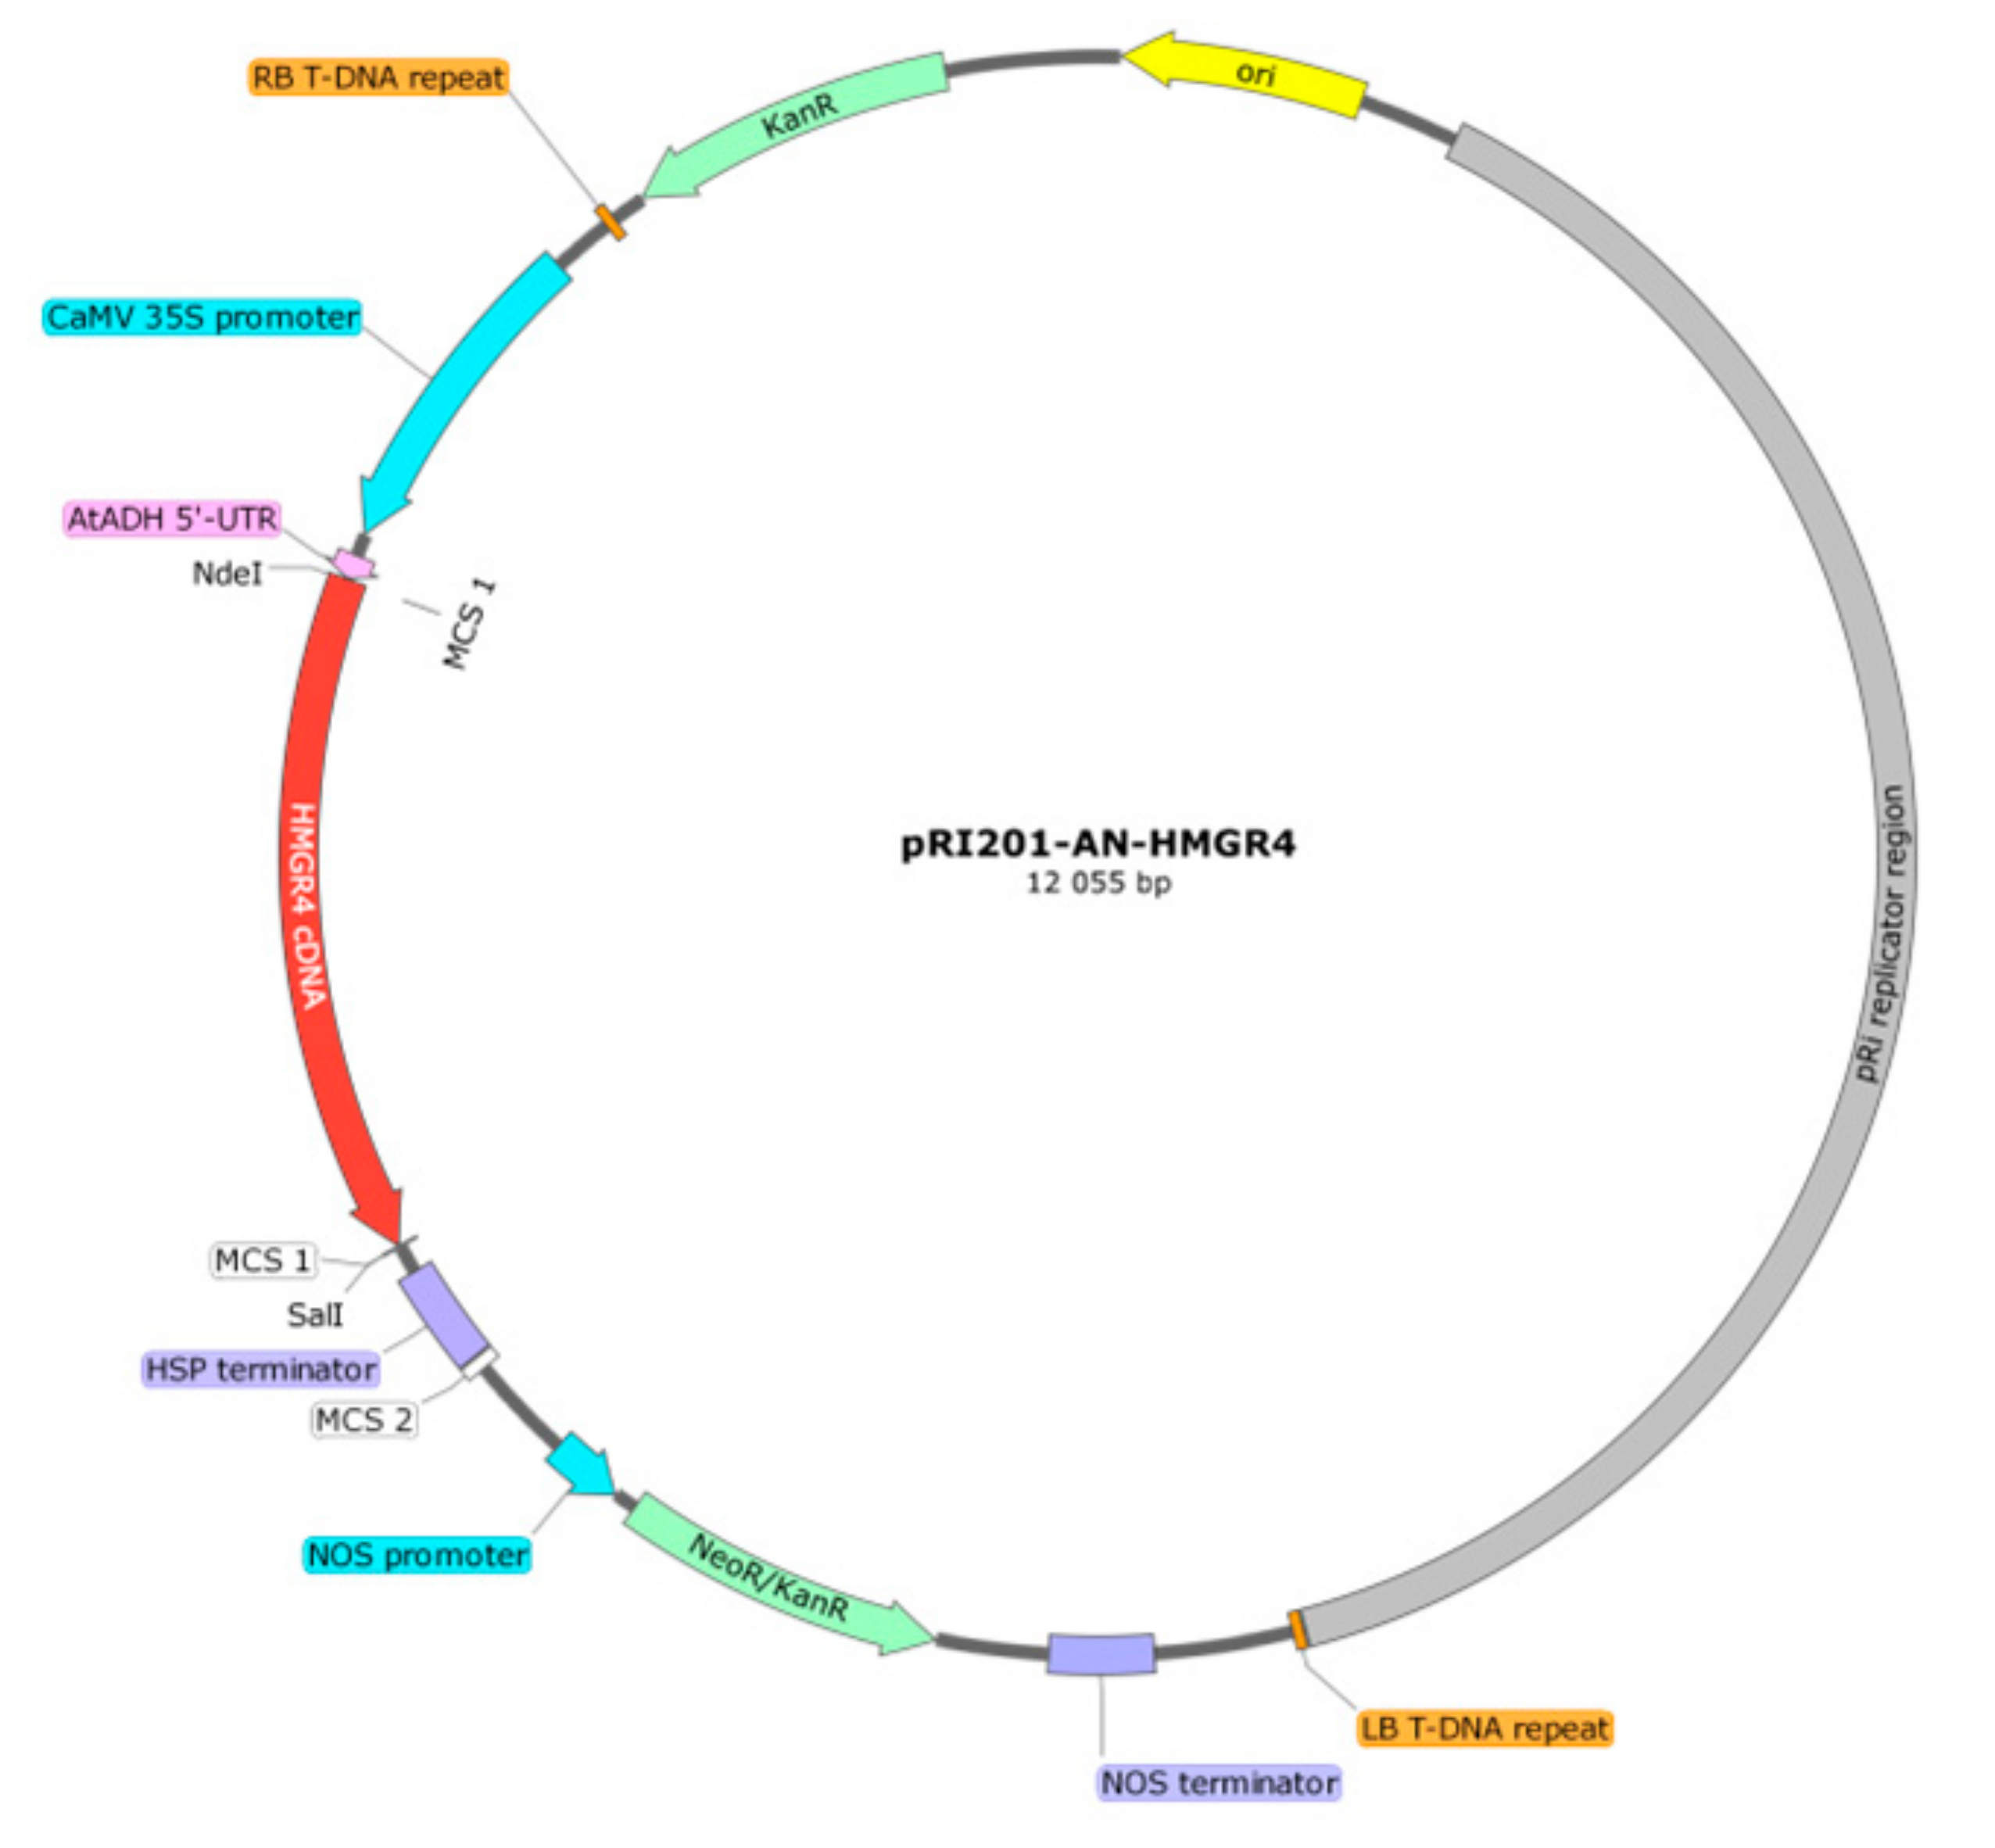
4.3. Preparation of pRI201-AN-HMGR4 Overexpression Construct

The S. miltiorrhiza HMGR4 coding sequence (1653 bp) was synthesised on the basis of JN831103.1 sequence and inserted into a pUC57 vector (Gene Universal Inc., Newark, DE, USA). The correctness of the insert was determined by double-strand Sanger sequencing. Afterwards, the HMGR4 insert was excised from pUC57 and inserted into a pRI201-AN binary expression vector (Takara Bio Inc., Kusatsu, Japan) at NdeI/SalI sites of MCS1 (Eurofins Genomics, Ebersberg, Germany). HMGR4 gene overexpression was driven by the strong and constitutive promoter of Cauliflower Mosaic Virus 35S (CaMV), which facilitates high levels of RNA transcription in a wide variety of plants. Analysis of the HMGR4 sequence and flanking regions was performed by double-strand Sanger sequencing. A map of the prepared pRI201-AN-HMGR4 construct is presented in Figure 3.

4.4. Transformation, Selection, Regeneration and Treatments of S. miltiorrhiza Culture

Agrobacterium tumefaciens (Rhizobium radiobacter) GV2260 (C58C1RifR with pGV2260) competent cells were transformed with the pRI201-AN-HMGR4 construct or the empty pRI201-AN vector using the freeze/thaw method [62]. The transformed bacteria were firstly grown for 84 h at 26 °C on solid selective YEB medium containing 50 mg/L kanamycin, 100 mg/L carbenicillin and 30 mg/L rifampicin (Chem-Impex International, Wood Dale, IL, USA) and then on liquid selective YEB medium with shaking at 140 rpm until OD600 reached 0.4–0.8. To confirm the transformation, plasmid DNA was isolated by alkaline lysis and extracted with a phenol/chloroform/isoamyl alcohol mixture [63]; this was then subjected to PCR amplification using GoTaq Hot Start Green Master Mix (Promega, Madison, WI, USA) and Kanamycin primers (Table 2). The PCR reactions were carried out in an MJ Mini Personal Thermal Cycler (Bio-Rad, Hercules, CA, USA) with the following parameters: initial denaturation (95 °C, 5 min), denaturation (95 °C, 45 s), primer annealing (60 °C, 30 s), extension (72 °C, 30 s), final extension (72 °C, 5 min). In total, 40 PCR cycles were conducted. The obtained products were separated by 2% agarose gel electrophoresis.
To induce virulence, bacterial cultures with confirmed transformation were collected by centrifugation and resuspended to OD600 = 0.1 in sterile induction medium, i.e., liquid MS medium supplemented with 100 µM acetosyringone (Sigma-Aldrich, Saint Louis, MO, USA), and then agitated on a rotary shaker at 140 rpm for five hours at 26 °C [64].
Three-month-old leaves of S. miltiorrhiza grown in pots were surface sterilised using the same protocol described earlier for the seeds; however, 0.8% sodium hypochlorite solution was applied. Preparation, infection of leaves and co-cultivation were performed according to Dandekar and Fisk with some modifications [64]. The composition of the induction medium was as mentioned above. Co-cultivation solid MS medium was supplemented with 1 mg/L 6-benzylaminopurine (BAP), 0.2 mg/L 1-naphthaleneacetic acid (NAA) and 100 µM acetosyringone (Sigma-Aldrich, Saint Louis, MO, USA). Overall regeneration frequency, non-transgenic regeneration under selection and non-transgenic controls were included in the research. After 72 h of incubation, leaf discs were transferred every two weeks onto fresh A. tumefaciens (R. radiobacter) killing medium, i.e., solid MS medium with 1 mg/L BAP, 0.2 mg/L NAA and 250 mg/L cefuroxime. After another six weeks, the obtained calluses were moved onto solid MS medium supplemented with 0.5 mg/L BAP, 0.2 mg/L IAA and 250 mg/L cefuroxime. In the following weeks, cefuroxime was gradually phased out and the selection antibiotic kanamycin (Biological Industries, Kibbutz Beit-Haemek, Israel) was introduced (10–50 mg/L). The aerial parts of the S. miltiorrhiza transformants and controls were cultivated in solid MS medium at 26 ± 2 °C under 16/8 h (light/dark) photoperiod using a cool fluorescent light with intensity of 40 μmol m−2 s−1 and their roots in the dark in liquid Gamborg B5 medium agitated at 70 rpm. Subcultures were carried out every five weeks. Additionally, in order to compare the influence of different growth environments on the biosynthesis of tanshinones, the transformants and control were transferred from in vitro cultures to pots containing sterile composite soil. The plants were covered with a transparent glass jar for three weeks and grown at 26 ± 2 °C under natural light. Figure 4 shows S. miltiorrhiza cultures at various stages of the experiment.
The transformation of S. miltiorrhiza plants was confirmed by PCR analysis of genomic DNA isolated from five-week-old leaves using Isolate II Plant DNA kit (Bioline, Taunton, MA, USA) according to the manufacturer’s instructions, with the use of GoTaq Hot Start Green Master Mix (Promega, Madison, WI, USA) and Kanamycin primers (Table 2). The concentration and purity of the DNA were assessed based on A260/A280 and A260/A230 ratios using a Nanophotometer P300 (Implen, Munich, Germany). PCR reaction parameters were as mentioned above. The obtained products were separated via 2% agarose gel electrophoresis.
The effect of the pRI201-AN-HMGR4 construct or the empty pRI201-AN vector (control) on S. miltiorrhiza HMGR4 expression was investigated in five-week-old leaves, stems and roots.
The importance of the HMGR4 gene for tanshinone biosynthesis was assessed in five-week-old S. miltiorrhiza roots, leaves, and stems growing in soil and in vitro and overexpressing HMGR4 relative to plant material that did not overexpress HMGR4.
The role of the growth environment for the tanshinone content was evaluated in five-week-old S. miltiorrhiza roots, leaves, and stems with and without HMGR4 overexpression growing in soil in relation to the plant material grown in in vitro conditions.
The effect of GA3 (1 mg/L, 2.89 µM) or IAA (0.5 mg/L, 2.85 µM) on the production of tanshinones was estimated in five-week-old roots, leaves, and stems of S. miltiorrhiza overexpressing HMGR4, grown in vitro and treated with the hormones against untreated plant material.
The role of plant organ for the accumulation of tanshinones was assessed in five-week-old S. miltiorrhiza roots, leaves, and stems with and without HMGR4 overexpression growing in soil and in in vitro conditions.

4.5. RNA Isolation, Reverse Transcription and Quantitative Real-Time PCR

Total RNA was isolated in accordance with the protocol given in NucleoSpin RNA Plant and Fungi kit (Macherey-Nagel, Duren, Germany). Plant material was ground under liquid nitrogen to a fine powder using mortar and pestle. The samples were digested by RNase-free rDNase (Macherey-Nagel, Duren, Germany) to assure removal of genomic DNA. Isolated RNA was stored at −80 °C. The concentration and purity of the RNA were evaluated using Nanophotometer P300 (Implen, Munich, Germany). The obtained A260/A280 ratios were within the range of 1.9–2.1 and A260/A230 ratios were ~2.
The reverse transcription reactions were carried out using Maxima H Minus Reverse Transcriptase, Oligo(dT)18 Primer, dNTP Mix, RiboLock RNase Inhibitor, and nuclease-free water (Thermo Scientific, Waltham, MA, USA) according to the manufacturer’s protocol. The quantity of RNA was adjusted to achieve the same final RNA concentration in a given experiment. No reverse transcriptase and no template controls were applied. The prepared cDNA was stored at −20 °C.
In order to investigate the expression of HMGR4, real-time PCR reactions were performed. Actin (ACT7) was used as a reference gene [65]. Gene-specific primers (Table 2) were created based on JN831103.1 and HM051058.1 sequences using Primer3web version 4.1.0 (https://primer3.ut.ee/, accessed on 5 June 2022) and Jellyfish version 1.5 tools. Expected sizes of HMGR4 and ACT7 fragments (Table 2) were confirmed by agarose gel electrophoresis. Amplification reactions were conducted using SYBR Green JumpStart Taq ReadyMix (Sigma-Aldrich, Saint Louis, MO, USA) according to the manufacturer’s instructions on Rotor-Gene 6000 (Corbett Research, Manchester, United Kingdom). The real-time PCR reaction parameters were as follows: initial denaturation (95 °C, 10 min), 40 cycles of denaturation (95 °C, 20 s), primer annealing (60 °C, 30 s), extension (72 °C, 10 s). The obtained products were melted in the temperature range of 72–95 °C with an increment of 1 °C. Ct values for HMGR4 were normalised to Ct values for ACT7 and calculated relative to a calibrator according to Pfaffl method [66].

4.6. Quantitative Analysis of Tanshinones

Roots, stems and leaves of S. miltiorrhiza were freeze-dried in a lyophiliser Alpha 1-2 LD (Martin Christ, Osterode am Harz, Germany) under 0.1 mbar pressure and ground with a pestle and mortar to a fine powder. The obtained powder (50 mg) was extracted with methanol (2 mL) under ultrasonic treatment for one hour at room temperature. The mixture was then centrifuged at 14,000× g for 5 min and then the supernatant was filtered through a 0.2 µm organic membrane filter (Millipore, Burlington, MA, USA) [67].
The tanshinone content was determined with a UHPLC 1290 Infinity instrument (Agilent Technologies, Santa Clara, CA, USA). Chromatographic separation was performed on a Zorbax Eclipse XDB-C18 column (3 mm × 100 mm, 1.8 µm particle size; Agilent Technologies, Santa Clara, CA, USA) with a Zorbax Eclipse XDB-C18 pre-column (3 mm × 5 mm, 1.8 µm particle size; Agilent Technologies, Santa Clara, CA, USA) thermostatted at 30 °C. The mobile phase consisted of 0.1% (v/v) formic acid acetonitrile solution (A) and 0.1% (v/v) formic acid aqueous solution (B), and the flow rate was 0.4 mL/min. The following gradient was used (all concentrations are v/v): 0–2 min, 40–55% A; 2–12 min, 55–50% A; 12–13 min, 50–80% A; 13–17 min, 80–95% A; 17–20 min, 95% A. The column and pre-column were equilibrated to 40% A for 1.5 min. The samples were injected in a volume of 1 µL and the wavelength of 270 nm was applied for the detection of tanshinones. HPLC grade DHTI, CT, TI, TIIA standards (Sigma-Aldrich, Saint Louis, MO, USA) were used for calibration. HPLC grade methanol, acetonitrile, and water were provided by Sigma-Aldrich (Saint Louis, MO, USA). More details on the UHPLC analysis are provided in Table 3. The data were collected and processed using ChemStation 3D software.

4.7. Statistical Analysis

Statistica 13.3 software (TIBCO Software Inc, Palo Alto, CA, USA) was used for analyses. The collected UHPLC results were checked for normal distribution using the Shapiro–Wilk test, and subsequent analyses were performed using the Kruskal–Wallis test, Mann–Whitney U test and t-test. Values with p < 0.05 were considered statistically significant. Expression values were given as mean ± SD.

5. Conclusions

The most important observation from the conducted research concerns the important role played by HMGR4 in the biosynthesis of tanshinones, which is reflected in the content of DHTI, CT, TI, TIIA in the roots and TIIA in the stems and leaves with gene overexpression.
Other conclusions:
GA3, IAA and SA regulated the expression of the S. miltiorrhiza HMGR4 gene, confirming the results of the in silico promoter analysis.
The soil environment promoted a higher accumulation of all tested metabolites in roots and TIIA in leaves compared to in vitro conditions. However, it is worth noting that the amounts of DHTI and TI in in vitro roots with HMGR4 overexpression were higher than in soil-grown roots without overexpression.
Apart from the positive effect on the appearance of TIIA in the studied stems and leaves of S. miltiorrhiza, HMGR4 overexpression did not change the characteristic organ-dependent pattern of tanshinone accumulation, i.e., the main source was the root, with trace amounts observed in stems and leaves.
GA3 increased CT and TIIA production in roots, while IAA reduced the biosynthesis of all tested metabolites.
The greatest efficiency of tanshinone biosynthesis was found to result from a combination of three traits, namely HMGR4 gene overexpression, root organ, and cultivation in soil conditions.
Future research could investigate the mechanisms controlling S. miltiorrhiza HMGR4 gene expression. TFs regulating HMGR4 expression could be isolated using the yeast-one hybrid (Y1H) system and then functionally characterised [68]. The role of specific TFBSs in the response of HMGR4 to abiotic or biotic factors could be verified by its mutagenesis [69]. TF networks that play a key role in the regulation of HMGR4 gene expression could be explored through transcriptomic RNA sequencing and weighted gene co-expression network analysis (WGCNA) [70,71].

Supplementary Materials

The following supporting information can be downloaded at: https://www.mdpi.com/article/10.3390/molecules27144354/s1, Table S1: Potential transcription factor binding sites (TFBSs) and interacting transcription factors (TFs) that respond to gibberellic acid (GA3) signals found in Salvia miltiorrhiza HMGR4 promoter sequence using PlantPan 2.0 tool; Table S2: Potential TFBSs and interacting TFs that respond to indole-3-acetic acid (IAA) signals found in S. miltiorrhiza HMGR4 promoter sequence using PlantPan 2.0 tool; Table S3: Potential TFBSs and interacting TFs that respond to salicylic acid (SA) signals found in S. miltiorrhiza HMGR4 promoter sequence using PlantPan 2.0 tool.

Author Contributions

Conceptualization, M.M., P.S. and Ł.K.; methodology, M.M., P.S., J.G., A.J., R.G., E.B. and Ł.K.; formal analysis, M.M., A.J. and Ł.K.; investigation, M.M., J.G. and Ł.K.; writing—original draft preparation, M.M.; writing—review and editing, P.S., A.J., E.B. and Ł.K.; visualization, M.M.; supervision, P.S. and Ł.K. All authors have read and agreed to the published version of the manuscript.

Funding

This research was funded by by the Medical University of Lodz (grant nos. 502-03/3-012-02/502-34-103, 503/3-012-01/503-31-001-19-00, 503/3-015-02/503-31-001-19-00).

Institutional Review Board Statement

Not applicable.

Informed Consent Statement

Not applicable.

Data Availability Statement

The data presented in this study are included in the article.

Acknowledgments

The authors would like to thank Dirk Inzé (Gent University, Belgium) for A. tumefaciens (R. radiobacter) GV2260 cells.

Conflicts of Interest

The authors declare no conflict of interest.

Sample Availability

Samples of the compounds are not available from the authors.

References

  1. Cheng, T.O. Cardiovascular effects of Danshen. Int. J. Cardiol. 2007, 121, 9–22. [Google Scholar] [CrossRef] [PubMed]
  2. Xu, Y.; Wan, R.; Lin, Y.; Yang, L.; Chen, Y.; Liu, C. Recent advance on research and application of Salvia miltiorrhiza. Asian J. Pharmacodyn. Pharmacokinet. 2007, 7, 99–130. [Google Scholar]
  3. Zhang, H.; Long, M.; Wu, Z.; Han, X.; Yu, Y. Sodium tanshinone IIA silate as an add-on therapy in patients with unstable angina pectoris. J. Thorac. Dis. 2014, 6, 1794–1799. [Google Scholar] [CrossRef] [PubMed]
  4. Jia, L.Q.; Zhang, N.; Xu, Y.; Chen, W.N.; Zhu, M.L.; Song, N.; Ren, L.; Cao, H.M.; Wang, J.Y.; Yang, G.L. Tanshinone IIA affects the HDL subfractions distribution not serum lipid levels: Involving in intake and efflux of cholesterol. Arch. Biochem. Biophys. 2016, 592, 50–59. [Google Scholar] [CrossRef]
  5. Chiu, S.C.; Huang, S.Y.; Chen, S.P.; Su, C.C.; Chiu, T.L.; Pang, C.Y. Tanshinone IIA inhibits human prostate cancer cells growth by induction of endoplasmic reticulum stress in vitro and in vivo. Prostate Cancer Prostatic Dis. 2013, 16, 315–322. [Google Scholar] [CrossRef]
  6. Wang, S.; Jing, H.; Yang, H.; Liu, Z.; Guo, H.; Chai, L.; Hu, L. Tanshinone I selectively suppresses pro-inflammatory genes expression in activated microglia and prevents nigrostriatal dopaminergic neurodegeneration in a mouse model of Parkinson’s disease. J. Ethnopharmacol. 2015, 164, 247–255. [Google Scholar] [CrossRef]
  7. Kim, S.Y.; Moon, T.C.; Chang, H.W.; Son, K.H.; Kang, S.S.; Kim, H.P. Effects of tanshinone I isolated from Salvia miltiorrhiza bunge on arachidonic acid metabolism and in vivo inflammatory responses. Phytother. Res. 2002, 16, 616–620. [Google Scholar] [CrossRef]
  8. Tang, F.; Wu, X.; Wang, T.; Wang, P.; Li, R.; Zhang, H.; Gao, J.; Chen, S.; Bao, L.; Huang, H.; et al. Tanshinone II A attenuates atherosclerotic calcification in rat model by inhibition of oxidative stress. Vascul. Pharmacol. 2007, 46, 427–438. [Google Scholar] [CrossRef]
  9. Wang, C.; Du, X.; Yang, R.; Liu, J.; Xu, D.; Shi, J.; Chen, L.; Shao, R.; Fan, G.; Gao, X.; et al. The prevention and treatment effects of tanshinone IIA on oestrogen/androgen-induced benign prostatic hyperplasia in rats. J. Steroid Biochem. Mol. Biol. 2015, 145, 28–37. [Google Scholar] [CrossRef]
  10. Wang, L.; Cheng, L.; Zhang, B.; Wang, N.; Wang, F. Tanshinone prevents alveolar bone loss in ovariectomized osteoporosis rats by up-regulating phosphoglycerate dehydrogenase. Toxicol. Appl. Pharmacol. 2019, 376, 9–16. [Google Scholar] [CrossRef]
  11. Honda, G.; Koezuka, Y.; Tabata, M. Isolation of an antidermatophytic substance from the root of Salvia miltiorrhiza. Chem. Pharm. Bull. 1988, 36, 408–411. [Google Scholar] [CrossRef] [PubMed] [Green Version]
  12. Lee, A.R.; Wu, W.L.; Chang, W.L.; Lin, H.C.; King, M.L. Isolation and bioactivity of new tanshinones. J. Nat. Prod. 1987, 50, 157–160. [Google Scholar] [CrossRef] [PubMed]
  13. Mei, X.D.; Cao, Y.F.; Che, Y.Y.; Li, J.; Shang, Z.P.; Zhao, W.J.; Qiao, Y.J.; Zhang, J.Y. Danshen: A phytochemical and pharmacological overview. Chin. J. Nat. Med. 2019, 17, 59–80. [Google Scholar] [CrossRef]
  14. Lu, S. The Salvia Miltiorrhiza Genome; Springer: Cham, Switzerland, 2019; pp. 129–139. [Google Scholar]
  15. Dai, Z.; Cui, G.; Zhou, S.F.; Zhang, X.; Huang, L. Cloning and characterization of a novel 3-hydroxy-3-methylglutaryl coenzyme A reductase gene from Salvia miltiorrhiza involved in diterpenoid tanshinone accumulation. J. Plant Physiol. 2011, 168, 148–157. [Google Scholar] [CrossRef]
  16. Ma, Y.; Yuan, L.; Wu, B.; Li, X.; Chen, S.; Lu, S. Genome-wide identification and characterization of novel genes involved in terpenoid biosynthesis in Salvia miltiorrhiza. J. Exp. Bot. 2012, 63, 2809–2823. [Google Scholar] [CrossRef] [Green Version]
  17. Liao, P.; Zhou, W.; Zhang, L.; Wang, J.; Yan, X.; Zhang, Y.; Zhang, R.; Li, L.; Zhou, G.; Kai, G. Molecular cloning, characterization and expression analysis of a new gene encoding 3-hydroxy-3-methylglutaryl coenzyme A reductase from Salvia miltiorrhiza. Acta Physiol. Plant. 2009, 31, 565–572. [Google Scholar] [CrossRef]
  18. Wang, J.W.; Wu, J.Y. Tanshinone biosynthesis in Salvia miltiorrhiza and production in plant tissue cultures. Appl. Microbiol. Biotechnol. 2010, 88, 437–449. [Google Scholar] [CrossRef]
  19. Cheng, Q.; He, Y.; Li, G.; Liu, Y.; Gao, W.; Huang, L. Effects of combined elicitors on tanshinone metabolic profiling and SmCPS expression in Salvia miltiorrhiza hairy root cultures. Molecules 2013, 18, 7473–7485. [Google Scholar] [CrossRef]
  20. Hao, X.; Shi, M.; Cui, L.; Xu, C.; Zhang, Y.; Kai, G. Effects of methyl jasmonate and salicylic acid on tanshinone production and biosynthetic gene expression in transgenic Salvia miltiorrhiza hairy roots. Biotechnol. Appl. Biochem. 2015, 62, 24–31. [Google Scholar] [CrossRef]
  21. Wu, C.T.; Mulabagal, V.; Nalawade, S.M.; Chen, C.L.; Yang, T.F.; Tsay, H.S. Isolation and quantitative analysis of cryptotanshinone, an active quinoid diterpene formed in callus of Salvia miltiorrhiza BUNGE. Biol. Pharm. Bull. 2003, 26, 845–848. [Google Scholar] [CrossRef] [Green Version]
  22. Xu, H.; Liu, Q.; Yao, T.; Fu, X. Shedding light on integrative GA signaling. Curr. Opin. Plant Biol. 2014, 21, 89–95. [Google Scholar] [CrossRef] [PubMed]
  23. Gupta, R.; Chakrabarty, S.K. Gibberellic acid in plant: Still a mystery unresolved. Plant Signal. Behav. 2013, 8, 1–5. [Google Scholar] [CrossRef] [Green Version]
  24. Wu, K.; Xu, H.; Gao, X.; Fu, X. New insights into gibberellin signaling in regulating plant growth-metabolic coordination. Curr. Opin. Plant Biol. 2021, 63, 102074. [Google Scholar] [CrossRef]
  25. Li, W.; Liu, C.; Liu, J.; Bai, Z.; Liang, Z. Transcriptomic analysis reveals the GRAS family genes respond to gibberellin in Salvia miltiorrhiza hairy roots. BMC Genom. 2020, 21, 727. [Google Scholar] [CrossRef]
  26. Li, W.; Bai, Z.; Pei, T.; Yang, D.; Mao, R.; Zhang, B.; Liu, C.; Liang, Z. SmGRAS1 and SmGRAS2 Regulate the Biosynthesis of Tanshinones and Phenolic Acids in Salvia miltiorrhiza. Front. Plant Sci. 2019, 10, 1–13. [Google Scholar] [CrossRef] [PubMed]
  27. Ma, Q.; Grones, P.; Robert, S. Auxin signaling: A big question to be addressed by small molecules. J. Exp. Bot. 2018, 69, 313–328. [Google Scholar] [CrossRef] [PubMed] [Green Version]
  28. Leyser, O. Auxin signaling. Plant Physiol. 2018, 176, 465–479. [Google Scholar] [CrossRef] [Green Version]
  29. Freire-Rios, A.; Tanaka, K.; Crespo, I.; van der Wijk, E.; Sizentsova, Y.; Levitsky, V.; Lindhoud, S.; Fontana, M.; Hohlbein, J.; Boer, D.R.; et al. Architecture of DNA elements mediating ARF transcription factor binding and auxin-responsive gene expression in Arabidopsis. Proc. Natl. Acad. Sci. USA 2020, 117, 24557–24566. [Google Scholar] [CrossRef]
  30. Xu, Z.; Ji, A.; Song, J.; Chen, S. Genome-wide analysis of auxin response factor gene family members in medicinal model plant Salvia miltiorrhiza. Biol. Open 2016, 5, 848–857. [Google Scholar] [CrossRef] [Green Version]
  31. Kuai, X.; MacLeod, B.J.; Després, C. Integrating data on the Arabidopsis NPR1/NPR3/NPR4 salicylic acid receptors; a differentiating argument. Front. Plant Sci. 2015, 6, 1–5. [Google Scholar] [CrossRef] [Green Version]
  32. Wu, Y.; Zhang, D.; Chu, J.Y.; Boyle, P.; Wang, Y.; Brindle, I.D.; De Luca, V.; Després, C. The Arabidopsis NPR1 protein is a receptor for the plant defense hormone salicylic acid. Cell Rep. 2012, 1, 639–647. [Google Scholar] [CrossRef] [PubMed] [Green Version]
  33. Zhou, J.M.; Trifa, Y.; Silva, H.; Pontier, D.; Lam, E.; Shah, J.; Klessig, D.F. NPR1 differentially interacts with members of the TGA/OBF family of transcription factors that bind an element of the PR-1 gene required for induction by salicylic acid. Mol. Plant Microbe Interact. 2000, 13, 191–202. [Google Scholar] [CrossRef] [PubMed] [Green Version]
  34. Fonseca, J.P.; Menossi, M.; Thibaud-Nissen, F.; Town, C.D. Functional analysis of a TGA factor-binding site located in the promoter region controlling salicylic acid-induced NIMIN-1 expression in Arabidopsis. Genet. Mol. Res. 2010, 9, 167–175. [Google Scholar] [CrossRef] [PubMed]
  35. Sun, T.; Busta, L.; Zhang, Q.; Ding, P.; Jetter, R.; Zhang, Y. TGACG-BINDING FACTOR 1 (TGA1) and TGA4 regulate salicylic acid and pipecolic acid biosynthesis by modulating the expression of SYSTEMIC ACQUIRED RESISTANCE DEFICIENT 1 (SARD1) and CALMODULIN-BINDING PROTEIN 60g (CBP60g). New Phytol. 2018, 217, 344–354. [Google Scholar] [CrossRef] [Green Version]
  36. Blanco, F.; Garretón, V.; Frey, N.; Dominguez, C.; Pérez-Acle, T.; Van der Straeten, D.; Jordana, X.; Holuigue, L. Identification of NPR1-dependent and independent genes early induced by salicylic acid treatment in Arabidopsis. Plant Mol. Biol. 2005, 59, 927–944. [Google Scholar] [CrossRef]
  37. Cao, W.; Wang, Y.; Shi, M.; Hao, X.; Zhao, W.; Wang, Y.; Ren, J.; Kai, G. Transcription factor SmWRKY1 positively promotes the biosynthesis of tanshinones in Salvia miltiorrhiza. Front. Plant Sci. 2018, 9, 1–10. [Google Scholar] [CrossRef] [Green Version]
  38. Hernandez-Garcia, C.M.; Finer, J.J. Identification and validation of promoters and cis-acting regulatory elements. Plant Sci. 2014, 217–218, 109–119. [Google Scholar] [CrossRef] [Green Version]
  39. Yu, C.P.; Lin, J.J.; Li, W.H. Positional distribution of transcription factor binding sites in Arabidopsis thaliana. Sci. Rep. 2016, 6, 25164. [Google Scholar] [CrossRef]
  40. Xu, Z.; Peters, R.J.; Weirather, J.; Luo, H.; Liao, B.; Zhang, X.; Zhu, Y.; Ji, A.; Zhang, B.; Hu, S.; et al. Full-length transcriptome sequences and splice variants obtained by a combination of sequencing platforms applied to different root tissues of Salvia miltiorrhiza and tanshinone biosynthesis. Plant J. 2015, 82, 951–961. [Google Scholar] [CrossRef]
  41. Szymczyk, P.; Grąbkowska, R.; Skała, E.; Żebrowska, M.; Balcerczak, E.; Jeleń, A. Isolation and characterization of a 3-hydroxy-3-methylglutaryl coenzyme A reductase 2 promoter from Salvia miltiorrhiza. J. Plant Biochem. Biotechnol. 2018, 27, 223–236. [Google Scholar] [CrossRef]
  42. Lv, D.; Zhang, Y. Isolation and functional analysis of apple MdHMGR1 and MdHMGR4 gene promoters in transgenic Arabidopsis thaliana. Plant Cell Tissue Organ Cult. 2017, 129, 133–143. [Google Scholar] [CrossRef]
  43. Kasahara, H.; Hanada, A.; Kuzuyama, T.; Takagi, M.; Kamiya, Y.; Yamaguchi, S. Contribution of the mevalonate and methylerythritol phosphate pathways to the biosynthesis of gibberellins in Arabidopsis. J. Biol. Chem. 2002, 277, 45188–45194. [Google Scholar] [CrossRef] [PubMed] [Green Version]
  44. Rao, S.; Meng, X.; Liao, Y.; Yu, T.; Cao, J.; Tan, J.; Xu, F.; Cheng, S. Characterization and functional analysis of two novel 3-hydroxy-3-methylglutaryl-coenzyme A reductase genes (GbHMGR2 and GbHMGR3) from Ginkgo biloba. Sci. Rep. 2019, 9, 14109. [Google Scholar] [CrossRef] [PubMed] [Green Version]
  45. Li, J.; Li, B.; Luo, L.; Cao, F.; Yang, B.; Gao, J.; Yan, Y.; Zhang, G.; Peng, L.; Hu, B. Increased phenolic acid and tanshinone production and transcriptional responses of biosynthetic genes in hairy root cultures of Salvia przewalskii Maxim. treated with methyl jasmonate and salicylic acid. Mol. Biol. Rep. 2020, 47, 8565–8578. [Google Scholar] [CrossRef]
  46. Kai, G.; Xu, H.; Zhou, C.; Liao, P.; Xiao, J.; Luo, X.; You, L.; Zhang, L. Metabolic engineering tanshinone biosynthetic pathway in Salvia miltiorrhiza hairy root cultures. Metab. Eng. 2011, 13, 319–327. [Google Scholar] [CrossRef]
  47. Li, S.; Zhu, N.; Tang, C.; Duan, H.; Wang, Y.; Zhao, G.; Liu, J.; Ye, Y. Differential distribution of characteristic constituents in root, stem and leaf tissues of Salvia miltiorrhiza using MALDI mass spectrometry imaging. Fitoterapia 2020, 146. [Google Scholar] [CrossRef]
  48. Hang, L.; Wang, J.; Yang, D.; Shu, Z.; Liang, Z. Distribution traits of bioactives in different parts of Salvia miltiorrhiza Bunge. and Salvia miltiorrhiza Bunge. f. alba. J. Northwest A F Univ. 2008, 36, 217–222. [Google Scholar]
  49. Leivar, P.; Antolín-Llovera, M.; Ferrero, S.; Closa, M.; Arró, M.; Ferrer, A.; Boronat, A.; Campos, N. Multilevel control of Arabidopsis 3-hydroxy-3-methylglutaryl coenzyme A reductase by protein phosphatase 2A. Plant Cell 2011, 23, 1494–1511. [Google Scholar] [CrossRef] [Green Version]
  50. Huang, W.; Long, C.; Lam, E. Roles of plant-associated microbiota in traditional herbal medicine. Trends Plant Sci. 2018, 23, 559–562. [Google Scholar] [CrossRef]
  51. Jeliazkov (Zheljazkov), V.D.; Cantrell, C.L. Medicinal and Aromatic Crops: Production, Phytochemistry, and Utilization; American Chemical Society: Washington, DC, USA, 2016; pp. 75–90. [Google Scholar]
  52. Yan, Y.; Zhang, S.; Zhang, J.; Ma, P.; Duan, J.; Liang, Z. Effect and mechanism of endophytic bacteria on growth and secondary metabolite synthesis in Salvia miltiorrhiza hairy roots. Acta Physiol. Plant. 2014, 36, 1095–1105. [Google Scholar] [CrossRef]
  53. Zhao, J.; Zhou, L.; Wu, J. Promotion of Salvia miltiorrhiza hairy root growth and tanshinone production by polysaccharide–protein fractions of plant growth-promoting rhizobacterium Bacillus cereus. Process Biochem. 2010, 45, 1517–1522. [Google Scholar] [CrossRef]
  54. George, E.F.; Hall, M.A.; De Klerk, G. Plant Propagation by Tissue Culture, 3rd ed.; Springer: Dordrecht, The Netherlands, 2008; pp. 465–477. [Google Scholar]
  55. Debergh, P.C.; Zimmerman, R.H. Micropropagation. Technology and Application, 1st ed.; Kluwer Academic Publishers: London, UK, 1991; pp. 71–93. [Google Scholar]
  56. Li, W.; Xing, B.; Mao, R.; Bai, Z.; Yang, D.; Xu, J.; Liang, Z. SmGRAS3 negatively responds to GA signaling while promotes tanshinones biosynthesis in Salvia miltiorrhiza. Ind. Crops Prod. 2020, 144. [Google Scholar] [CrossRef]
  57. Gupta, S.K.; Liu, R.; Liaw, S.; Chan, H.; Tsay, H. Enhanced tanshinone production in hairy roots of ‘Salvia miltiorrhiza Bunge’ under the influence of plant growth regulators in liquid culture. Bot. Stud. 2011, 52, 435–443. [Google Scholar]
  58. Murashige, T.; Skoog, F. A revised medium for rapid growth and bioassays with tobacco tissue cultures. Physiol. Plant. 1962, 15, 473–497. [Google Scholar] [CrossRef]
  59. Gamborg, O.L.; Miller, R.A.; Ojima, K. Nutrient requirements of suspension cultures of Soybean root cells. Exp. Cell Res. 1968, 50, 151–158. [Google Scholar] [CrossRef]
  60. Chow, C.N.; Zheng, H.Q.; Wu, N.Y.; Chien, C.H.; Huang, H.D.; Lee, T.Y.; Chiang-Hsieh, Y.F.; Hou, P.F.; Yang, T.Y.; Chang, W.C. PlantPAN 2.0: An update of plant promoter analysis navigator for reconstructing transcriptional regulatory networks in plants. Nucleic Acids Res. 2016, 44, D1154–D1160. [Google Scholar] [CrossRef] [Green Version]
  61. UniProt, C. UniProt: The universal protein knowledgebase in 2021. Nucleic Acids Res. 2021, 49, D480–D489. [Google Scholar] [CrossRef]
  62. Wang, K. Agrobacterium Protocols, 2nd ed.; Humana Press: Totowa, NJ, USA, 2006; pp. 43–53. [Google Scholar]
  63. Ausubel, F.M.; Brent, R.; Kingston, R.E.; Moore, D.D.; Seidman, J.G.; Smith, J.A.; Struhl, K. Current Protocols in Molecular Biology; John Wiley & Sons: New York, NY, USA, 2003; pp. 1.6.1–1.6.10, 12.11.11–12.11.10. [Google Scholar]
  64. Peña, L. Transgenic Plants. Methods and Protocols; Humana Press: Totowa, NJ, USA, 2005. [Google Scholar]
  65. Yang, Y.; Hou, S.; Cui, G.; Chen, S.; Wei, J.; Huang, L. Characterization of reference genes for quantitative real-time PCR analysis in various tissues of Salvia miltiorrhiza. Mol. Biol. Rep. 2010, 37, 507–513. [Google Scholar] [CrossRef]
  66. Pfaffl, M.W. A new mathematical model for relative quantification in real-time RT-PCR. Nucleic Acids Res. 2001, 29, 2002–2007. [Google Scholar] [CrossRef]
  67. Wan, X.; Wang, Y.; Row, K.H. Separation of tanshinone I, tanshinone IIA, and cryptotanshinone from Salvia miltiorrhiza Bunge by normal phase HPLC. J. Liq. Chromatogr. Relat. Technol. 2009, 32, 544–552. [Google Scholar] [CrossRef]
  68. Yuan, L.; Perry, S.E. Plant Transcription Factors, 1st ed.; Humana Press: Totowa, NJ, USA, 2011; pp. 45–66. [Google Scholar]
  69. Luján, M.A.; Soria-García, Á.; Claver, A.; Lorente, P.; Rubio, M.C.; Picorel, R.; Alfonso, M. Different Cis-Regulatory Elements Control the Tissue-Specific Contribution of Plastid ω-3 Desaturases to Wounding and Hormone Responses. Front. Plant Sci. 2021, 12, 727292. [Google Scholar] [CrossRef] [PubMed]
  70. Chen, H.; Yang, Q.; Fu, H.; Chen, K.; Zhao, S.; Zhang, C.; Cai, T.; Wang, L.; Lu, W.; Dang, H.; et al. Identification of Key Gene Networks and Deciphering Transcriptional Regulators Associated With Peanut Embryo Abortion Mediated by Calcium Deficiency. Front. Plant Sci. 2022, 13, 814015. [Google Scholar] [CrossRef] [PubMed]
  71. Lei, X.; Liu, Z.; Xie, Q.; Fang, J.; Wang, C.; Li, J.; Wang, C.; Gao, C. Construction of two regulatory networks related to salt stress and lignocellulosic synthesis under salt stress based on a Populus davidiana × P. bolleana transcriptome analysis. Plant Mol. Biol. 2022. [Google Scholar] [CrossRef] [PubMed]
Figure 1. Effect of GA3, IAA and SA on HMGR4 gene expression in S. miltiorrhiza leaves. The expression was analysed by real-time PCR. The results are presented as mean ± SD.
Molecules 27 04354 g001
Figure 2. Quantitative UHPLC analysis of the content of individual tanshinones (AD) and the total amount of all tested tanshinones (E) in extracts obtained from roots, stems, leaves and flowers of S. miltiorrhiza. A control is shown for each test sample (non-HMGR4 overexpressing plant material or, in the case of hormone treatment, non-hormone-treated HMGR4 overexpressing plant material). Bars are medians with first and third quartile. ** significant difference at p < 0.01 compared to control; * significant difference at 0.01 < p < 0.05 compared to control; DW, dry weight; OX, overexpression.
Molecules 27 04354 g002aMolecules 27 04354 g002bMolecules 27 04354 g002c
Figure 3. Map of the expression construct pRI201-AN-HMGR4.
Molecules 27 04354 g003
Figure 4. Cultures of S. miltiorrhiza at various stages of transformation, regeneration and growth. (A) callus resistant to selection antibiotics after two weeks of growth, (B) shoots regenerated from callus three months after the experiment began, (C) culture of roots transformed with the pRI201-AN-HMGR4 construct, (D) plant transformed with the pRI201-AN-HMGR4 construct after several months of growing in soil, (E) flowering of the plant transformed with the pRI201-AN-HMGR4 construct.
Molecules 27 04354 g004
Table 1. Potential transcription factors (TFs) that bind to the Salvia miltiorrhiza HMGR4 promoter sequence and respond to gibberellic acid (GA3), indole-3-acetic acid (IAA), salicylic acid (SA) signals found using PlantPan 2.0 tool.
TF Family NameTF Gene Name and LocusTFBSs Number
GA3
AT-HookAHL25; At4g353906
MYB-relatedCCA1; At2g468301
RVE8; At3g096002
RVE4; At5g02840
Homeodomain; HD-ZIPATHB-23; At1g269601
bHLHPIF3; At1g095302
GATAGATA22; At4g2615062
GATA21; At5g56860
MADS box; MIKCSOC1; At2g456608
AGL24; At4g2454015
MADS boxAGL71; At5g5187013
AGL72; At5g5186014
AGL42; At5g62165
NF-YCNFYC3; At1g5483048
IAA
MYB-relatedCCA1; At2g468301
RVE 8; At3g096002
Homeodomain; HD-ZIPHAT2; At5g473702
ATHB-20; At3g012203
CAMTACAMTA1; At5g094102
MADS box; MIKCAGL14; At4g1188017
SA
NAC; NAMNAC081; At5g087901
NAC062; At3g495302
MYBMYB46; At5g128704
Myb/SANT; MYBMYB3; At1g226401
MYB-relatedCCA1; At2g468301
RVE8; At3g096002
RVE4; At5g02840
DofDOF1.1; At1g0764034
DOF3.4; At3g50410
bZIPTGA2; At5g0695032
bHLHLRL1; At2g242602
CG-1; CAMTACAMTA2; At5g642203
CAMTACAMTA4; At1g673102
CAMTA6; At3g16940
CSDCSP2; At4g386802
WRKYWRKY6; At1g623009
WRKY40; At1g80840
WRKY4; At1g139608
WRKY60; At2g25000
WRKY21; At2g30590
WRKY54; At2g40750
WRKY70; At3g56400
WRKY53; At4g23810
WRKY18; At4g31800
WRKY26; At5g07100
WRKY38; At5g22570
WRKY30; At5g24110
Table 2. Primers used in the study.
Primer NameSequenceProduct Size [bp]
Confirmation of Transformation
Kanamycin_FTGATCTCGTCGTGACCCAT234
Kanamycin_RAGAAGGCGATAGAAGGCGA
Real-Time PCR
HMGR4_FCTCAACCTGCTTGGCGTAA185
HMGR4_RAGTCTCGTGATGTCCCTGCT
ACT7_FTCCGTCTTGATCTTGCTGGT170
ACT7_RCGTCTTTGCAGTTTCGAGCT
Table 3. Details of UHPLC tanshinone analysis in S. miltiorrhiza.
AnalyteRetention Time [min]Standard CurveR2
DHTI6.025y = 190.163x − 16.6900.99973
CT10.009y = 146.106x − 10.9260.99992
TI10.938y = 241.276x − 21.8160.99989
TIIA14.808y = 327.209x − 20.0140.99996
Publisher’s Note: MDPI stays neutral with regard to jurisdictional claims in published maps and institutional affiliations.

