1. Introduction
Breast cancer is a major global health problem and a common cause of cancer deaths in women [
1]. According to Lei et al. [
2], an estimated 2.3 million breast cancer cases and 685,000 deaths in 2020 were reported worldwide. Developing countries reported an estimated 74,072 deaths and 168,690 cases in 2018 [
3]. It is one of the most common types of women’s cancer in Sub-Saharan Africa with a projection of 416,000 deaths expected between 2020 and 2029 [
4]. In Tanzania, case data demonstrated an upward growth trajectory from 2732 in 2012 to 3037 new cases in 2018 [
2] which are anticipated to increase by 82% by 2030 [
5]. Without interventions, the burden of breast cancer is bound to rise, exerting tremendous financial and emotional strains on individuals. Adjuvant treatments of breast cancer include chemotherapy, immunotherapy, and radiation therapy. However, they confer adverse side effects, some cancer cells can gain resistance, and they are relatively costly, especially in developing countries [
6]. These drawbacks have necessitated the search for alternative efficacious and affordable cancer drugs. In this context, medicinal plants are an important alternative approach since they pose fewer side effects in appropriate doses [
7,
8]. Therefore, plant-derived agents, for example Docetaxel from
Taxus baccata, are used in some cancer treatments [
9].
Moringa oleifera Lam. (Mo) leaf is a commonly used herbal medicine for cancer treatment in African communities. Several in vitro studies have demonstrated its efficacy against breast cancer [
10,
11,
12,
13]. The efficacy is attributable to polyphenols such as flavonoids, tannins, and terpenoids. Although polyphenols have antineoplastic effects, they are characterized by poor plasma membrane permeability and lipid immiscibility due to their hydrophilic nature, which limits their absorption into the target cells and also lowers their bioavailability and therapeutic efficacy [
10,
14,
15].
Moringa oleifera polyphenols (Mopp) are also degraded by digestive enzymes and gastric fluids when administered orally [
15]. An example of a novel drug delivery system using different nanocarriers in the nanomedicine field includes silver conjugated with Mopp to solve the bioavailability challenges, but silver can impose toxicity [
16,
17]. Therefore, there is a need to search for novel drug delivery systems that are safer and more bioavailable, hence the introduction of nanomedicine in this study.
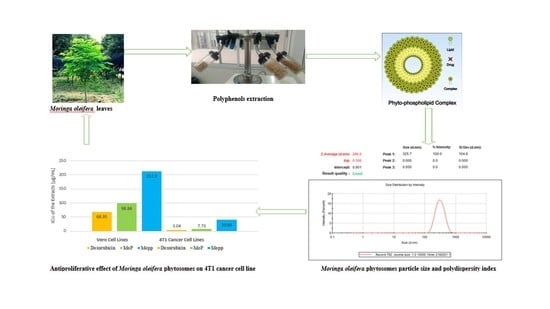
Nanomedicine is a study area that involves comprehensive monitoring, repair, control, defense, construction, and the improvement of the biological system at a molecular level by using engineered nanostructure and nanodevices to achieve health benefits. Cancer nanomedicine development has focused on improving the efficacy of cytotoxic agents and improving their delivery into tumor cells. Nanomedicine has been tailored to initiating tumor cell death using hybrid nanostructures, such as phytosomes, which act as a drug delivery vehicles for bioactive compounds [
18]. Phytosomes form part of nanomedicine that significantly impacts the delivery of anticancer agents.
Phytosomes (ps) comprise a new drug delivery system with an enhanced controlled drug release profile. They are formed of phospholipids, a lipid, and the cell membrane’s major component. Phospholipids are amphipathic molecules with two neutrally charged tails and a positively charged head that renders them miscible in lipid and water conditions. Part of the phosphate group, the oxygen atom, tends to lose or gain electrons [
19], which facilitates the modification of polyphenols, generating an amphiphilic complex that expediates their movement across the cell membrane barrier. Therefore, ps can be attractive delivery vehicles to enhance the absorption of polyphenols across biological lipid barriers, thus increasing their efficacy and improving their therapeutic effects. The advantages of phytosomes as a traditional drug delivery system include controlled drug release, low toxicity, biodegradability, biocompatibility, drug distribution, and increased bioavailability of polyphenols. Despite the promising potential for phytosomes, there are few studies that have investigated anticancer-associated phytosomes as a drug delivery system in cancer therapy. Thus, a limited number of products such as SiliphosR, silybin phytosomes, and MerivaR, a curcumin phytosome, are currently in the market. Phytosomes, therefore, being nanocarriers, attract great interest owing to their minimization of the side effects of polyphenols and improvement of their bioavailability.
Previous studies have reported improved anticancer efficacy of nano-phytosomes compared to free polyphenols on breast cancer cell lines [
20,
21]. Therefore, this study focused on exploring an effective phytosome delivery system that overcomes the bioavailability challenge, limits toxicity, and enhances the antitumor effect in clinical applications. Although
Moringa oleifera crude extracts have been used in the management of cancer, there are currently no reported studies on the antiproliferative activity of a
Moringa oleifera phytosomes (MoP) complex on 4T1 cancer cell lines. Thus, this study explored the antiproliferative efficacy of formulated MoP complex on breast cancer cell lines and their in vivo cytotoxic activity using female Swiss albino mice.
3. Materials and Methods
3.1. Reagents and Chemicals
Dichloromethane (99% purity) and ethanol were procured from Sigma-Aldrich Inc. Soy phosphatidylcholine (lipoid) was obtained from Biotec Lab Ltd. The MTT and Trizol ™ reagent were obtained from Sigma. The 4T1 mammary carcinoma cells and Vero cell lines were ordered from the American Type Culture Collection (ATCC) Manassas, VA, USA). Dulbecco’s modified Eagle’s medium (DMEM) was from Gibco (Life Technologies, Inc., Carlsbad, CA, USA). Fetal bovine serum (FBS) 10%, L-glutamine 1%, and 1% antibiotics were purchased from Gibco.
3.2. Ethical Considerations
Before commencement of the study, clearance was sought from the Kenya Medical Research Institute (KEMRI), Scientific and Ethics Review Unit (SERU). All the laboratory procedures and protocols were followed, and no human subjects were used in the study.
3.3. Sample Collection and Preparation
Moringa oleifera leaves were collected from 20–26 May 2021, at Machame, Moshi, Tanzania, where they were being used by the Traditional Health Practitioners (THPs) and local communities for breast cancer management. The collection was carried out with assistance from a botanist and the area herbalist, and an authentication voucher number JWN/MO/05/2021 was awarded by a professional taxonomist. The samples were taken to the Nelson Mandela African Institution of Science and Technology (NM-AIST), sorted, air-dried for seven days, and then pulverized into fine powder. The materials were then filtered using Whatman’s filter paper (No. 1) and subjected to a microwave-assisted extraction technique.
3.4. Microwave-Assisted Extraction
A domestic microwave oven (Akai A24001), with 800 W total capacity operating at 2.54 GHz, was employed for Mopp extraction. Approximately 5.0 g of plant samples were mixed with distilled water (100 mL). The mixtures were irradiated at (750 W, 90 s) as described Sánchez Camargo et al. [
42] with some modifications. The resulting mixture was then filtered using Whatman’s No. 1 filter paper, concentrated by a freeze drier, and the extracted yield was determined gravimetrically.
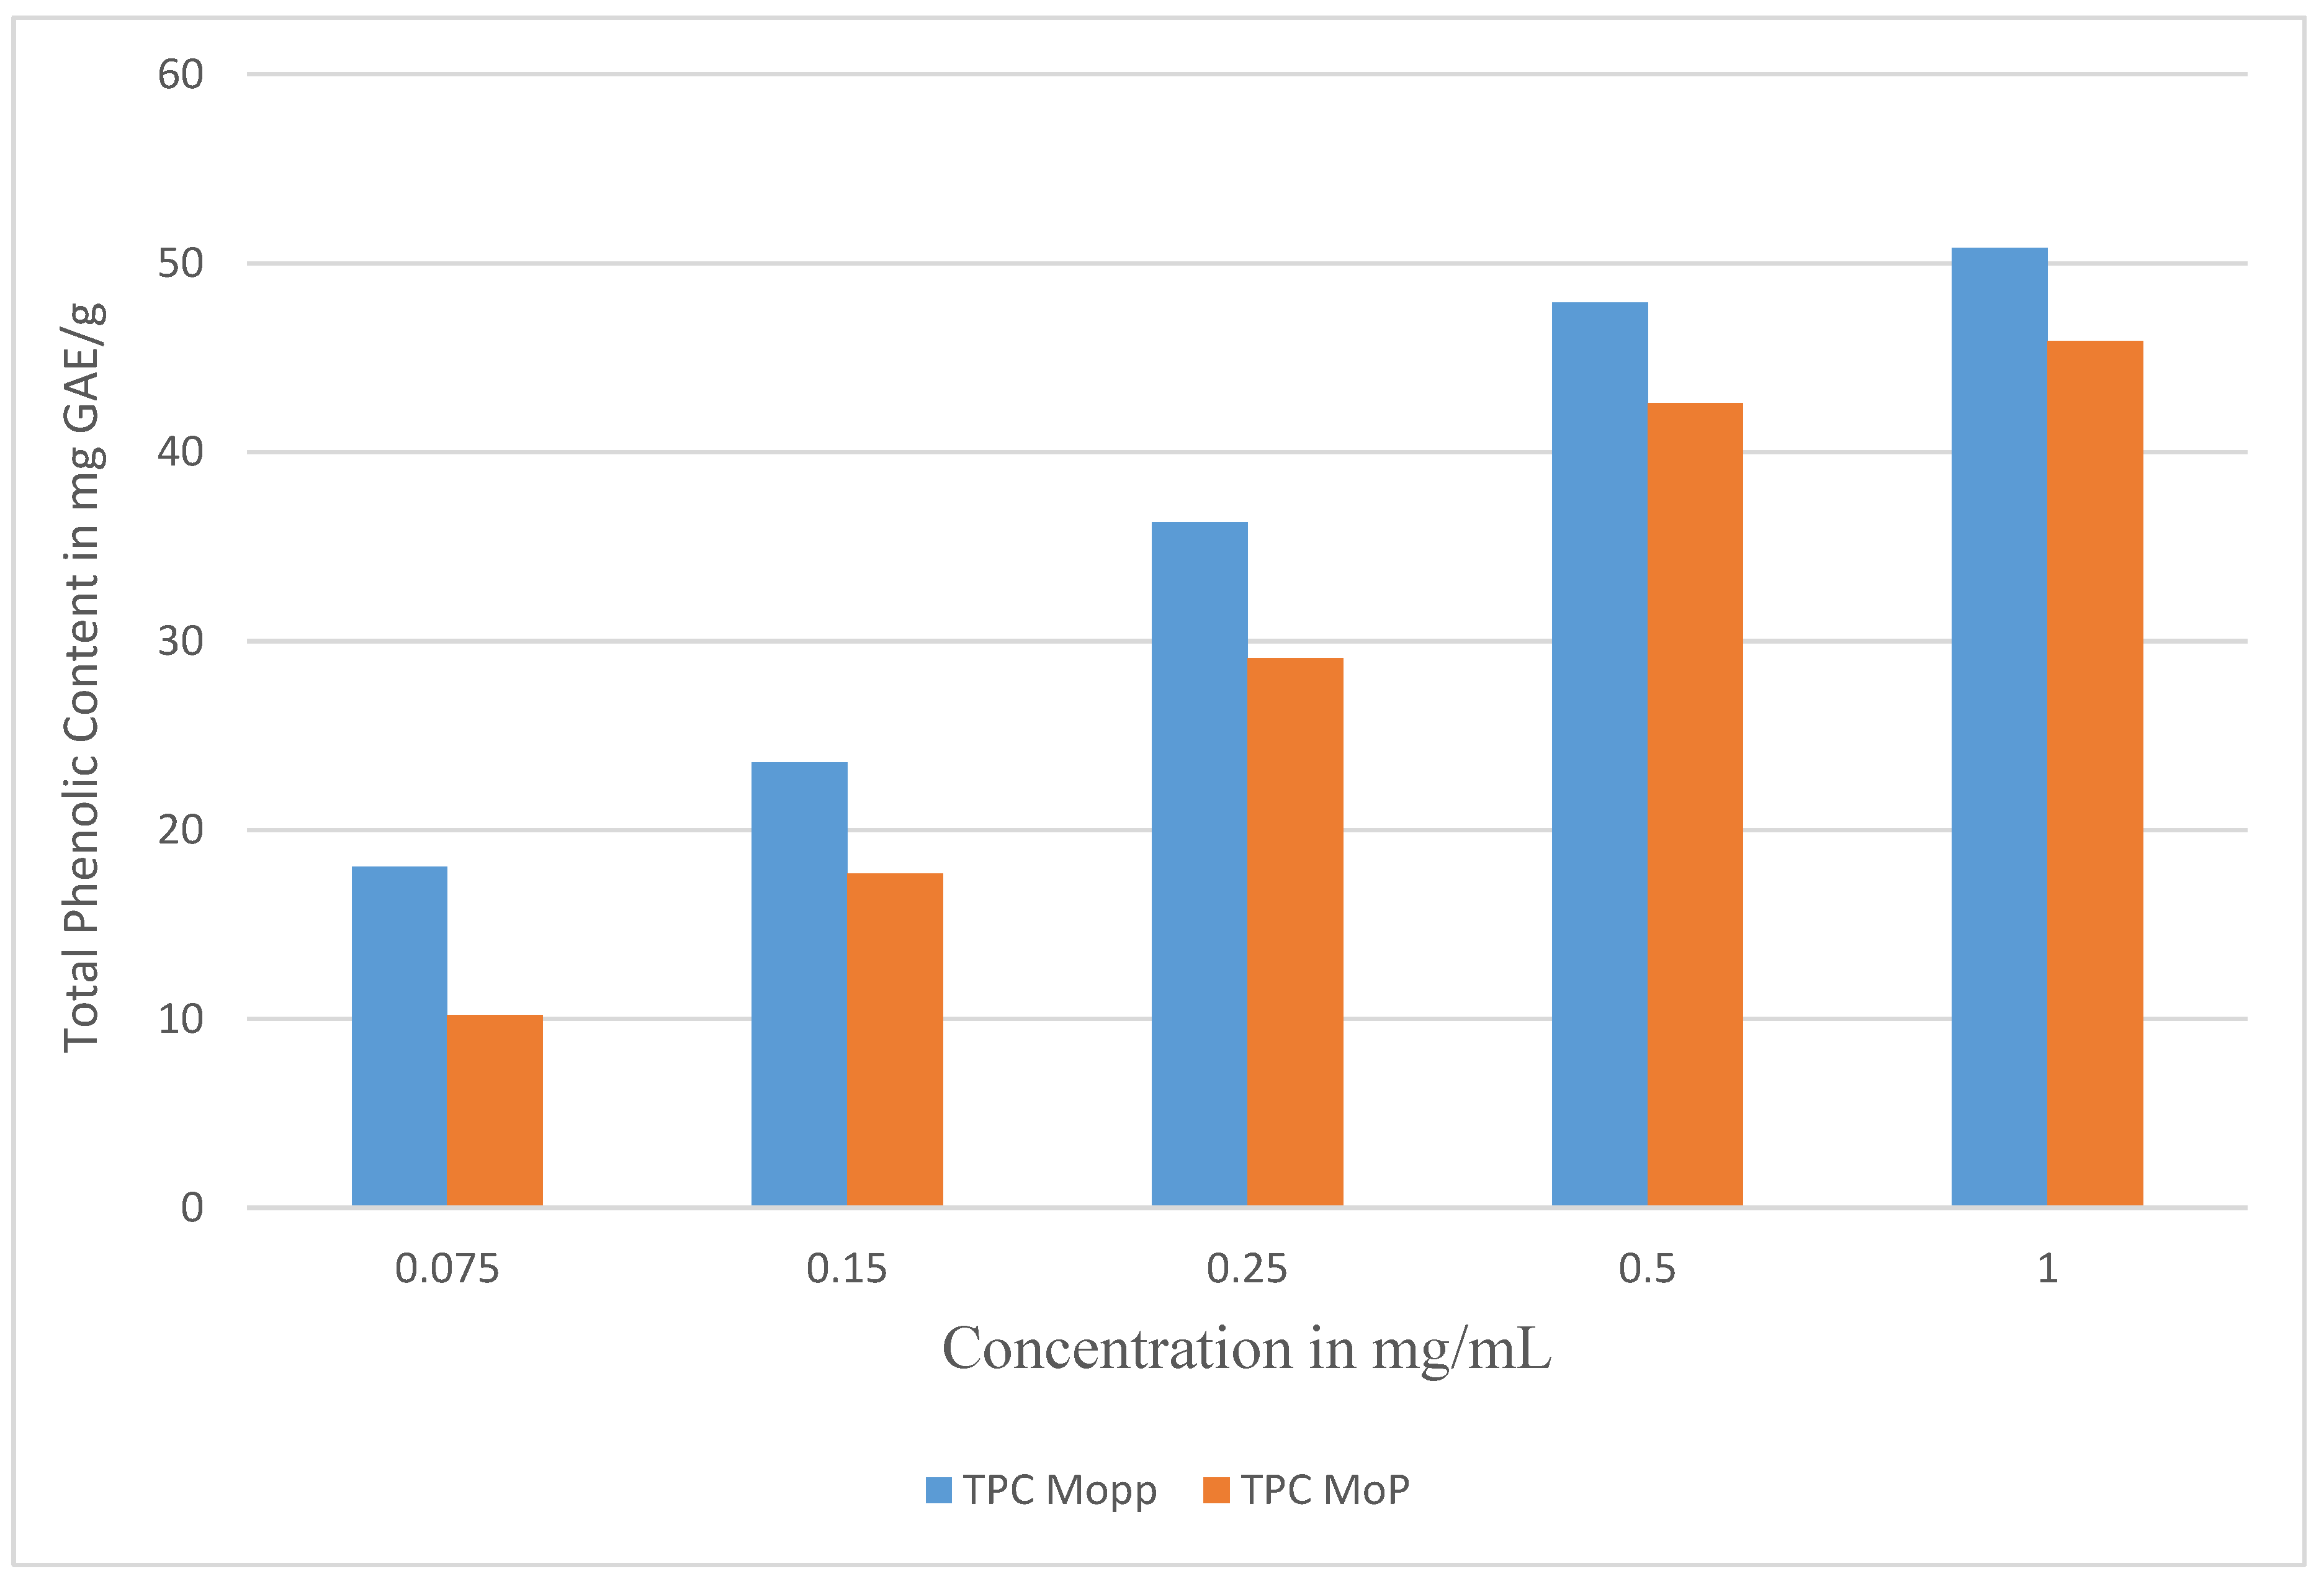
3.5. Estimation of Total Phenolic Content
The quantification of total phenolic content (TPC) was assessed following the Folin–Ciocalteu method [
43] with slight modifications. Triplicate tests were conducted in the experiment. The results were expressed as mg of gallic acid equivalent (GAE) per 100 g of dry MO sample (mg GAE/100 g). The prepared sample was then placed in an air-tight bottle and transferred to the Centre for Traditional Medicine and Drug Research (CTMDR) at the Kenya Medical Research Institute (KEMRI) laboratories in Kenya for further analysis.
3.6. Phytosome Synthesis
A
Moringa oleifera phytosome formulation was prepared using a thin-layer hydration method [
44]. Briefly, lipoid was dissolved in dichloromethane, while Mopp were diluted with 90% ethanol. The mixture was then poured into a round-bottom flask. Sonication followed for 10 min, and a BUCHI Mini spray drier B−290 (Inlet and outlet temperature; 100 °C, pump rate 25; aspirator; 100) was used to flow nitrogen gas which led to solvent evaporation. An even and a thin film layer MoP complex was finally formed.
3.7. Standard Curve and Percentage Entrapment Efficiency
The Folin–Ciocalteu method using gallic acid was used to draw a standard curve that was then used to calculate total phenolic content for MoP and free Mopp. The method is based on the transfer of electrons in an alkaline medium from phenolic compounds to phosphomolybedic phosphotungstic acid complexes in Folin to form blue colored complexes (PmoW11O40)-4 as determined by spectrophotometry at 760 nm. The calibration curve was used to measure the linearity of the method.
The percentage entrapment (% EE) of Mopp in the phytosome complex was determined by the ultracentrifugation method as previously described by El-Fattah et al. [
45,
46,
47]. The MoP formulations were briefly centrifuged at 4 °C and 15,000 rpm for 90 min. The supernatant was then separated and analyzed for TPC as previously described using a UV spectrophotometer at 290 nm.
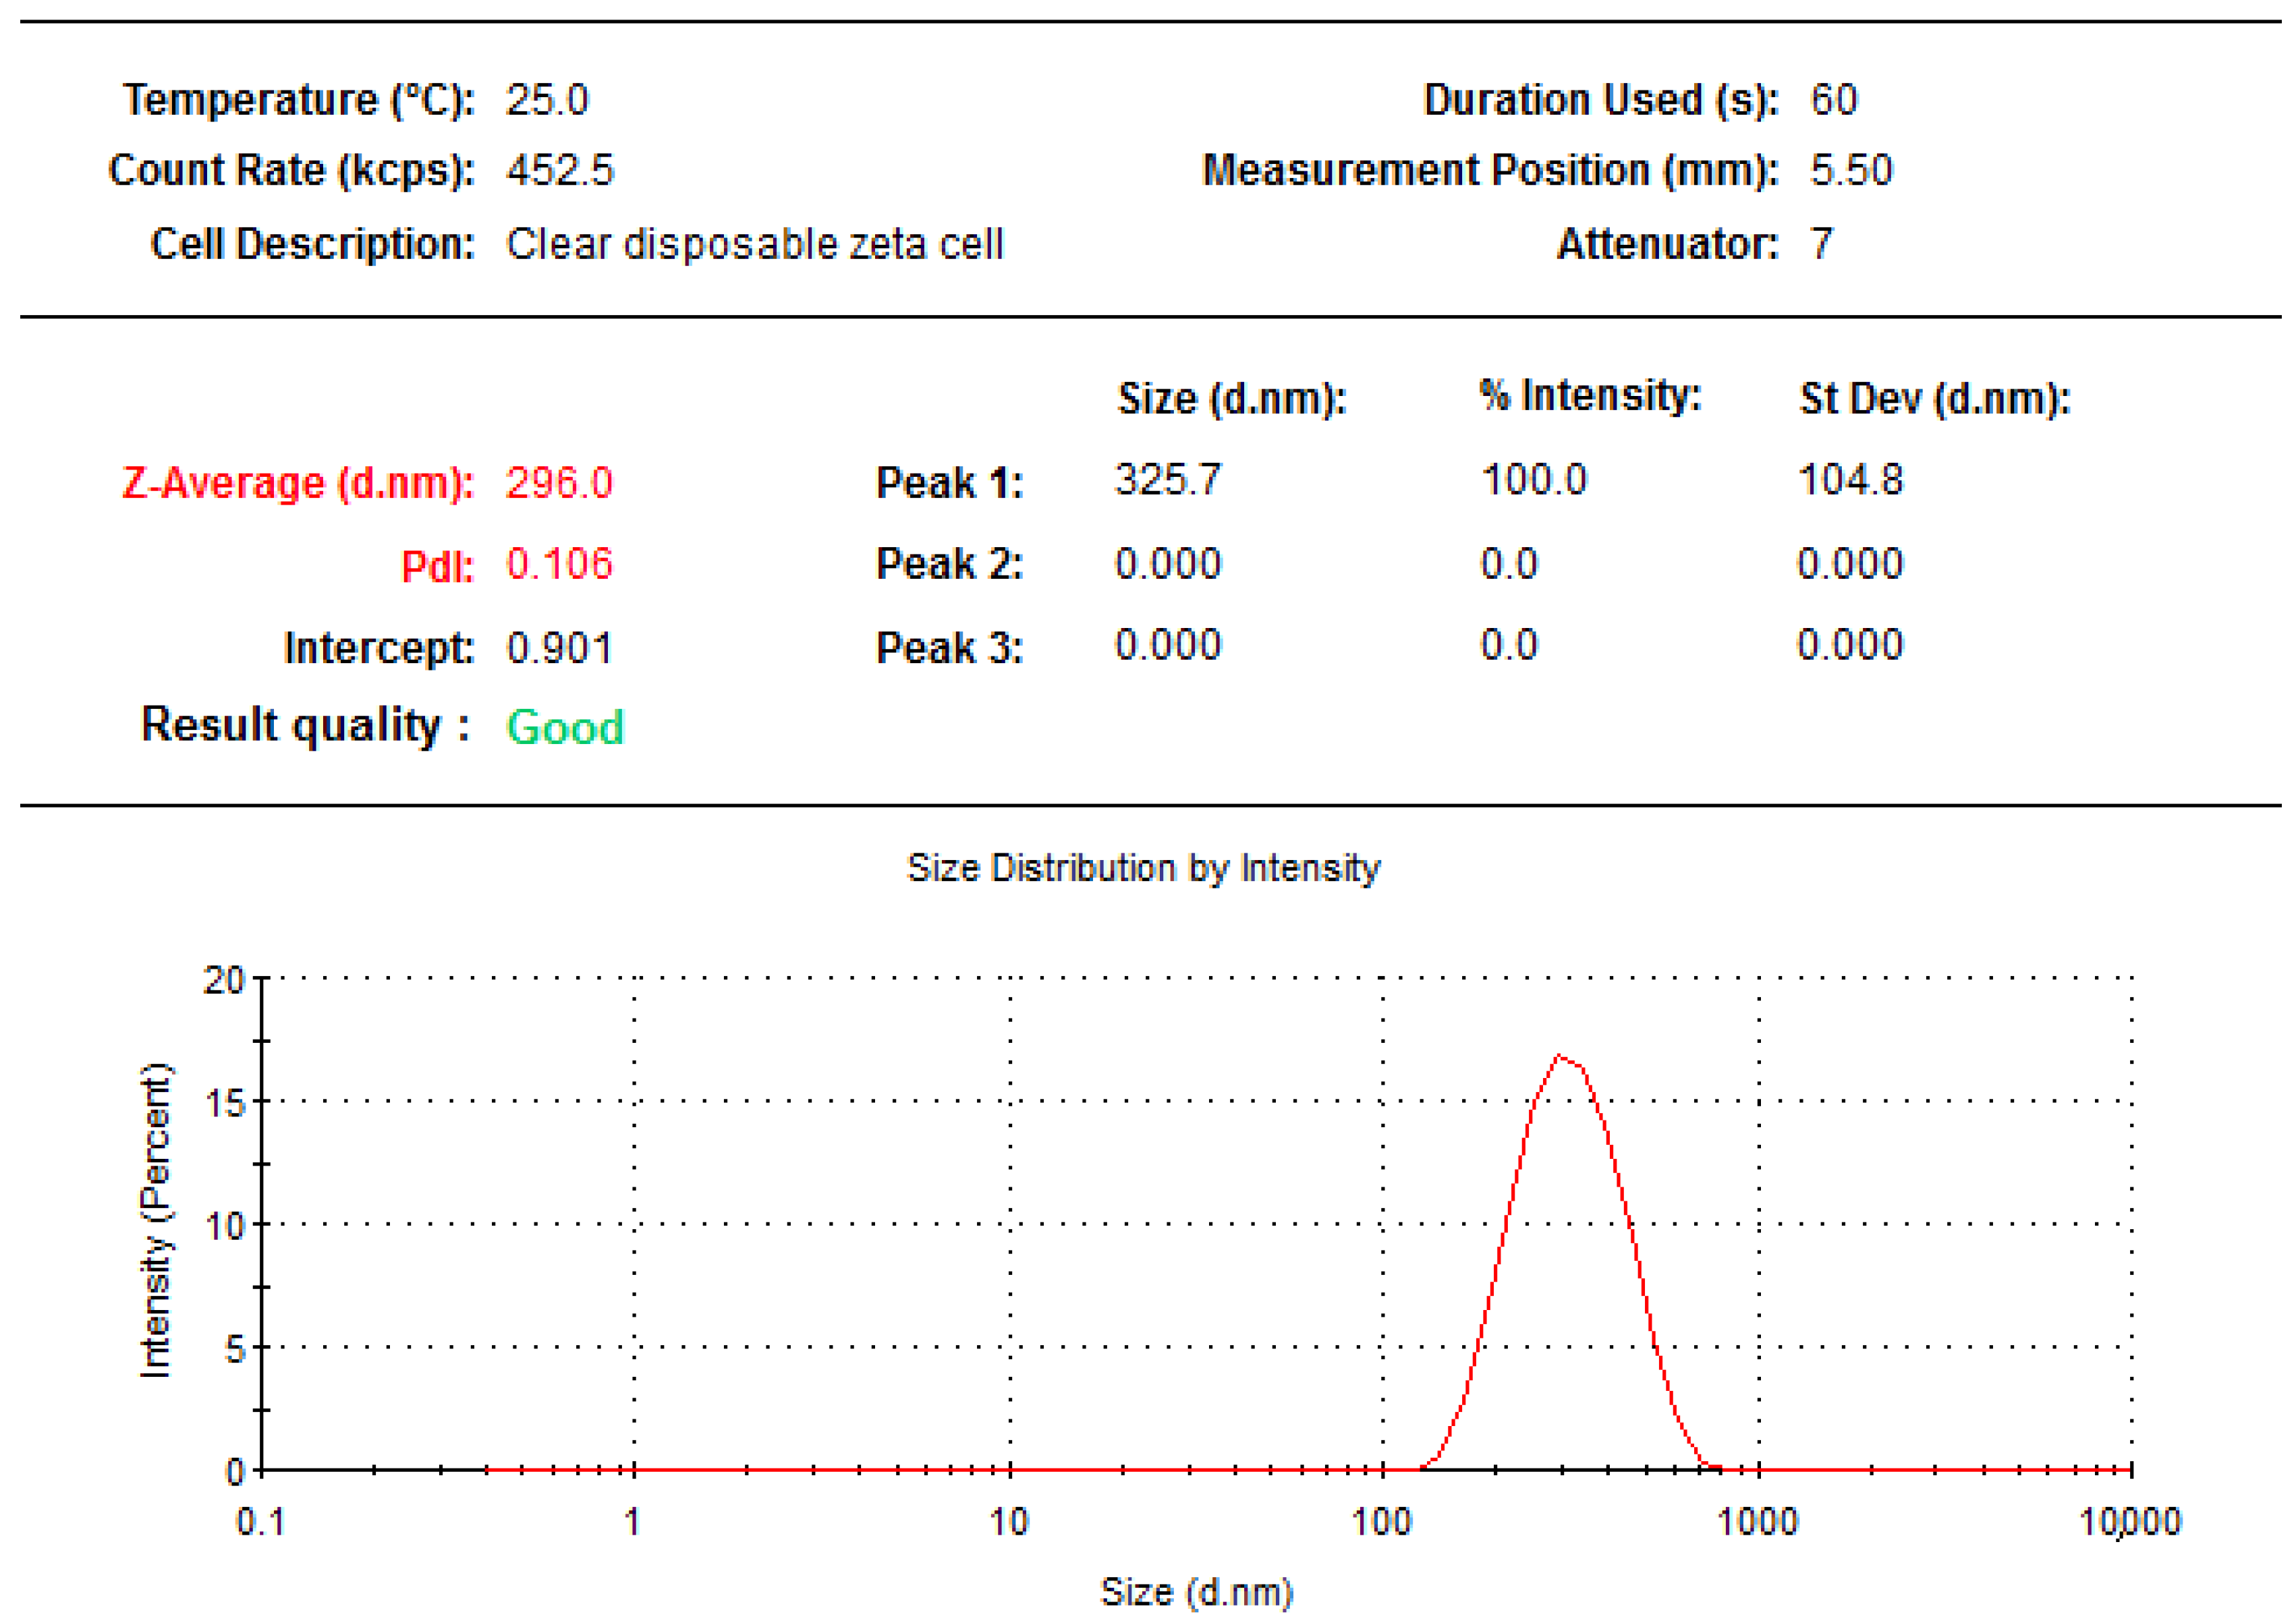
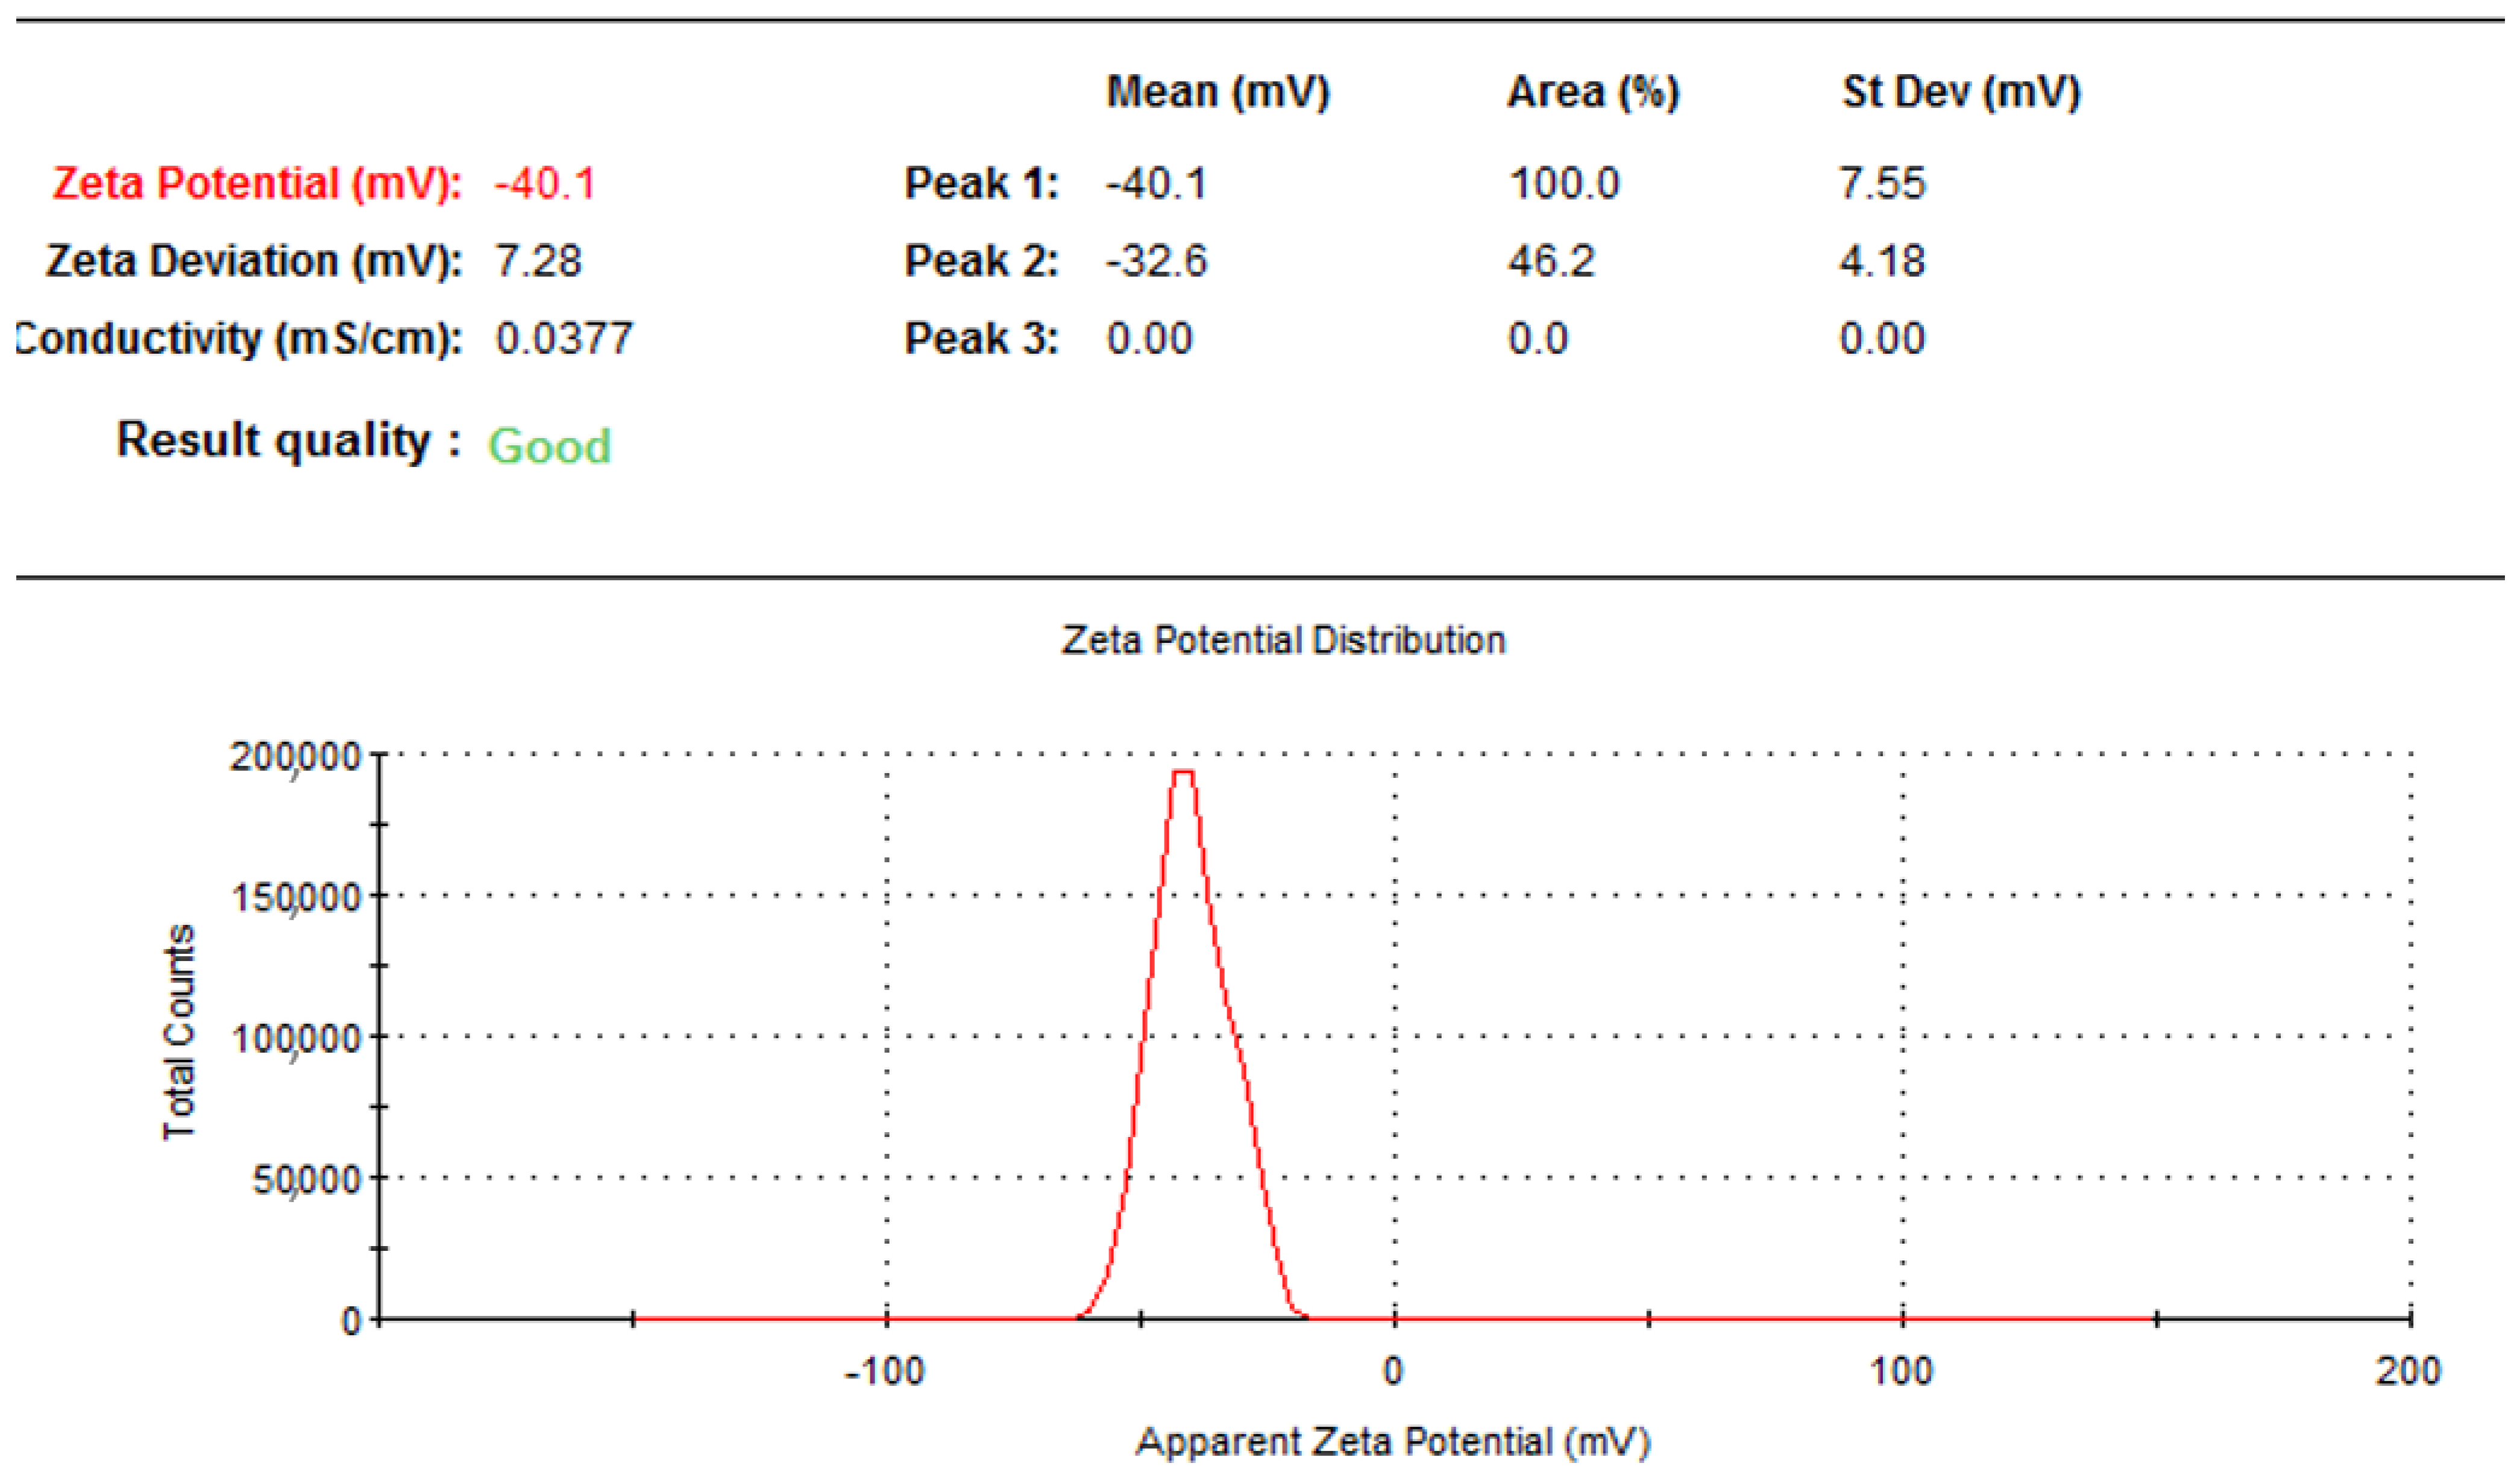
3.8. Particle Size Distribution, Zeta Potential, and Polydispersity Index
The particle size distribution, zeta potential, and polydispersity index (PDI) for the MoP complex were assessed using the dynamic light scattering (DLS) technique with a particle size analyzer comprising a Malvern Zetasizer Nano computerized system using the protocol of El-Far et al. [
45]. The following parameters were used: temperature of 25 °C, a wavelength of 633 nm, 173° light scattering angle, a 1.33 refractive index of the medium, and 0.8872 cP medium viscosity.
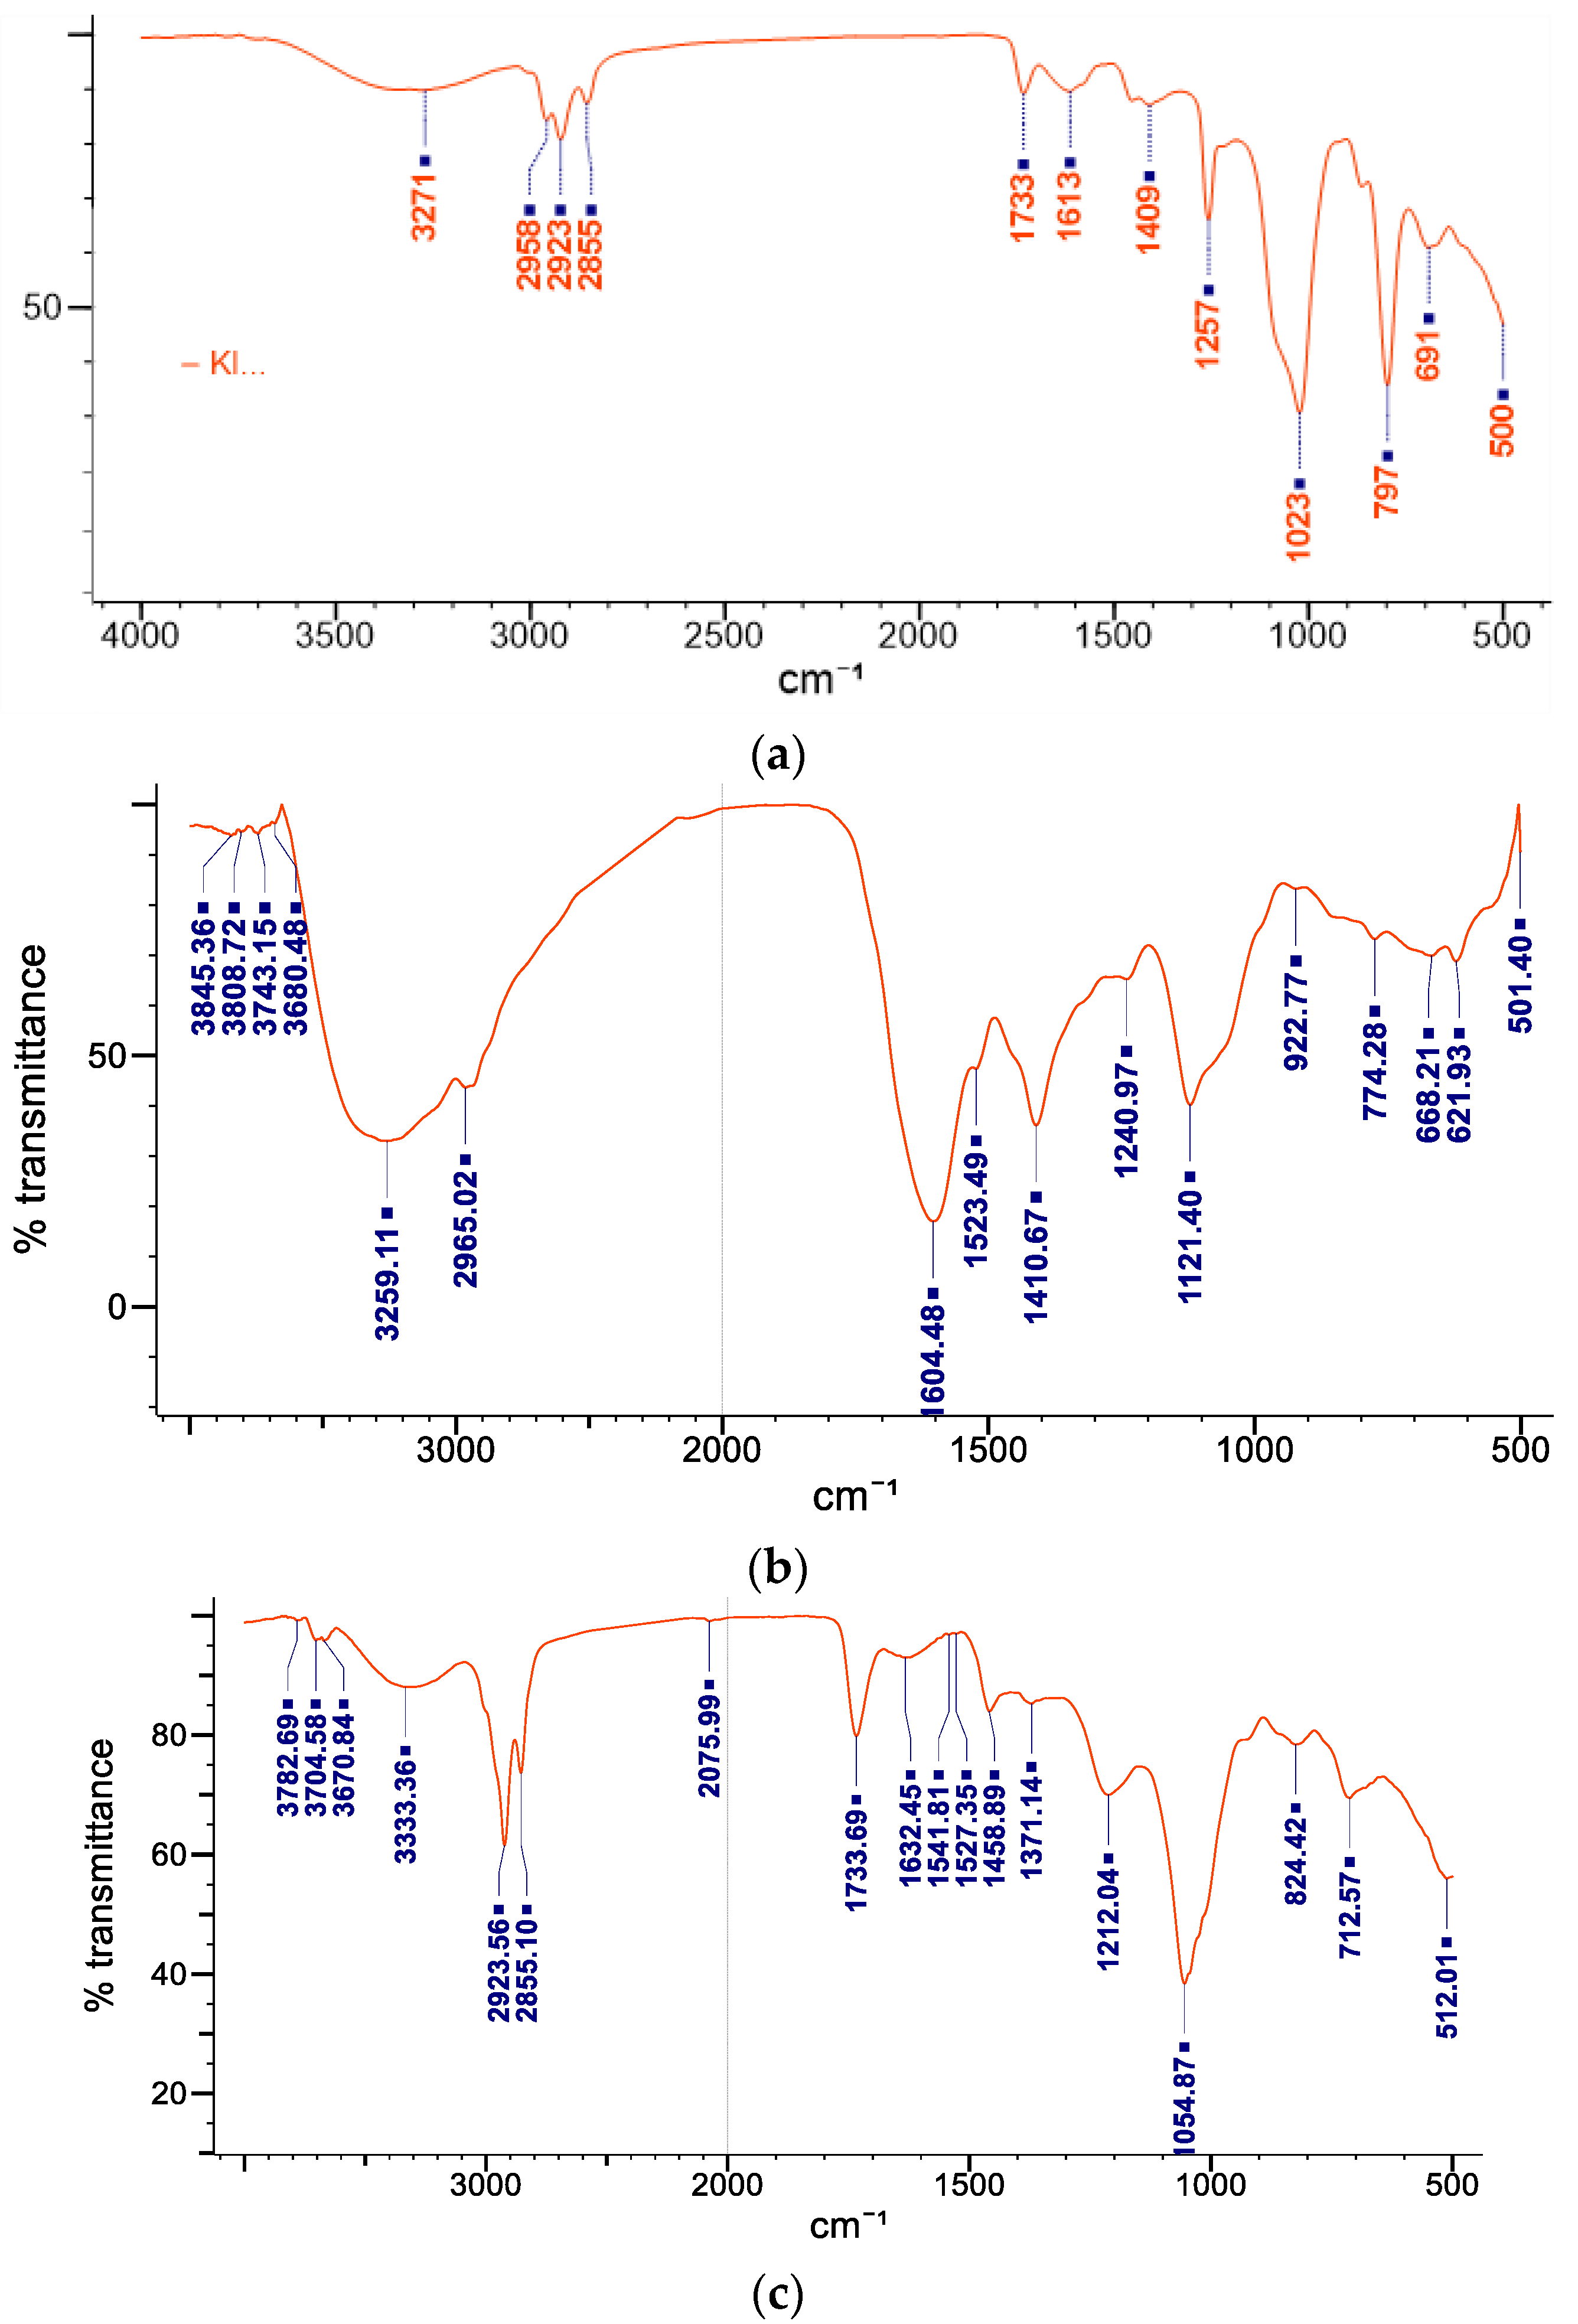
3.9. Fourier Transform Infrared Spectroscopy
The Fourier transform infrared (FTIR) (JASCO 4700 ATR-FT/IR) spectral analysis of MoP complex was used to determine the chemical stability and structure of the compound using the protocol previously described by Thiruvengadam and Bansod [
48]. Potassium bromide pellets were freshly prepared to avoid any moisture effect, mixed with 0.5 mL of the sample, then placed below the fixed probe of FTIR and scanned over a spectrum of 4400 to 400 cm
−1 wavenumber region.
3.10. In Vitro Drug Release of Polyphenol from Moringa oleifera Phytosomes
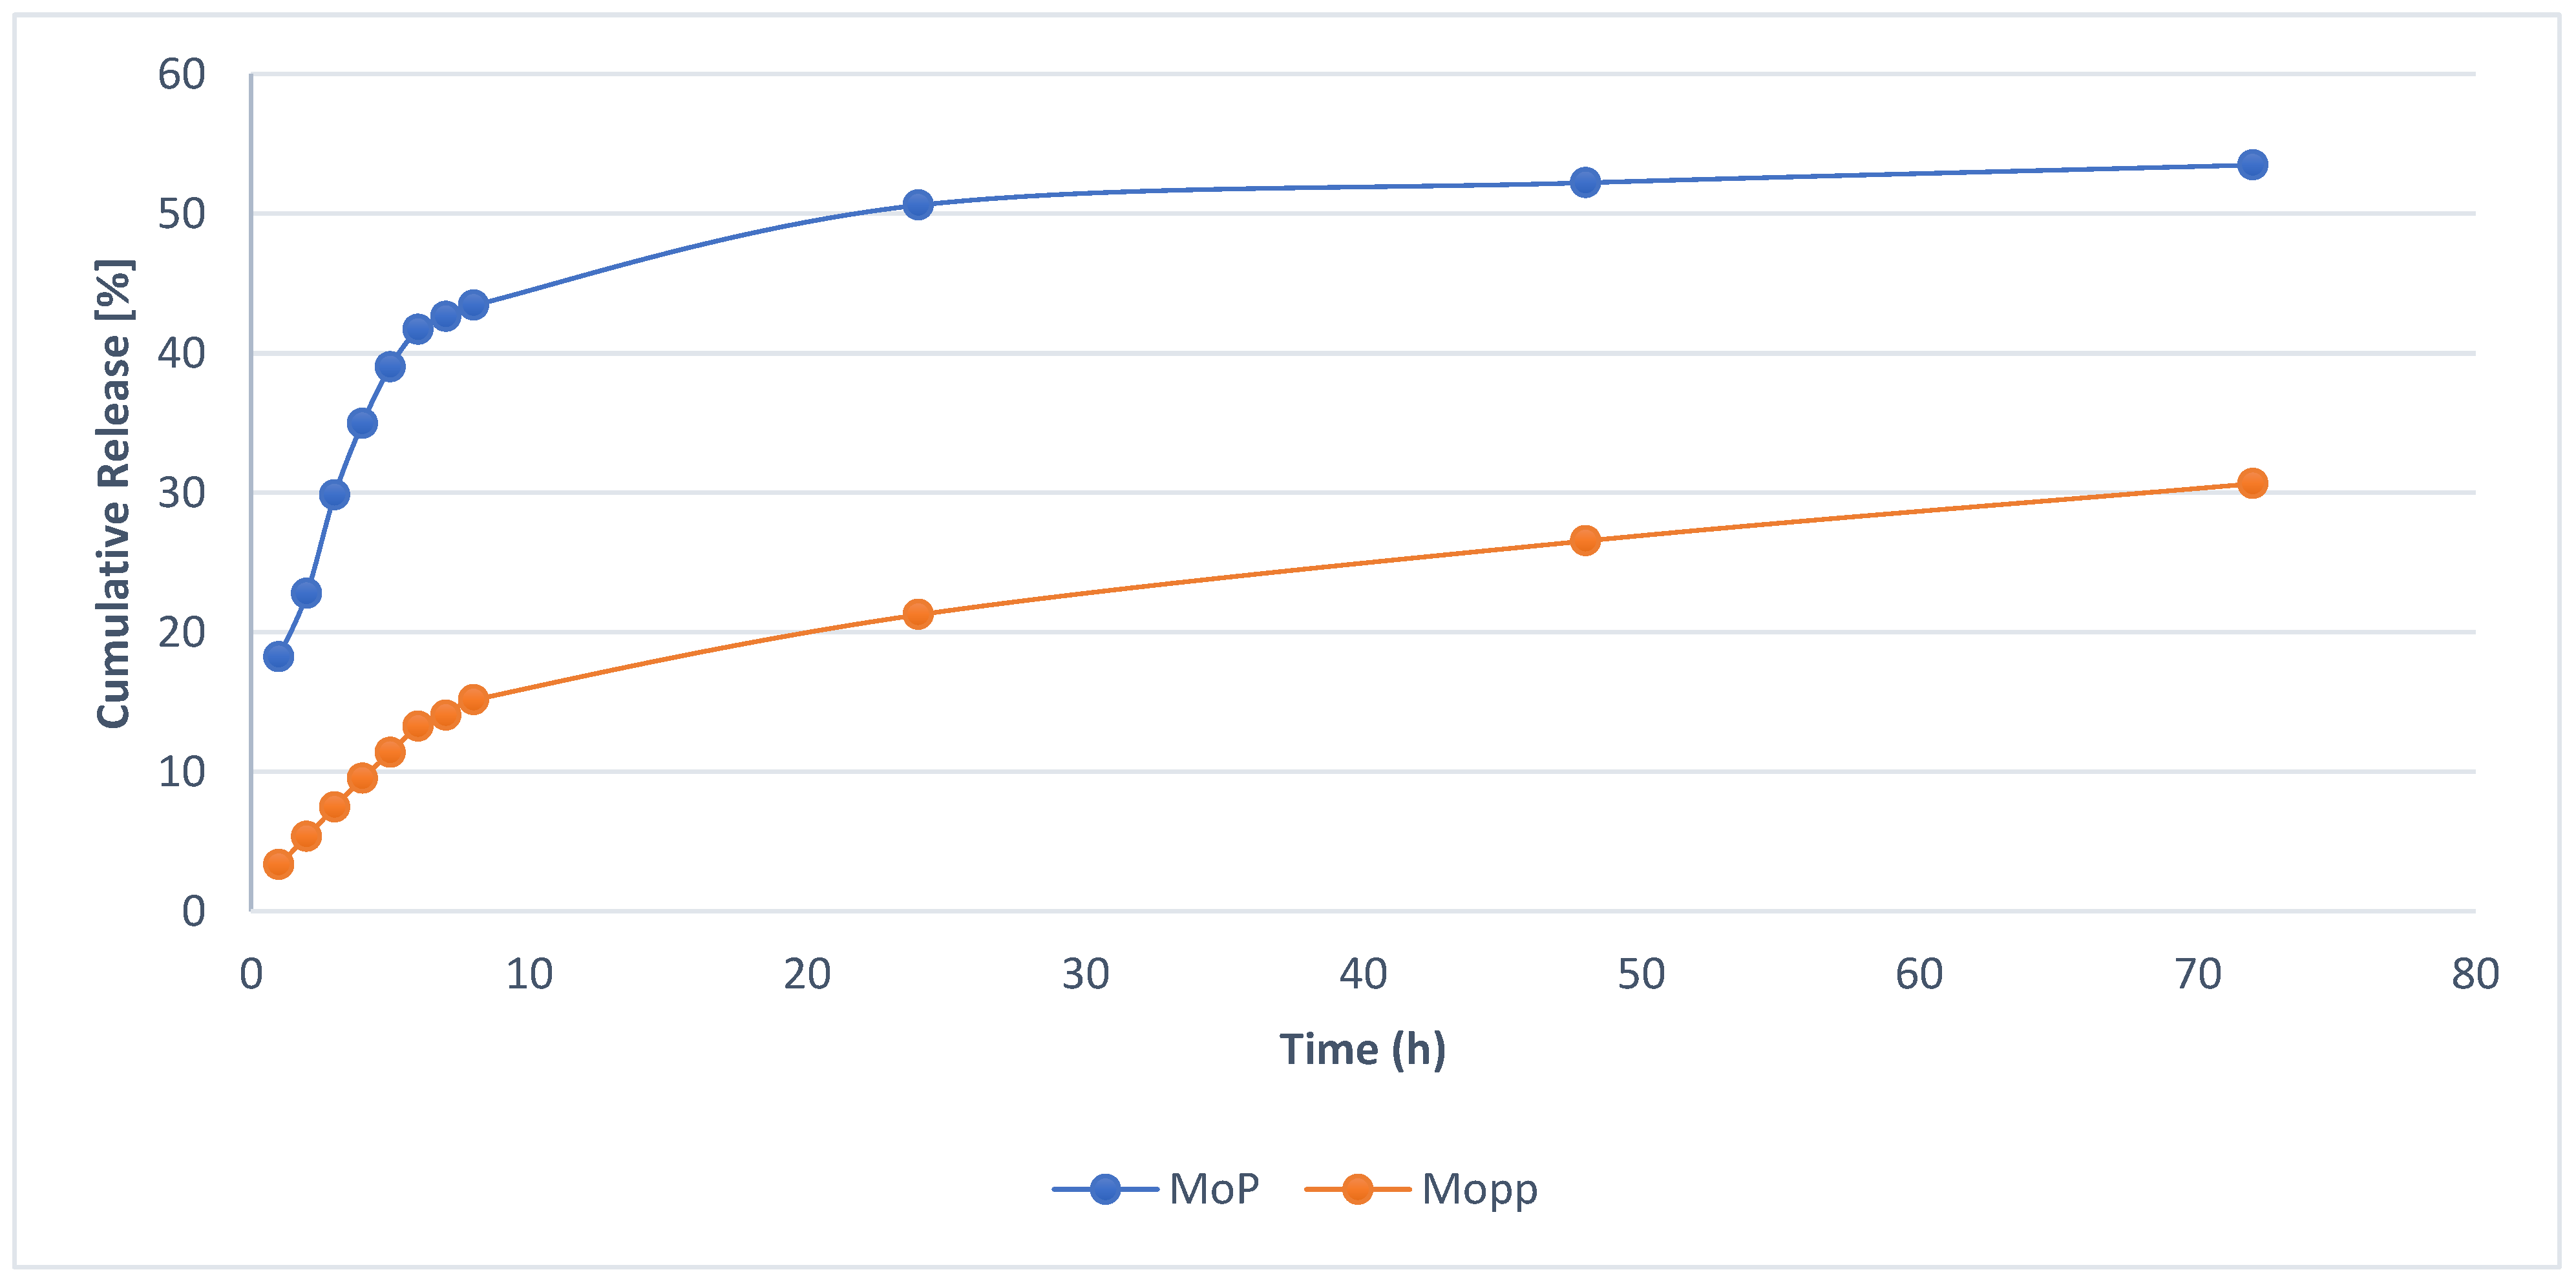
In vitro drug release of Mo phytosomes was analyzed using a dynamic dialysis method with slight modifications [
49]. A dialysis bag at 4000 Da was used with phosphate-buffered saline (PBS) at 0.02 M concentration and 7.4 pH. The dialysis bags allowed the released polyphenols to permeate the release medium. Briefly, an equivalent of 10 mg of Mo phytosomes was dispersed in 2.0 mL of PBS, added into a dialysis bag, and then changed into an Erlenmeyer flask with 100 mL PBS media. The system was then kept on a magnetic stirrer at 37 °C at 100 rpm under controlled conditions. The release media were wholly withdrawn and replaced with fresh PBS solution at designated time intervals from 0 to 8 h, then at 12, 24, and 72 h. The release media (media with the samples) were filtered using 0.45 Millipore filter paper and measured against fresh PBS media as blank at λmax of 425 nm by spectrophotometry. The percentages of polyphenol release were plotted as a function of time according to different kinetics models (zero-order, first-order, Higuchi, and Korsmeyer–Peppas) [
50].
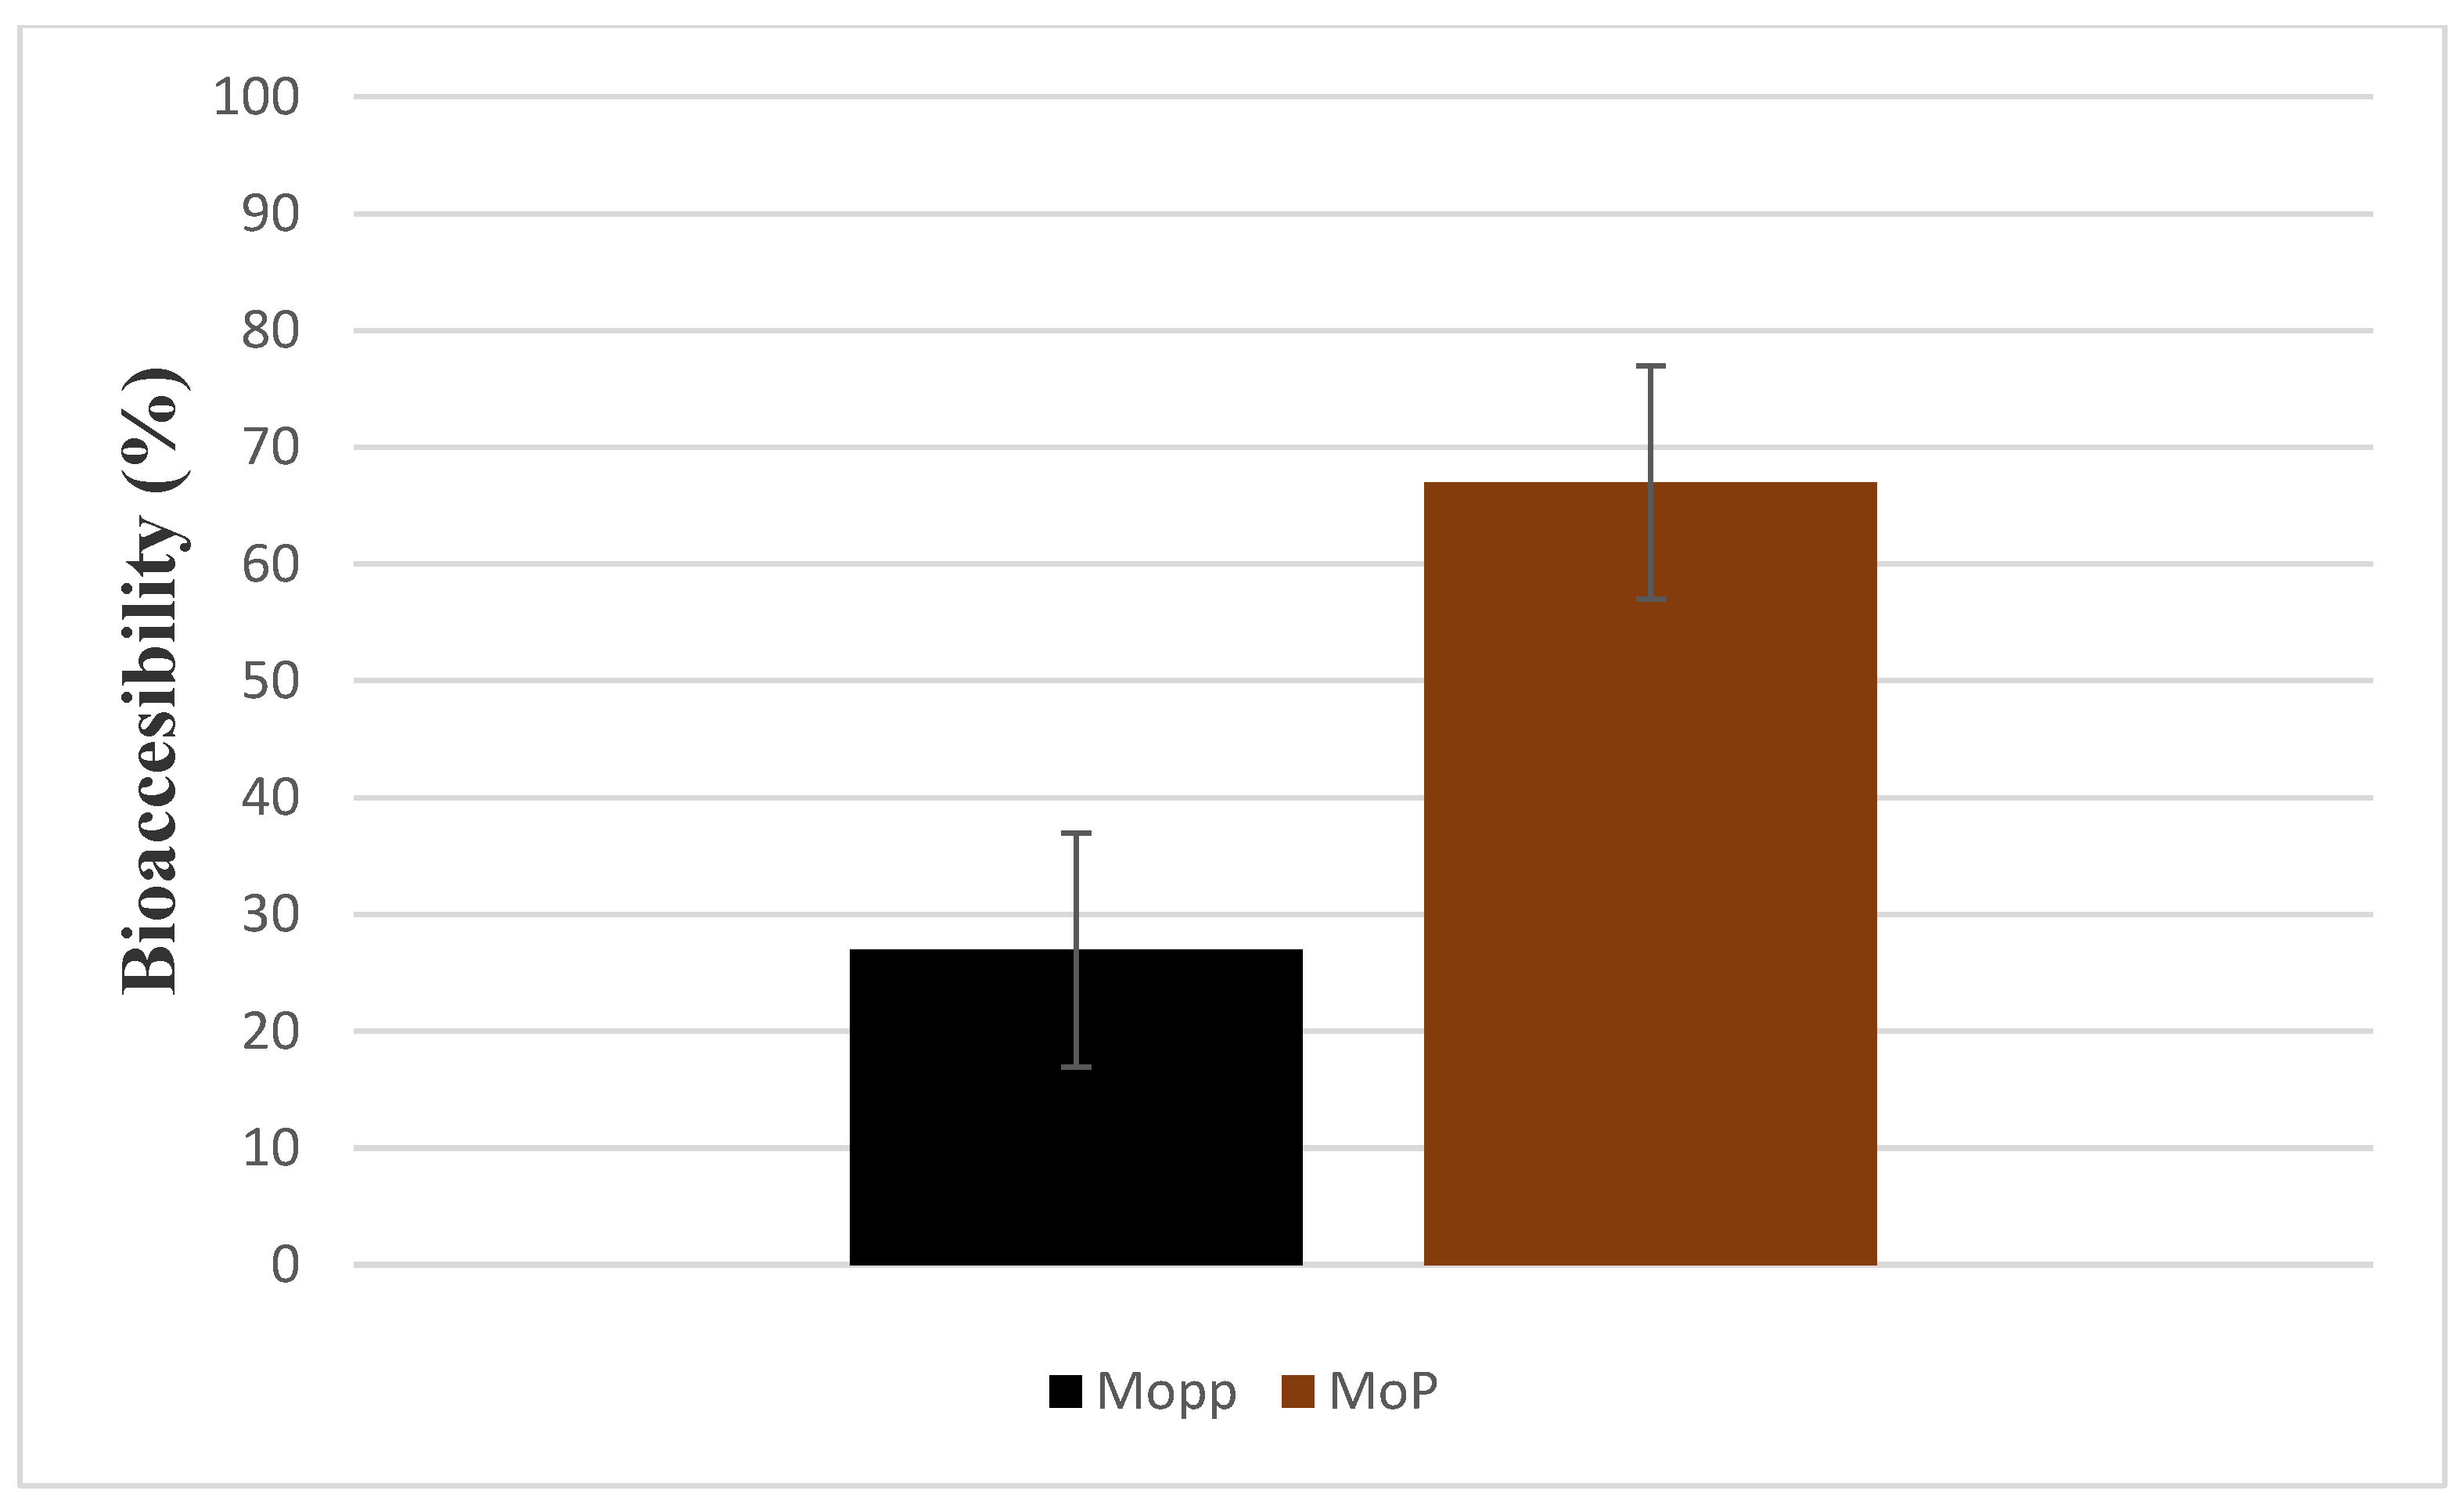
3.11. In Vitro Bioaccessibility Determination of MoP and Mopp
The MoP and Mopp were evaluated for their bioaccessibility in a simulated gastrointestinal (GIT) model consisting of the mouth, stomach, and intestine according to the method of Grgić et al. [
36]. The prepared samples were then exposed to the simulated gastric and small intestine phases.
3.11.1. Simulated Salivary Fluid in Mouth Phase
Simulated salivary fluid phase (SSF) was prepared using 0.328 g/L ammonium nitrate, 1.594 g/L sodium chloride, 0.202 g/L potassium chloride, 0.636 g/L potassium phosphate, 0.198 g/L urea, 0.308 g/L potassium citrate, 0.146 g/L lactic acid sodium salt and 5 g/L porcine gastric mucin type II. An aliquot of 4 mL of each extract was mixed with 4 mL of simulated saliva and the pH of the mixture adjusted to 6.8. The mixture was shaken continuously for 10 min at 100 rev while maintaining temperature at 37 °C.
3.11.2. Simulated Gastric Fluid (SGF)
The SGF was prepared with a slight modification of the methods of Shah et al. [
35] and Grgić et al. [
36]. Two grams of sodium chloride, 7.0 mL of hydrochloric acid (420 g/L) and pepsin (3.2 g) was dissolved in 1 L of double distilled water and the pH adjusted to 1.2 using 1 MHCl. The sample from the mouth phase mimicking the bolus was mixed with SGF phase at a ratio of 50:50. The pH of the two-phase mixture was adjusted to 2.0 using 1 M NaOH and incubated at 37 °C for 2 h with continuous shaking at a speed of 100 rev/min.
3.11.3. Small Intestinal Phase
About 15 mL of the digested sample from the gastric phase was mixed with 8.25 mL simulated intestinal buffer solution. An aliquot of 1.87 mL fresh bile extract, 30 µL of 0.3 M calcium chloride, and 3.75 mL of pancreatin solution were also added and the volume topped up to 30 mL using deionized water. The temperature was maintained at 37 °C and pH adjusted to 7.0 with 1 M NaOH. Approximately 1.5 mL lipase suspension (at a concentration of 60 mg/mL) was dissolved in phosphate-buffered saline (PBS) and added to the mixture. The mixture was then allowed to shake for 2 h while monitoring the pH (pH was maintained at 7.0) to mimic intestinal digestion process. NaOH (0.25 M) was used to neutralize the fatty acids released from the lipid digestion while maintaining the pH of 7.0. The mixture was then shaken at 100 rpm for 6 h at 37 °C.
3.11.4. Measurement of Bioaccessibility
At the end of in vitro digestion, digested sample was used to measure the percentage bioaccessibility. Triton X-100 (1%) was added to the MoP sample to rupture the lipid membrane, and the mixture was vortexed and later centrifuged at 20,000 rpm for 30 min at 4 °C. The supernatant was collected and filtered. The filtrate was then fractioned and phenolic compounds solubilized. The total phenolic content was quantified and bioaccessibility calculated as follows:
3.12. In Vitro Storage Stability Tests
A thin layer hydration method was used in the MoP formulation. A short-term stability test of MoP complex was then evaluated immediately after preparation, subsequently at regular time intervals, according to Lang et al. [
51]. Briefly, 10 mg of MoP complex was stored at 25 °C room temperature for 25 days. As an essential indicator to assess the short-term stability of MoP, the drug-loading residual content was evaluated at predetermined time intervals (0 to 8 and 25 days).
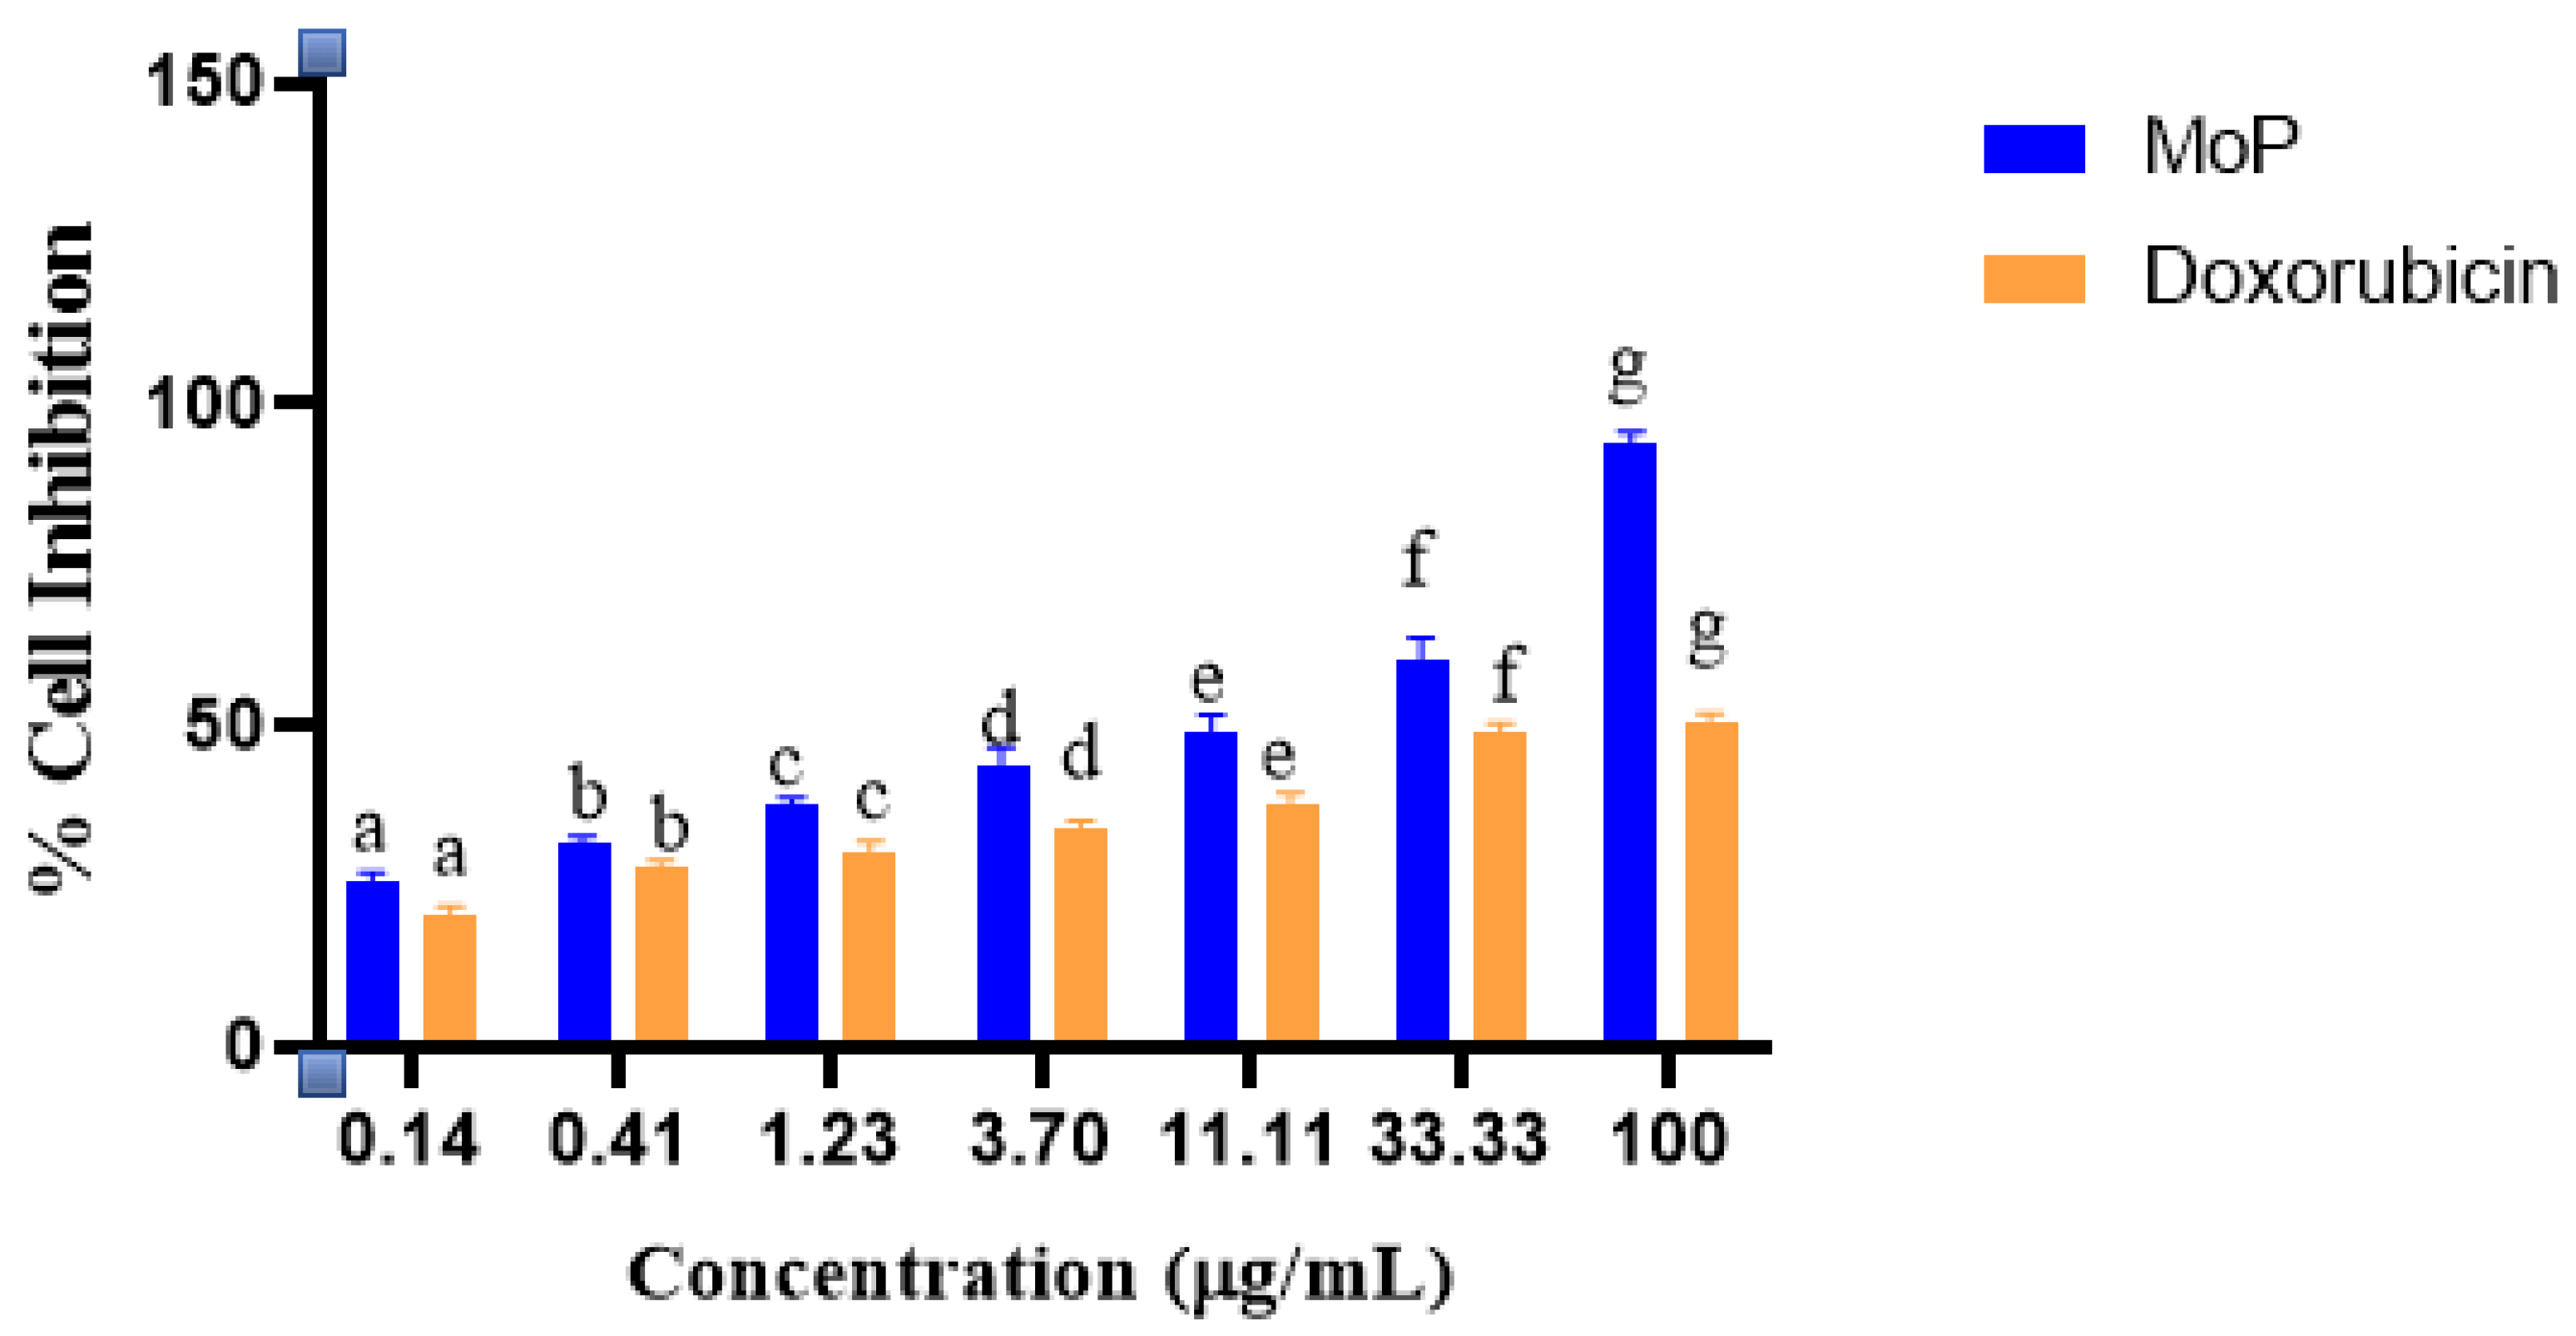
3.13. Cell Viability Test
Cell cytotoxicity of MoP complex against 4T1 cancer and Vero (E6) cell lines was assessed by MTT assay according to the protocol of Alhakamy et al. [
52]. Briefly, a monolayer in the exponential growth phase was trypsinized, after which trypan blue was used to count the viable cells. Cells (1 × 10
6 cells/mL) were seeded in a 96-well microtiter plate in minimum essential media with fetal bovine serum (100 μL) and incubated in 5% CO
2 at 37 °C. After 24 h, the cells were exposed to 20 μL of MoP added in triplicate at the starting concentrations of 100 μL followed by three-fold serial dilutions and incubated for 72 h. Thereafter, 50 μL of MTT dye was added and set at 37 °C for 2 h. After that, approximately 100 μL of dimethyl sulfoxide (DMSO) was added into the solubilized formazan crystals, and absorbance was read at 570 nm using a 96-well microplate reader with a Thermo Fisher MultiscanGo Spectrophotometer model. Doxorubicin was used as a standard drug (positive control). The percentage cytotoxicity was determined using untreated cells as the negative control and expressed in CC
50 values to infer a concentration that altered 50% of intact cells. In addition, the half-maximal inhibitory concentration (IC
50) of 4TI by MoP was assessed and calculated using GraphPad Prism 6 Software, USA. The experiment was carried out in triplicate.
3.14. In Vivo Acute Toxicity Study Using Swiss albino Mice
Six to eight-week-old female
Swiss albino mice (18–22 g) were acquired from the KEMRI animal house. They were then housed under standardized conditions before the experiment. A total of 63 mice were weighed, randomly selected, and divided into nine groups. The mice were marked on their tails for easy identification. Additionally, the animals were fed with water and mice food pellets ad libitum. The cages were kept at 25 °C while ensuring lighting regulation. The acute toxicity experiment was carried out according to the Organization for Economic Cooperation and Development (OECD) and slight modifications of the protocol of Laure et al. [
53].
Briefly, the mice were fasted for 3 h before dosing and given ad libitum water only. An estimated 0.2 mL of drugs was prepared in PBS at 50, 300, and 2000 mg/mL concentrations based on 1 mL/kg of the mice’s body weights. The mice were observed for general behavior, body weight changes, and mortality for the first 5 h and subsequently every day for 14 days after treatment.
The following parameters were considered: mortality, signs of acute toxicity, and behavioral changes (aggression, paralysis, unusual vocalization, agitation, sedation, tremors, convulsions, ataxia, diarrhea, piloerection, catatonia, unusual locomotion, grooming, fasciculation, sleep, coma, prostration and asphyxia, hypo and hyperactivity, and tremors) [
33]. All mice were weighed immediately after treatment on the 1st day then on the 7th and 14th days. At the end of the experiment period, all animals were euthanized, and the spleen, heart, liver, kidneys, lungs, ovaries, intestines, and brains were dissected from each mouse and observed for abnormalities.
3.15. Data Management and Statistical Analysis
The raw data were transferred into Microsoft Excel and used in calculating mean absorbance values. Origin 2019b software was used in calculating the total phenolic content. GraphPad software was used to calculate concentrations needed to inhibit 50% cell growth. Quantitative values obtained per treatment were converted to percentage inhibition. All the data are shown as mean ± SEM, the standard error of the mean. ANOVA was performed to compare the models and the insignificant lack of fit for each output factor depended on the p-value. The very small probability values of the selected model of each output factor reflected that the model was significant for the data set (p < 0.05). Differences in p-value < 0.05 were considered statistically significant. Figures, graphs, and tables were used to give a clear presentation of the data obtained from the study.


