Article

Development of a Lateral Flow Strip with a Positive Readout for the On-Site Detection of Aflatoxin B1

1
Department of Preventive Medicine, Changzhi Medical College, Changzhi 046000, China
2
Department of Chemistry, Changzhi University, Changzhi 046011, China
*
Author to whom correspondence should be addressed.
Those authors contributed equally to this work.
Molecules 2022, 27(15), 4949; https://doi.org/10.3390/molecules27154949
Submission received: 25 June 2022 / Revised: 29 July 2022 / Accepted: 30 July 2022 / Published: 3 August 2022

Abstract

:
Aflatoxin B1 is one of the contamination indicators for food safety monitoring. The rapid and effective assessment and determination of AFB1 in food is of great importance to dietary safety. The lateral flow assay shows advantages in its simplicity, and rapidity, and provides a visual readout, while the available lateral flow assay for AFB1 requires a competitive format that produces readings inversely proportional to the AFB1 concentration, which is counterintuitive and may lead to a potential misinterpretation of the results. Herein, we developed a positive readout aptamer-based lateral flow strip (Apt-strip) for the detection of AFB1. This Apt-strip relies on the competition between AFB1 and fluorescein-labeled complementary DNA strands (FAM-cDNA) for affinity binding to limited aptamers against AFB1 (AFB1-Apt). In the absence of AFB1, AFB1-Apt hybridizes with FAM-cDNA. No signal at the T-line of the Apt-strip was observed. In contrast, AFB1-Apt binds to AFB1 in the sample, and then a part of the FAM-cDNA is hybridized with the free AFB1-Apt, at which time the other unreacted FAM-cDNA is captured by A35-Apt on the T-line. The signal was observed. This method achieved fast detection of AFB1 with a detection limit (DL) of 0.1 ng/mL, positive readout, and increased sensitivity.

1. Introduction

Aflatoxin B1 (AFB1), a fungal metabolite, is highly toxic and carcinogenic to humans and animals [1,2], and it is most commonly found in cereal and oil foods [3]. Long-term exposure to very low levels of AFB1 in feed and food is a threat to human and animal health [4,5]. In order to protect the health of humans and animals, many countries and regions have set the maximum allowable limit of AFB1 (Table S1) in feed and food [6,7]. The National Food Safety Standards of China (GB 2761-2017) stipulate that AFB1 is one of the compulsory inspection items for most foods. Therefore, it is particularly important to establish an accurate and rapid method for the determination of AFB1 in food. Currently, liquid-chromatography-based methods, including high-performance liquid chromatography (HPLC) and liquid chromatography–tandem mass spectrometry (LC–MS/MS), are already officially accepted for the quantitative analysis of AFB1. However, these methods have the disadvantages of being time consuming, requiring expensive equipment and professional technicians to operate, and are not suitable for the rapid on-site screening of bulk samples. The enzyme-linked immunosorbent assay (ELISA) [8] is an alternative method for the rapid analysis of AFB1. Nevertheless, the antibodies are costly and not easily stored, which limit its application in the rapid analysis of AFB1.
Lateral flow assay (LFA) has been widely used for the rapid determination of AFB1 [9,10,11,12] because of its simplicity, portability, cost effectiveness, and suitability for on-site screening [13,14,15,16]. In 2005, Delmulle et al. prepared an LFA strip using colloidal gold as a signal marker for the rapid assay of AFB1 [17]. Subsequently, there has been a significant increase in the number of studies based on colloidal gold LFA for the detection of AFB1 [18,19,20]. Until 2014, Wang first reported the use of luminescent nanomaterials as signal amplifiers for the more sensitive detection of AFB1 [21]. Since then, various luminescent materials, including quantum dots [22,23,24,25] and fluorescent microspheres [26,27], have been used as signal probes for the LFA technique to enhance the sensitivity of AFB1 detection. Recently, in view of the high cost and fallibility of antibodies, aptamer-based lateral flow strips have been developed to detect AFB1 [28,29,30]. However, the currently reported LFA methods for detecting AFB1 produce readings inversely proportional to the analyte content; i.e., negative samples have the strongest T-line signal intensity, while positive samples have a decreasing T-line signal intensity with an increasing AFB1 concentration. This is counterintuitive [31]. In particular, when the AFB1 concentration is at the critical value, the sensitivity is low and the observations are not intuitive.
In this paper, we proposed a positive readout aptamer-based lateral flow strip (Apt-strip) for the detection of AFB1. The Apt-strip indirectly assays AFB1 utilizing the competition of AFB1 and 6-FAM labeled DNA complementary strands (FAM-cDNA) to the affinity binding to AFB1-Apt. This Apt-strip presents a positive readout. With the increase in AFB1 concentration, the greater the amount of FAM-cDNA hybridized at the T-line, and the stronger the fluorescence intensity showed. Through using this Apt-strip, AFB1 can be rapidly detected within 15 min, and the detection limit (DL) is less than 0.1 ng/mL. The method possesses the characteristics of good selectivity, a strong anti-interference ability, high sensitivity, and the potential for the rapid and on-site screening of AFB1 in the food matrix.

2. Results and Discussion

2.1. Principle of the Apt-Strip

The principle of the Apt-strip is shown in Scheme 1. FAM-cDNA is loaded on the conjugate pad, and the streptavidin-labeled aptamer against AFB1 is immobilized at the T-line (Scheme 1a). For AFB1-positive samples analysis, AFB1 competes with FAM-cDNA to bind to the affinity ligand AFB1-Apt in a solution, forming the AFB1-Apt/AFB1 complex. Then, the AFB1-Apt/AFB1 complex and free FAM-cDNA probe migrate to the NC membrane, and the A35-Apt of the T-line hybridized with the free FAM-cDNA probe, resulting in the formation of double-stranded DNA (hybridized A35-Apt/FAM-cDNA probe) and the immobilization of FAM-cDNA at the T-line. As a result, a fluorescent spot is observed at the T-line with a ChemiDocTM MP system (Scheme 1b). The fluorescence intensity is increased by increasing the concentration of AFB1, which can be used for the quantitative analysis of AFB1. For negative samples, the free FAM-cDNA probes hybridize with AFB1-Apt in a solution to form double-stranded DNA (AFB1-Apt/FAM-cDNA probe) instead of A35-Apt of T-line, leading to a negative fluorescence signal at the T-line.
The results of the qualitative analysis can be identified by the naked eye with the aid of the ChemiDocTM MP system. For quantitative results, this is achieved by further analysis of the image. The specific steps are as follows. First, the strip is imaged using the ChemiDocTM MP system. Then, the fluorescence intensities are converted to numerical values with the help of software Image J. The relationship between the AFB1 concentration (X) and fluorescent intensity (Y) can be obtained by constructing a fitting curve.

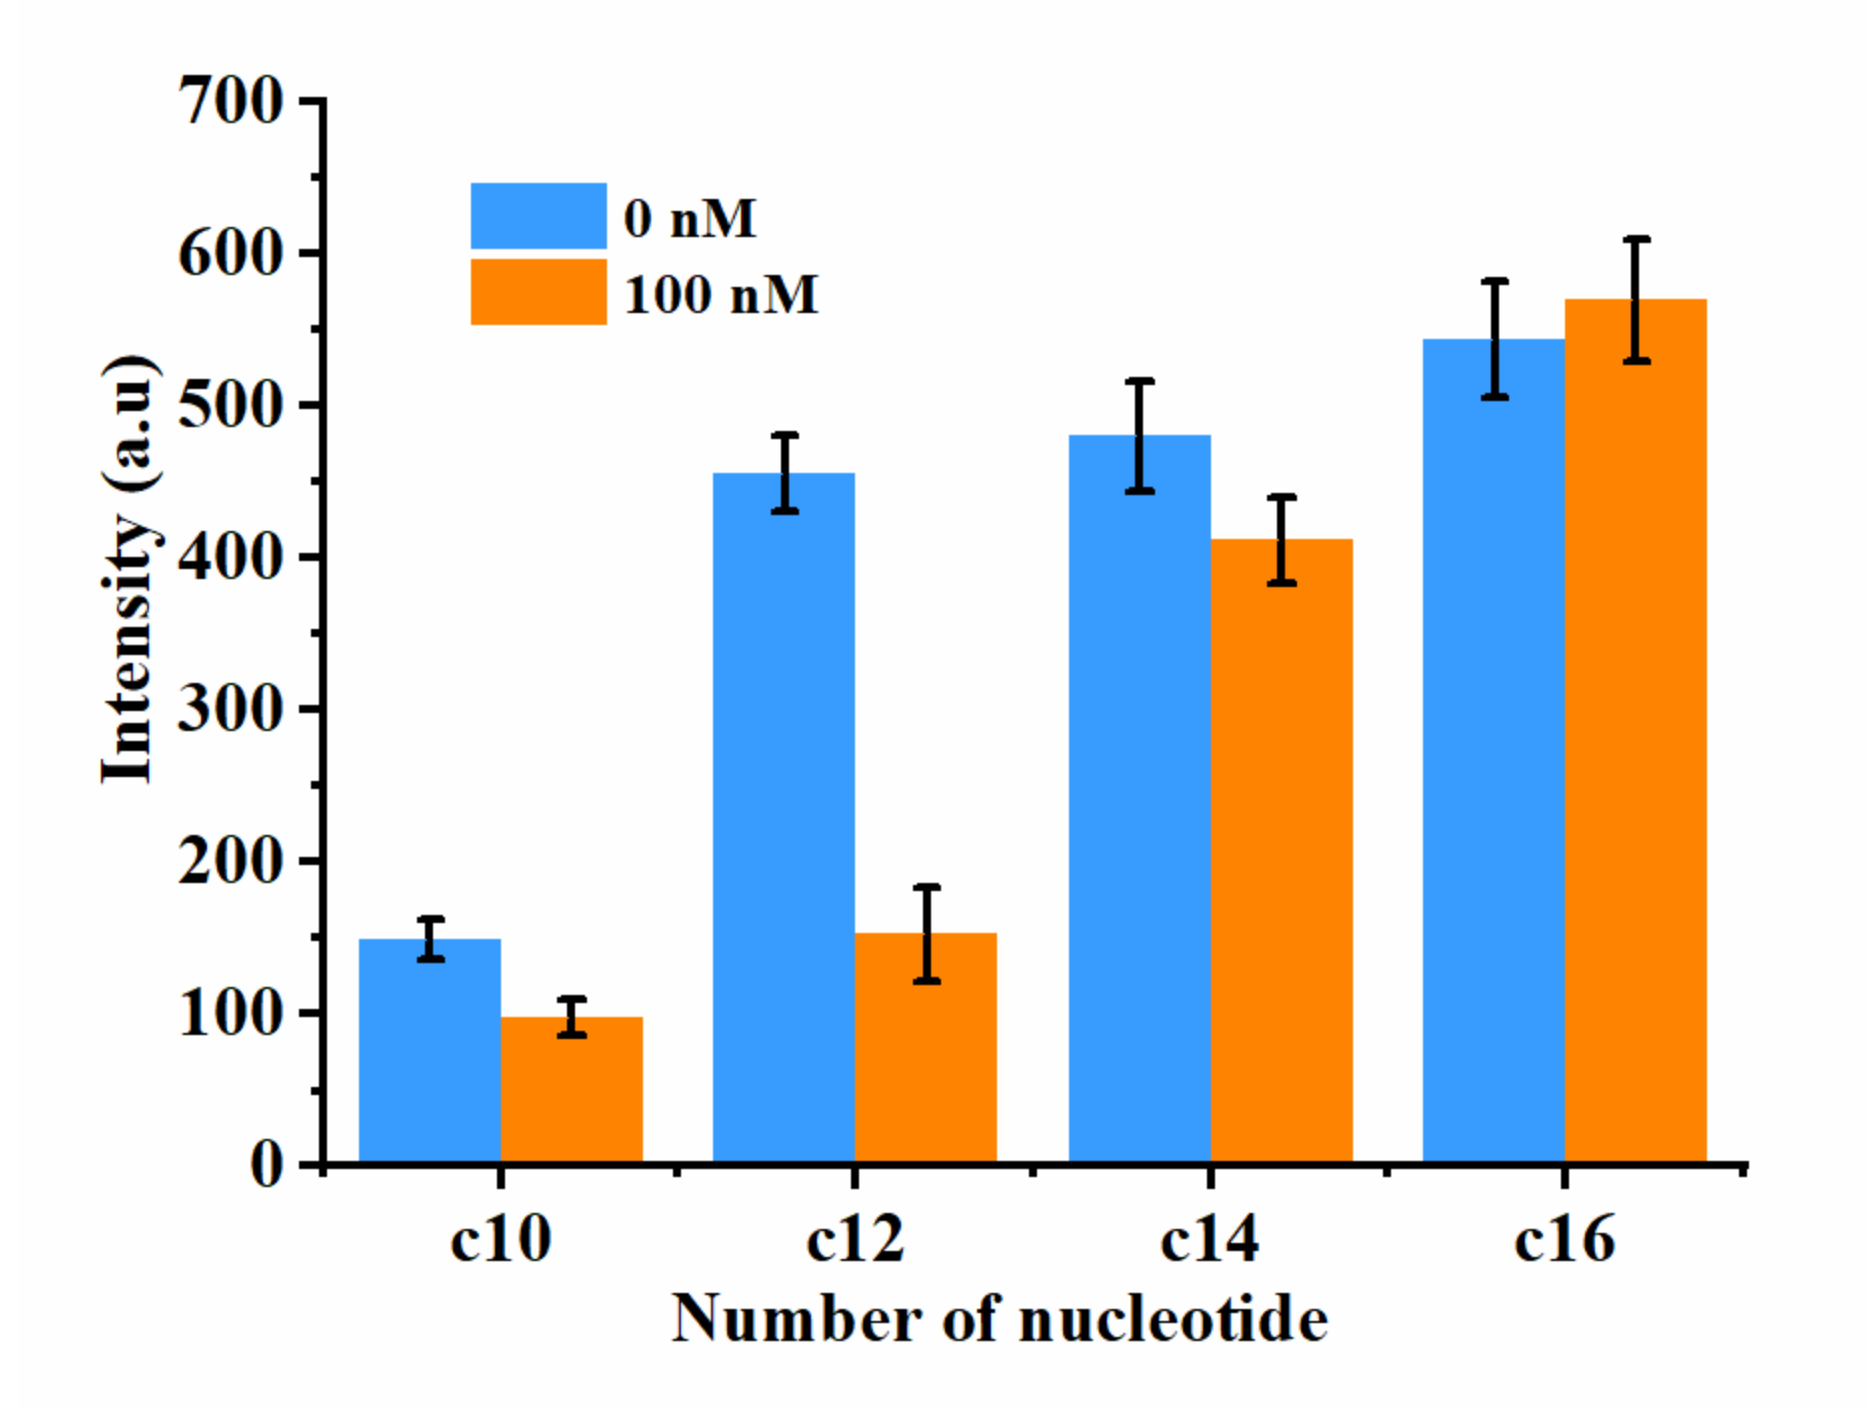
2.2. Optimization of cDNA Length

The affinity of the cDNA and aptamer is a vital factor for the competition of cDNA and AFB1 to bind to the aptamer, which differs depending on the length of the cDNA [32,33,34,35,36]. For this reason, we optimized the length of cDNA, ranging from 10 to 16 nucleotides.
As shown in Figure 1, with the increase in cDNA length (n), both blank samples and AFB1 samples (100 nM) showed an increasing fluorescence intensity, which resulted from stronger hybridized double-stranded DNA between the cDNA with a longer length and aptamer. The biggest fluorescence intensity change induced by AFB1 was obtained when cDNA with 12 nucleotides (12-cDNA). The results indicate that cDNA with more than 12 nucleotides is not in favor of the competition of AFB1. Thus, 12-cDNA was selected as the complementary strand for the subsequent tests.

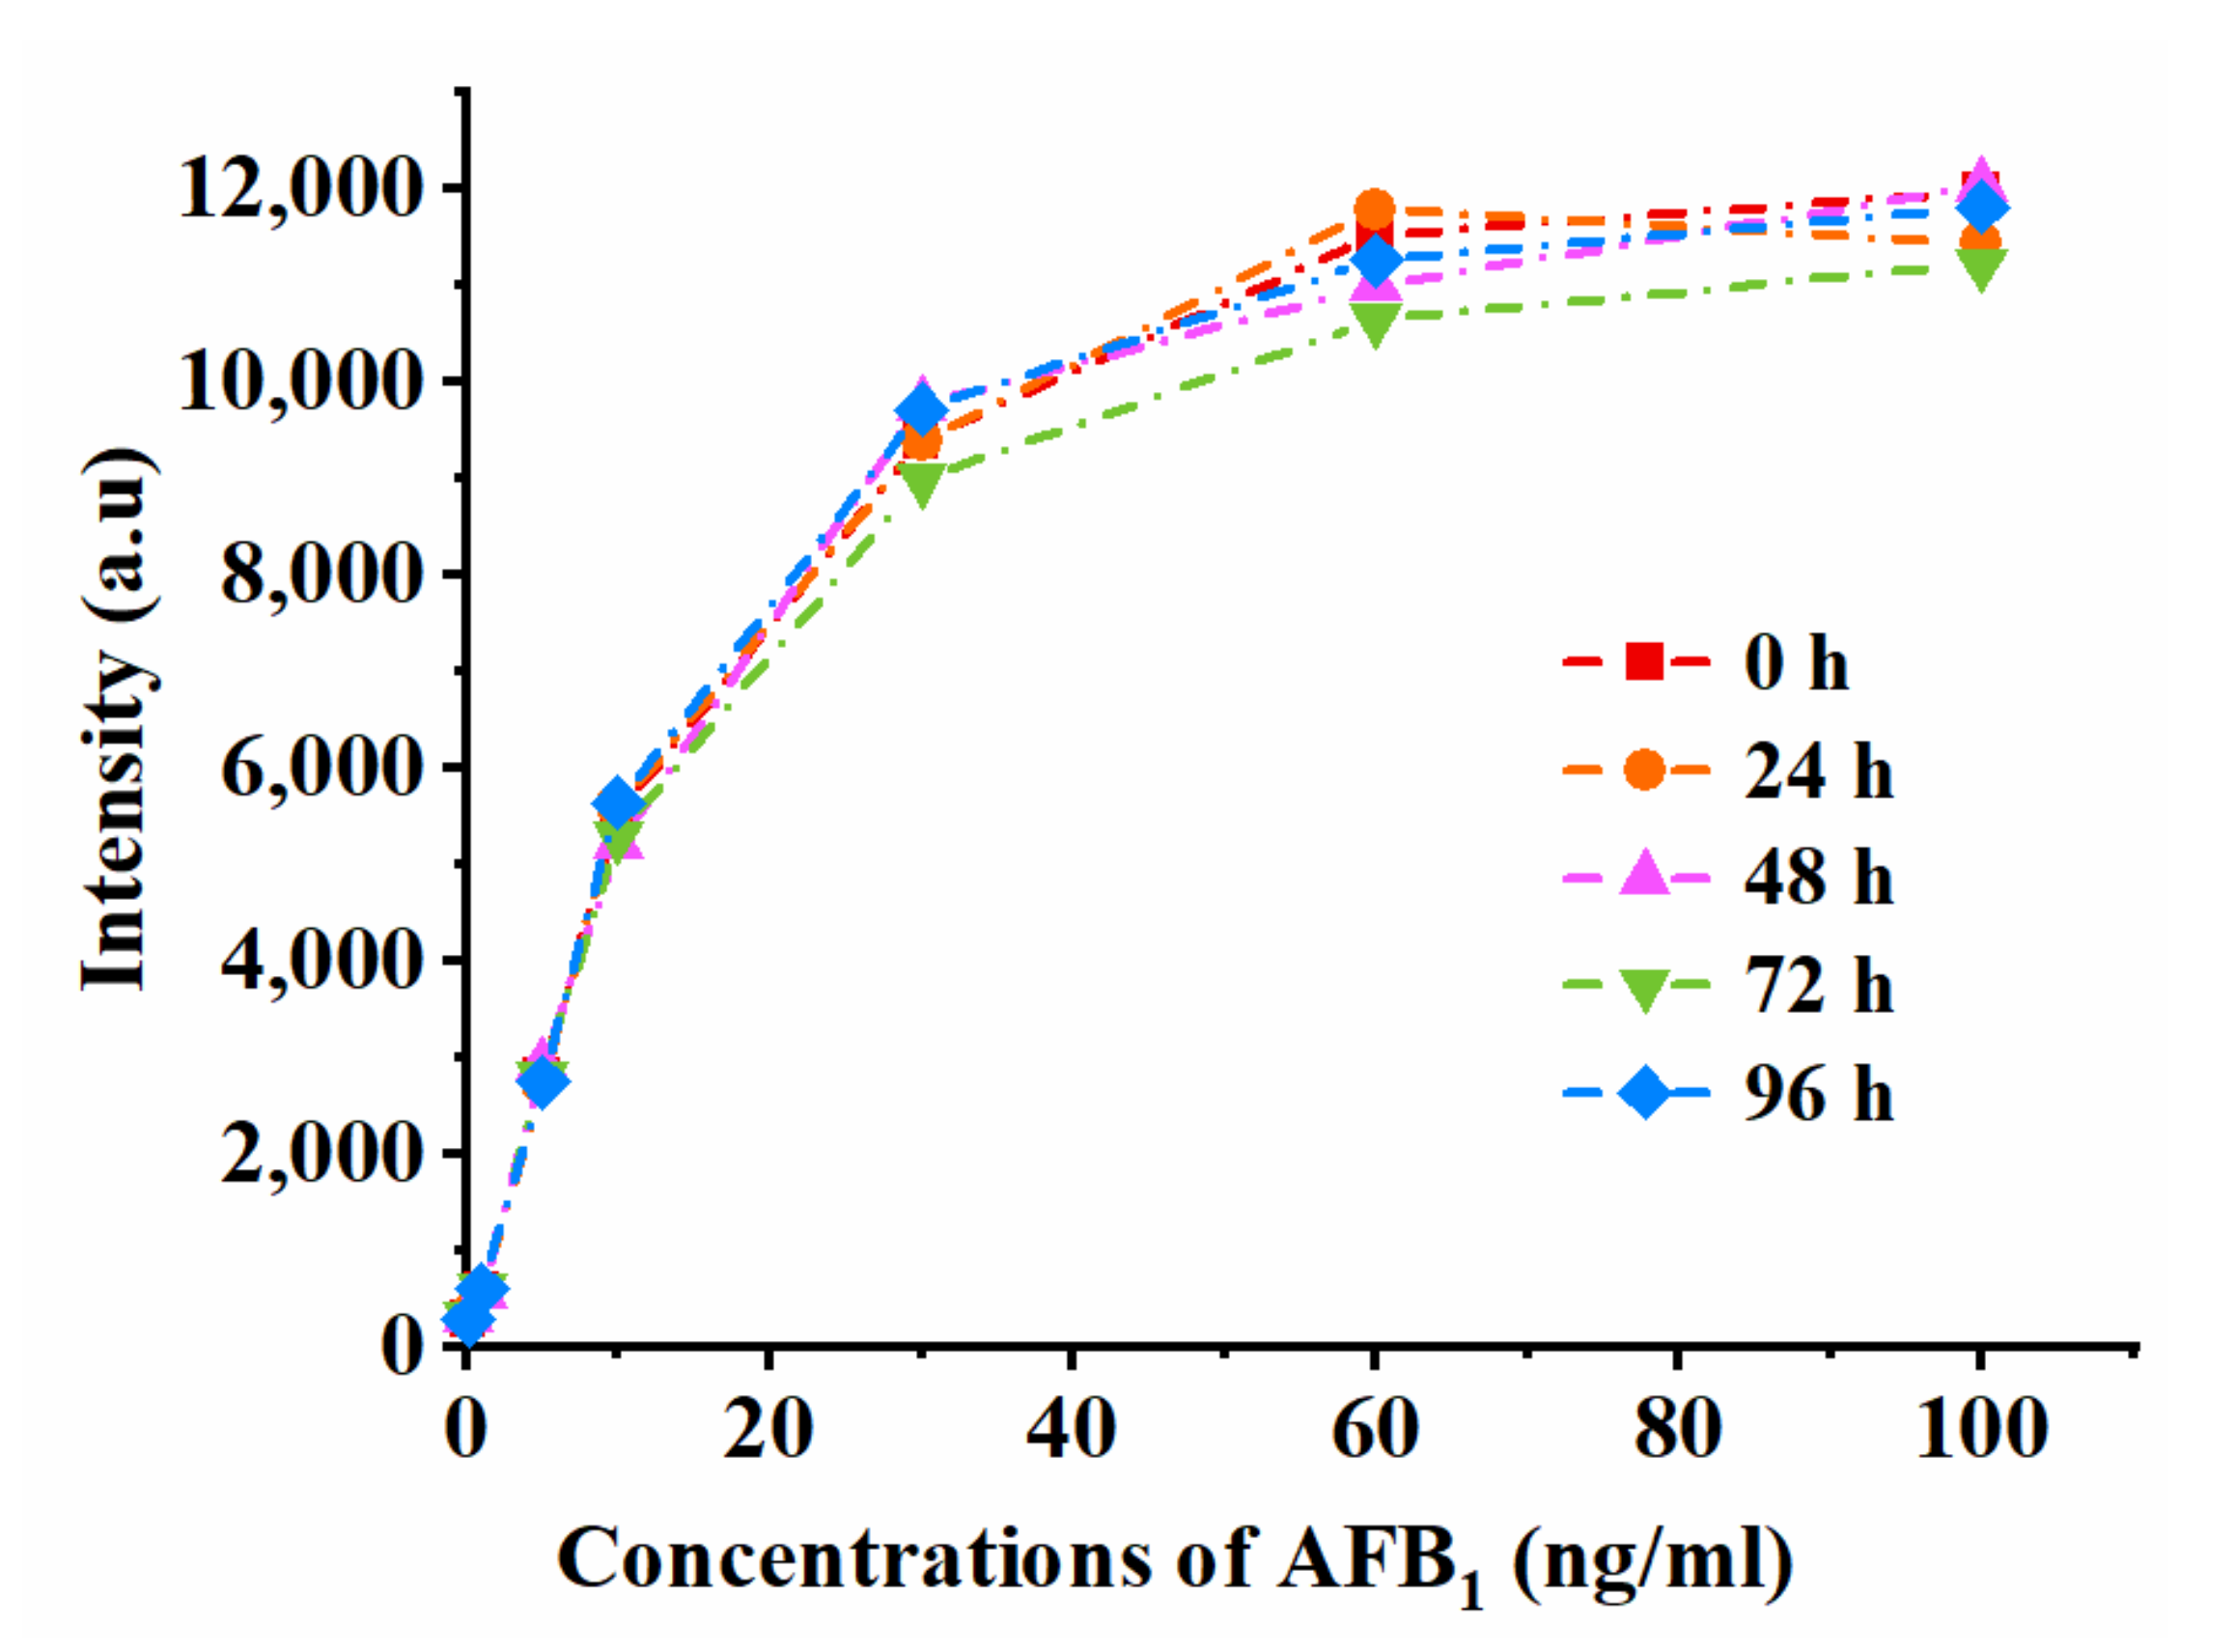
2.3. Analytical Performance of the Apt-Strip

To verify the feasibility of the Apt-strip for the detection of AFB1, different concentrations of AFB1 (0, 0.1, 1, 5, 10, 30, 60, and 100 ng/mL) were analyzed using the Apt-strip. Buffer C containing10 mM Tris-HCl (pH 7.4), 50 mM NaCl, 10 mM MgCl2, and 10% methanol was used as the assay buffer.
As shown in Figure 2a, there was no fluorescence signal at the T-line for the blank sample, and the fluorescence signal appeared when the AFB1 concentration was 0.1 ng/mL. Then, the fluorescence intensity gradually increased with the increase in AFB1 concentration, and the fluorescence intensity reached the highest when the AFB1 concentration was 100 ng/mL. The calibration curve (Figure 2c) was constructed using fluorescence intensity (Y) against the concentrations of AFB1 (X). The fitted equation was Y = 11,891 − 11,751 × exp (−0.05X) with a reliable correlation coefficient (R2 = 0.9864), and the dynamic range of AFB1 was from 0.1 ng/mL to 100 ng/mL. The DL for the qualitative evaluation was defined as the minimum concentration when displaying a very weak fluorescence intensity at the T-line, compared with a blank sample [37]. Therefore, the DL was less than 0.1 ng/mL, which was comparable to the value previously reported using other antibody or other aptamer-based LFA (Table 1). In addition, the DL was less than the minimum allowable limit of AFB1 (Table S1) set by different countries and regions. Therefore, the Apt-strip could meet the various screening requirements of AFB1. It is noteworthy that compared with other strips for AFB1 detection, the Apt-strip showed a positive readout, which means the fluorescence signal increased with the increase in AFB1 concentration. This positive readout method is more convenient and sensitive for qualitative analysis, especially for the analysis of samples containing very small amounts of AFB1. To the best of our knowledge, no AFB1 detection method has been reported by positive readout strips, and this strategy is the first report of positive readout test strips for AFB1 detection.
To assess the precision and accuracy of the prepared Apt-strip, we chose spiked samples of corn and wheat as the food matrixes. All of the food samples were first analyzed by the HPLC-FLD method to ensure there was no contamination of AFB1.
First, we accurately weighed 5 g of the sample into a 50 mL PP tube. Then, we added the appropriate amount of different concentrations of the AFB1 standard solution. The spiked samples were processed as in Section 3.6. The extracts were analyzed using the Apt-strip. Experimental results in Table 2 indicate that the recoveries were in the range of 50.0–97.0% for AFB1 with relative standard deviations (RSDs) less than 36.7%, and were acceptable within the requirements of No. 401/2006 [7]. These results suggest that the Apt-strip developed in this study can be used for the quantitative and qualitative detection of AFB1 in real samples.
To verify the specificity of the Apt-strip for AFB1, we tested several mycotoxins, including OTA, AFG1, AFG2, ZAE, and the mixture of AFB1 with the above mycotoxins together. AFB1 and other mycotoxins were all tested at 50 ng/mL. The results are shown in Figure 3. The tested mycotoxins did not cause a significant increase in intensity (Figure 3b), while AFB1 induced a clear fluorescence spot (Figure 3a). The mixture of these mycotoxins with AFB1 presented a similar fluorescence spot as for the AFB1 sample. The results indicate that the Apt-strip had a good selectivity for AFB1 detection.
To evaluate the stability of the Apt-strip, stability experiments over time were carried out. Apt-strips of the same batch were placed in foil pouches with a desiccant, and were stored at room temperature for 90 days. Then, the strips were used to detect different concentrations of AFB1 (0, 0.1, 1, 5, 10, 30, 60, and 100 ng/mL), and the detection was performed once every 24 h. The Apt-strip assayed different concentrations of AFB1, and the RSDs were all less than 5.3% (Table 3), indicating that the repeatability of the Apt-strip remained consistent. Trend plots with a 24 h interval (Figure 4) show that there was no change in trend over time. These results show that the performance of the Apt-strip remained stable after 90 days of storage at room temperature.

2.4. Detection of AFB1 in Real Samples

To evaluate the practicability of the Apt-strip in real samples, 25 batches real samples were analyzed using the Apt-strip and HPLC-FLD. First, 25 batches of real samples, composed of 13 corn, 6 wheat, and 6 sorghum, were collected from Changzhi City, Shanxi Province, China. Table 4 shows that 11 out of 25 samples were found to have AFB1. The residual level of AFB1 ranged from 2.4 ± 0.7 µg/kg to 75.3 ± 5.3 µg/kg. All the samples were confirmed by HPLC-FLD analysis. The results of the Apt-strip were not false-positive or false-negative. Figure 5 indicates that the two methods yielded consistent results with a good correlation (R2 = 0.9938). The above results demonstrate that the Apt-strip is reliable and accurate for thepractical qualitative and quantitative detection of AFB1 in real samples, and is a portable tool for the on-site detection of AFB1.

3. Materials and Methods

3.1. Reagents and Materials

AFB1, aflatoxin G1 (AFG1), aflatoxin G2 (AFG2), zearalenone (ZEN), and ochratoxin A (OTA) were purchased from Aladdin (Shanghai) Co., Ltd. (Shanghai, China). First, 96-Microwell plates (flat bottom) were purchased from Thermo Fisher Scientific Inc. (Shanghai, China). The nitrocellulose (NC) membrane, sample pad, conjugate pad, absorbent pad, and PVC backing were purchased from Shanghai Jieyi Biotechnology Co., Ltd. (Shanghai, China). All of the other reagents were purchased from Sangon Biotech (Shanghai) Co., Ltd. (Shanghai, China).

3.2. Aptamer and DNA Probes

The aptamer sequence was referenced from our previously published paper [44]. The complementary DNA (cDNA) of the aptamer was designed for the development of LFA. Aptamer and cDNA were ordered from Sangon Biotechnology Co., Ltd. (Shanghai, China), and the sequences are listed in Table 5. A35 had one biotin label at the 3’ terminus and a TEG (triethylene glycol) linker. The cDNA each had one 6-FAM label at the 3’ terminus.

3.3. Preparation of A35-Apt Coated Microplates

The A35-Apt was coated on the surface of 96-well black microplates by the following steps. Firstly, 100 μL of streptavidin (SA, 10 μg/mL) in 0.1 M Na2CO3 solution (pH 9.6) was added into the wells of the microplates and they were incubated overnight at 4 °C. Then, after washing three times with 150 μL of buffer A (10 mM Tris-HCl (pH 7.5), 150 mM NaCl, and 0.1% Tween 20), the wells of the microplate were bound with 200 μL of buffer A containing 10 mg/mL BSA at 25 °C for 2 h under shaking. The wells were washed with 250 μL of buffer A. Next, 100 μL of buffer A containing 25 nM biotinylated A35-Apt was added to the SA coated wells, and the mixture was incubated for 1 h at 25 °C under shaking. Finally, the wells were washed three times with 200 μL of buffer B (10 mM Tris-HCl (pH 7.5), 10 mM MgCl2, and 50 mM NaCl), and the A35-Apt coated microplate was ready for the analysis of targets.

3.4. Optimization Procedure of cDNA Length

The optimization was as follows. Firstly, 100 μL of buffer B containing 100 nM AFB1 was added to each of the four wells of the A35-Apt coated microplates, and 100 μL of 20 nM n-cDNA (n = 10, 12, 14, and 16) was added sequentially. Secondly, the mixtures were incubated for 10 min at room temperature, and the wells were washed three times with buffer B. Thirdly, 100 μL of buffer B was added sequentially to the four wells, and the fluorescence intensity was measured using a multifunctional enzyme marker (Infinite M Plex, λex/em = 495/517 nm). Meanwhile, buffer B without AFB1 (AFB1 0 nM) was used as a control.

3.5. Manufacture of the Apt-Strip

The structure of the Apt-strip is shown in Scheme 1a. Firstly, an NC membrane was treated with a streptavidin labeled aptamer against AFB1 (A35-Apt-SA, 30 μM, 0.5 μL/cm) for T-line, and a conjugate pad was treated with cDNA (2 μM, 5 μL/cm). Then, the treated NC membrane and conjugate pad were dried at 37 °C for 20 min. Secondly, the test strips were assembled according to Scheme 1a, and the joints overlapped by 2 mm. Thirdly, the strip was cut into 4 mm wide test strips and stored in a desiccator at room temperature until use. In our experiments, we omitted the preparation of the control line (C-line) because it is very simple and always effective in actual operation [43]. Note that the final Apt-strip design would include a control line.

3.6. Assay Procedure of AFB1 in Food Samples

The food samples were prepared according to the procedure described in GB 5009.22-2016 of China. Briefly, solid samples of food were ground, weighed (5 g), and transferred into a 50 mL PP tube, and then extracted with 20 mL methanol/water (70:30, v/v) by homogenizing for 5 min, followed by centrifugation at 5000 r/min for 5 min at 4 °C. The supernatant was collected and diluted seven times with buffer B to obtain a sample solution.
The procedure for determining AFB1 using Apt-strip is as follows. Forst, 2 μL of AFB1-Apt (2 μM) and 50 μL of the sample solution were mixed in a PP tube and incubated at 25 ° C for 5 min, and then the mixture was placed on the Apt-strip. After 10 min, the results were observed by the ChemiDocTM MP system. Then, the fluorescence intensity at the T-line was scanned with Image J software to achieve a quantitative analysis of the assay results. All of the assays were repeated three times.

3.7. HPLC-FLD Confirmation

The reliability and practicability of the Apt-strip was further confirmed by HPLC-FLD analysis using the retention time and chromatographic peak area of AFB1 as the basic parameters. The specific analytical conditions are listed in the supporting information (HPLC-FLD conditions).

4. Conclusions

In this paper, we report a positive readout Apt-strip for the detection of AFB1 in food. We used competition between AFB1 and FAM-cDNA to bind the limited AFB1-Apt and free FAM-cDNA hybridized to A35-Apt at the T-line, and detected AFB1 indirectly by measuring the fluorescence intensity at the T-line. The DL of this method was 0.1 ng/mL for AFB1 in buffer and 0.3 ng/g in food, with a dynamic range of 0.1–100 ng/mL in the buffer and an R2 of 0.9864. The sensitivity and selectivity were very satisfactory. The validation results on the spiked samples and real samples show that the method is dependable. In addition, the Apt-strips are low-cost, and the detection process does not require specialized technicians and it can be used as a rapid scanning tool for food industries or regulatory laboratories. This work is expected to provide new insight into the detection of other food contaminants.

Supplementary Materials

The following supporting information can be downloaded at: https://www.mdpi.com/article/10.3390/molecules27154949/s1, Table S1: The maximum tolerable limit of AFB1 in feed and food set by different countries; HPLC-FLD conditions.

Author Contributions

K.S. and X.H. contributed equally to this work. Conceptualization, K.S.; data curation, X.H.; formal analysis, X.H.; funding acquisition, K.S. and L.S.; methodology, K.S.; project administration, J.Y.; writing—original draft, K.S. and X.H.; writing—review and editing, L.S. and C.H. All authors have read and agreed to the published version of the manuscript.

Funding

This research was funded by the Scientific and Technological Innovation Programs of the Higher Education Institutions in Shanxi (no. 2020L0380 and no. 2020L0372), and the key disciplines Foundation of the Department of Preventive Medicine, Changzhi Medical College (no. 2020YFXK001).

Institutional Review Board Statement

Not applicable.

Informed Consent Statement

Not applicable.

Data Availability Statement

Not applicable.

Acknowledgments

The authors would like to thank the technical support provided by the central Laboratory of Changzhi Medical College.

Conflicts of Interest

The authors declare no conflict of interest. The funders had no role in the design of the study; in the collection, analyses, or interpretation of data; in the writing of the manuscript; or in the decision to publish the results.

References

  1. Liu, Z.; Jiang, J.; Li, M.; Yuan, D.; Nie, C.; Sun, Y.; Zheng, P. Identification of Moldy Peanuts under Different Varieties and Moisture Content Using Hyperspectral Imaging and Data Augmentation Technologies. Foods 2022, 11, 1156. [Google Scholar] [CrossRef]
  2. Beitollahi, H.; Tajik, S.; Dourandish, Z.; Zhang, K.; Le, Q.V.; Jang, H.W.; Kim, S.Y.; Shokouhimehr, M. Recent Advances in the Aptamer-Based Electrochemical Biosensors for Detecting Aflatoxin B1 and Its Pertinent Metabolite Aflatoxin M1. Sensors 2020, 20, 3256. [Google Scholar] [CrossRef] [PubMed]
  3. Wang, Q.; Yang, Q.; Wu, W. Progress on Structured Biosensors for Monitoring Aflatoxin B1 From Biofilms: A Review. Front. Microbial. 2020, 11, 408. [Google Scholar] [CrossRef] [PubMed]
  4. Zhang, K.; Banerjee, K. A Review: Sample Preparation and Chromatographic Technologies for Detection of Aflatoxins in Foods. Toxins 2020, 12, 539. [Google Scholar] [CrossRef]
  5. Lee, S.; Kim, G.; Moon, J. Performance Improvement of the One-Dot Lateral Flow Immunoassay for Aflatoxin B1 by Using a Smartphone-Based Reading System. Sensors 2013, 13, 5109–5116. [Google Scholar] [CrossRef] [PubMed] [Green Version]
  6. Xie, L.; Chen, M.; Ying, Y. Development of Methods for Determination of Aflatoxins. Crit. Rev. Food Sci. Nutr. 2016, 56, 2642–2664. [Google Scholar] [CrossRef]
  7. Commission, E. Commission Regulation (EC) No 401/2006 of 23 February 2006 laying down the methods of sampling and analysis for the official control of the levels of mycotoxins in foodstuffs. Off. J. Eur. Union 2006, 70, 12–34. [Google Scholar]
  8. Wang, S.; Quan, Y.; Lee, N.; Kennedy, I.R. Rapid determination of fumonisin B1 in food samples by enzyme-linked immunosorbent assay and colloidal gold immunoassay. J. Agric. Food Chem. 2006, 54, 2491–2495. [Google Scholar] [CrossRef]
  9. Yu, S.; He, L.; Yu, F.; Liu, L.; Qu, C.; Qu, L.; Liu, J.; Wu, Y.; Wu, Y. A lateral flow assay for simultaneous detection of Deoxynivalenol, Fumonisin B1 and Aflatoxin B1. Toxicon 2018, 156, 23–27. [Google Scholar] [CrossRef]
  10. Zhao, X.; Jin, X.; Lin, Z.; Guo, Q.; Liu, B.; Yuan, Y.; Yue, T.; Zhao, X. Simultaneous Rapid Detection of Aflatoxin B1 and Ochratoxin A in Spices Using Lateral Flow Immuno-Chromatographic Assay. Foods 2021, 10, 2738. [Google Scholar] [CrossRef]
  11. Bu, T.; Bai, F.; Sun, X.; Tian, Y.; Zhang, M.; Zhao, S.; He, K.; Wang, X.; Jia, P.; Wang, L. An innovative prussian blue nanocubes decomposition-assisted signal amplification strategy suitable for competitive lateral flow immunoassay to sensitively detect aflatoxin B1. Food Chem. 2021, 344, 128711. [Google Scholar] [CrossRef]
  12. Yu, L.; Li, P.; Ding, X.; Zhang, Q. Graphene oxide and carboxylated graphene oxide: Viable two-dimensional nanolabels for lateral flow immunoassays. Talanta 2017, 165, 167–175. [Google Scholar] [CrossRef] [PubMed]
  13. Koczula, K.M.; Gallotta, A. Lateral flow assays. Essays Biochem. 2016, 60, 111–120. [Google Scholar]
  14. Ngom, B.; Guo, Y.; Wang, X.; Bi, D. Development and application of lateral flow test strip technology for detection of infectious agents and chemical contaminants: A review. Anal. Bioanal. Chem. 2010, 397, 1113–1135. [Google Scholar] [CrossRef] [PubMed]
  15. Bahadır, E.B.; Sezgintürk, M.K. Lateral flow assays: Principles, designs and labels. TRAC-Trend. Anal. Chem. 2016, 82, 286–306. [Google Scholar] [CrossRef]
  16. Focker, M.; van der Fels-Klerx, H.J.; Oude Lansink, A. Cost-Effective Sampling and Analysis for Mycotoxins in a Cereal Batch. Risk Anal. 2019, 39, 926–939. [Google Scholar] [CrossRef] [PubMed]
  17. Delmulle, B.S.; De Saeger, S.M.; Sibanda, L.; Barna-Vetro, I.; Van Peteghem, C.H. Development of an immunoassay-based lateral flow dipstick for the rapid detection of aflatoxin B1 in pig feed. J. Agric. Food Chem. 2005, 53, 3364–3368. [Google Scholar] [CrossRef]
  18. Masinde, L.J.A.; Sheng, W.; Xu, X.; Zhang, Y.; Yuan, M.; Kennedy, I.R.; Wang, S. Colloidal gold based immunochromatographic strip for the simple and sensitive determination of aflatoxin B1 and B2 in corn and rice. Microchim. Acta 2013, 180, 921–928. [Google Scholar] [CrossRef]
  19. Sojinrin, T.; Liu, K.; Wang, K.; Cui, D.; JByrne, H.; Curtin, J.F.; Tian, F. Developing Gold Nanoparticles-Conjugated Aflatoxin B1 Antifungal Strips. Int. J. Mol. Sci. 2019, 20, 6260. [Google Scholar] [CrossRef] [PubMed] [Green Version]
  20. Zhang, D.; Li, P.; Zhang, Q.; Li, R.; Zhang, W.; Ding, X.; Li, C.M. A naked-eye based strategy for semiquantitative immunochromatographic assay. Anal. Chim. Acta 2012, 740, 74–79. [Google Scholar] [CrossRef] [PubMed]
  21. Ren, M.; Xu, H.; Huang, X.; Kuang, M.; Xiong, Y.; Xu, H.; Xu, Y.; Chen, H.; Wang, A. Immunochromatographic assay for ultrasensitive detection of aflatoxin B₁ in maize by highly luminescent quantum dot beads. ACS Appl. Mater. Interfaces 2014, 6, 14215–14222. [Google Scholar] [CrossRef] [PubMed] [Green Version]
  22. Li, J.; Mao, M.; Wu, F.; Li, Q.; Wei, L.; Ma, L. Amino-functionalized CdSe/ZnS quantum dot-based lateral flow immunoassay for sensitive detection of aflatoxin B1. Anal. Methods 2018, 10, 3582–3588. [Google Scholar] [CrossRef]
  23. Jia, B.; Liao, X.; Sun, C.; Fang, L.; Zhou, L.; Kong, W. Development of a quantum dot nanobead-based fluorescent strip immunosensor for on-site detection of aflatoxin B1 in lotus seeds. Food Chem. 2021, 356, 129614. [Google Scholar] [CrossRef]
  24. Shao, Y.; Duan, H.; Guo, L.; Leng, Y.; Lai, W.; Xiong, Y. Quantum dot nanobead-based multiplexed immunochromatographic assay for simultaneous detection of aflatoxin B1 and zearalenone. Anal. Chim. Acta 2018, 1025, 163–171. [Google Scholar] [CrossRef]
  25. Li, R.; Meng, C.; Wen, Y.; Fu, W.; He, P. Fluorometric lateral flow immunoassay for simultaneous determination of three mycotoxins (aflatoxin B1, zearalenone and deoxynivalenol) using quantum dot microbeads. Mikrochim. Acta 2019, 186, 748. [Google Scholar] [CrossRef] [PubMed]
  26. Li, S.; Zhong, X.; Xu, Y.; Zheng, Y.; Shi, X.; Li, F.; Guo, S.; Yang, J. Smartphone-based reading system integrated with phycocyanin-enhanced latex nanospheres immunoassay for on-site determination of aflatoxin B1 in foodstuffs. Food Chem. 2021, 360, 130019. [Google Scholar] [CrossRef] [PubMed]
  27. Liu, D.; Huang, Y.; Chen, M.; Wang, S.; Liu, K.; Lai, W. Rapid detection method for aflatoxin B1 in soybean sauce based on fluorescent microspheres probe. Food Control 2015, 50, 659–662. [Google Scholar] [CrossRef]
  28. Zhao, Z.; Wang, H.; Zhai, W.; Feng, X.; Fan, X.; Chen, A.; Wang, M. A Lateral Flow Strip Based on a Truncated Aptamer-Complementary Strand for Detection of Type-B Aflatoxins in Nuts and Dried Figs. Toxins 2020, 12, 136. [Google Scholar] [CrossRef] [Green Version]
  29. Vijitvarasan, P.; Cheunkar, S.; Oaew, S. A point-of-use lateral flow aptasensor for naked-eye detection of aflatoxin B1. Food Control 2022, 134, 108767. [Google Scholar] [CrossRef]
  30. Mukherjee, M.; Bhatt, P.; Manonmani, H.K. Fluorescent competitive aptasensor for detection of aflatoxin B1. J. Mol. Recognit. 2017, 30, 2650. [Google Scholar] [CrossRef] [PubMed]
  31. Vanrell, L.; Gonzalez-Techera, A.; Hammock, B.D.; Gonzalez-Sapienza, G. Nanopeptamers for the development of small-analyte lateral flow tests with a positive readout. Anal. Chem. 2013, 85, 1177–1182. [Google Scholar] [CrossRef] [Green Version]
  32. Xia, X.; Wang, Y.; Yang, H.; Dong, Y.; Zhang, K.; Lu, Y.; Deng, R.; He, Q. Enzyme-free amplified and ultrafast detection of aflatoxin B1 using dual-terminal proximity aptamer probes. Food Chem. 2019, 283, 32–38. [Google Scholar] [CrossRef] [PubMed]
  33. Wang, C.; Li, Y.; Zhao, Q. A signal-on electrochemical aptasensor for rapid detection of aflatoxin B1 based on competition with complementary DNA. Biosens. Bioelectron. 2019, 144, 111641. [Google Scholar] [CrossRef] [PubMed]
  34. Nutiu, R.; Li, Y. Structure-switching signaling aptamers. J. Am. Chem. Soc. 2003, 125, 4771. [Google Scholar] [CrossRef] [PubMed]
  35. Li, Y.; Sun, L.; Zhao, Q. Development of aptamer fluorescent switch assay for aflatoxin B1 by using fluorescein-labeled aptamer and black hole quencher 1-labeled complementary DNA. Anal. Bioanal. Chem. 2018, 410, 6269–6277. [Google Scholar] [CrossRef] [PubMed]
  36. Nutiu, R.; Li, Y. Structure-switching signaling aptamers: Transducing molecular recognition into fluorescence signaling. Chemistry 2004, 10, 1868–1876. [Google Scholar] [CrossRef] [PubMed]
  37. Song, S.; Liu, N.; Zhao, Z.; Ediage, E.; Wu, S.; Sun, C.; De Saeger, S.; Wu, A. Multiplex Lateral Flow Immunoassay for Mycotoxin Determination. Anal. Chem. 2014, 86, 4995–5001. [Google Scholar] [CrossRef]
  38. Wang, D.; Zhu, J.; Zhang, Z.; Zhang, Q.; Zhang, W.; Yu, L.; Jiang, J.; Chen, X.; Wang, X.; Li, P. Simultaneous Lateral Flow Immunoassay for Multi-Class Chemical Contaminants in Maize and Peanut with One-Stop Sample Preparation. Toxins 2019, 11, 56. [Google Scholar] [CrossRef] [PubMed] [Green Version]
  39. Chen, Y.; Chen, Q.; Han, M.; Zhou, J.; Gong, L.; Niu, Y.; Zhang, Y.; He, L.; Zhang, L. Development and optimization of a multiplex lateral flow immunoassay for the simultaneous determination of three mycotoxins in corn, rice and peanut. Food Chem. 2016, 213, 478–484. [Google Scholar] [CrossRef]
  40. Cai, X.; Liang, M.; Ma, F.; Zhang, Z.; Tang, X.; Jiang, J.; Guo, C.; Ramzy Mohamed, S.; Abdel Goda, A.; Dawood, D.H.; et al. Nanozyme-strip based on MnO2 nanosheets as a catalytic label for multi-scale detection of aflatoxin B1 with an ultrabroad working range. Food Chem. 2022, 377, 131965. [Google Scholar] [CrossRef]
  41. Zhu, C.; Zhang, G.L.; Huang, Y.F.; Yang, S.M.; Ren, S.Y.; Gao, Z.X.; Chen, A.L. Dual-competitive lateral flow aptasensor for detection of aflatoxin B1 in food and feedstuffs. J. Hazard. Mater. 2018, 344, 249–257. [Google Scholar] [CrossRef] [PubMed]
  42. Shim, W.B.; Kim, M.J.; Mun, H.; Kim, M.G. An aptamer-based dipstick assay for the rapid and simple detection of aflatoxin B1. Biosens. Bioelectron. 2014, 62, 288–294. [Google Scholar] [CrossRef]
  43. Zhang, S.; Zhao, S.; Wang, S.; Liu, J.H.; Dong, Y.Y. Development of Lateral Flow Immunochromatographic Strips for Micropollutant Screening Using Colorants of Aptamer-Functionalized Nanogold Particles, Part II: Experimental Verification with Aflatoxin B1 and Chloramphenicol. J. AOAC Int. 2018, 101, 1408–1414. [Google Scholar] [CrossRef]
  44. Li, Y.; Sun, L.; Zhao, Q. Aptamer-Structure Switch Coupled with Horseradish Peroxidase Labeling on a Microplate for the Sensitive Detection of Small Molecules. Anal. Chem. 2019, 91, 2615–2619. [Google Scholar] [CrossRef] [PubMed]
Scheme 1. (a) Schematic diagram of the Apt-strip analytical device. (b) Working principle and detection procedures of the Apt-strip for AFB1 detection.
Molecules 27 04949 sch001
Figure 1. Effects of n-cDNA on the fluorescence intensity of the A35-apt coupled with FAM labeling in the absence (0 nM) or presence (100 nM) of AFB1.
Molecules 27 04949 g001
Figure 2. (a) Images of Apt-strips after the assay procedures. The numbers below the strips are the standard concentrations of AFB1 (ng/mL). (b) Fluorescence intensity at the detection line of Apt-strips identified by image J. (c) The calibration curve for the quantitation of AFB1 using fluorescence intensity versus the concentration of AFB1. Error bars are based on three duplicate measurements of different AFB1 concentrations.
Molecules 27 04949 g002
Figure 3. Specificity verification of the Apt-strip by comparing AFB1 (50 ng/mL) and four other mycotoxins (50 ng/mL). (a) Images of the results of the Apt-strip assaying various toxins. (b) Comparison of intensity of various toxins detected using Apt-strip. From left to right: (1) blank; (2) AFB1; (3) OTA; (4) AFG1; (5) AFG2; (6) ZEN; (7) mixture of AFB1 and other four mycotoxins.
Molecules 27 04949 g003
Figure 4. Trend plots of the response values of the Apt-strip to different concentrations of AFB1 with a 24 h interval.
Molecules 27 04949 g004
Figure 5. Correlation between Apt-strip and HPLC-FLD for the quantification of AFB1 in real samples (n = 3).
Molecules 27 04949 g005
Table 1. Comparison of the Apt-strip in this study with other methods for AFB1 detection based on LFA.
TypeT-lineProbesSignal ReadoutDLSignal ReaderRef.
Antibody-stripAFB1-BSAcolloidal gold-mAbnegative5 μg/kgStrip reader[5]
Antibody-stripAFB1-BSAQB-mAbsnegative1 ng/mLA fluorescent
reader
[23]
Antibody-stripAFB1-BSAmAb@Eu-
nanosphere
negative0.16 μg/kgFluorescent
strip reader
[38]
Antibody-stripAFB1-BSAAb-GNPsnegative0.1 μg/kgStrip reader[39]
Antibody-stripAFB1–OVAgold-labeled
antibody
negative5 μg/kgICheck-III card
reader
[10]
Nanozyme-stripAFB1-BSAMnO2NSs-mAbnegative15 pg/mLSmart phone[40]
Aptamer-stripAFB1-BSACy5-Aptamernegative0.1 μg/kgFluorescent strip
reader
[41]
Aptamer-stripDNA single strandCy5-Aptamernegative0.16 μg/kgThe portable
multi-target reader
[28]
Aptamer-stripSACy5-Aptamernegative0.1 ng/mLChemiDocTM MP
System
[42]
Aptamer-stripbio-DNA
probe-SA
NGPs-Aptamernegative0.5 μg/mLStrip reader[43]
5 μg/mLNaked eye
Aptamer-stripDNA single strandFAM-AptamerPositive<0.1 ng/mLChemiDocTM MP
System
This work
Table 2. Recovery results of spiked samples using the Apt-strip.
SampleAFB1 spiked
(ng/g)
Detected
(ng/g)
Recovery
(%)
RSD
(%)
Corn10.5 a50.036.7
32.996.78.7
109.797.06.1
Wheat10.550.021.7
32.583.38.4
109.696.07.3
a Take three parallel samples. Each sample was measured three times, and the average value was used for data processing.
Table 3. Stability results of the different concentrations of AFB1 using Apt-strip (n = 5).
Concentrations of AFB1
(ng/g)
Intensity (a.u) aRSD
(%)
0.1294.7 ± 15.45.3
1582.9 ± 21.73.8
52800.7 ± 75.92.8
105460.2 ± 188.23.5
309457.6 ± 312.83.4
6011,249.7 ± 444.84.0
10011,700.2 ± 352.23.1
a Mean ± SD, is the mean and standard deviation of five measurements with a 24 h interval between each test.
Table 4. Analysis results of the Apt-strip and HPLC-FLD for AFB1 in maize, wheat, and sorghum samples (n = 3).
CategorySample NoApt-Strip a (μg/kg)HPLC-FLD (μg/kg)
Maize1ND bND
2NDND
35.4 ± 1.26.3 ± 0.8
4NDND
512.6 ± 1.810.8 ± 0.8
632.4 ± 2.430.2 ± 1.0
7ND0.1
875.3 ± 5.380.2 ± 2.4
918.4 ± 1.817.4 ± 0.9
1010.8 ± 0.911.6 ± 0.6
11NDND
127.6 ± 1.68.9 ± 0.6
13NDND
Wheat14NDND
15NDND
163.2 ± 1.53.7 ± 1.1
1723.6 ± 3.425.4 ± 0.7
18NDND
19NDND
Sorghum20NDND
21NDND
2215.3 ± 1.913.3 ± 0.6
232.4 ± 0.71.8 ± 1.2
24NDND
25NDND
a Values are expressed as the mean ± standard deviation. b ND: None detected (<DL).
Table 5. Sequences of aptamer and cDNA.
NameSequences (5’-3’)
A35-AptTGCACGTGTTGTCTCTCTGTGTCTCGTGCTTTTTT-biotin-TEG
AFB1-AptTGCACGTGTTGTCTCTCTGTGTCTCGTGC
10-cDNAAACACGTGCA-6-FAM
12-cDNAACAACACGTGCA-6-FAM
14-cDNAAGACAACACGTGCA-6-FAM
16-cDNAAGAGACAACACGTGCA-6-FAM
Publisher’s Note: MDPI stays neutral with regard to jurisdictional claims in published maps and institutional affiliations.

