1. Introduction
Of all the primary liver cancers, hepatocellular carcinoma (HCC) is considered the most common (~90%) and severe type worldwide. It is considered the third major cause of cancer mortality and the sixth most common malignancy among humans [
1,
2]. Progression of HCC is a very complex multi-stage process in which alterations in the critical genes regulate the initiation, progression and suppression of the tumor. These genetic modifications take place slowly and drive the progressive transformation from the pre-malignant stage to the dysplastic stage and finally to the malignant stage [
3,
4]. Encouragingly, due to the recent advancements in science and functional genomic approaches, scientists have identified the major cancer-driving genes and associated oncogenic signaling pathways involved in HCC. More specifically, these genes linked to cascades (RAF, ERK/MAPK, PI3K/AKT/mTOR, WNT/β-catenin, JAK/STAT, ubiquitin-proteasome and hedgehog signaling) play important roles in the pathogenesis and suppression of HCC [
5,
6].
The latest research also focuses our attention on the strong link between the highly intertwined UPR pathways of endoplasmic reticulum (ER) stress and tumor pathogenesis in several cancer types, including HCC. The ER is a distinctive, multifunctional intercellular organelle involved in lipid biosynthesis and metabolism, protein folding, secretion of proteins and calcium homeostasis. It also transduces signals by cross-talking with other organelles, such as the Golgi apparatus, mitochondria, lysosomes and nucleus. Protein folding requires reticular chaperones localized in the ER. These chaperones ensure that the newly synthesized proteins are folded correctly and are of optimum quality. However, various intracellular and extracellular stimuli can lead to excessive accumulation (termed ER stress) of unfolded and misfolded proteins in the ER. Under such conditions, the accumulated proteins are sensed by three transmembrane proteins (ATF6, IRE1 and PERK) and the unfolded protein response (UPR) is activated with the aim of reinstating normal ER functioning [
7]. Normally, the UPR performs cytoprotective functions, such as cell cycle arrest, regulation of protein synthesis and upregulation of UPR-responsive genes. However, in cases of irredeemable or chronic ER stress, this UPR activates pro-apoptotic signaling pathways [
8,
9]. ER stress is further triggered by characteristic stimuli of solid tumor microenvironments, such as acidosis, hypoxia, reactive oxygen species and nutritional deficiency, as tumor cells have an excessive, mutation-driven need for protein synthesis and high metabolic rates.
Therefore, in an era of precision cancer medicine, targeting relevant genetic alterations is important to stratify patients and develop molecularly targeted therapies.
Various plant polyphenols and extracts have been suggested to improve the quality of life and prolong the survival of cancer patients [
10]. Dawa-ul-Kurkum (DuK) has been in use for centuries, as mentioned in multiple ancient texts. The name Dawa-ul-Kurkum” is derived from the Persian language, and the main constituent of this medicine is “kurkum”; i.e., saffron. It is recommended for liver dysfunction, anorexia, ascites and abdominal pain. The metabolites present in the herbal constituents of DuK are crocin, crocetin, safranal (
Crocus sativus), jatamansone, isovaleric acid (
Nardostachys jatamansi), cinnamaldehyde, coumaric acid (
Cinnamomum cassia,
C. zeylanicum), citral (
Cymbopogon jwarancusa), guggulsterone (
Commiphora wightii) and dehydrocostus lactone (
Saussurea lappa). In search of the lead molecule of Duk, we used a structure-based in silico molecular docking approach with AutoDock Vina and predicted the interactions between the pharmacologically active components of DuK and the 32 selected proteins. Based on a literature search, these proteins were selected in accordance with their roles in HCC development (2), progression (14), suppression (6) and ER stress (10). The results were then validated using in vitro studies, MD simulations and qRTPCR.
3. Discussion
HCC is most frequently known to progress in the background of chronic liver disease triggered by alcohol abuse, hepatitis B/C virus (HBV/HCV) or metabolic syndrome. Due to its synchronic progression, it is commonly multi-nodular when diagnosed [
11,
12]. Natural preparations (either as single herbs or polyherbal formulations) are gaining enormous attention in modern healthcare. This may be because of their easy accessibility, low cost, safe usage and diverse biological activities [
13]. The complex interactions between the various phytoconstituents of polyherbal formulations help in targeting various deregulated pathways of tumor cells and provide a promising multi-dimensional way to manage cancer [
13]. Previously, we reported that DuK exhibited excellent antioxidant activity and significantly reduced the viability of liver cancer cell lines (HepG2, Hep3B and Huh7) without affecting the viability of parent liver cells. DuK was phytochemically standardized using HPTLC with respect to marker constituents present in materials from seven individual plants [
14]. DuK was further found to be effective against a diethyl nitrosamine (DEN)-induced HCC model in male Wistar rats. In the present study, we utilized an integrated approach involving molecular docking, dynamics simulation and in vitro studies to uncover the lead molecule of DuK, and this is the first study of its kind.
Molecular docking is a widely used, structure-based drug-design approach that provides information about the binding mode and the affinity between proteins and ligands [
15,
16,
17]. Ranked binding free energies obtained after docking are not always accurate, but they can be utilized for the selection of new molecules, which can then be experimentally validated [
18]. Using molecular docking, we first screened for the binding potential of bioactive compounds from DuK with important targets involved in the development, progression and suppression of HCC and ER stress, and three molecules (
Z-guggulsterone, dehydrocostus lactone and crocin) were shortlisted from the initial screening.
Next, to identify the lead molecule (out of the three), cytotoxicity and scratch test assays were performed. Incidentally, our study showed similar results as the existing literature [
19,
20,
21,
22]. Similar effects were observed in Hep-2, TU212 and H1299 cells, where dehydrocostus lactone significantly inhibited the viability, migration and proliferation of these cells [
23,
24]. Treatment of pancreatic cancer cells with guggulsterone also showed similar results [
25].
Effective anti-cancer therapy should kill cancer cells while protecting healthy cells. In our study, we observed that Z-guggulsterone affected the viability of cancerous cells without affecting the parental cell population. However, the normal cell population was affected by the other two compounds and, thus, further research was undertaken with Z-guggulsterone.
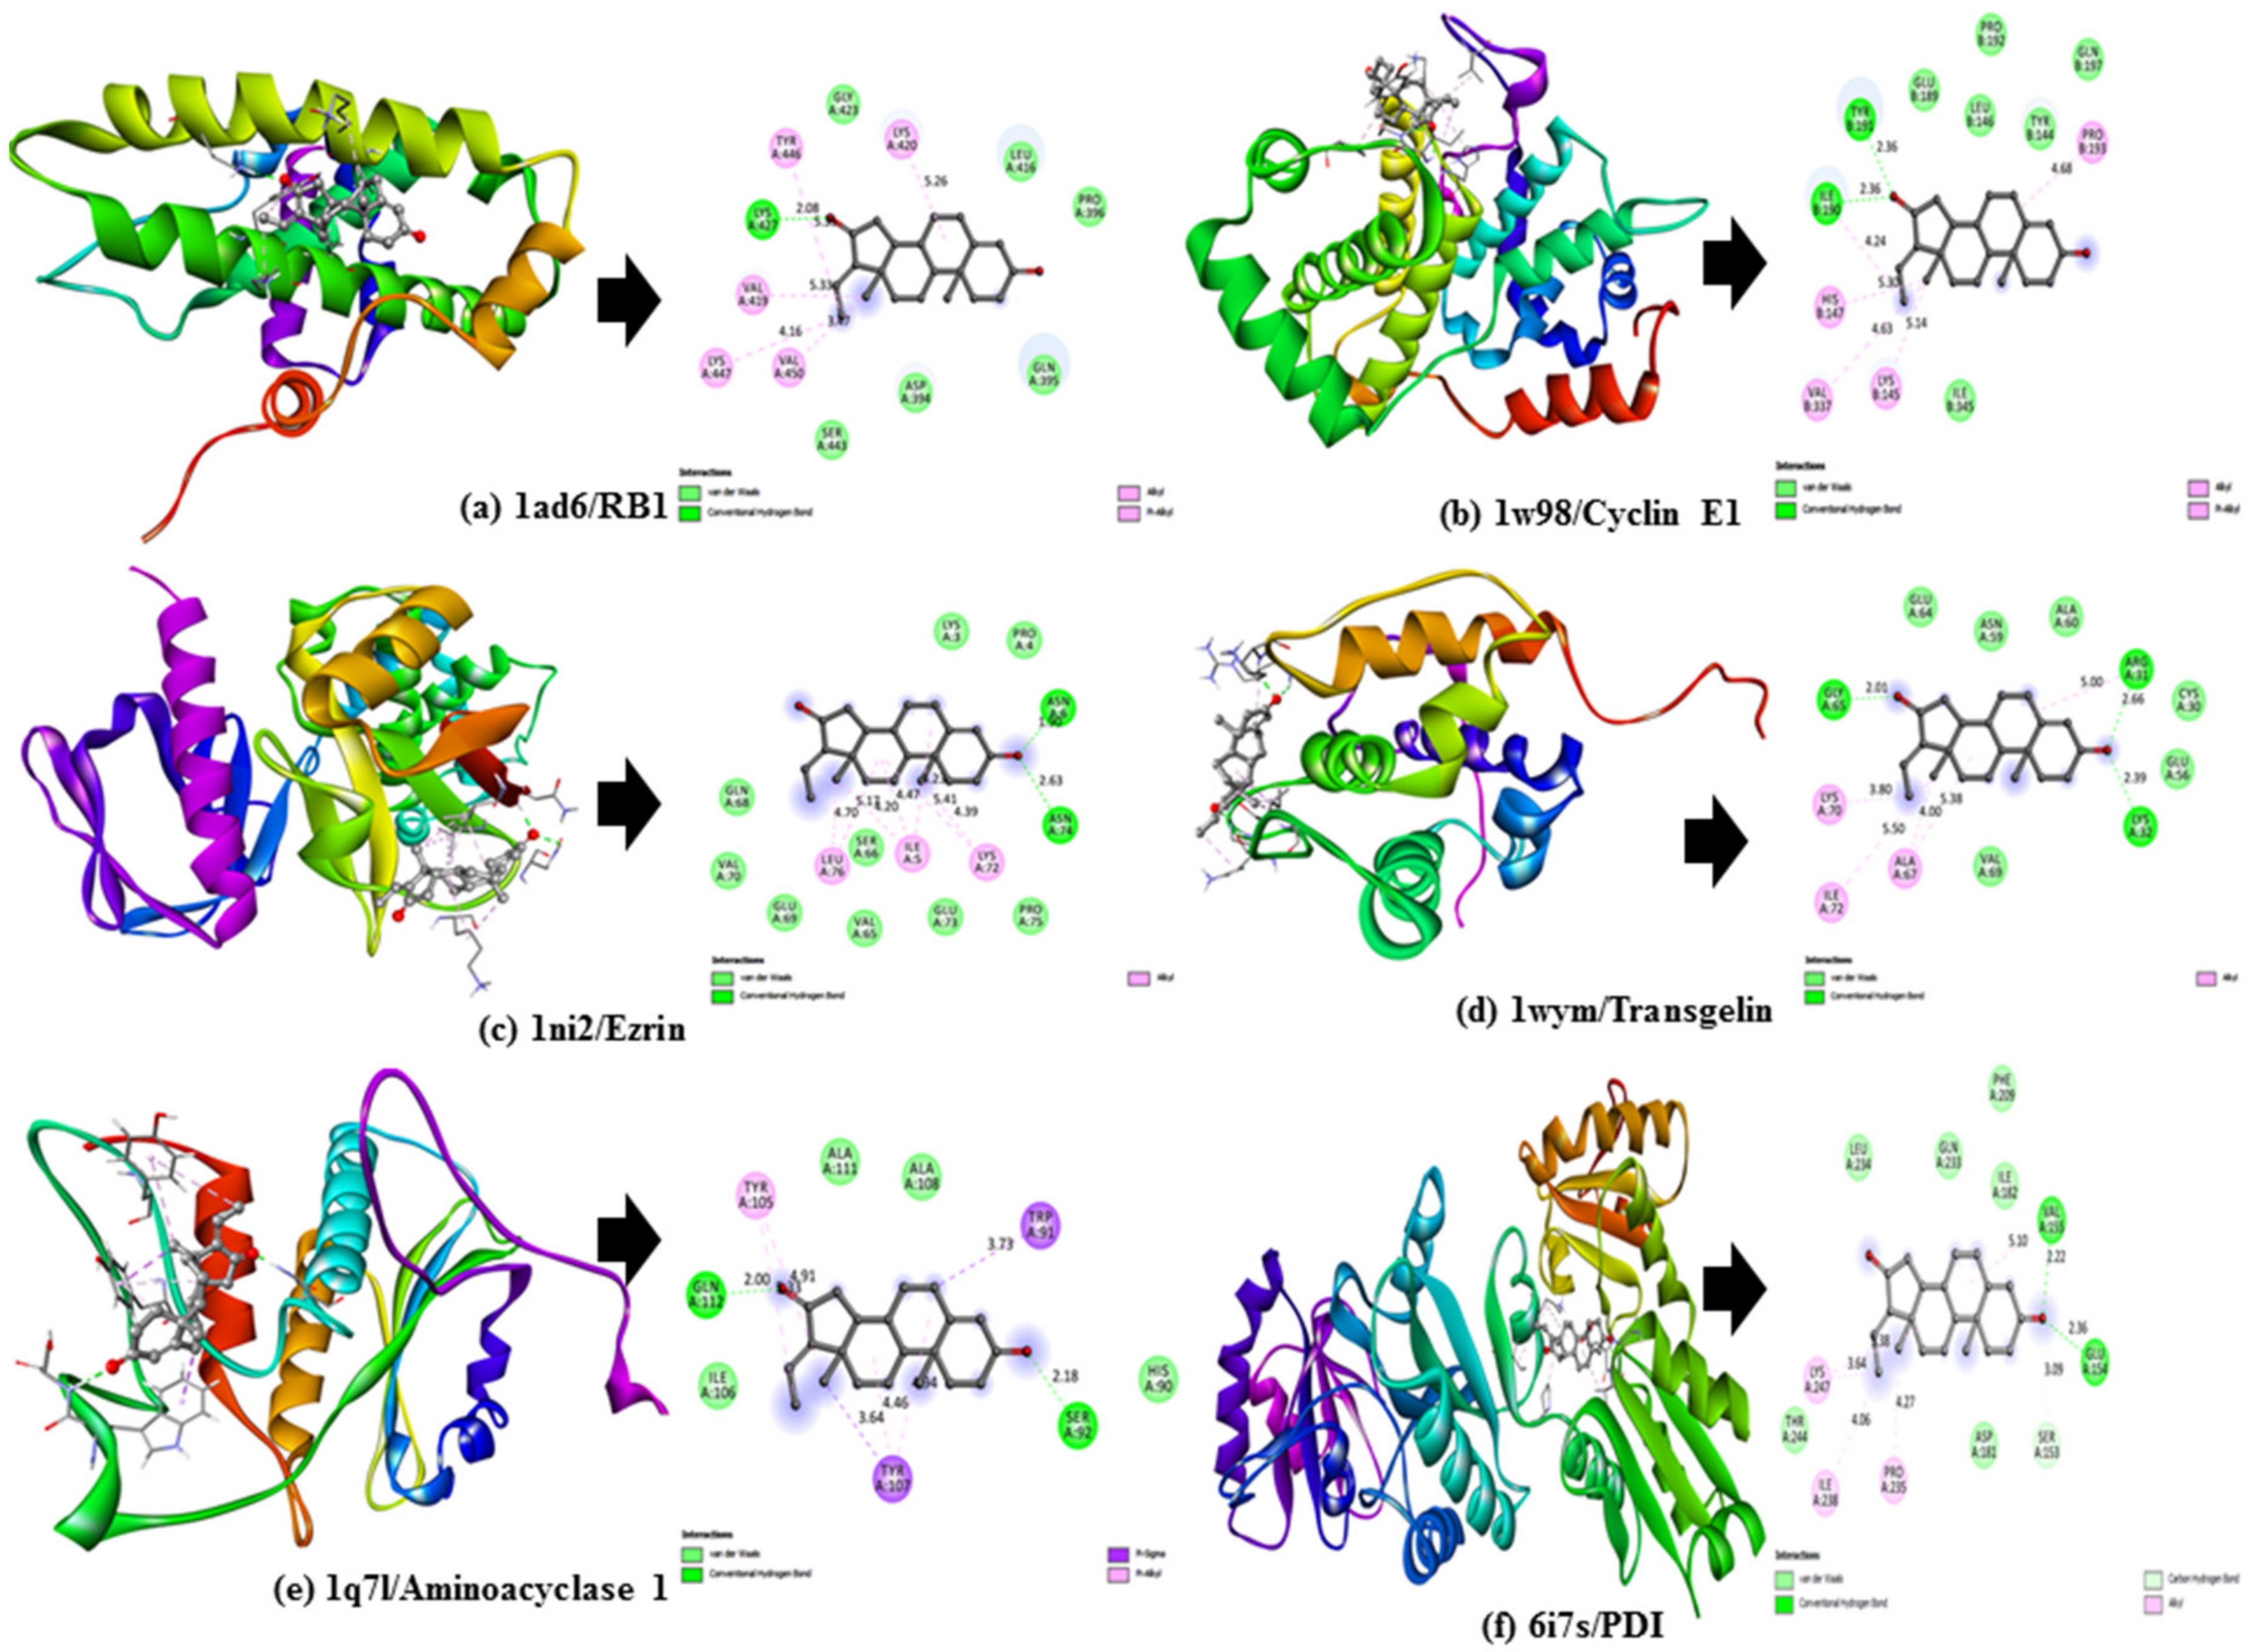
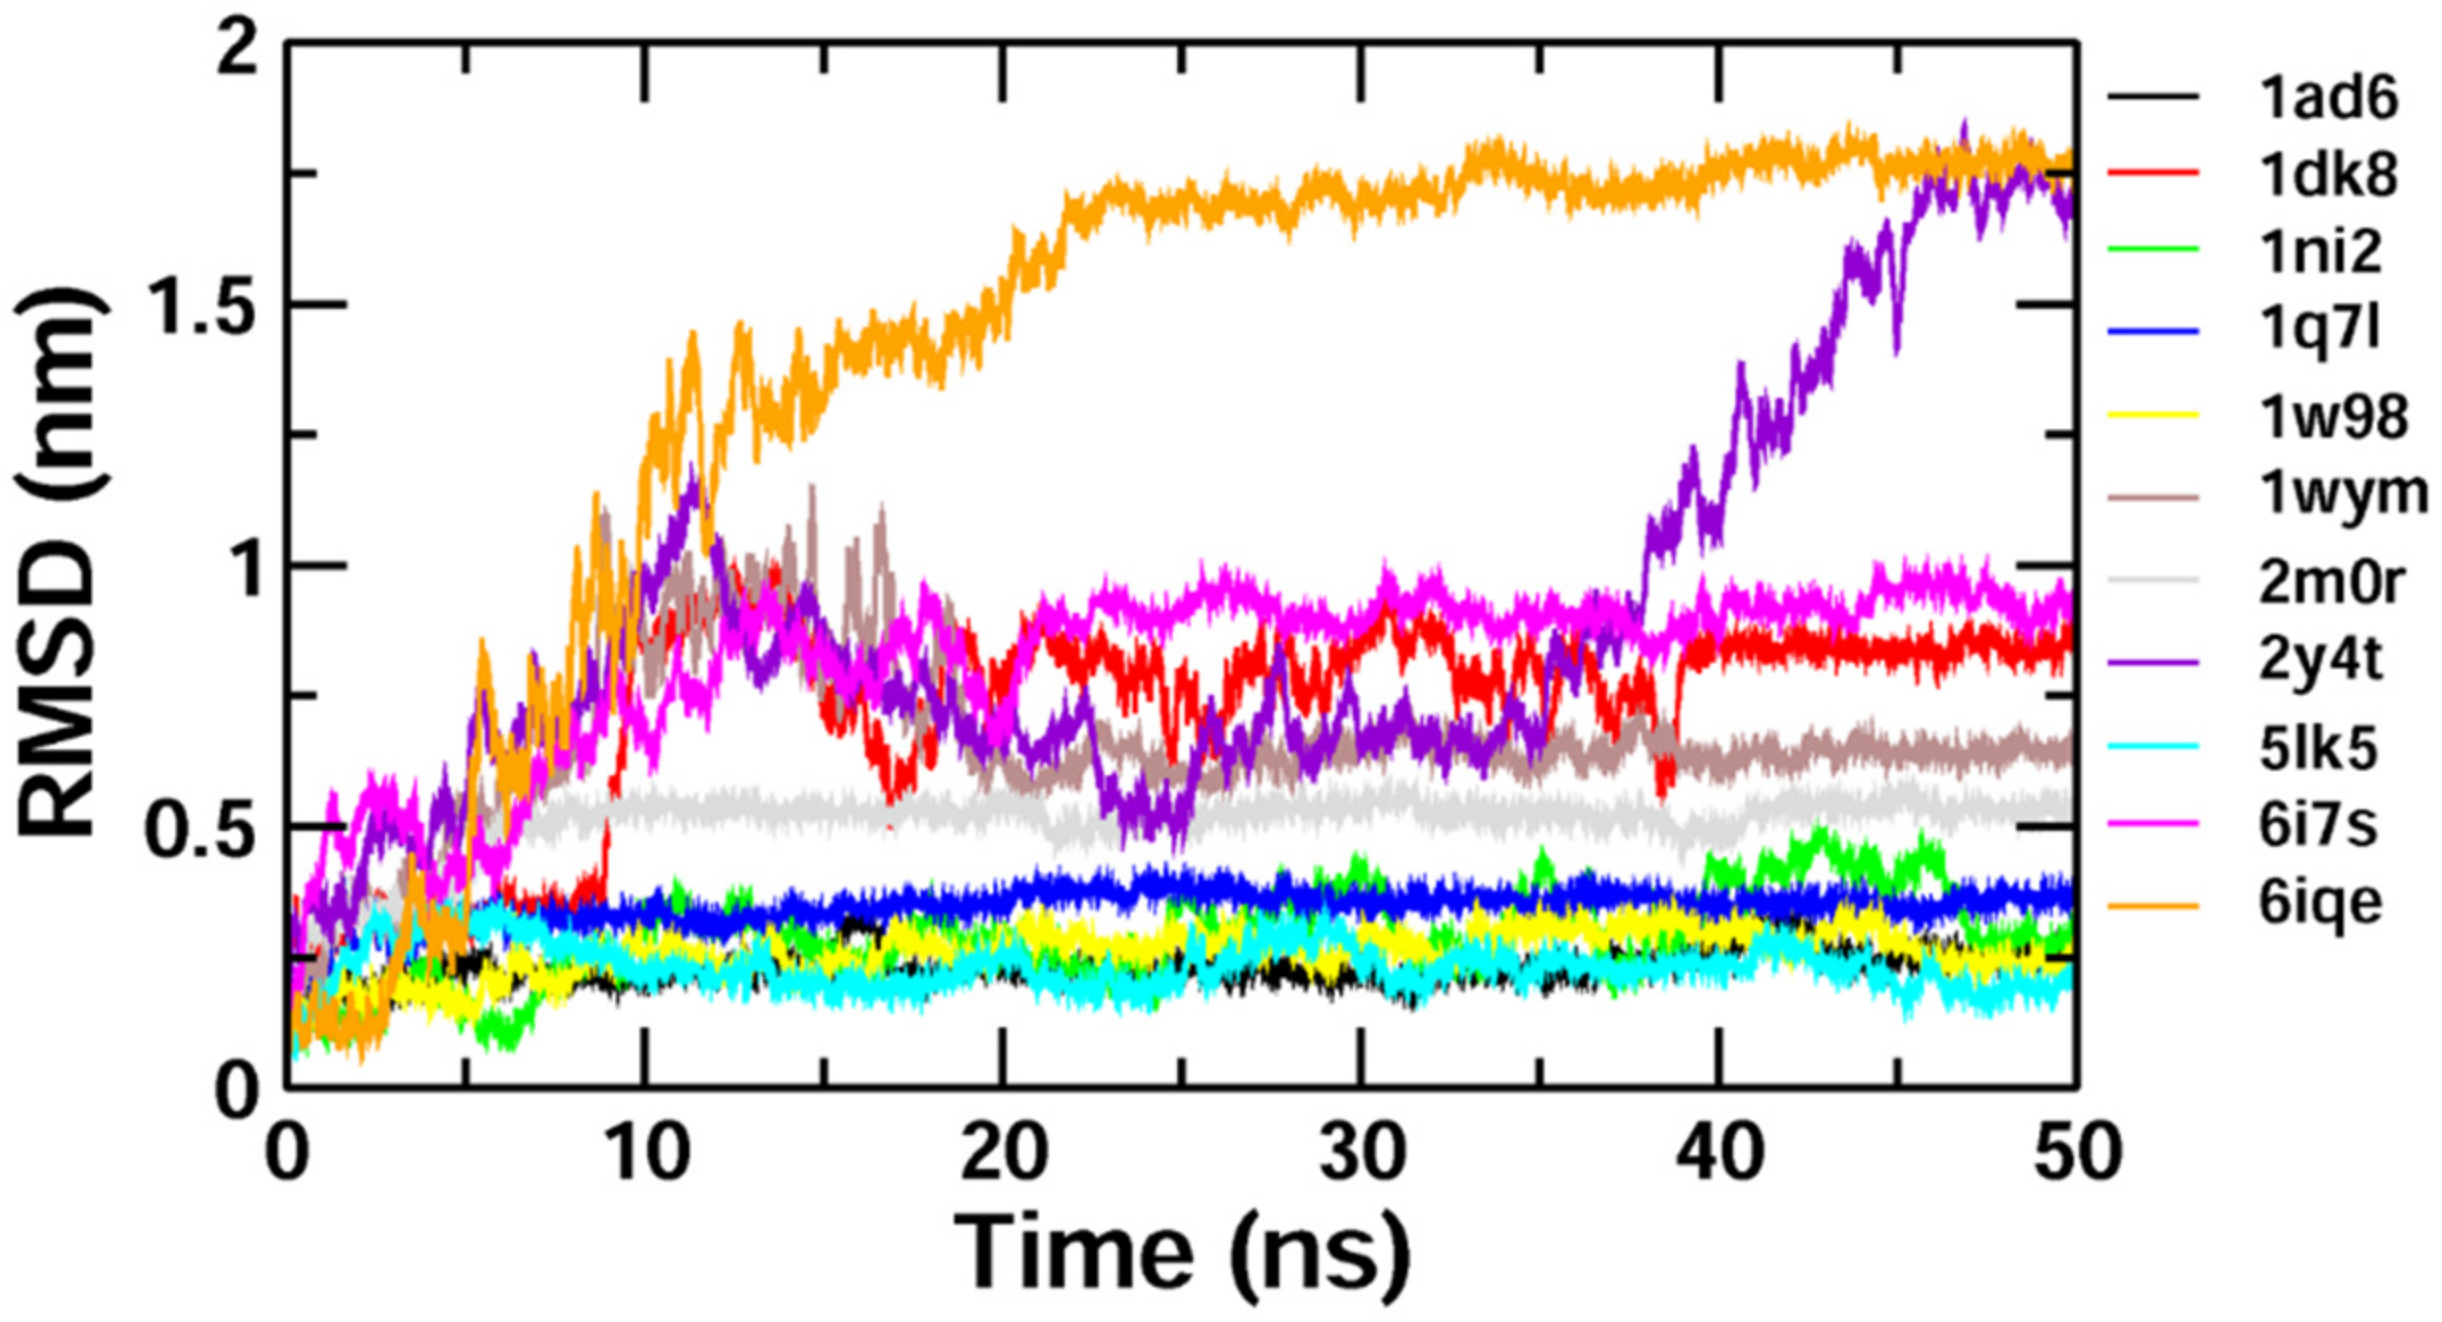
To validate the results of our docking studies and obtain an idea of the interactions of the protein–ligand complexes in motion, we performed MD simulations for selected proteins (obtained from the docking studies) with
Z-guggulsterone. This simulation step was carried out to investigate protein flexibility and movement and complex stability, which cannot be achieved using molecular docking [
26]. Lower RMSD values for the protein–ligand complexes (as in the case of aminoacylase 1, RB1, ezrin and calreticulin) suggested stable binding of
Z-guggulsterone at the binding pocket of the protein and indicated a minimal change in protein conformation after
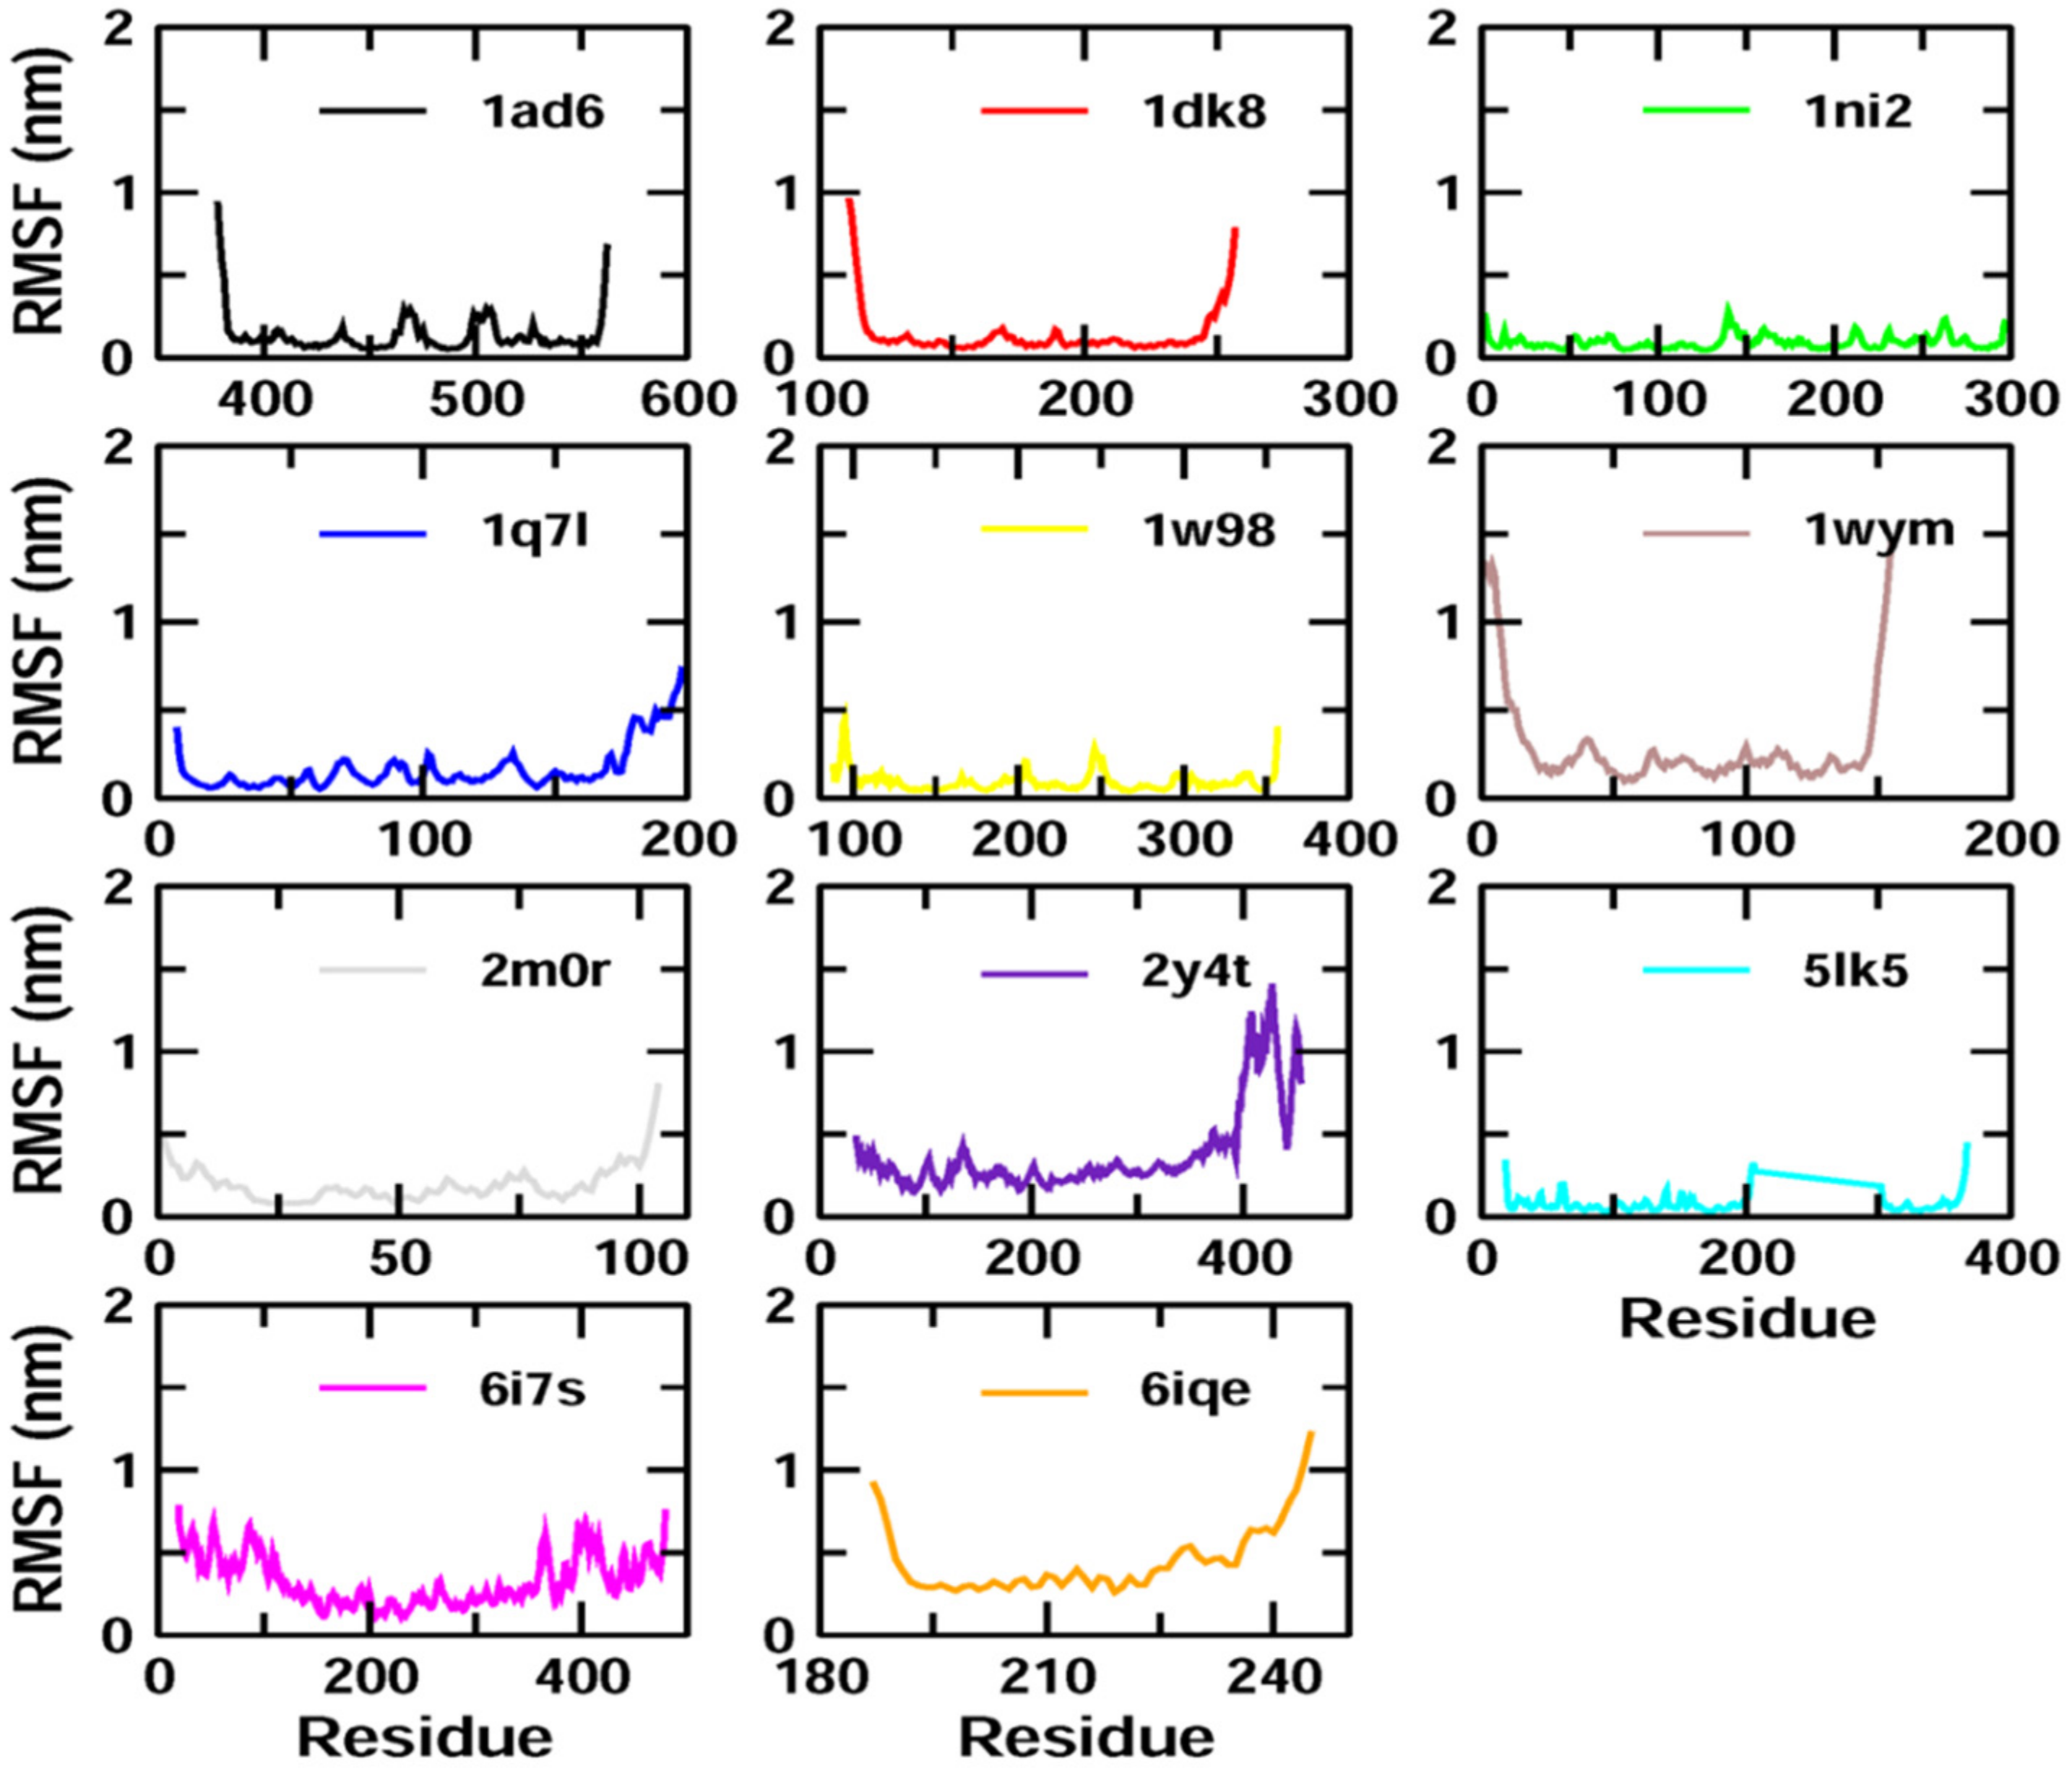
Z-guggulsterone binding. The results were also supported by the RMSF and Rg value plots. RMSF values provide information about the mobility of local structures in protein cavities during MD simulations [
27], and we observed low residual fluctuations with several proteins, confirming that there were minimal changes in protein structures upon binding with
Z-guggulsterone. Rg can be described as the root-mean-square distance from each atom of the system to its center of mass and it is an indicator of protein structure compactness [
26,
27,
28]. This minimal structural deviation noted in our results was responsible for the stable Rg equilibrium throughout the simulation. Further, the molecular mechanics Poisson–Boltzmann surface area (MM-PBSA) method was utilized to calculate the free binding energy of the top five selected protein–ligand complexes. This method indicates the importance of the relative contributions of the van der Waals energy, the electrostatic energy, the polar solvation energy and the solvent-accessible surface area energy to the binding [
29,
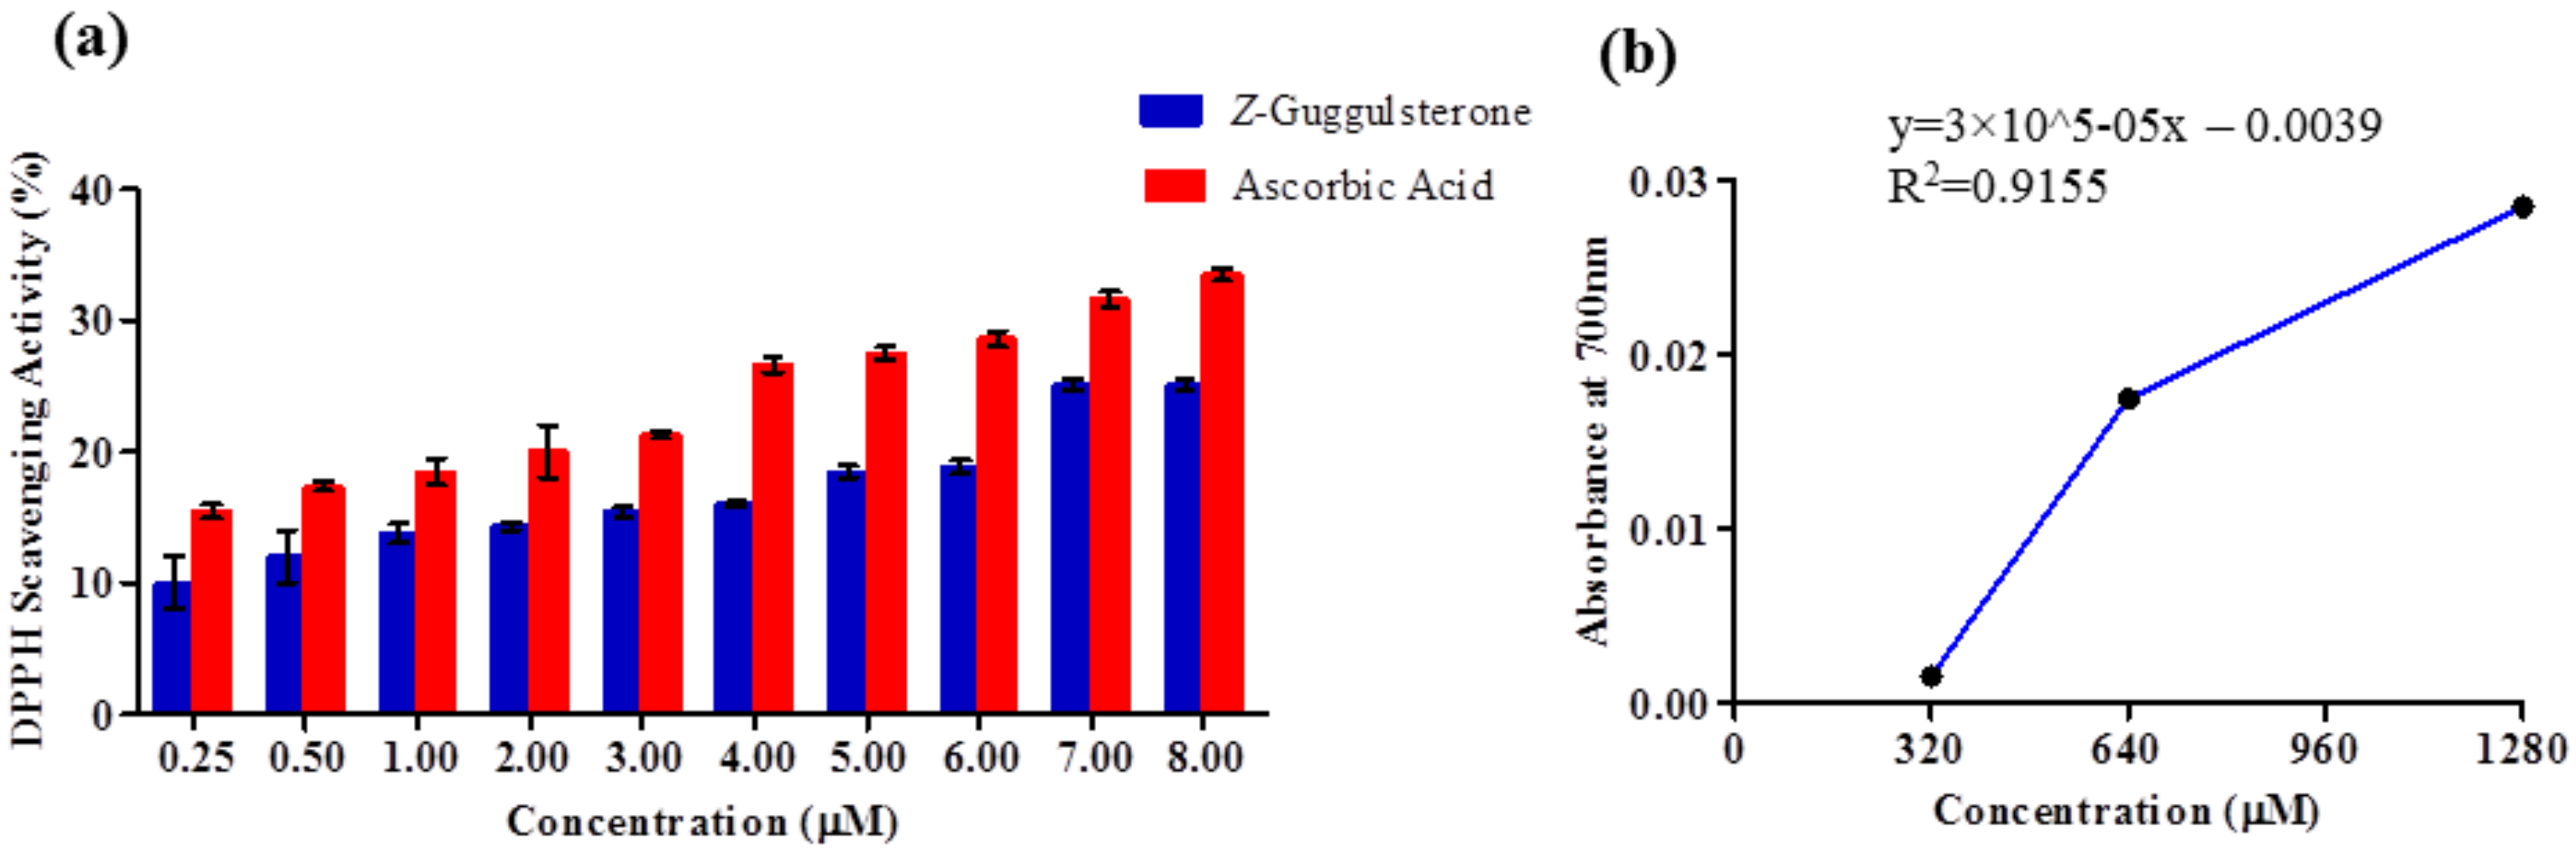
30]. In our study, the binding energy of four complexes was below zero, therefore indicating good binding affinity. Increased levels of reactive oxygen species (ROS) and associated proteins have been identified in almost all types of cancer, where they play an essential role in tumor development and progression. Maintaining the delicate balance between ROS and antioxidant enzymes is, therefore, necessary for cancer management [
31,
32]. Here, the anti-oxidant potential was determined using DPPH and FRAP assays, and the results confirmed that
Z-guggulsterone can scavenge the potential damage.
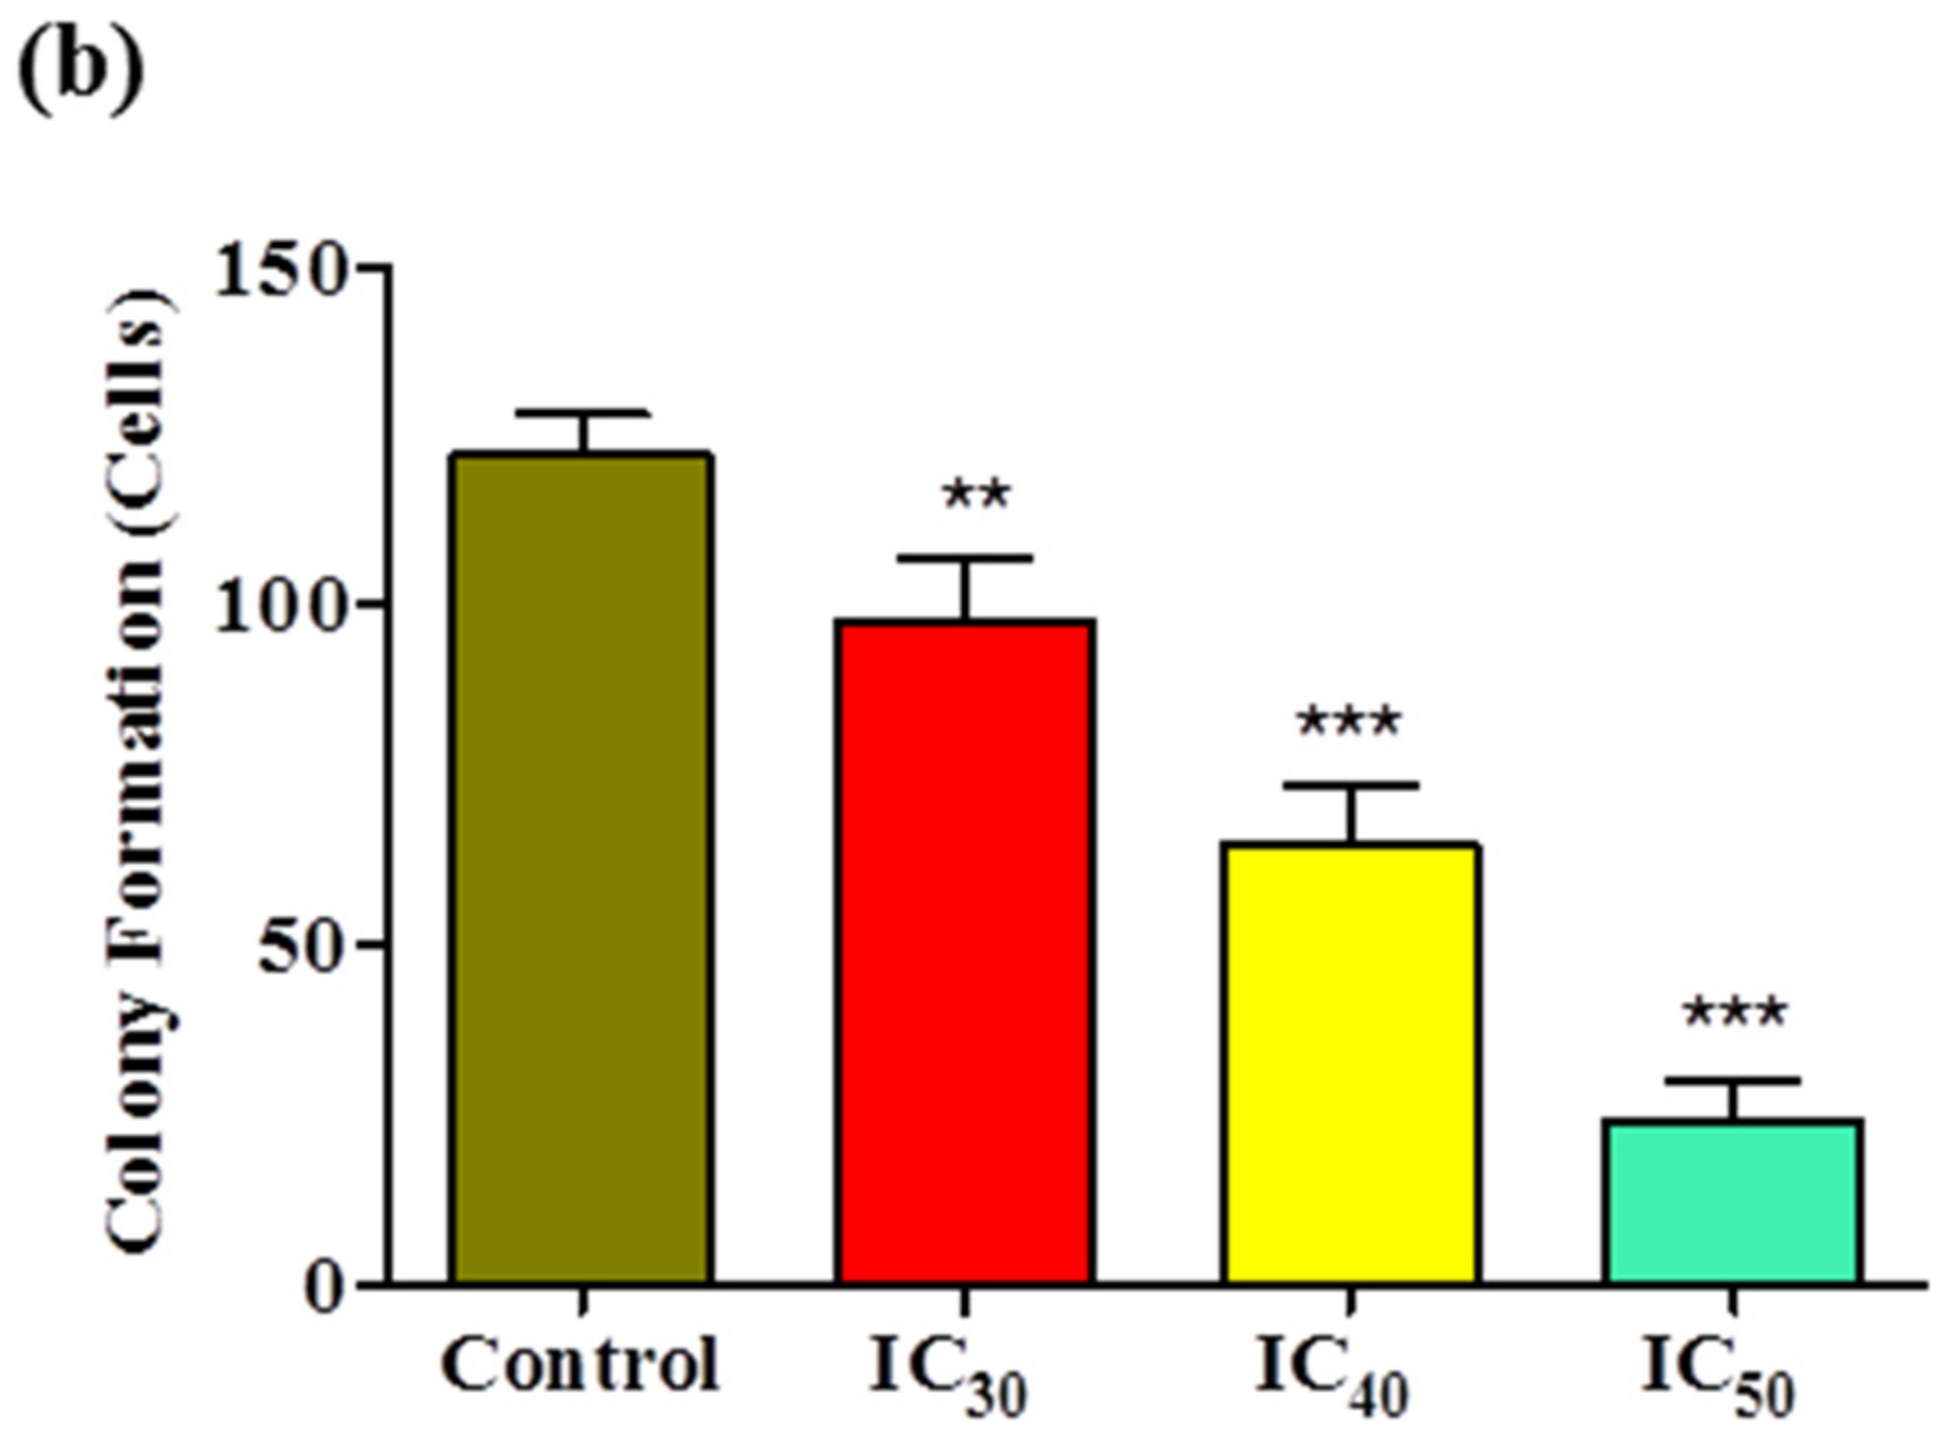
Cancer is mainly characterized by uncontrolled cell proliferation and invasion; therefore, targeting these processes may prove beneficial for chemopreventive agents. Our results for the colony-formation assay showed that the numbers and sizes of colonies derived from
Z-guggulsterone-treated cells were markedly smaller compared to the vehicle control group. Our results were similar to those observed in pancreatic cancer cells after treatment with guggulsterone [
25].
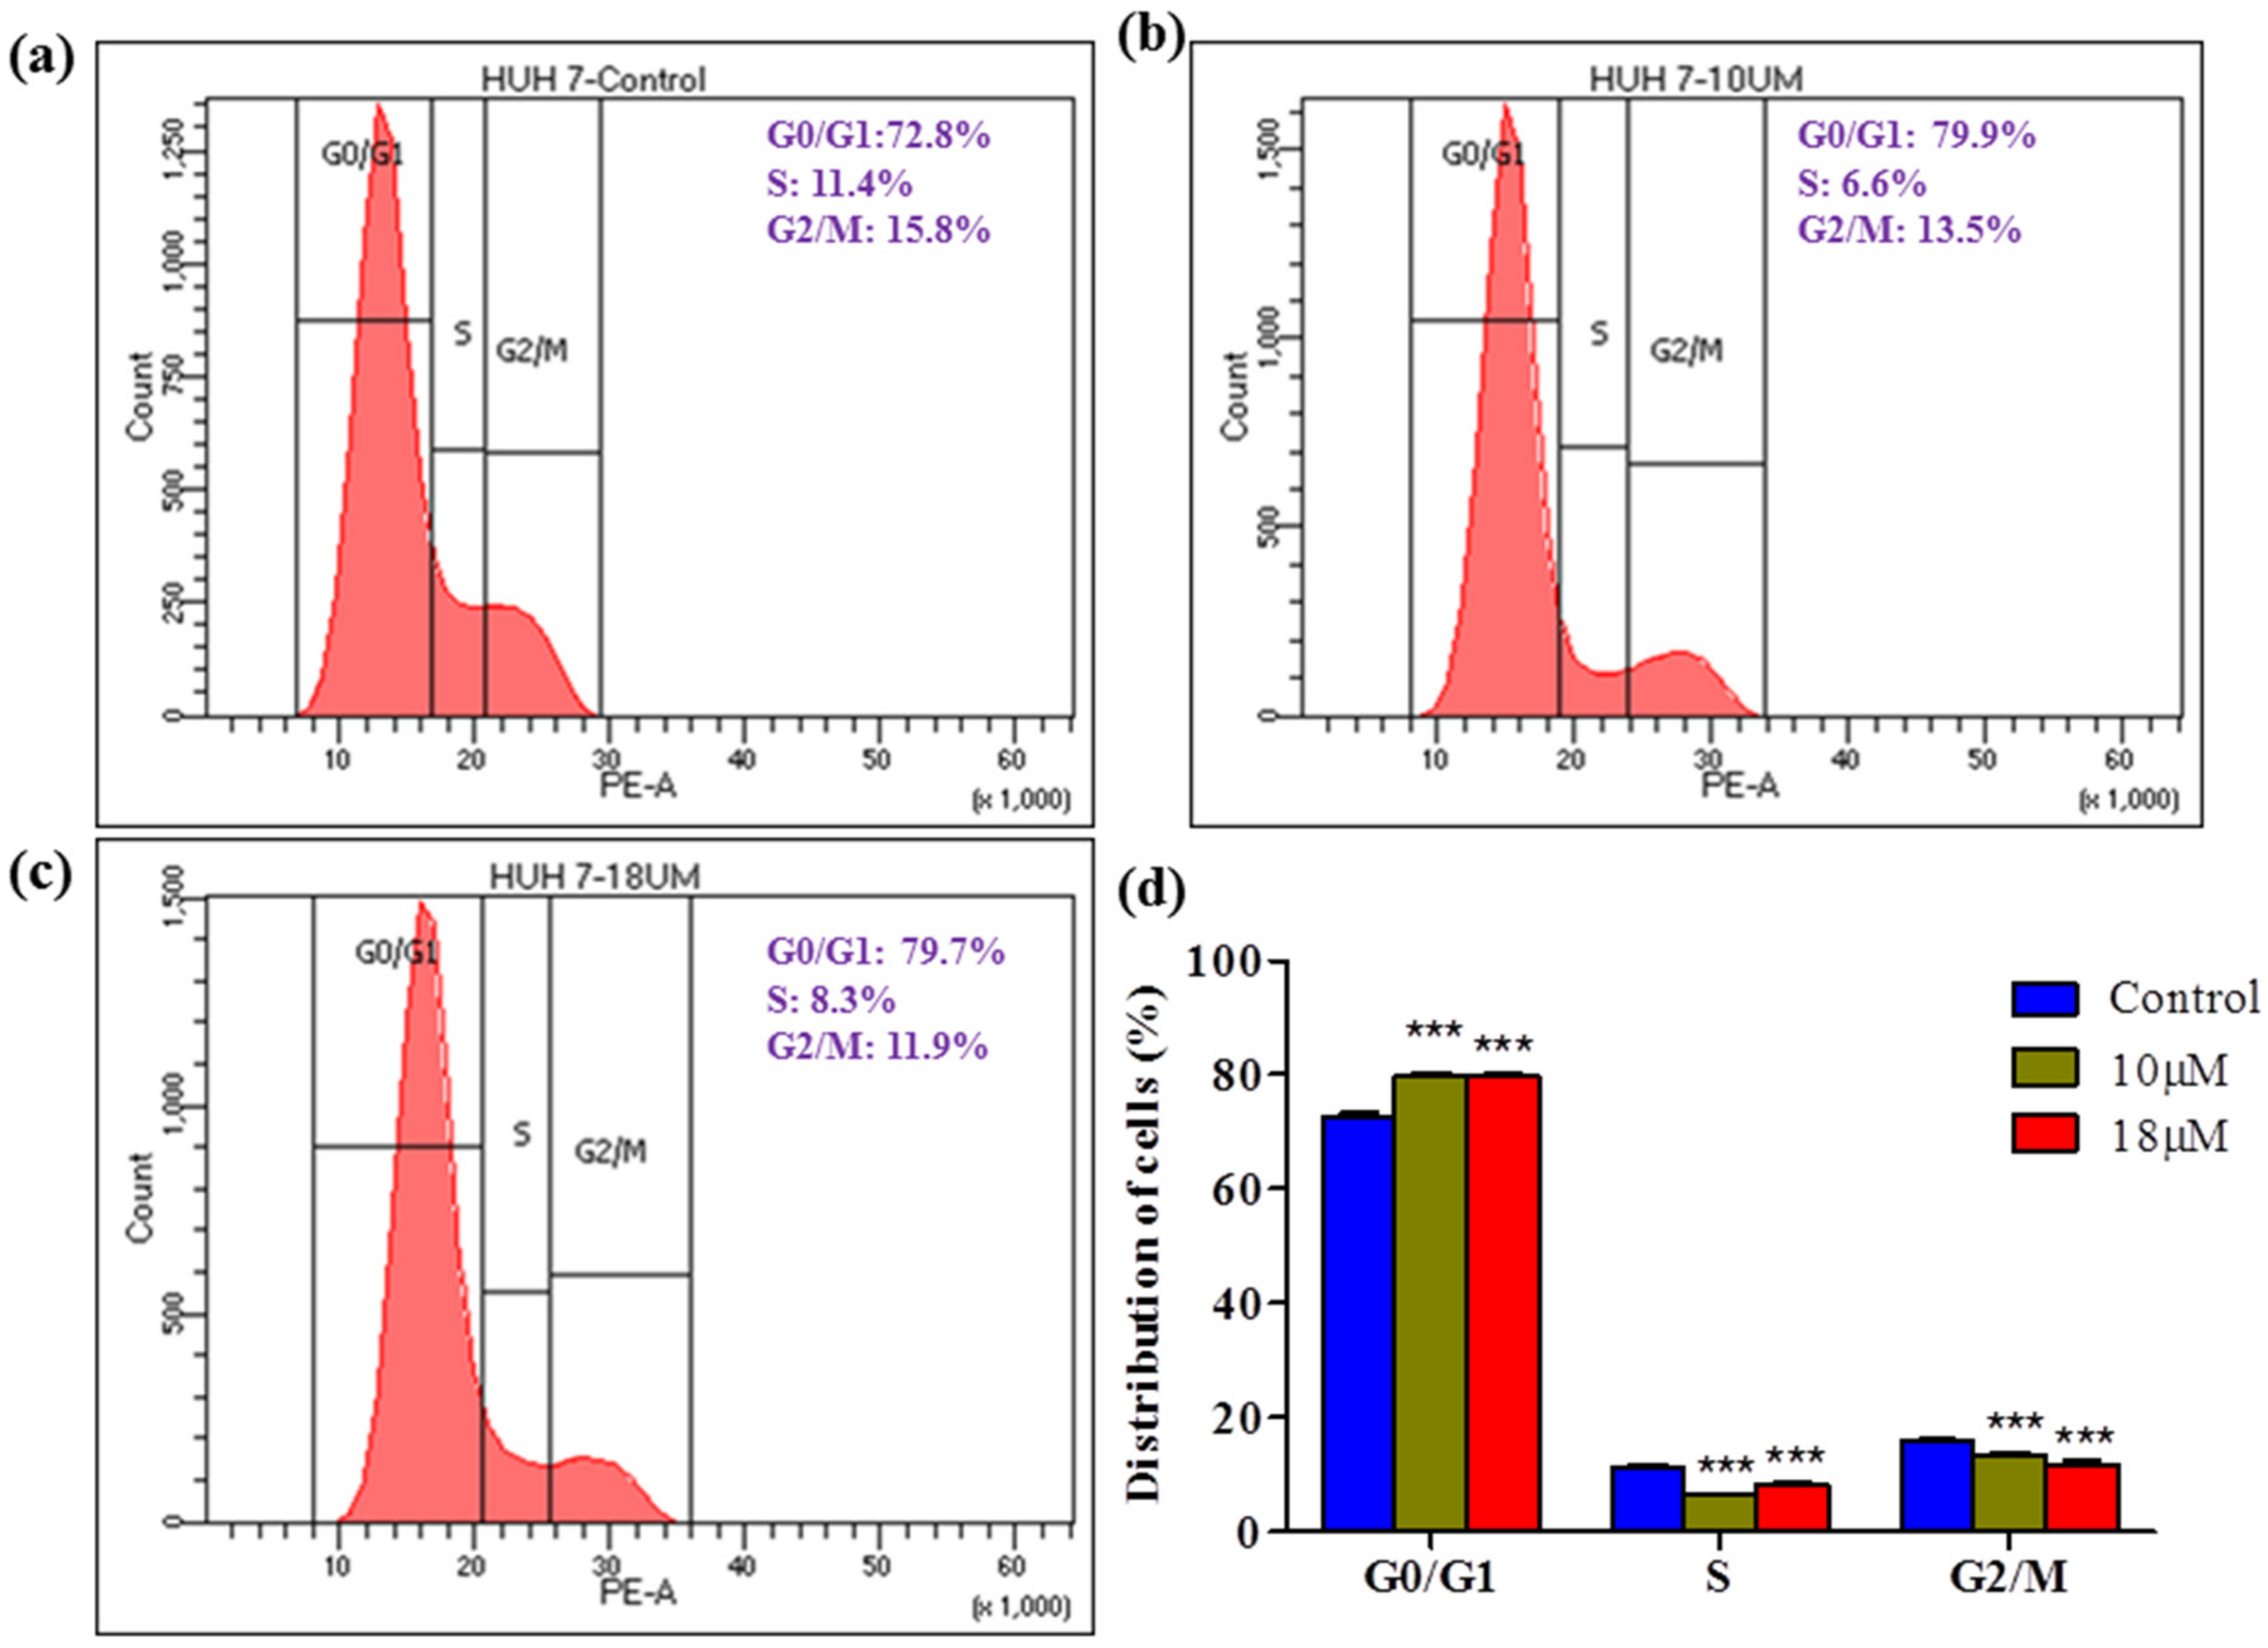
Cell cycle arrest at a specific phase is a common mechanism demonstrated by various herbal cytotoxic agents. In this study, we investigated cycle distribution using flow cytometry. The data showed that the proportion of G0/G1 cells increased in a dose-dependent manner, indicating that
Z-guggulsterone can induce G0/G1 arrest. In contrast, in similar experiments performed by [
22], the authors observed that guggulsterone did not induce significant cell cycle arrest in L-02 cells.
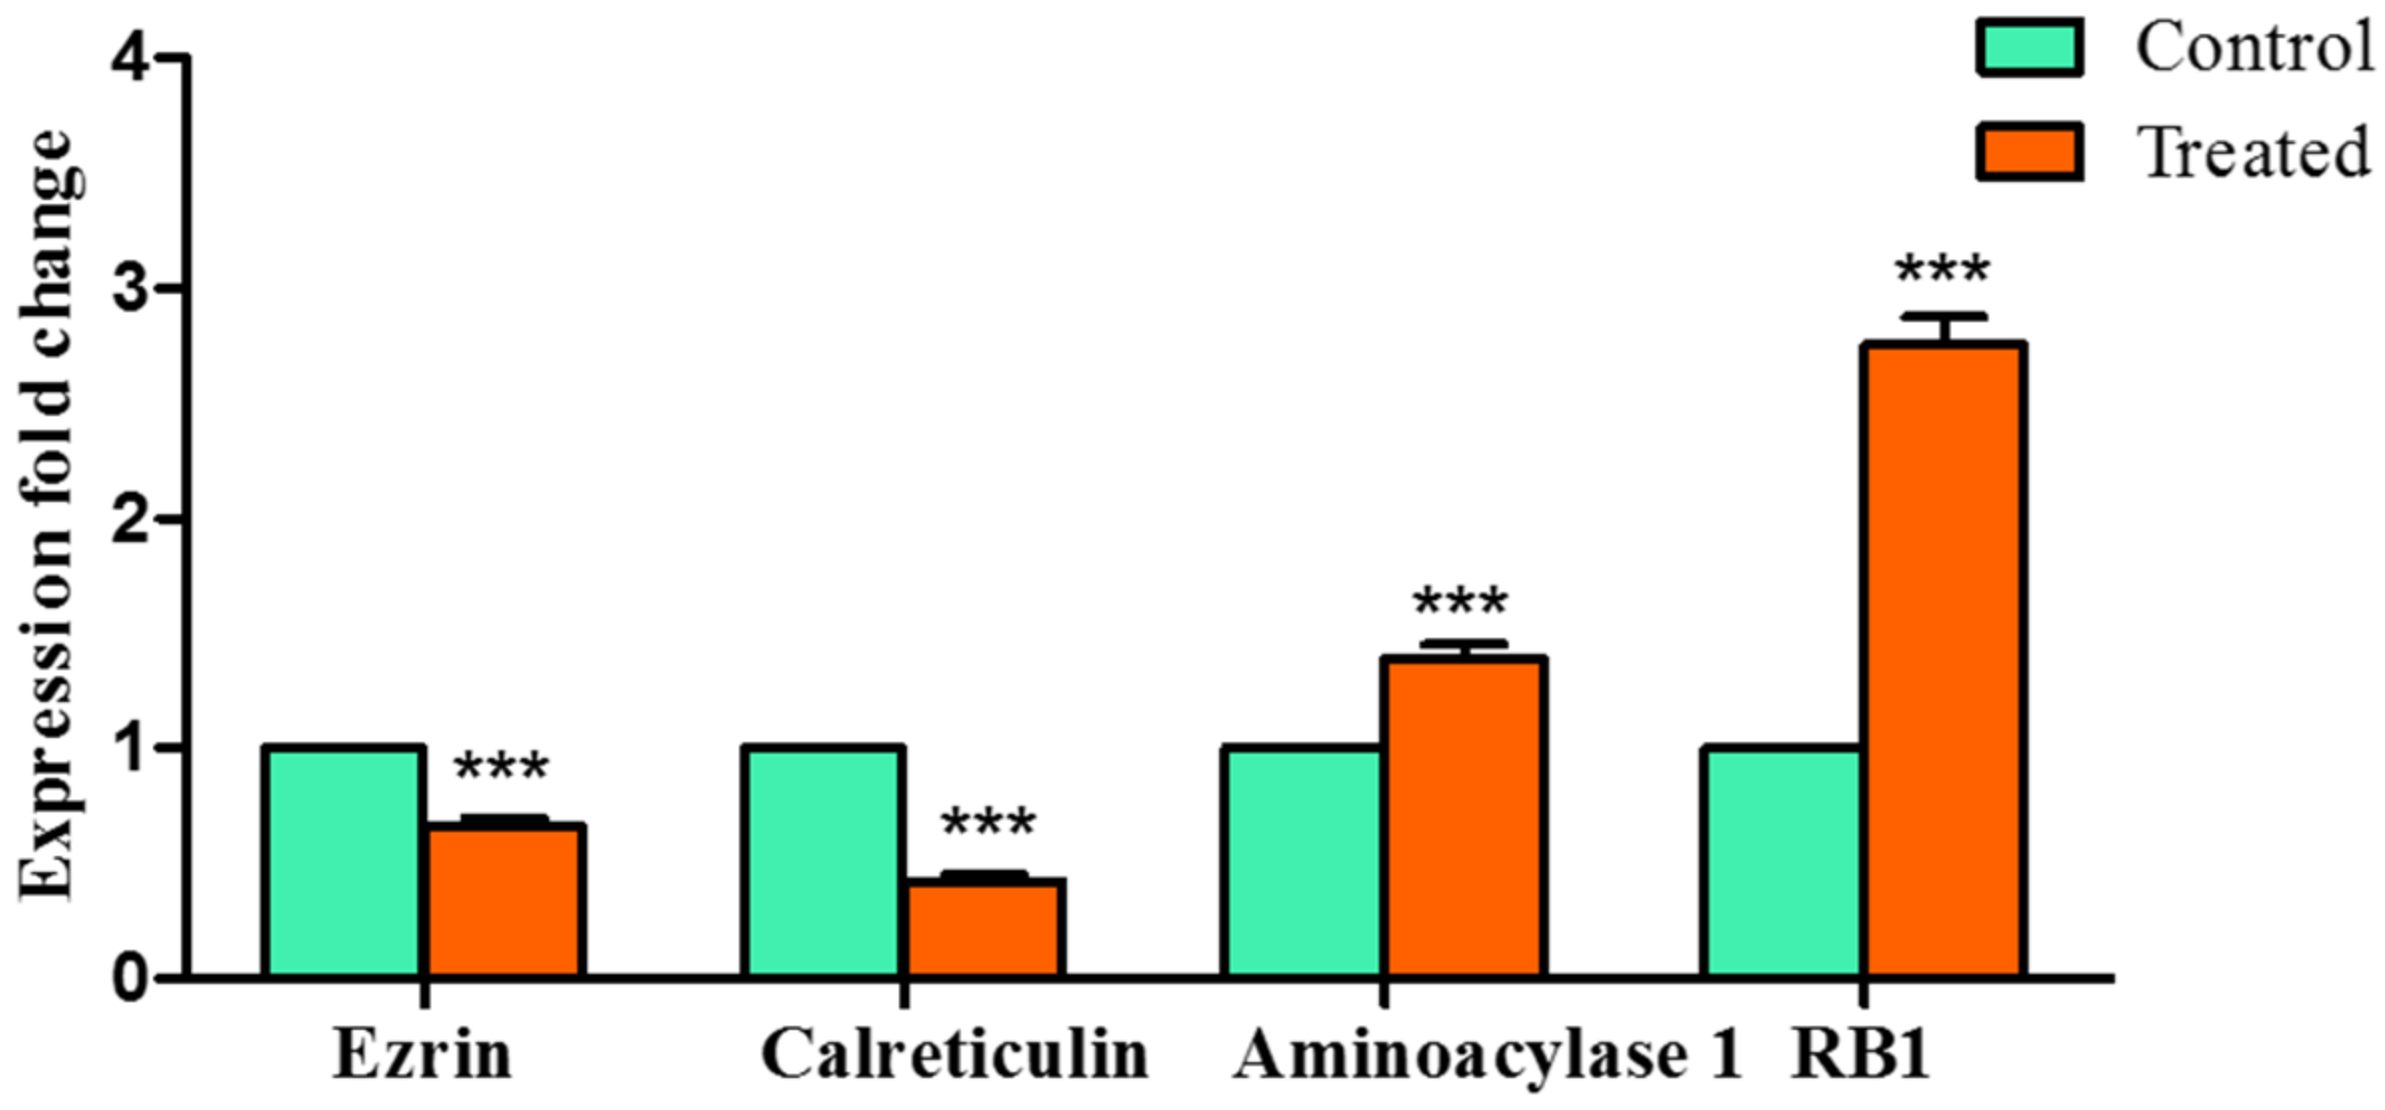
Encouraged by the above results, we further attempted to validate our study using qRTPCR and observed that
Z-guggulsterone significantly downregulated the expression of
ezrin and
calreticulin, whereas it upregulated the expression of
aminoacylase 1 and
RB1.
Ezrin is a member of the ezrin–radixin–moesin (ERM) family and is associated with high invasion and poor prognosis in HCC [
33,
34]. Overexpression of
ezrin is implicated in the promotion of HCC cell proliferation, epithelial-to-mesenchymal transition (EMT) progression, metastasis and angiogenesis [
33]. Its firm interaction and consequent downregulation in the presence of
Z-guggulsterone may, therefore, be of great importance. Another tumor promoter that was downregulated after treatment with
Z-guggulsterone was
calreticulin. This is a multi-functional molecular chaperone localized in the endoplasmic reticulum. It significantly contributes to Ca
2+ homeostasis, immune responses, transcriptional regulation and protein folding, as well as cellular functions such as cell proliferation, migration and apoptosis, etc. [
35].
Calreticulin is a potential biomarker and therapeutic target for various cancers, including HCC, and its overexpression is linked with the acceleration of tumor cell migration and invasion [
35]. Next, we observed upregulation in two tumor-suppressor genes:
aminoacylase 1 and
RB1. Knockdown of
aminoacylase 1 in HCC cells is directly linked to an increase in the cell viability, tumor invasiveness the expression of TGF-β1 and ERK1, which proves its tumor-suppressing potential [
36]. Another gene,
RB1, belongs to a family of three proteins that includes RBL1/p107 and RBL2/p130. It is also a tumor-promoter gene and has been found to decrease in several cancers, including hepatocellular carcinoma [
37,
38]. Our molecule,
Z-guggulsterone, strongly interacted with both the proteins and upregulated their expression.
4. Material and Methods
4.1. Chemicals
The Z-guggulsterone used for the study was procured from Natural Remedies Pvt. Ltd. (Bangalore, India). The dehydrocostus lactone and TRI reagent were acquired from Sigma-Aldrich Co. LLC (St. Louis, MO, USA). We purchased cell culture additives/other consumables, such as Dulbecco Modified Eagle Medium (DMEM), DMEM/F-12, fetal bovine serum (FBS), trypsin–EDTA, penicillin-streptomycin (PenStrep) antibiotic solution, epidermal growth factor (EGF), an FITC annexin V/dead cell apoptosis kit, proteinase K, a High Capacity cDNA kit, RNase, ferric chloride, trichloroacetic acid, disodium hydrogen phosphate potassium ferricyanide and nuclease-free water from Thermo Fisher Scientific (Waltham, MA, USA). Phosphoethanolamine was bought from Tokyo Chemical Industry Co., Ltd. (Chennai, Tamil Nadu, India). Type I collagen peptide, bovine serum albumin (BSA) and dimethyl sulfoxide (DMSO cell culture-grade) were purchased from HiMedia Laboratories Pvt. Ltd. (Mumbai, India). Coomassie Blue was obtained from Genetix BioAsia Pvt. Ltd. (Delhi, India). Sodium phosphate monobasic and thiazolyl blue tetrazolium bromide (MTT) were purchased from Sisco Research Laboratories (SRL) Pvt. Ltd. (Pune, India). 2,2-Diphenyl-1-picrylhydrazyl (DPPH) was obtained from Central Drug House Pvt. Ltd. (Delhi, India). SYBR Green master mix from Applied Biosystems (Foster City, CA, USA), and primers from Universal Biotech (New Delhi, India) were used in the present study.
4.2. Docking Studies
4.2.1. Ligand Selection
The ligands selected for this study were ten well-characterized phytochemicals from the seven herbal components of DuK (
Supplementary Materials Figure S2). All chemical structures were retrieved from the PubChem compound database (NCBI) (
http://www.pubchem.ncbi.nlm.nih.gov (accessed on 29 October 2020). The structures of the standards (sorafenib and regorafenib) were retrieved from their corresponding PubChem entries, and nivolumab was drawn in ChemDraw 7.0.1.
4.2.2. Protein Preparation
Each ligand structure was retrieved from the database and the geometry was optimized using MM2 energy minimization. Based on the literature, 32 proteins were selected according to their roles in HCC development (2), progression (14), suppression (6) and ER stress (10). The HCC proteins selected for the study have roles in tumor differentiation, cell proliferation, metastasis, apoptosis, migration, invasion and regulation of cell cycle. Additionally, some of them are involved in regulating various signaling cascades in HCC, such as NF-κB signaling, the tyrosine kinase pathway, the RAF/ERK/MAPK pathway, TGF-β signaling, the Wnt/β-catenin pathway and the Ras and JAK/STAT pathway. The ER stress proteins were selected based on their roles in the downstream pathways of PERK, ATF6 and IRE1 signaling and protein folding (
Supplementary Materials Tables S1 and S2). The crystal structures of these proteins were retrieved from the RCSB Protein Data Bank (PDB) database (
http://www.pdb.org (accessed on 2 November 2020)). Their PDB ids are given in
Supplementary Materials Tables S1 and S2. Each protein was used as a rigid structure and all water molecules and hetero-atoms were removed using BIOVIA Discovery Studio Visualizer v.4.5 (Accelrys).
4.2.3. Grid Box Preparation and Docking
All file conversions required for the docking study were performed using the open-source chemical toolbox Open Babel v.2.3.283. Grid box parameters were set in such a way as to allow for molecular docking using AutoDock Tools v.1.5.6rc384. The grid box centers and dimension were set according to the protein [
39]. The molecular docking was carried out with replicates. Molecular docking calculations with each of the proteins were performed for all compounds using AutoDock Vina v.1.1.281. [
39]. We further visually inspected all binding poses for a given ligand, and only poses with the lowest root-mean-square deviation (RMSD) values were considered to gain higher docking accuracy of. The Lamarckian genetic algorithm was used during the docking process to explore the best conformational space for each ligand. All other parameters were set as default.
where ΔG = docking energy; R = 1.98719 cal K
−1 mol
−1; and T = 298.15 K.
The lowest binding free energy (i.e., the best score for the docking pose with the lowest RMSD) was used to predict the highest ligand/protein affinity. The AutoDock Vina docking scores of these selected constituents (which ranked higher among the phytoconstituents or better than the control inhibitor) were further used to calculate the predicted inhibition constants (Ki values) of the selected compounds against a given target. Specific intermolecular interactions with the targets were further visualized using BIOVIA Discovery Studio Visualizer v.4.5 (Accelrys).
4.3. Molecular Dynamics (MD) Simulations
For the MD simulations of the protein–drug complex, the Gromacs 5.1.4 software package was used. The lowest energy structures for the protein–ligand complex (as obtained from molecular docking) were used as the starting structure for MD simulations. AmberTools12 was used to parameterize the Z-guggulsterone molecule in the framework of the general Amber force field (GAFF) and AM1-BCC charges. The AMBER99SB-ILDN force field format was selected for the topology parameters of proteins. The complex was solvated in a cubical box with explicit water molecules. Periodic boundary conditions and the TIP3P water model were used. For neutralization of the system, Na+ ions were added. To remove steric clashes and for optimization, the steepest descent energy minimization method was used. Two-phase equilibration was performed: a 100 ps (canonical) NVT equilibration and 100 ps (thermal-isobaric) NPT equilibration. The LINCS algorithm was used to apply the position-restrained dynamics to the complex. MD simulation was performed for 50 ns and snapshots were taken every 10 ps. The Verlet algorithm was used (coupling constant of 0.1 ps) and the temperature was kept constant at 300 K. Standard pressure (1 bar) was maintained with a Parrinello–Rahman barostat (coupling constant of 2 ps). For the integration of equations of motion, a time step of 2 fs was used. For Lennard-Jones and Coulomb interactions, the cut-off distance was 1.4 nm and the electrostatic interactions were calculated using the particle mesh Ewald (PME) method. For Fourier transformation, the grid spacing was set at 0.16 nm. LigPlot was used for the analysis of hydrophobic interactions and hydrogen bonding between the protein and ligand.
4.4. Free Binding Energy Calculations
Computation of ligand-free binding energies was performed using the MM/PBSA method (g_mmpbsa in the GROMACS tool). This feature analyzes all parameters of the energy for the protein and ligand in an aqueous solvent and, therefore, gives an idea of the free energy of binding of the ligand associated with the protein. To calculate the free binding energy for
Z-guggulsterone complexed with the selected proteins, coordinates saved from the last 10 ns (41–50 ns) of the MD simulation runs were used. The binding free energy (ΔG
bind) for the protein–ligand complex in aqueous solvent was calculated using the following equation:
where G
complex denotes the energy of the protein–ligand complex, and G
protein and G
ligand are the energies of the protein and ligand, respectively. The free energy for each of the above was calculated as follows:
where G
x can be G
ligand, G
protein or G
complex; E
bonded denotes the energy contributed by bonded interactions and is always equal to zero; E
vdw represents the van der Waals energy; and E
elec denotes the electrostatic energy. G
polar is the electrostatic solvation free energy and G
non-polar is the apolar solvation free energy. SASA is the solvent-accessible surface area, γ is a surface tension coefficient and b is the fitting parameter.
4.5. Cell Culture
The human hepatoma (HepG2, Hep3B, and Huh7) cell lines were purchased from the National Centre for Cell Science (NCCS), Pune, India. Primary hepatocytes were procured from American Type Culture Collection (ATCC), USA. HepG2, Hep3B and Huh7 cells were grown in culture flasks (Nunclon, Denmark) and maintained in DMEM supplemented with 10% FBS and 1% PenStrep solution in a humidified 5% CO2 incubator at 37 °C. For the cultivation of primary hepatocyte (THLE-2) cells, DMEM/F-12 media were used. The final growth medium consisted of the following: DMEM/F-12 with 10% FBS, 5 ng/mL EGF and 70 ng/mL phosphoethanolamine. THLE-2 cells require a special coating medium, which consists of the following: DMEM/F-12 without glutamine supplemented with BSA (heat shock fraction) and type I collagen peptide. Before seeding the coating, the medium was aspirated. Sub-confluent cells were harvested using 0.25% trypsin–EDTA and cells were re-suspended in complete media and counted using a haemocytometer. Each experimental data point represents the mean of triplicate wells from three independent experiments.
4.5.1. MTT Assay
The MTT assay was performed to evaluate the viability of cells. A total of 1 × 10⁴ cells were seeded in a 96-well plate and allowed to adhere for 24 h. Active constituents from DuK (Z-guggulsterone (12.5–100 μM), dehydrocostus lactone (2–16 μM) and crocin (0.4–12.8 mg/mL)) were diluted in culture medium and added to the wells. Cells with no added treatment were used as a control. 24 h after treatment, a working solution of MTT (0.5 mg/mL) was added and incubated for 4 h at 37 °C. The MTT was discarded and DMSO was added in the dark, followed by incubation of 15 min. Regorafenib (1–8 μM) was used as a positive control. Formazan was quantified at 570 nm using a NanoDrop (Wilmington, DE, USA). The cellular morphological changes were observed under ×10 magnification (Nikon Eclipse Ti-U inverted microscope, Nikon Instruments Inc., Melville, NY, USA) using advanced research software (Nikon NIS).
4.5.2. Scratch Test Assay
Cells were seeded in 6-well plates and cultured (37 °C) until 100% confluence, then scratched using a 200 μL pipette tip when the cells covered the well. The cells were washed with PBS twice to clear the floating cells and the sub-IC
50 concentration of the active constituents of Duk was added. Images were captured at 0 and 24 h under ×10 magnification (Nikon Eclipse Ti-U inverted microscope) using advanced research software (Nikon NIS). The pictures were evaluated using Image J 1.52a software (Wayne Rasband, National Institute of Health, Bethesda, MD, USA). The data were recorded and analyzed using the following equation:
4.6. Colony Formation Assay
Huh7 cells were seeded into 6-well plates at a density of 800 cells/well and incubated for 24 h. After 24 h, the cells were treated with IC30, IC40 and IC50 values of Z-guggulsterone or a vehicle alone. Cells were incubated for an additional 8 days to allow colonies to form. After incubation, the cells were fixed with 100% methanol for 30 min at room temperature, and the plates were air-dried. The colonies were stained with 1% Coomassie blue stain, washed to remove the excess dye and imaged. The data are presented as percentages of the control group.
4.7. Anti-Oxidant Activity of Z-Guggulsterone
4.7.1. DPPH Radical Scavenging Assay
A 0.1 mM methanolic solution of DPPH was prepared and added to different concentrations (0.25–8 μM) of
Z-guggulsterone. Each mixture was vortexed and allowed to rest in the dark at room temperature for 30 min. The decrease in the absorbance was measured with spectrophotometric monitoring at 517 nm. Ascorbic acid was used as a positive control. Percentage inhibition of the DPPH radical was calculated using the following equation:
where OD
control is the absorbance of the control and OD
sample is the absorbance of the
Z-guggulsterone/ascorbic acid. Percentage inhibition was plotted against concentration. All experiments were performed in triplicate.
4.7.2. Ferrous Reducing Antioxidant Power (FRAP) Assay
One milliliter of solution containing different concentrations (320–1280 μM) of Z-guggulsterone, 2.5 mL of potassium buffer (0.2 M) and 2.5 mL of 1% potassium ferricyanide solution were added into test tubes. The reaction mixtures were incubated for 20 min at 50 °C to complete the reaction. After incubation, 2.5 mL of 10% trichloroacetic acid solution was added to the test tubes. Each mixture was centrifuged at 700× g for 10 min. Then, 2.5 mL of supernatant was withdrawn and 2.5 mL of distilled water and 0.5 mL of 0.1% ferric chloride solution were added to it. The solution mixture without Z-guggulsterone was treated as a blank. The absorbance of the solution was measured at 700 nm using a spectrophotometer against the blank. The experiment was repeated three times at each concentration.
4.8. Gene Expression Analysis by qRTPCR
Huh7 cells were cultured in 60 mm dishes and treated with a sub-IC
50 concentration of
Z-guggulsterone for 24 h. Cells were washed with PBS and extracted with TRI reagent. Total RNA was isolated, following the protocol of Sarwat and Naqvi [
40]. RNA was dissolved in 30 μL nuclease-free water. The isolated RNAs were analyzed by electrophoresis on a 1% agarose gel. RNA was quantified with a NanoDrop (NanoDrop Technologies, Wilmington, DE, USA) and the concentration of RNA was calculated from the optical density at 260 nm. The purity of RNA was determined using 260 nm/280 nm of absorbance. Further, cDNA was synthesized from total RNA templates using a High Capacity cDNA kit. RNA was reverse transcribed using 1000 ng of total RNA and 10X RT primers following the manufacturer’s instructions. The cDNA synthesized was stored at −20 °C for later use as a template for qRT-PCR.
To study the expression profiles of the selected genes (based on in silico studies), quantitative real-time PCR was used on the untreated control and the cells treated with a sub-IC
50 concentration of
Z-guggulsterone. In each reaction mixture, 1μL (~50 ng) cDNA was used with gene-specific forward and reverse primers (
Supplementary Materials Table S4), along with the SYBR Green master mix. A Step OneTM Real-Time PCR System (Applied Biosystems, Foster City, CA, USA) was used for the assessment of the samples. Along with the gene of interest, β-actin was run as a reference control to normalize gene expression. The reaction procedure utilized a duration of 10 min at 95 °C, followed by 45 cycles at 95 °C (15 s) and 60 °C for 1 min. All the experiments were performed in triplicate, along with negative and positive controls. The expression fold change was calculated with reference to the normal control group based on the threshold cycle (CT) values by using the following formula:
4.9. Cell Cycle Analysis
Huh7 cells (1 × 10⁶ /well) cells were cultured in 6-well plates in the presence of Z-guggulsterone (0, 10 and 18 μM) for 24 h. After treatment, cells were harvested and fixed with 70% ethanol at 4 °C for 2 h. After fixing, the cells were washed twice with PBS and centrifuged at 850× g for 5 min at 4 °C. The pellet was broken up by vortexing and then re-suspended in PBS containing 100 μg/mL RNase A and 50 μg/mL propidium iodide (PI) and incubated for a further 30 min in the dark. Finally, the cells were analyzed using flow cytometry (BD FACS Calibur, BD Biosciences, San Jose, CA, USA).
4.10. Statistical Analysis
All experimental results are from at least three identical experiments and expressed as means ± standard deviation. Data were analyzed using GraphPad (version 5.01, San Diego, CA, USA) and compared using regression analysis and two-way ANOVA. Differences between control and treatment groups were determined at a significance level of p > 0.05.


 ,
, 


