
Quantification of Spent Coffee Ground Extracts by Roast and Brew Method, and Their Utility in a Green Synthesis of Gold and Silver Nanoparticles


Abstract
:1. Introduction
2. Materials and Methods
2.1. Materials
2.2. Coffee Bean Preparation
2.3. Initial Coffee Brewing
2.4. Spent Coffee Extract Preparation
2.5. HPLC Analysis
2.6. Total Antioxidant Capacity Measurements
2.6.1. ABTS Assay
2.6.2. DPPH Assay
2.6.3. Folin-Ciocalteu Assay (TPC)
2.6.4. Ferric Ion Reducing Antioxidant Power (FRAP)
2.6.5. Silver and Gold Nanoparticle Synthesis and Preparation
2.6.6. UV-Vis Absorption Spectroscopy
2.6.7. SEM Imaging
2.6.8. Statistical Analysis
3. Results and Discussion
3.1. Total CQA Concentration
3.2. Total Antioxidant Capabilities (TAC)
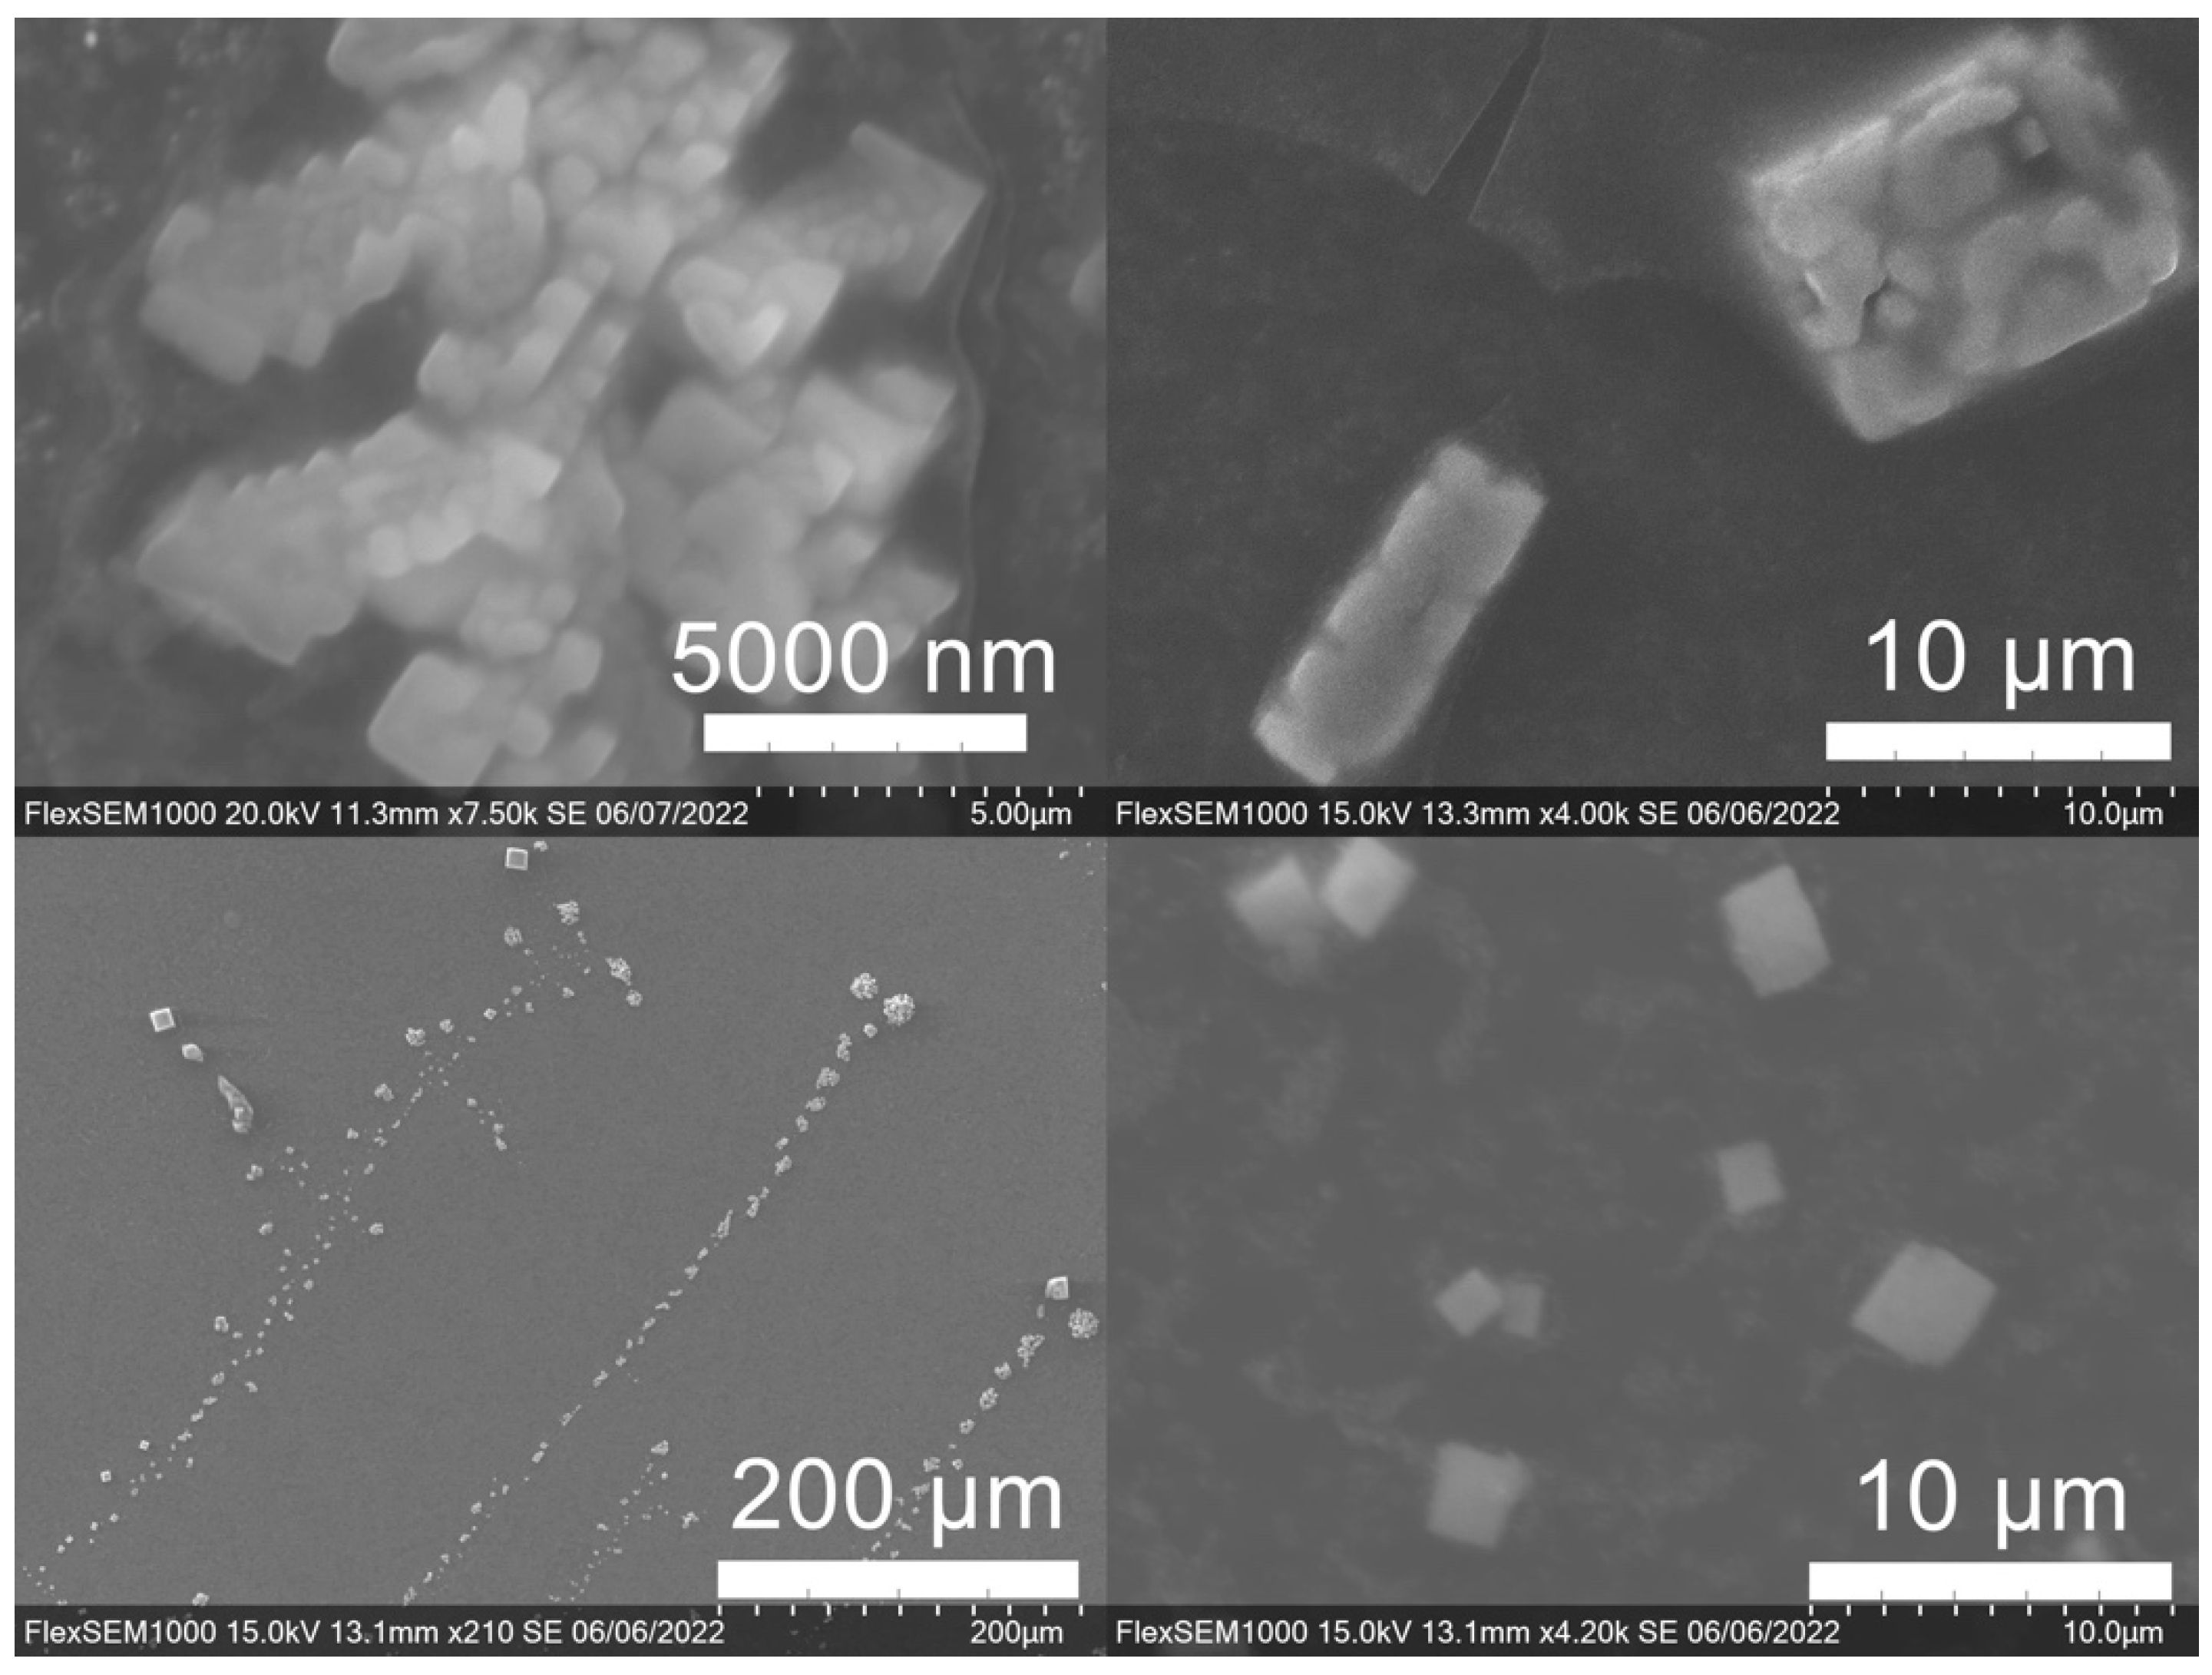
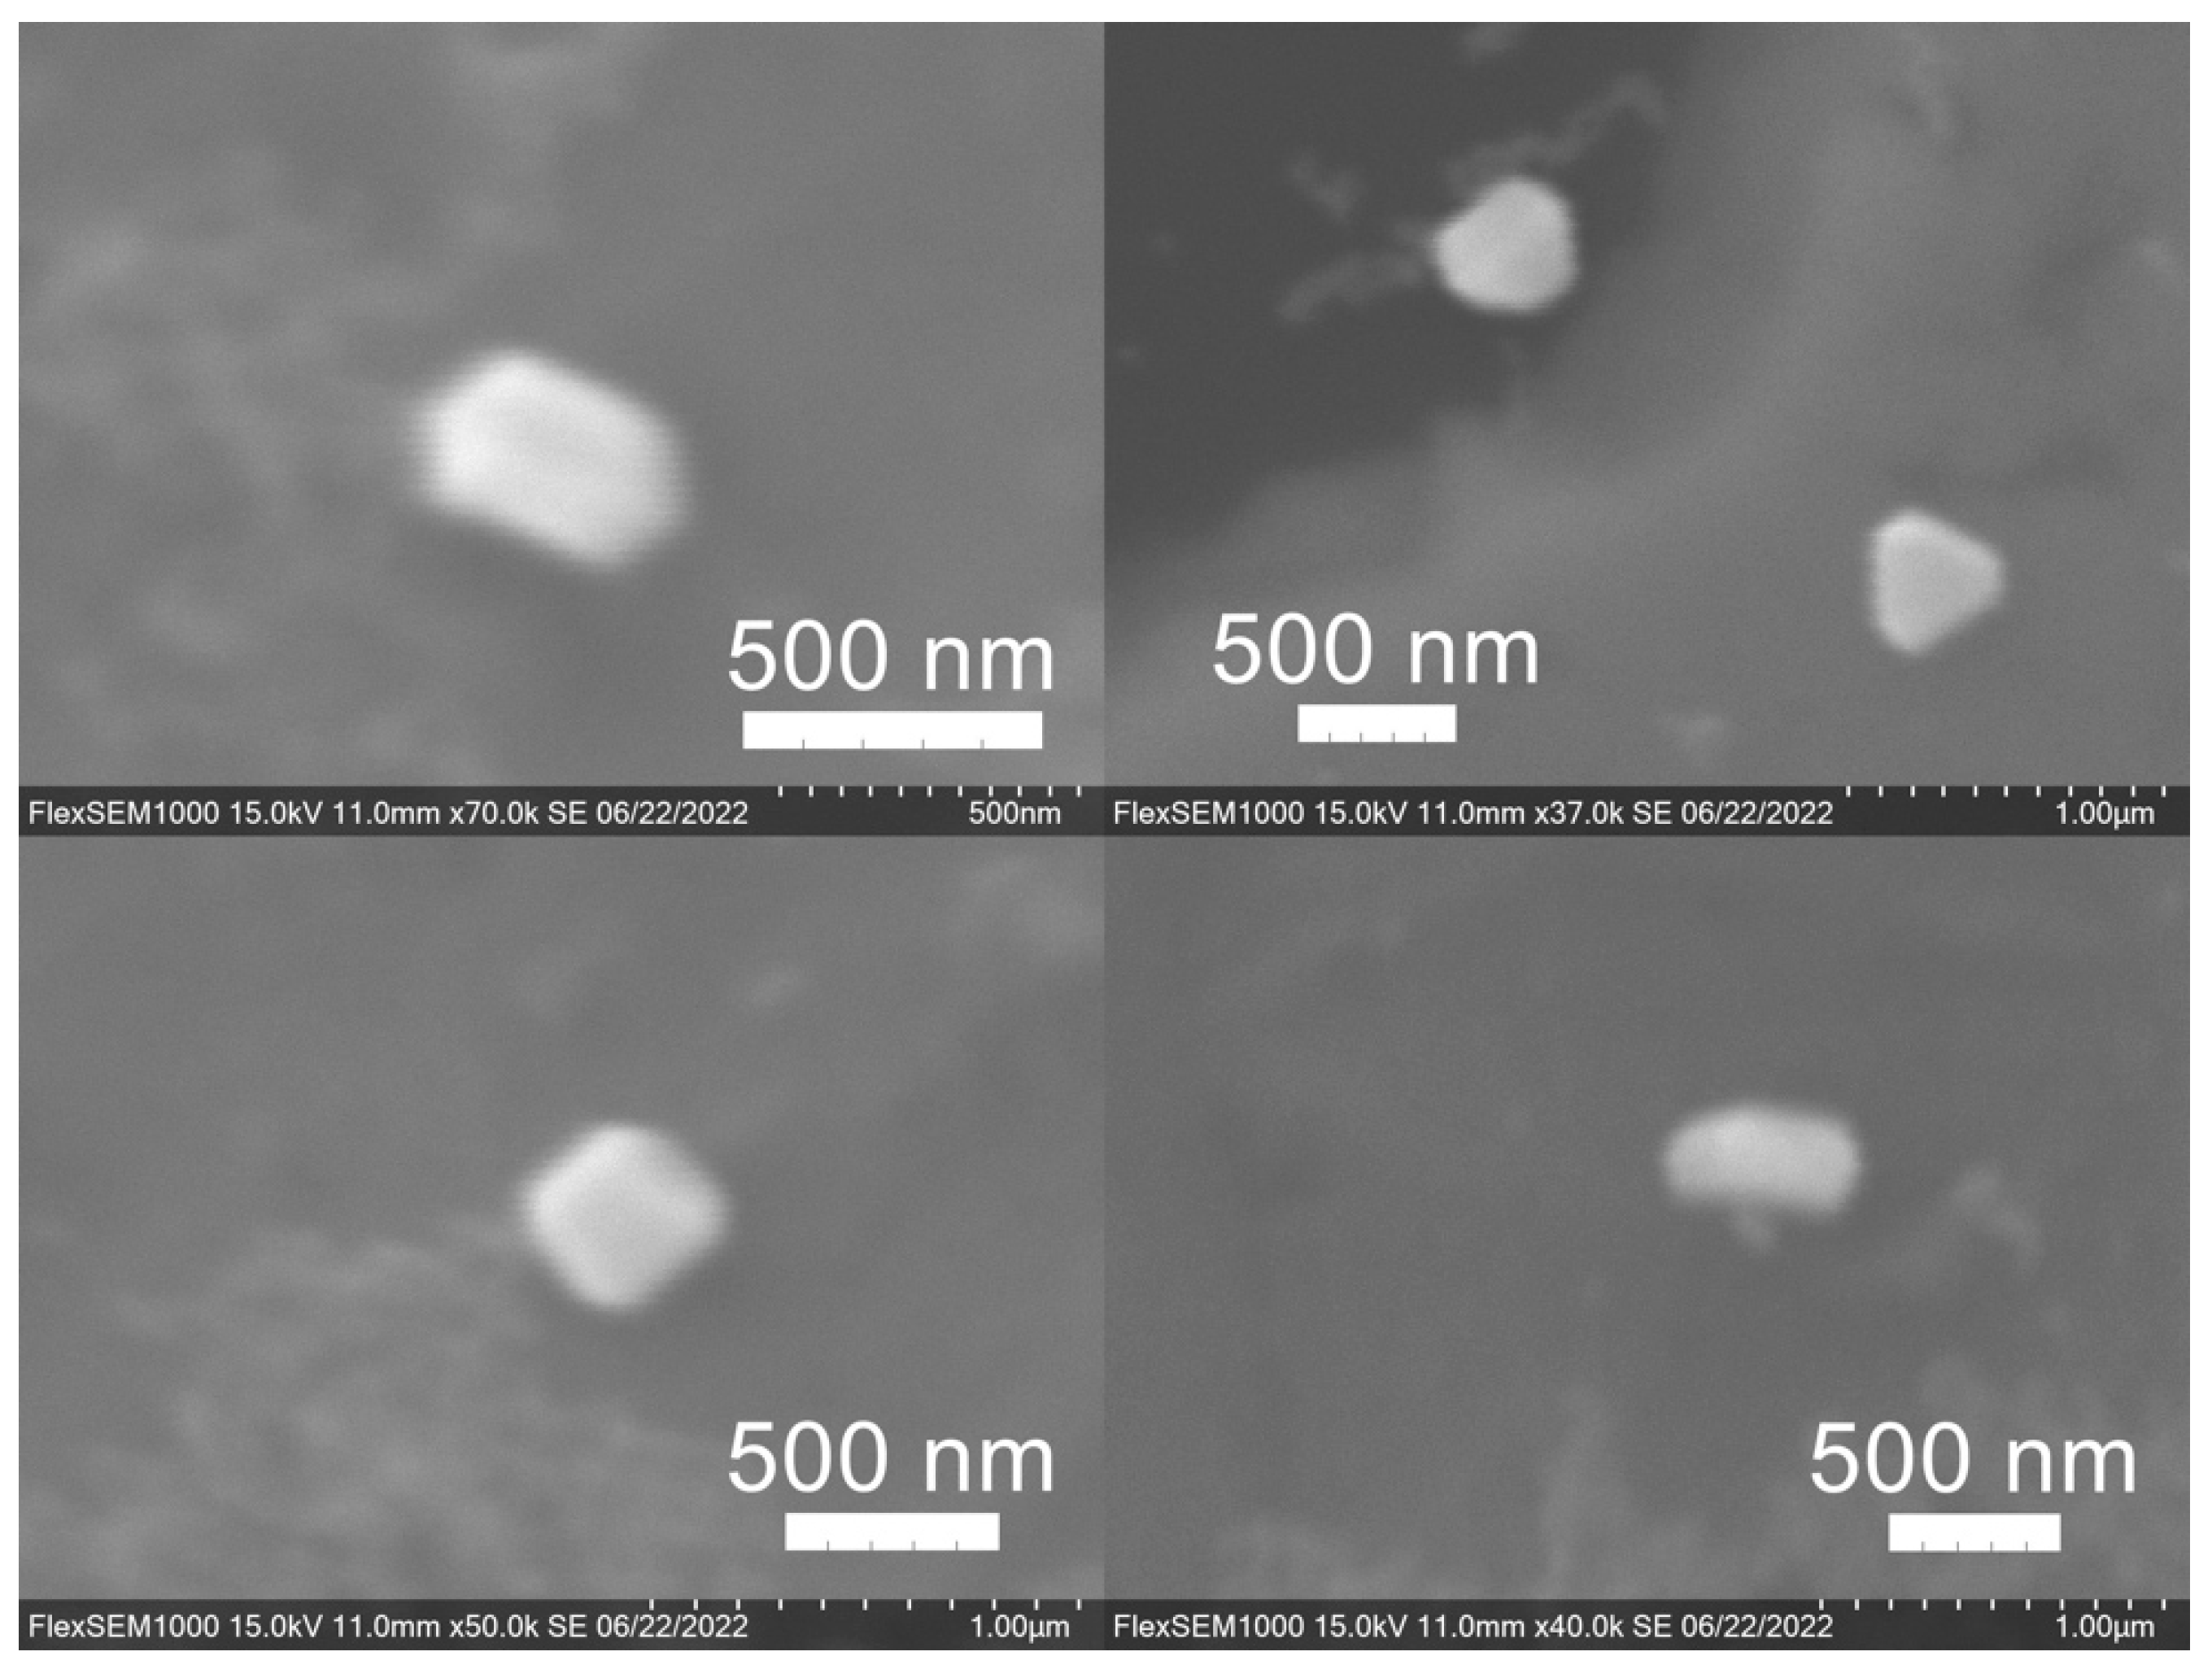
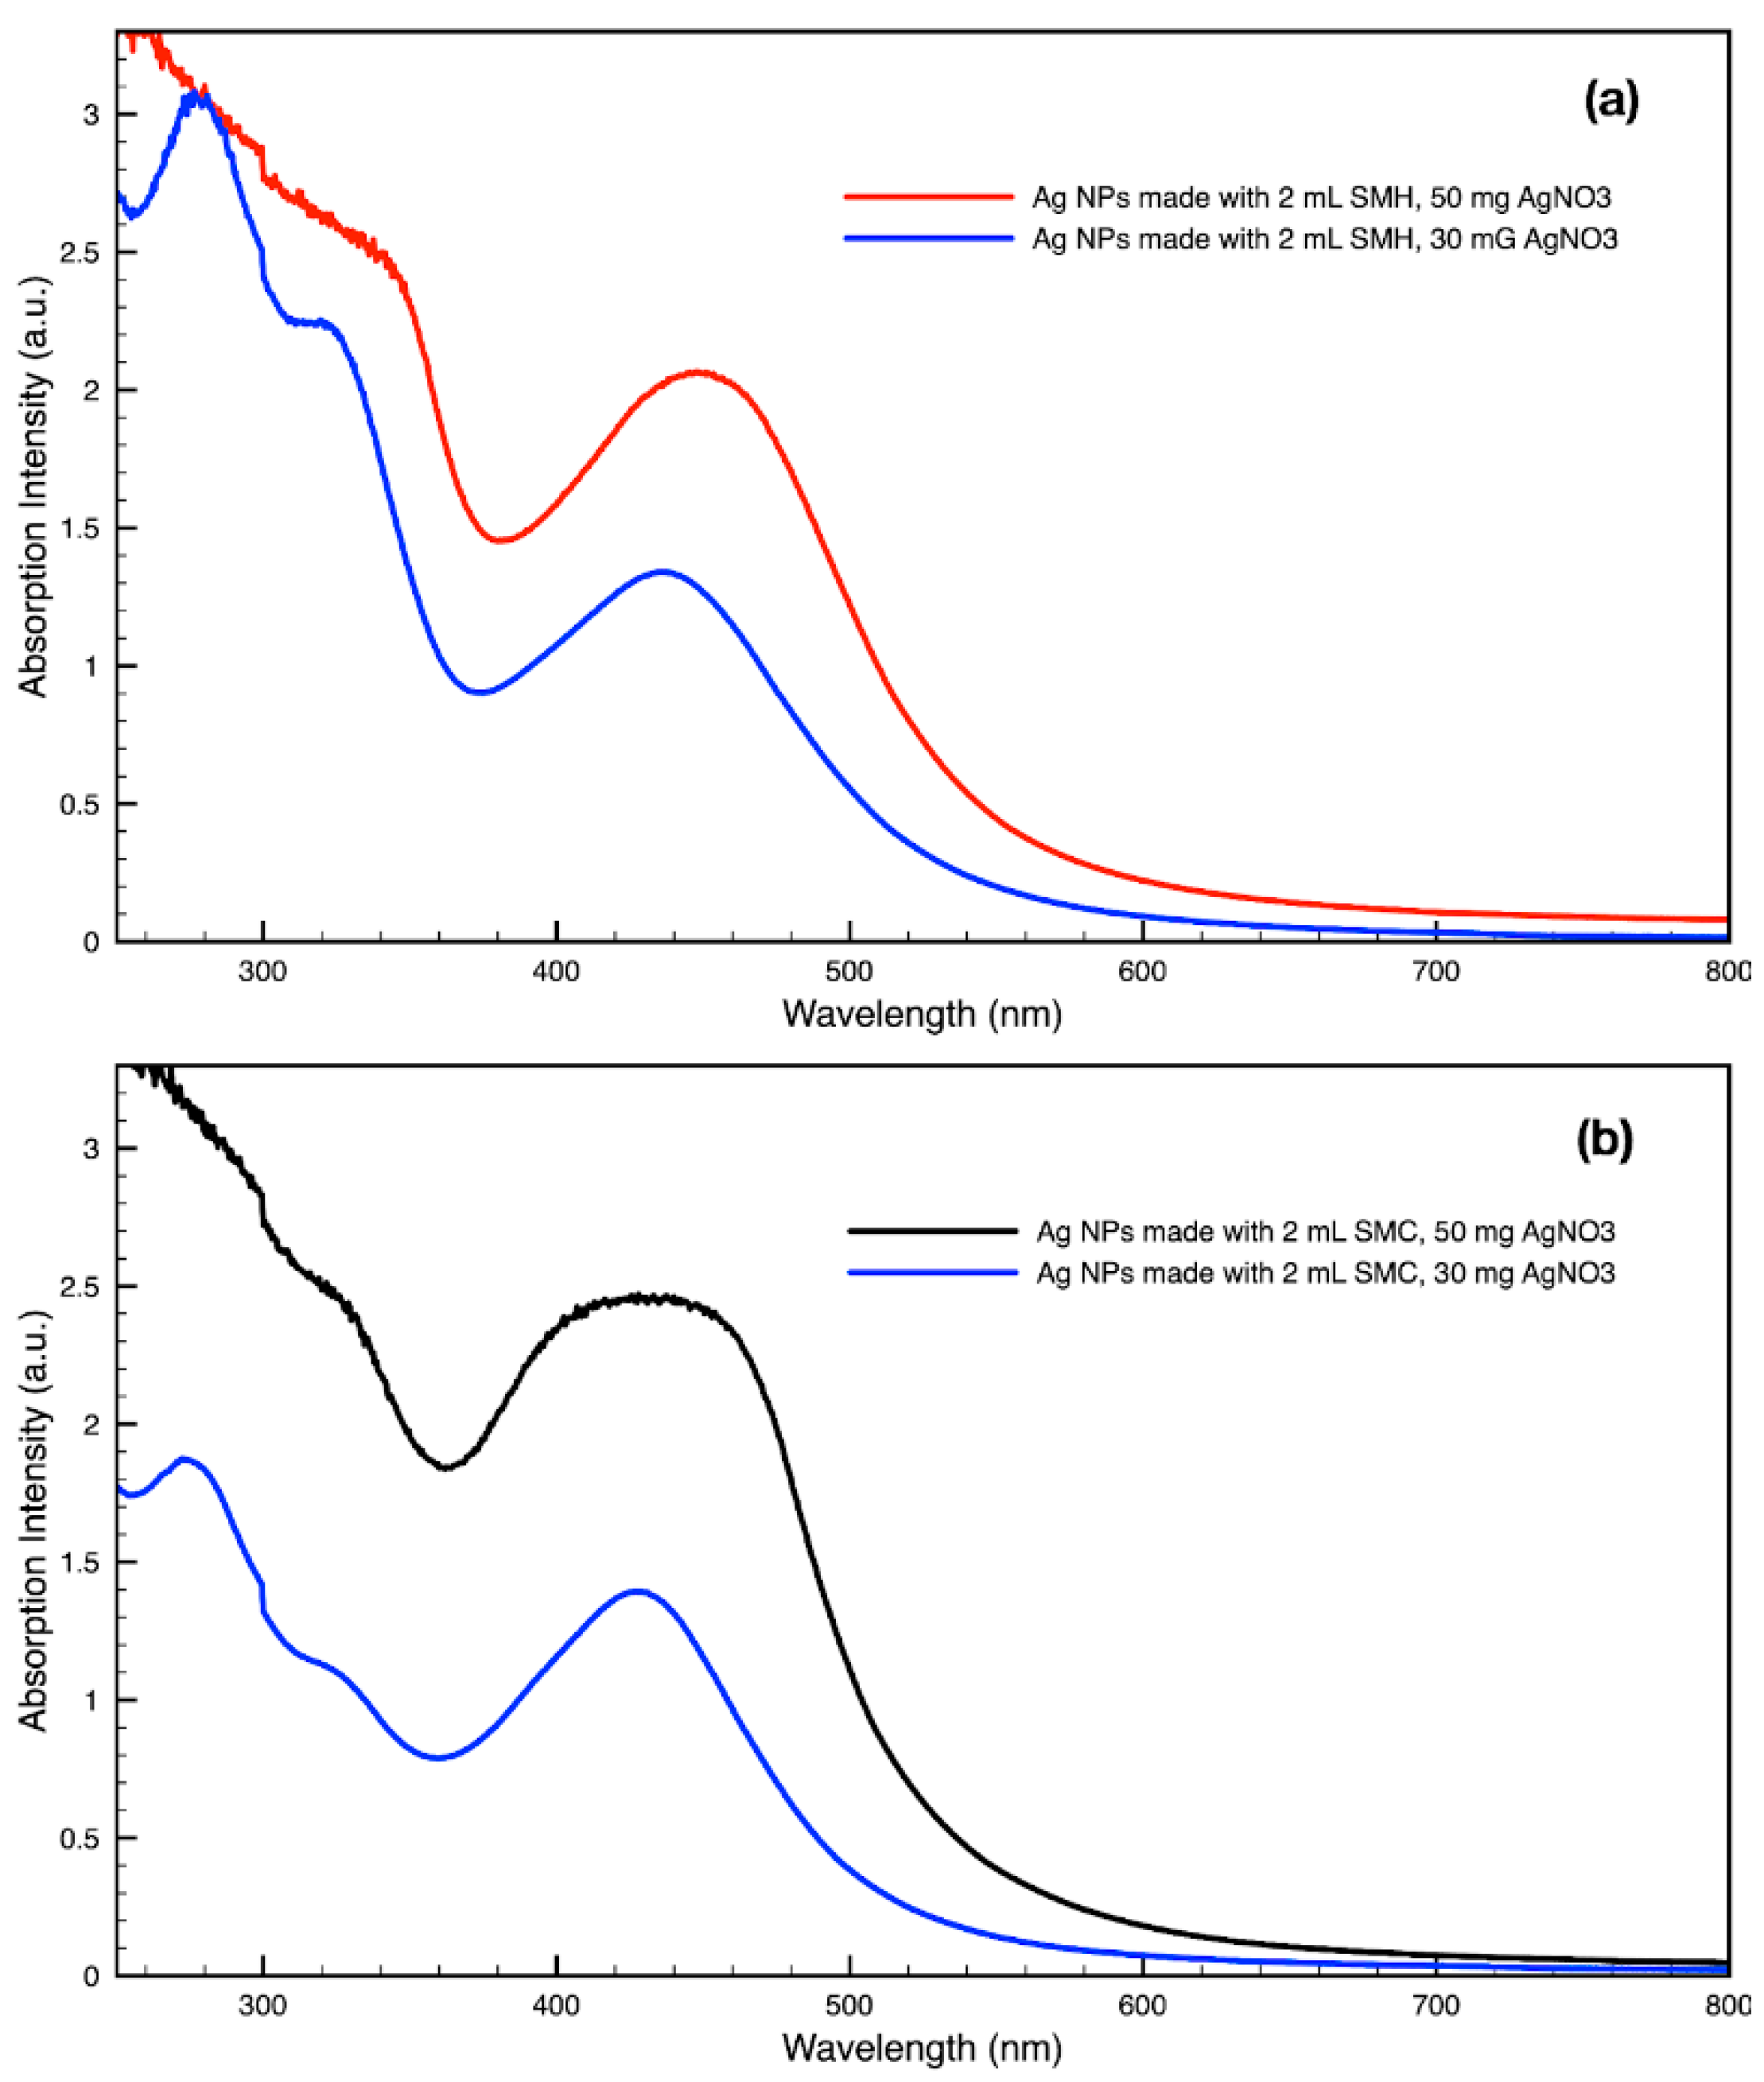
3.3. Green Synthesis of Nanoparticles
4. Conclusions
Author Contributions
Funding
Institutional Review Board Statement
Informed Consent Statement
Data Availability Statement
Acknowledgments
Conflicts of Interest
References
- International Coffee Organization. Trade Statistics Tables. 2021. Available online: https://www.ico.org/trade_statistics.asp?section=Statistics (accessed on 24 June 2022).
- National Coffee Association. NCA-SCA 2022 Consumption Report; National Coffee Association: New York, NY, USA, 2022. [Google Scholar]
- Bhandarkar, N.S.; Brown, L.; Panchal, S.K. Chlorogenic acid attenuates high-carbohydrate, high-fat diet–induced cardiovascular, liver, and metabolic changes in rats. Nutr. Res. 2019, 62, 78–88. [Google Scholar] [CrossRef] [PubMed]
- Farah, A.; de Paula Lima, J. Consumption of Chlorogenic Acids through Coffee and Health Implications. Beverages 2019, 5, 11. [Google Scholar] [CrossRef]
- Pizzino, G.; Irrera, N.; Cucinotta, M.; Pallio, G.; Mannino, F.; Arcoraci, V.; Squadrito, F.; Altavilla, D.; Bitto, A. Oxidative Stress: Harms and Benefits for Human Health. Oxid. Med. Cell. Longev. 2017, 2017, 8416763. [Google Scholar] [CrossRef] [PubMed]
- Baghaienezhad, M.; Boroghani, M.; Anabestani, R. Silver nanoparticles Synthesis by coffee residues extract and their antibacterial activity. Nanomed. Res. J. 2020, 5, 29–34. [Google Scholar]
- Dhand, V.; Soumya, L.; Bharadwaj, S.; Chakra, S.; Bhatt, D.; Sreedhar, B. Green synthesis of silver nanoparticles using Coffea arabica seed extract and its antibacterial activity, Mater. Sci. Eng. C Mater. Biol. Appl. 2016, 58, 36–43. [Google Scholar] [CrossRef]
- Nadagouda, M.N.; Varma, R.S. Green synthesis of silver and palladium nanoparticles at room temperature using coffee and tea extract. Green Chem. 2008, 10, 859–862. [Google Scholar] [CrossRef]
- Abbasian, R.; Jafarizadeh-Malmiri, H. Green approach in gold, silver and selenium nanoparticles using coffee bean extract. Open Agric. 2020, 5, 761–767. [Google Scholar] [CrossRef]
- Wang, G.; Zhao, K.; Gao, C.; Wang, J.; Mei, Y.; Zheng, X.; Zhu, P. Green synthesis of copper nanoparticles using green coffee bean and their applications for efficient reduction of organic dyes. J. Environ. Chem. Eng. 2021, 9, 105331. [Google Scholar] [CrossRef]
- Fardood, S.T.; Ramazani, A. Green synthesis and characterization of copper oxide nanoparticles using coffee powder extract. J. Nanostruct. 2016, 6, 167–171. Available online: http://jns.kashanu.ac.ir/article_15495.html (accessed on 5 July 2022).
- El-Desouky, N.; Shoueir, K.; El-Mehasseb, I.; El-Kemary, M. Synthesis of silver nanoparticles using bio valorization coffee waste extract: Photocatalytic flow-rate performance, antibacterial activity, and electrochemical investigation. Biomass Convers. Biorefin. 2022, 1–15. [Google Scholar] [CrossRef]
- Abel, S.; Tesfaye, J.L.; Shanmugam, R.; Dwarampudi, L.P.; Lamessa, G.; Nagaprasad, N.; Krishnaraj, R. Green Synthesis and Characterizations of Zinc Oxide (ZnO) Nanoparticles Using Aqueous Leaf Extracts of Coffee (Coffea arabica) and Its Application in Environmental Toxicity Reduction. J. Nanomater. 2021, 2021, 3413350. [Google Scholar] [CrossRef]
- Sharma, V.K.; Yngard, R.A.; Lin, Y. Silver nanoparticles: Green synthesis and their antimicrobial activities. Adv. Colloid Interface Sci. 2009, 145, 83–96. [Google Scholar] [CrossRef] [PubMed]
- Kwon, M.J.; Lee, J.; Wark, A.W.; Lee, H.J. Nanoparticle-enhanced surface plasmon resonance detection of proteins at attomolar concentrations: Comparing different nanoparticle shapes and sizes. Anal. Chem. 2012, 84, 1702–1707. [Google Scholar] [CrossRef]
- Bindhu, M.R.; Umadevi, M. Antibacterial and catalytic activities of green synthesized silver nanoparticles, Spectrochim. Acta A Mol. Biomol. Spectrosc. 2015, 135, 373–378. [Google Scholar] [CrossRef] [PubMed]
- Castro, J.R.; García-Hernández, L.; Ortega, P.A.R.; Islas, D.A. Green Synthesis of Gold Nanoparticles (AuNPs) by Cupressus Goveniana Extract. ECS Trans. 2018, 84, 207. [Google Scholar] [CrossRef]
- Herizchi, R.; Abbasi, E.; Milani, M.; Akbarzadeh, A. Current methods for synthesis of gold nanoparticles. Artif. Cells Nanomed. Biotechnol. 2016, 44, 596–602. [Google Scholar] [CrossRef] [PubMed]
- Khan, I.; Saeed, K.; Khan, I. Nanoparticles: Properties, applications and toxicities. Arab. J. Chem. 2019, 12, 908–931. [Google Scholar] [CrossRef]
- Quaresma, P.; Soares, L.; Contar, L.; Miranda, A.; Osório, I.; Carvalho, P.A.; Franco, R.; Pereira, E. Green photocatalytic synthesis of stable Au and Ag nanoparticles. Green Chem. 2009, 11, 1889–1893. [Google Scholar] [CrossRef]
- Chen, X.; Zhao, X.; Gao, Y.; Yin, J.; Bai, M.; Wang, F. Green Synthesis of Gold Nanoparticles Using Carrageenan Oligosaccharide and Their In Vitro Antitumor Activity. Mar. Drugs 2018, 16, 277. [Google Scholar] [CrossRef] [PubMed]
- Fan, M.; Han, Y.; Gao, S.; Yan, H.; Cao, L.; Li, Z.; Liang, X.-J.; Zhang, J. Ultrasmall gold nanoparticles in cancer diagnosis and therapy. Theranostics 2020, 10, 4944–4957. [Google Scholar] [CrossRef] [PubMed]
- Rajeshkumar, S. Anticancer activity of eco-friendly gold nanoparticles against lung and liver cancer cells. J. Genet. Eng. Biotechnol. 2016, 14, 195–202. [Google Scholar] [CrossRef] [PubMed]
- Fuller, M.; Whiley, H.; Köper, I. Antibiotic delivery using gold nanoparticles. SN Appl. Sci. 2020, 2, 1022. [Google Scholar] [CrossRef]
- Dreaden, E.C.; Alkilany, A.M.; Huang, X.; Murphy, C.J.; El-Sayed, M.A. The golden age: Gold nanoparticles for biomedicine. Chem. Soc. Rev. 2012, 41, 2740–2779. [Google Scholar] [CrossRef] [PubMed]
- Ahmad, S.; Ahmad, H.; Khan, I.; Alghamdi, S.; Almehmadi, M.; Ali, M.; Ullah, A.; Hussain, H.; Khan, N.M.; Ali, F.; et al. Green synthesis of gold nanaoparticles using Delphinium Chitralense tuber extracts, their characterization and enzyme inhibitory potential. Braz. J. Biol. 2022, 82, e257622. [Google Scholar] [CrossRef]
- Saeed, K.; Ahmad, S.; Ahmad, H.; Ullah, F.; Sadiq, A.; Uddin, A.; Khan, I.; Ahmad, M. Green synthesis, characterization and cholinesterase inhibitory potential of gold nanoparticles. J. Mex. Chem. Soc. 2021, 65, 416–423. [Google Scholar]
- Simončič, B.; Klemenčič, D. Preparation and performance of silver as an antimicrobial agent for textiles: A review. Text. Res. J. 2016, 86, 210–223. [Google Scholar] [CrossRef]
- Hebeish, A.; El-Naggar, M.E.; Fouda, M.M.G.; Ramadan, M.A.; Al-Deyab, S.S.; El-Rafie, M.H. Highly effective antibacterial textiles containing green synthesized silver nanoparticles. Carbohydr. Polym. 2011, 86, 936–940. [Google Scholar] [CrossRef]
- Ravindra, S.; Mohan, Y.M.; Reddy, N.N.; Raju, K.M. Fabrication of antibacterial cotton fibres loaded with silver nanoparticles via “Green Approach,” Colloids Surf. A Physicochem. Eng. Asp. 2010, 367, 31–40. [Google Scholar] [CrossRef]
- Bui, V.; Park, D.; Lee, Y.-C. Chitosan Combined with ZnO, TiO2 and Ag Nanoparticles for Antimicrobial Wound Healing Applications: A Mini Review of the Research Trends. Polymers 2017, 9, 21. [Google Scholar] [CrossRef]
- Kumar, S.S.D.; Rajendran, N.K.; Houreld, N.N.; Abrahamse, H. Recent advances on silver nanoparticle and biopolymer-based biomaterials for wound healing applications. Int. J. Biol. Macromol. 2018, 115, 165–175. [Google Scholar] [CrossRef]
- Ahn, E.-Y.; Jin, H.; Park, Y. Assessing the antioxidant, cytotoxic, apoptotic and wound healing properties of silver nanoparticles green-synthesized by plant extracts. Mater. Sci. Eng. C 2019, 101, 204–216. [Google Scholar] [CrossRef] [PubMed]
- Elmaaty, T.A.; El-Nagare, K.; Raouf, S.; Abdelfattah, K.; El-Kadi, S.; Abdelaziz, E. One-step green approach for functional printing and finishing of textiles using silver and gold NPs. RSC Adv. 2018, 8, 25546–25557. [Google Scholar] [CrossRef] [PubMed]
- Salem, S.; Salem, S.S.; L-Belely, E.F.E.; Niedbała, G.; Alnoman, M.M.; Hassan, S.E.-D.; Eid, A.M.; Shaheen, T.I.; Elkelish, A.; Fouda, A. Bactericidal and In-Vitro Cytotoxic Efficacy of Silver Nanoparticles (Ag-NPs) Fabricated by Endophytic Actinomycetes and Their Use as Coating for the Textile Fabrics. Nanomaterials 2020, 10, 2082. [Google Scholar] [CrossRef]
- Ghouri, Z.K.; Al-Meer, S.; Barakat, N.A.M.; Kim, H.Y. ZnO@C (core@shell) microspheres derived from spent coffee grounds as applicable non-precious electrode material for DMFCs. Sci. Rep. 2017, 7, 1738. [Google Scholar] [CrossRef] [PubMed]
- Sutradhar, P.; Debnath, N.; Saha, M. Microwave-assisted rapid synthesis of alumina nanoparticles using tea, coffee and triphala extracts. Adv. Manuf. 2013, 1, 357–361. [Google Scholar] [CrossRef]
- Crista, D.M.A.; el Mragui, A.; Algarra, M.; da Silva, J.C.G.E.; Luque, R.; da Silva, L.P. Turning Spent Coffee Grounds into Sustainable Precursors for the Fabrication of Carbon Dots. Nanomaterials 2020, 10, 1209. [Google Scholar] [CrossRef]
- Noh, H.J.; Kim, H.-S.; Jun, S.H.; Kang, Y.-H.; Cho, S.; Park, Y. Biogenic silver nanoparticles with chlorogenic acid as a bioreducing agent. J. Nanosci. Nanotechnol. 2013, 13, 5787–5793. [Google Scholar] [CrossRef]
- Zhu, S.; Shen, Y.; Yu, Y.; Bai, X. Synthesis of antibacterial gold nanoparticles with different particle sizes using chlorogenic acid. R Soc. Open Sci. 2020, 7, 191141. [Google Scholar] [CrossRef]
- Chen, R.; Wu, S.; Meng, C. Size-tunable green synthesis of platinum nanoparticles using chlorogenic acid. Res. Chem. Intermed. 2021, 47, 1775–1787. [Google Scholar] [CrossRef]
- Chen, R.; Yi, G.; Wu, S.; Meng, C. Controlled green synthesis of Au–Pt bimetallic nanoparticles using chlorogenic acid. Res. Chem. Intermed. 2021, 47, 4051–4066. [Google Scholar] [CrossRef]
- Campos-Vega, R.; Loarca-Piña, G.; Vergara-Castañeda, H.A.; Oomah, B.D. Spent coffee grounds: A review on current research and future prospects. Trends Food Sci. Technol. 2015, 45, 24–36. [Google Scholar] [CrossRef]
- Saratale, G.D.; Bhosale, R.; Shobana, S.; Banu, J.R.; Pugazhendhi, A.; Mahmoud, E.; Sirohi, R.; Bhatia, S.K.; At-abani, A.E.; Mulone, V.; et al. A review on valorization of spent coffee grounds (SCG) towards biopolymers and biocatalysts production. Bioresour. Technol. 2020, 314, 123800. [Google Scholar] [CrossRef] [PubMed]
- Janda, K.; Jakubczyk, K.; Baranowska-Bosiacka, I.; Kapczuk, P.; Kochman, J.; Rębacz-Maron, E.; Gutowska, I. Mineral Composition and Antioxidant Potential of Coffee Beverages Depending on the Brewing Method. Foods 2020, 9, 121. [Google Scholar] [CrossRef] [PubMed]
- Fuller, M.; Rao, N.Z. The Effect of Time, Roasting Temperature, and Grind Size on Caffeine and Chlorogenic Acid Concentrations in Cold Brew Coffee. Sci. Rep. 2017, 7, 17979. [Google Scholar] [CrossRef]
- Lee, X.J.; Ong, H.C.; Gao, W.; Ok, Y.S.; Chen, W.-H.; Goh, B.H.H.; Chong, C.T. Solid biofuel production from spent coffee ground wastes: Process optimisation, characterisation and kinetic studies. Fuel 2021, 292, 120309. [Google Scholar] [CrossRef]
- Atabani, A.E.; Al-Muhtaseb, A.H.; Kumar, G.; Saratale, G.D.; Aslam, M.; Khan, H.A.; Said, Z.; Mahmoud, E. Valorization of spent coffee grounds into biofuels and value-added products: Pathway towards integrated bio-refinery. Fuel. 2019, 254, 115640. [Google Scholar] [CrossRef]
- Karmee, S.K. A spent coffee grounds based biorefinery for the production of biofuels, biopolymers, antioxidants and biocomposites. Waste Manag. 2018, 72, 240–254. [Google Scholar] [CrossRef] [PubMed]
- Battista, F.; Barampouti, E.M.; Mai, S.; Bolzonella, D.; Malamis, D.; Moustakas, K.; Loizidou, M. Added-value molecules recovery and biofuels production from spent coffee grounds. Renew. Sustain. Energy Rev. 2020, 131, 110007. [Google Scholar] [CrossRef]
- Atabani, A.E.; Ali, I.; Naqvi, S.R.; Badruddin, I.A.; Aslam, M.; Mahmoud, E.; Almomani, F.; Juchelková, D.; Atelge, M.R.; Khan, T.M.Y. A state-of-the-art review on spent coffee ground (SCG) pyrolysis for future biorefinery. Chemosphere 2022, 286, 131730. [Google Scholar] [CrossRef] [PubMed]
- Bravo, J.; Juániz, I.; Monente, C.; Caemmerer, B.; Kroh, L.W.; de Peña, M.P.; Cid, C. Evaluation of spent coffee obtained from the most common coffeemakers as a source of hydrophilic bioactive compounds. J. Agric. Food Chem. 2012, 60, 12565–12573. [Google Scholar] [CrossRef]
- López-Barrera, D.M.; Vázquez-Sánchez, K.; Loarca-Piña, M.G.F.; Campos-Vega, R. Spent coffee grounds, an innovative source of colonic fermentable compounds, inhibit inflammatory mediators in vitro. Food Chem. 2016, 212, 282–290. [Google Scholar] [CrossRef] [PubMed]
- Cruz, R.; Cardoso, M.M.; Fernandes, L.; Oliveira, M.; Mendes, E.; Baptista, P.; Morais, S.; Casal, S. Espresso coffee residues: A valuable source of unextracted compounds. J. Agric. Food Chem. 2012, 60, 7777–7784. [Google Scholar] [CrossRef] [PubMed]
- Zuorro, A.; Lavecchia, R. Spent coffee grounds as a valuable source of phenolic compounds and bioenergy. J. Clean. Prod. 2012, 34, 49–56. [Google Scholar] [CrossRef]
- Zengin, G.; Sinan, K.I.; Mahomoodally, M.F.; Angeloni, S.; Mustafa, A.M.; Vittori, S.; Maggi, F.; Caprioli, G. Chemical Composition, Antioxidant and Enzyme Inhibitory Properties of Different Extracts Obtained from Spent Coffee Ground and Coffee Silverskin. Foods 2020, 9, 713. [Google Scholar] [CrossRef] [PubMed]
- Pujol, D.; Liu, C.; Gominho, J.; Olivella, M.À.; Fiol, N.; Villaescusa, I.; Pereira, H. The chemical composition of exhausted coffee waste. Ind. Crops Prod. 2013, 50, 423–429. [Google Scholar] [CrossRef]
- Głowacka, R.; Górska, A.; Wirkowska-Wojdyła, M.; Wołosiak, R.; Majewska, E.; Derewiaka, D. The influence of brewing method on bioactive compounds residues in spent coffee grounds of different roasting degree and geographical origin. Int. J. Food Sci. Technol. 2019, 54, 3008–3014. [Google Scholar] [CrossRef]
- Chongsrimsirisakhol, O.; Pirak, T. Total polyphenol content and antioxidant properties of cold brew coffee extracts as affected by ultrasound treatment and their application in low fat pork sausage. Int. J. Food Prop. 2022, 25, 813–826. [Google Scholar] [CrossRef]
- Mussatto, S.I.; Ballesteros, L.F.; Martins, S.; Teixeira, J.A. Extraction of antioxidant phenolic compounds from spent coffee grounds. Sep. Purif. Technol. 2011, 83, 173–179. [Google Scholar] [CrossRef]
- Ozuna, C.; Mulík, S.; Valdez-Rodríguez, B.; Abraham-Juárez, M.d.; Fernández-López, C.L. The effect of organic farming on total phenols, total flavonoids, brown compounds and antioxidant activity of spent coffee grounds from Mexico. Biol. Agric. Hortic. 2020, 36, 107–118. [Google Scholar] [CrossRef]
- Yoo, D.E.; Jeong, K.M.; Han, S.Y.; Kim, E.M.; Jin, Y.; Lee, J. Deep eutectic solvent-based valorization of spent coffee grounds. Food Chem. 2018, 255, 357–364. [Google Scholar] [CrossRef] [PubMed]
- Páscoa, R.N.M.J.; Magalhães, L.M.; Lopes, J.A. FT-NIR spectroscopy as a tool for valorization of spent coffee grounds: Application to assessment of antioxidant properties. Food Res. Int. 2013, 51, 579–586. [Google Scholar] [CrossRef]
- Juarez, G.F.Y.; Pabiloña, K.B.C.; Manlangit, K.B.L.; Go, A.W. Direct dilute acid hydrolysis of spent coffee grounds: A new approach in sugar and lipid recovery. Waste Biomass Valorization 2018, 9, 235–246. [Google Scholar] [CrossRef]
- Kwon, E.E.; Yi, H.; Jeon, Y.J. Sequential co-production of biodiesel and bioethanol with spent coffee grounds. Bioresour. Technol. 2013, 136, 475–480. [Google Scholar] [CrossRef] [PubMed]
- Lee, S.; Qin, L.; Li, O.L. Reducing sugar production from spent coffee grounds using microbubble-assisted synthesis of silica acid catalyst. Catal. Today 2022, 388–389, 3–11. [Google Scholar] [CrossRef]
- Go, A.W.; Conag, A.T.; Cuizon, D.E.S. Recovery of sugars and lipids from spent coffee grounds: A new approach. Waste Biomass Valorization 2016, 7, 1047–1053. [Google Scholar] [CrossRef]
- Mussatto, S.I.; Carneiro, L.M.; Silva, J.P.A.; Roberto, I.C.; Teixeira, J.A. A study on chemical constituents and sugars extraction from spent coffee grounds. Carbohydr. Polym. 2011, 83, 368–374. [Google Scholar] [CrossRef]
- Ribeiro, J.P.; Vicente, E.D.; Gomes, A.P.; Nunes, M.I.; Alves, C.; Tarelho, L.A.C. Effect of industrial and domestic ash from biomass combustion, and spent coffee grounds, on soil fertility and plant growth: Experiments at field conditions. Environ. Sci. Pollut. Res. Int. 2017, 24, 15270–15277. [Google Scholar] [CrossRef] [PubMed]
- Liu, K.; Price, G.W. Evaluation of three composting systems for the management of spent coffee grounds. Bioresour. Technol. 2011, 102, 7966–7974. [Google Scholar] [CrossRef] [PubMed]
- Ragauskaitė, D.; Šlinkšienė, R. Influence of Urea on Organic Bulk Fertilizer of Spent Coffee Grounds and Green Algae Chlorella sp. Biomass. Sustainability 2022, 14, 1261. [Google Scholar] [CrossRef]
- Ciesielczuk, T.; Rosik-Dulewska, C.; Poluszyńska, J.; Miłek, D.; Szewczyk, A.; Sławińska, I. Acute Toxicity of Experimental Fertilizers Made of Spent Coffee Grounds. Waste Biomass Valorization 2018, 9, 2157–2164. [Google Scholar] [CrossRef]
- Mangindaan, D.; Lin, G.-Y.; Kuo, C.-J.; Chien, H.-W. Biosynthesis of silver nanoparticles as catalyst by spent coffee ground/recycled poly(ethylene terephthalate) composites. Food Bioprod. Process. 2020, 121, 193–201. [Google Scholar] [CrossRef]
- Panzella, L.; Cerruti, P.; Aprea, P.; Paolillo, R.; Pellegrino, G.; Moccia, F.; Condorelli, G.G.; Vollaro, A.; Ambrogi, V.; Catania, M.R.; et al. Silver nanoparticles on hydrolyzed spent coffee grounds (HSCG) for green antibacterial devices. J. Clean. Prod. 2020, 268, 122352. [Google Scholar] [CrossRef]
- Balzano, M.; Loizzo, M.R.; Tundis, R.; Lucci, P.; Nunez, O.; Fiorini, D.; Giardinieri, A.; Frega, N.G.; Pacetti, D. Spent espresso coffee grounds as a source of anti-proliferative and antioxidant compounds. Innov. Food Sci. Emerg. Technol. 2020, 59, 102254. [Google Scholar] [CrossRef]
- Monente, C.; Ludwig, I.A.; Irigoyen, A.; de Peña, M.-P.; Cid, C. Assessment of total (free and bound) phenolic compounds in spent coffee extracts. J. Agric. Food Chem. 2015, 63, 4327–4334. [Google Scholar] [CrossRef]
- Bravo, J.; Monente, C.; Juániz, I.; de Peña, M.P.; Cid, C. Influence of extraction process on antioxidant capacity of spent coffee. Food Res. Int. 2013, 50, 610–616. [Google Scholar] [CrossRef]
- Uman, E.; Colonna-Dashwood, M.; Colonna-Dashwood, L.; Perger, M.; Klatt, C.; Leighton, S.; Miller, B.; Butler, K.T.; Melot, B.C.; Speirs, R.W.; et al. The effect of bean origin and temperature on grinding roasted coffee. Sci. Rep. 2016, 6, 24483. [Google Scholar] [CrossRef] [PubMed]
- Tanaka, Analysis of chlorogenic acid in coffee by HPLC, GL Science Inc. (n.d.). Available online: https://www.glsciences.com/technique/app/detail.php?data_number=LT067 (accessed on 5 July 2022).
- Farah, A.; de Paulis, T.; Trugo, L.C.; Martin, P.R. Effect of roasting on the formation of chlorogenic acid lactones in coffee. J. Agric. Food Chem. 2005, 53, 1505–1513. [Google Scholar] [CrossRef] [PubMed]
- Trugo, L.C.; Macrae, R. Chlorogenic acid composition of instant coffees. Analyst 1984, 109, 263–266. [Google Scholar] [CrossRef] [PubMed]
- Rao, N.Z.; Fuller, M.; Grim, M.D. Physiochemical Characteristics of Hot and Cold Brew Coffee Chemistry: The Effects of Roast Level and Brewing Temperature on Compound Extraction. Foods 2020, 9, 902. [Google Scholar] [CrossRef]
- Odžaković, B.; Džinić, N.; Kukrić, Z.; Grujić, S. Effect of roasting degree on the antioxidant activity of different Arabica coffee quality classes. Acta Sci. Pol. Technol. Aliment. 2016, 15, 409–417. [Google Scholar] [CrossRef]
- Muzykiewicz, A.; Zielonka-Brzezicka, J.; Klimowicz, A. The antioxidant potential of flesh, albedo and flavedo extracts from different varieties of grapefruits. Acta Sci. Pol. Technol. Aliment. 2019, 18, 453–462. [Google Scholar] [CrossRef]
- Benzie, I.F.F.; Strain, J.J. The Ferric Reducing Ability of Plasma (FRAP) as a Measure of “Antioxidant Power”: The FRAP Assay. Anal. Biochem. 1996, 239, 70–76. [Google Scholar] [CrossRef]
- Mulfinger, L.; Solomon, S.D.; Bahadory, M.; Jeyarajasingam, A.V.; Rutkowsky, S.A.; Boritz, C. Synthesis and Study of Silver Nanoparticles. J. Chem. Educ. 2007, 84, 322. [Google Scholar] [CrossRef]
- Song, K.C.; Lee, S.M.; Park, T.S.; Lee, B.S. Preparation of colloidal silver nanoparticles by chemical reduction method. Korean J. Chem. Eng. 2009, 26, 153–155. [Google Scholar] [CrossRef]
- Merga, G.; Wilson, R.; Lynn, G.; Milosavljevic, B.H.; Meisel, D. Redox Catalysis on “Naked” Silver Nanoparticles. J. Phys. Chem. C 2007, 111, 12220–12226. [Google Scholar] [CrossRef]
- Wessa, P. Free Statistics Software, version 1.2.1; Office for Research Development and Education. 2020. Available online: https://www.wessa.net (accessed on 5 July 2022).
- Cordoba, N.; Pataquiva, L.; Osorio, C.; Moreno, F.L.M.; Ruiz, R.Y. Effect of grinding, extraction time and type of coffee on the physicochemical and flavour characteristics of cold brew coffee. Sci. Rep. 2019, 9, 8440. [Google Scholar] [CrossRef] [PubMed]
- Kang, D.-E.; Lee, H.-U.; Davaatseren, M.; Chung, M.-S. Comparison of acrylamide and furan concentrations, antioxidant activities, and volatile profiles in cold or hot brew coffees. Food Sci. Biotechnol. 2020, 29, 141–148. [Google Scholar] [CrossRef]
- Maksimowski, D.; Pachura, N.; Oziembłowski, M.; Nawirska-Olszańska, A.; Szumny, A. Coffee Roasting and Extraction as a Factor in Cold Brew Coffee Quality. Appl. Sci. 2022, 12, 2582. [Google Scholar] [CrossRef]
- Córdoba, N.; Moreno, F.L.; Osorio, C.; Velásquez, S.; Ruiz, Y. Chemical and sensory evaluation of cold brew coffees using different roasting profiles and brewing methods. Food Res. Int. 2021, 141, 110141. [Google Scholar] [CrossRef]
- Angeloni, G.; Guerrini, L.; Masella, P.; Bellumori, M.; Daluiso, S.; Parenti, A.; Innocenti, M. What kind of coffee do you drink? An investigation on effects of eight different extraction methods. Food Res. Int. 2018, 116, 1327–1335. [Google Scholar] [CrossRef]
- Ludwig, I.A.; Sanchez, L.; Caemmerer, B.; Kroh, L.W.; de Peña, M.P.; Cid, C. Extraction of coffee antioxidants: Impact of brewing time and method. Food Res. Int. 2012, 48, 57–64. [Google Scholar] [CrossRef]
- Šeremet, D.; Fabečić, P.; Cebin, A.V.; Jarić, A.M.; Pudić, R.; Komes, D. Antioxidant and Sensory Assessment of Innovative Coffee Blends of Reduced Caffeine Content. Molecules 2022, 27, 448. [Google Scholar] [CrossRef] [PubMed]
- Nicoli, M.C.; Anese, M.; Manzocco, L.; Lerici, C.R. Antioxidant Properties of Coffee Brews in Relation to the Roasting Degree. LWT-Food Sci. Technol. 1997, 30, 292–297. [Google Scholar] [CrossRef]
- Opitz, S.E.W.; Smrke, S.; Goodman, B.A.; Keller, M.; Schenker, S.; Yeretzian, C. Antioxidant Generation during Coffee Roasting: A Comparison and Interpretation from Three Complementary Assays. Foods 2014, 3, 586–604. [Google Scholar] [CrossRef]
- Pilipczuk, T.; Kusznierewicz, B.; Zielińska, D.; Bartoszek, A. The influence of roasting and additional processing on the content of bioactive components in special purpose coffees. J. Food Sci. Technol. 2015, 52, 5736–5744. [Google Scholar] [CrossRef]
- Moon, J.-K.; Shibamoto, T. Role of roasting conditions in the profile of volatile flavor chemicals formed from coffee beans. J. Agric. Food Chem. 2009, 57, 5823–5831. [Google Scholar] [CrossRef]
- Vignoli, J.A.; Viegas, M.C.; Bassoli, D.G.; Benassi, M.d.T. Roasting process affects differently the bioactive compounds and the antioxidant activity of arabica and robusta coffees. Food Res. Int. 2014, 61, 279–285. [Google Scholar] [CrossRef]
- Muzykiewicz-Szymańska, A.; Nowak, A.; Wira, D.; Klimowicz, A. The Effect of Brewing Process Parameters on Antioxidant Activity and Caffeine Content in Infusions of Roasted and Unroasted Arabica Coffee Beans Originated from Different Countries. Molecules 2021, 26, 3681. [Google Scholar] [CrossRef]
- Bilge, G. Investigating the effects of geographical origin, roasting degree, particle size and brewing method on the physicochemical and spectral properties of Arabica coffee by PCA analysis. J. Food Sci. Technol. 2020, 57, 3345–3354. Available online: https://link.springer.com/article/10.1007/s13197-020-04367-9?noAccess=true (accessed on 5 July 2022). [CrossRef]
- Rao, N.Z.; Fuller, M. Acidity and Antioxidant Activity of Cold Brew Coffee. Sci. Rep. 2018, 8, 16030. [Google Scholar] [CrossRef]
- Andueza, S.; Maeztu, L.; Pascual, L.; Ibáñez, C.; de Peña, M.P.; Cid, C. Influence of extraction temperature on the final quality of espresso coffee. J. Sci. Food Agric. 2003, 83, 240–248. Available online: https://onlinelibrary.wiley.co (accessed on 5 July 2022). [CrossRef]
- Andueza, S.; de Peña, M.P.; Cid, C. Chemical and sensorial characteristics of espresso coffee as affected by grinding and torrefacto roast. J. Agric. Food Chem. 2003, 51, 7034–7039. [Google Scholar] [CrossRef] [PubMed]
- Andueza, S.; Maeztu, L.; Dean, B.; de Peña, M.P.; Bello, J.; Cid, C. Influence of water pressure on the final quality of arabica espresso coffee. Application of multivariate analysis. J. Agric. Food Chem. 2002, 50, 7426–7431. [Google Scholar] [CrossRef]
- Andueza, S.; Vila, M.A.; de Peña, M.P.; Cid, C. Influence of coffee/water ratio on the final quality of espresso coffee. J. Sci. Food Agric. 2007, 87, 586–592. [Google Scholar] [CrossRef]
- Jain, P.K.; Huang, X.; El-Sayed, I.H.; El-Sayed, M.A. Review of some interesting surface plasmon resonance-enhanced properties of noble metal nanoparticles and their applications to Biosystems. Plasmonics 2007, 2, 107–118. [Google Scholar] [CrossRef]
- Paramelle, D.; Sadovoy, A.; Gorelik, S.; Free, P.; Hobley, J.; Fernig, D.G. A rapid method to estimate the concentration of citrate capped silver nanoparticles from UV-visible light spectra. Analyst 2014, 139, 4855–4861. [Google Scholar] [CrossRef] [PubMed]
- Amendola, V.; Pilot, R.; Frasconi, M.; Maragò, O.M.; Iatì, M.A. Surface plasmon resonance in gold nanoparticles: A review. J. Phys. Condens. Matter 2017, 29, 203002. [Google Scholar] [CrossRef]
- Burda, C.; Chen, X.; Narayanan, R.; El-Sayed, M.A. Chemistry and properties of nanocrystals of different shapes. Chem. Rev. 2005, 105, 1025–1102. [Google Scholar] [CrossRef]
- Shi, W.; Casas, J.; Venkataramasubramani, M.; Tang, L. Synthesis and characterization of gold nanoparticles with plasmon absorbance wavelength tunable from visible to near infrared region. Int. Bus. Rev. 2012, 2012, 659043. Available online: https://downloads.hindawi.com/archive/2012/659043.pdf (accessed on 5 July 2022). [CrossRef]
- Park, J.-E.; Lee, Y.; Nam, J.-M. Correction to Precisely Shaped, Uniformly Formed Gold Nanocubes with Ultrahigh Reproducibility in Single-Particle Scattering and Surface-Enhanced Raman Scattering. Nano Lett. 2018, 18, 7419. [Google Scholar] [CrossRef]
- Alim-Al-Razy, M.; Bayazid, G.M.A.; Rahman, R.U.; Bosu, R.; Shamma, S.S. Silver nanoparticle synthesis, UV-Vis spectroscopy to find particle size and measure resistance of colloidal solution. J. Phys. Conf. Ser. 2020, 1706, 012020. [Google Scholar] [CrossRef]
- Stamplecoskie, K.G.; Scaiano, J.C.; Tiwari, V.S.; Anis, H. Optimal Size of Silver Nanoparticles for Surface-Enhanced Raman Spectroscopy. J. Phys. Chem. C 2011, 115, 1403–1409. [Google Scholar] [CrossRef]
- Kelly, K.L.; Coronado, E.; Zhao, L.L.; Schatz, G.C. The Optical Properties of Metal Nanoparticles: The Influence of Size, Shape, and Dielectric Environment. J. Phys. Chem. B 2003, 107, 668–677. [Google Scholar] [CrossRef]
- Agnihotri, S.; Mukherji, S.; Mukherji, S. Size-controlled silver nanoparticles synthesized over the range 5–100 nm using the same protocol and their antibacterial efficacy. RSC Adv. 2014, 4, 3974–3983. [Google Scholar] [CrossRef]
- Göppert, A.-K.; González-Rubio, G.; Cölfen, H. Microscopic Analysis of Heterogeneous Nucleation of Nanoparticle Superstructures. J. Phys. Chem. A 2020, 124, 5657–5663. [Google Scholar] [CrossRef]
- Ni, B.; Gonzalez-Rubio, G.; Cölfen, H. Self-Assembly of Colloidal Nanocrystals into 3D Binary Mesocrystals. Acc. Chem. Res. 2022, 55, 1599–1608. [Google Scholar] [CrossRef]
- Huang, M.H.; Thoka, S. Formation of supercrystals through self-assembly of polyhedral nanocrystals. Nano Today 2015, 10, 81–92. [Google Scholar] [CrossRef]


| SCG Sample Code | Roast | Brewing Method Used to Generate the SCG |
|---|---|---|
| SMC | Medium | Cold brew; the particle size of the coffee grounds ranged from 710 µm to 1000 µm; the grounds were steeped in 22 °C deionized (DI) water for 24 h. |
| SMH | Medium | Hot brew; the particle size of the coffee grounds ranged from 710 µm to 1000 µm; the grounds were steeped in 100 °C DI water for 6 min. |
| SME | Medium | Espresso brew; the particle size of the coffee grounds was below 500 µm. |
| SDC | Dark | Cold brew; the particle size of the coffee grounds ranged from 710 µm to 1000 µm; the grounds were steeped in 22 °C DI water for 24 h. |
| SDH | Dark | Hot brew; the particle size of the coffee grounds ranged from 710 µm to 1000 µm; the grounds were steeped in 100 °C DI water for 6 min. |
| SDE | Dark | Espresso brew; the particle size of the coffee grounds was below 500 µm. |
| SCG Samples | Total CQA Concentration (mg/L of Extract) | ABTS (mmol TE/L Extract) | DPPH (mmol TE/L Extract) | TPC (mg GAE/L Extract) | FRAP (mg FeSO4/L Extract) |
|---|---|---|---|---|---|
| SMC | 480.65 ± 8.31 a,A | 5.69 ± 0.59 a,A | 4.23 ± 0.68 a,A | 420.5 ± 16.7 a,A | 145.6 ± 4.2 a,A |
| SMH | 716.02 ± 7.70 b,A | 6.94 ± 0.64 b,A | 5.69 ± 1.54 ab,A | 534.2 ± 14.0 b,A | 217.1 ± 12.3 b,A |
| SME | 221.12 ± 1.17 c,A | 5.5 ± 0.37 b,A | 3.57 ± 0.72 b,A | 313.5 ± 8.9 c,A | 111.4 ± 6.8 c,A |
| SDC | 202.72 ± 3.67 a,B | 7.15 ± 0.78 a,B | 5.41 ± 1.05 a,B | 503.2 ± 12.6 a,B | 193.3 ± 6.9 a,B |
| SDH | 277.86 ± 4.47 b,B | 8.92 ± 0.59 b,B | 7.6 ± 0.79 b,A | 595.2 ± 11.0 b,B | 254.6 ± 16.6 b,B |
| SDE | 38.88 ± 0.71 c,B | 3.43 ± 0.20 c,B | 2.53 ± 0.39 c,A | 206.2 ± 21.1 c | 73.1 ± 2.7 c,B |
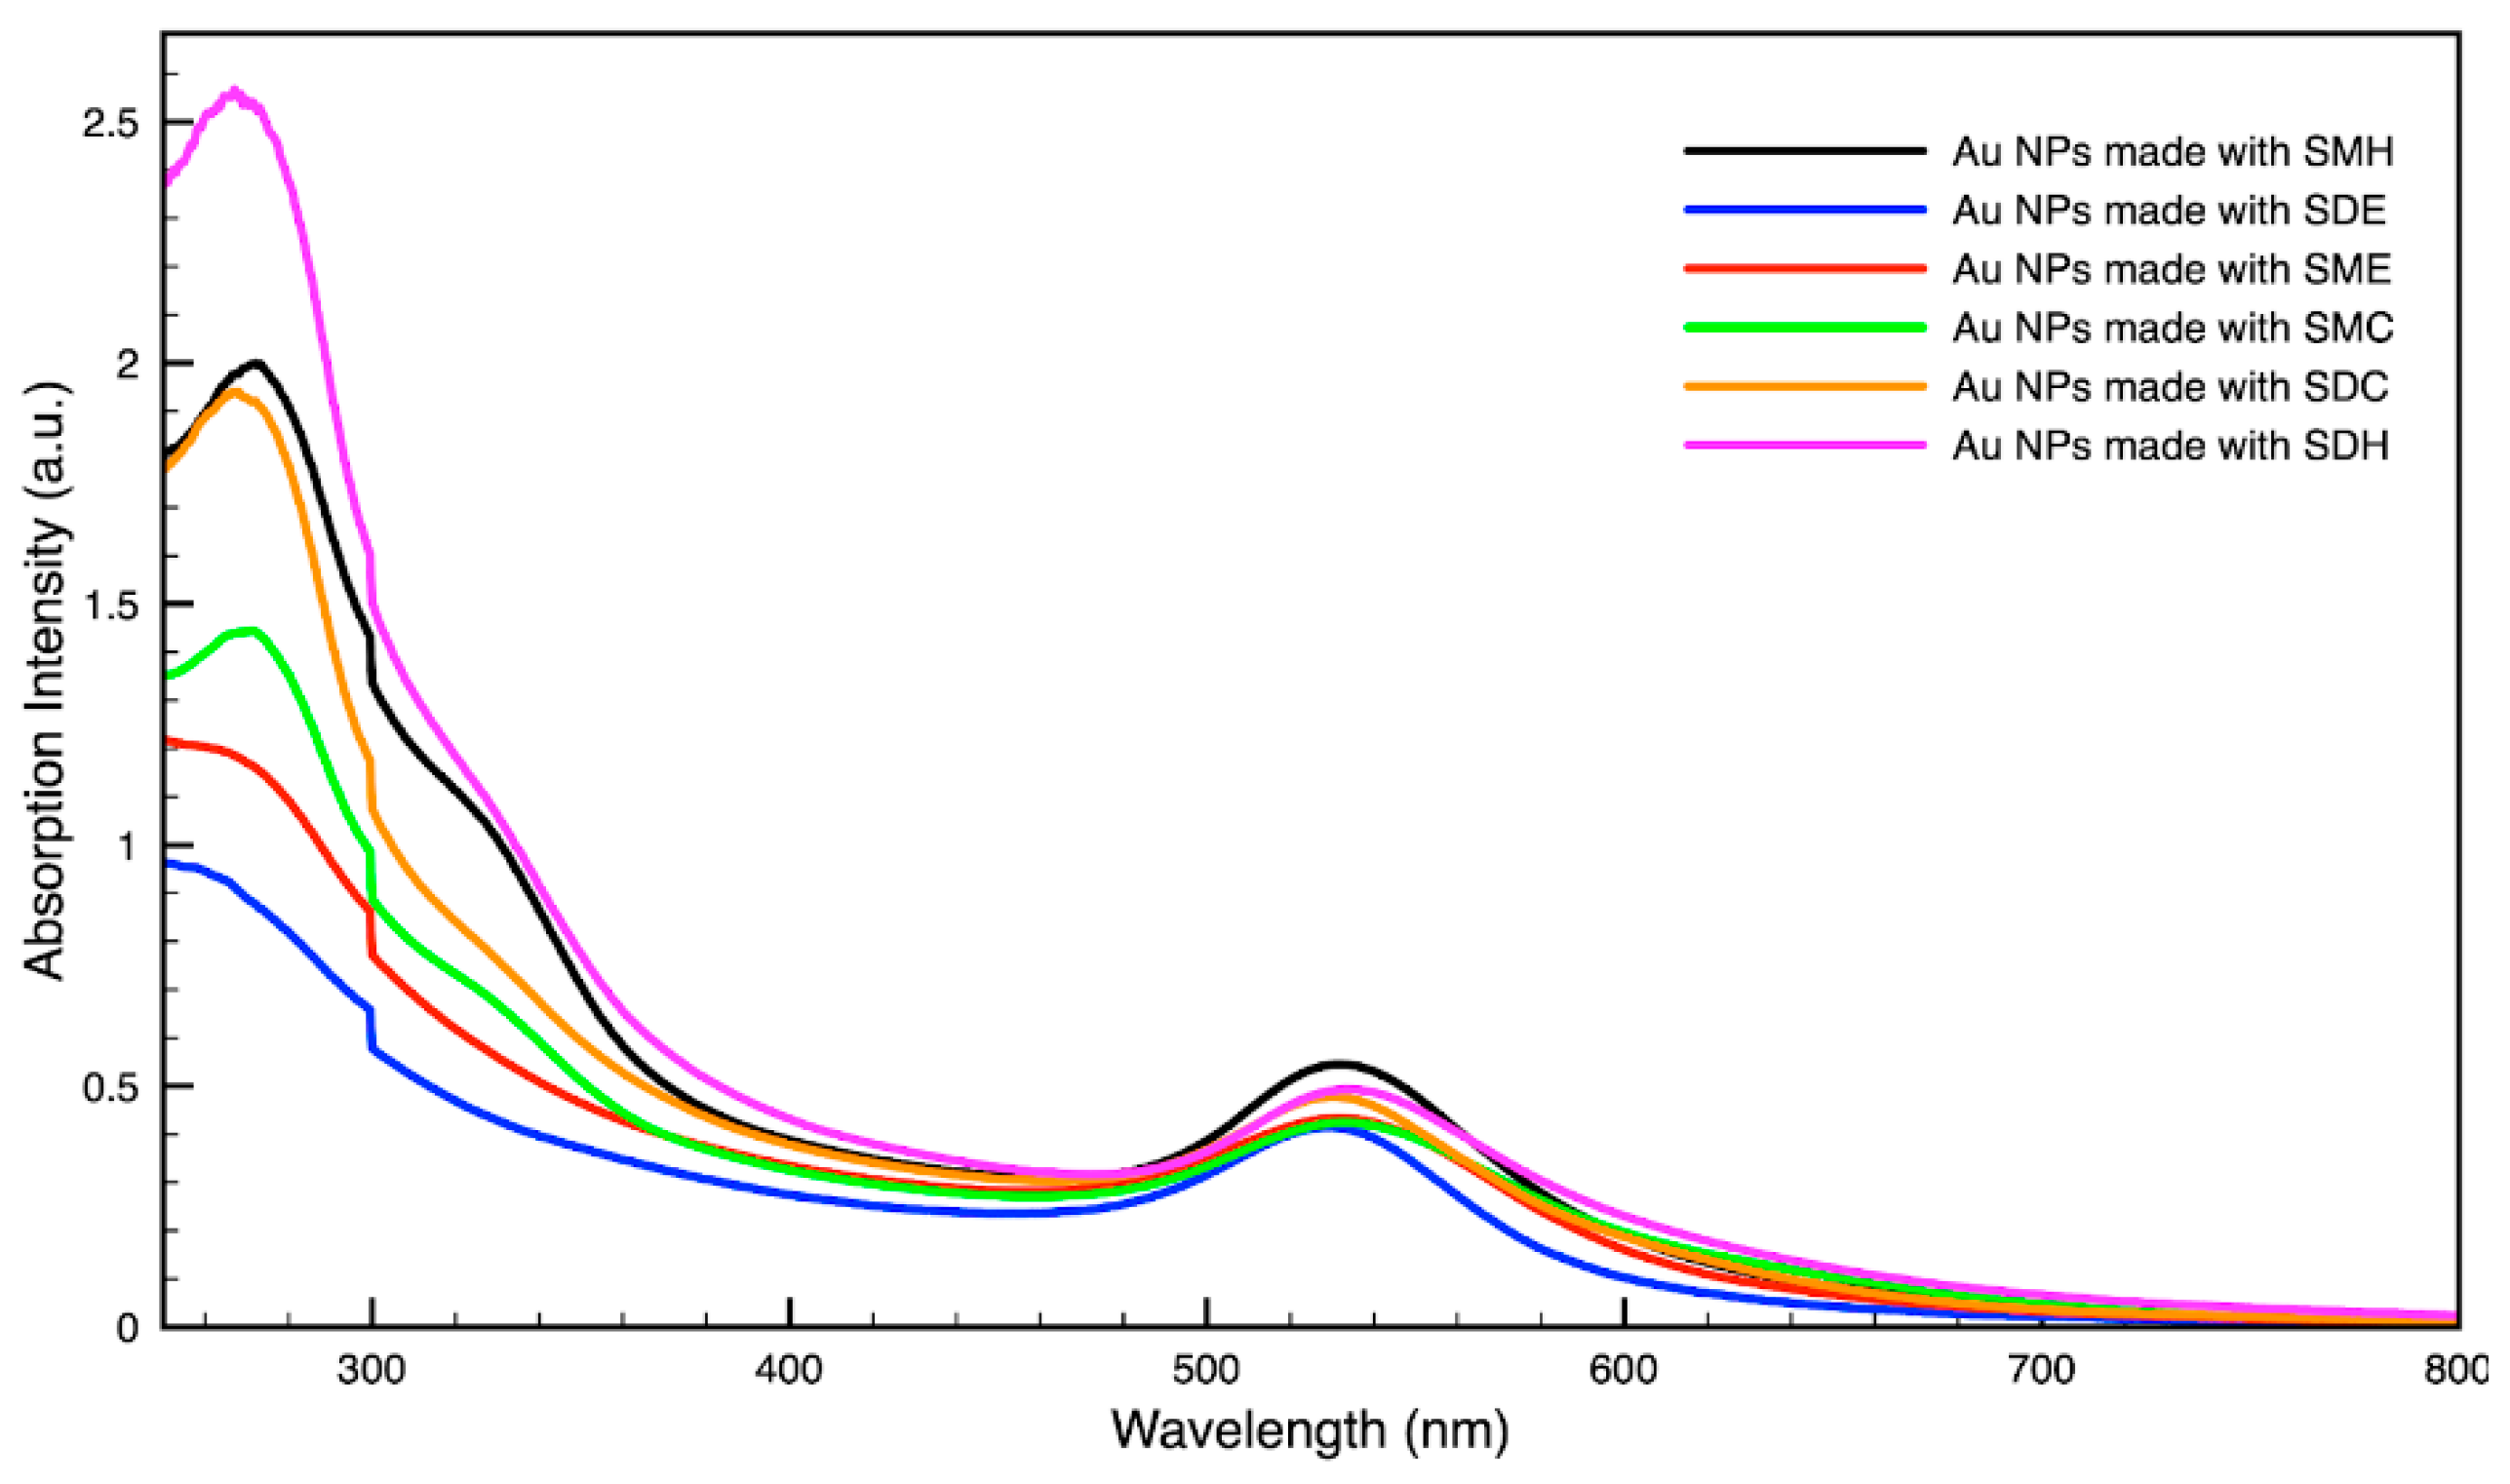
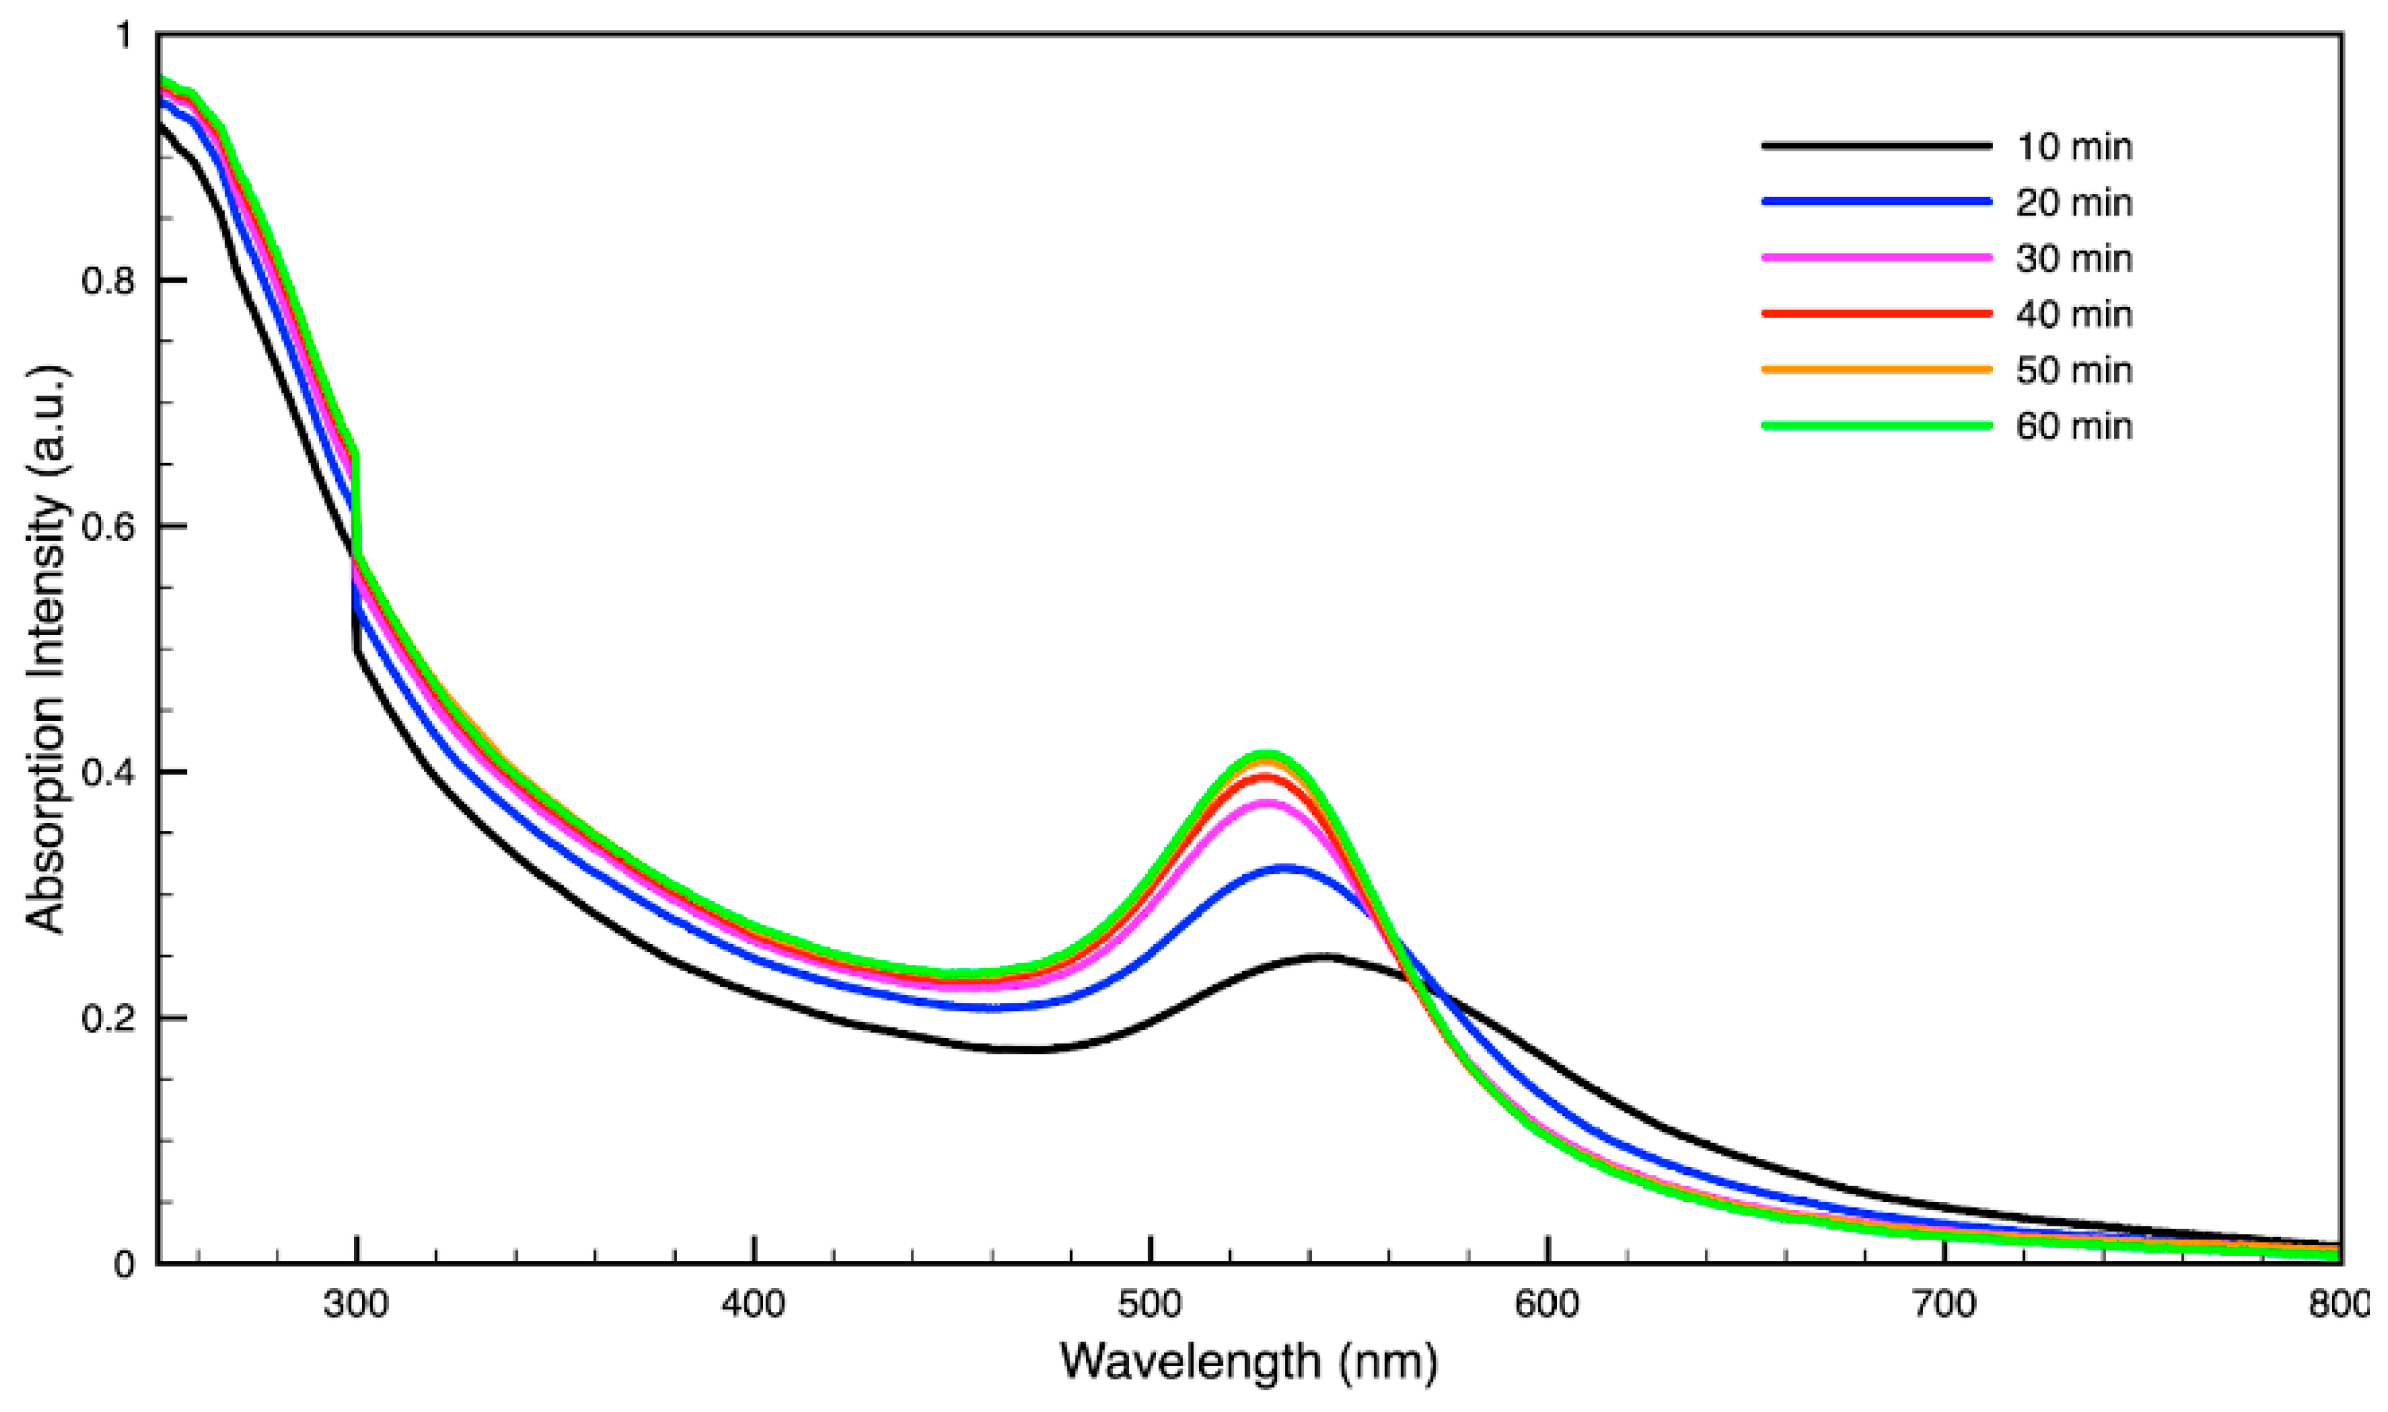
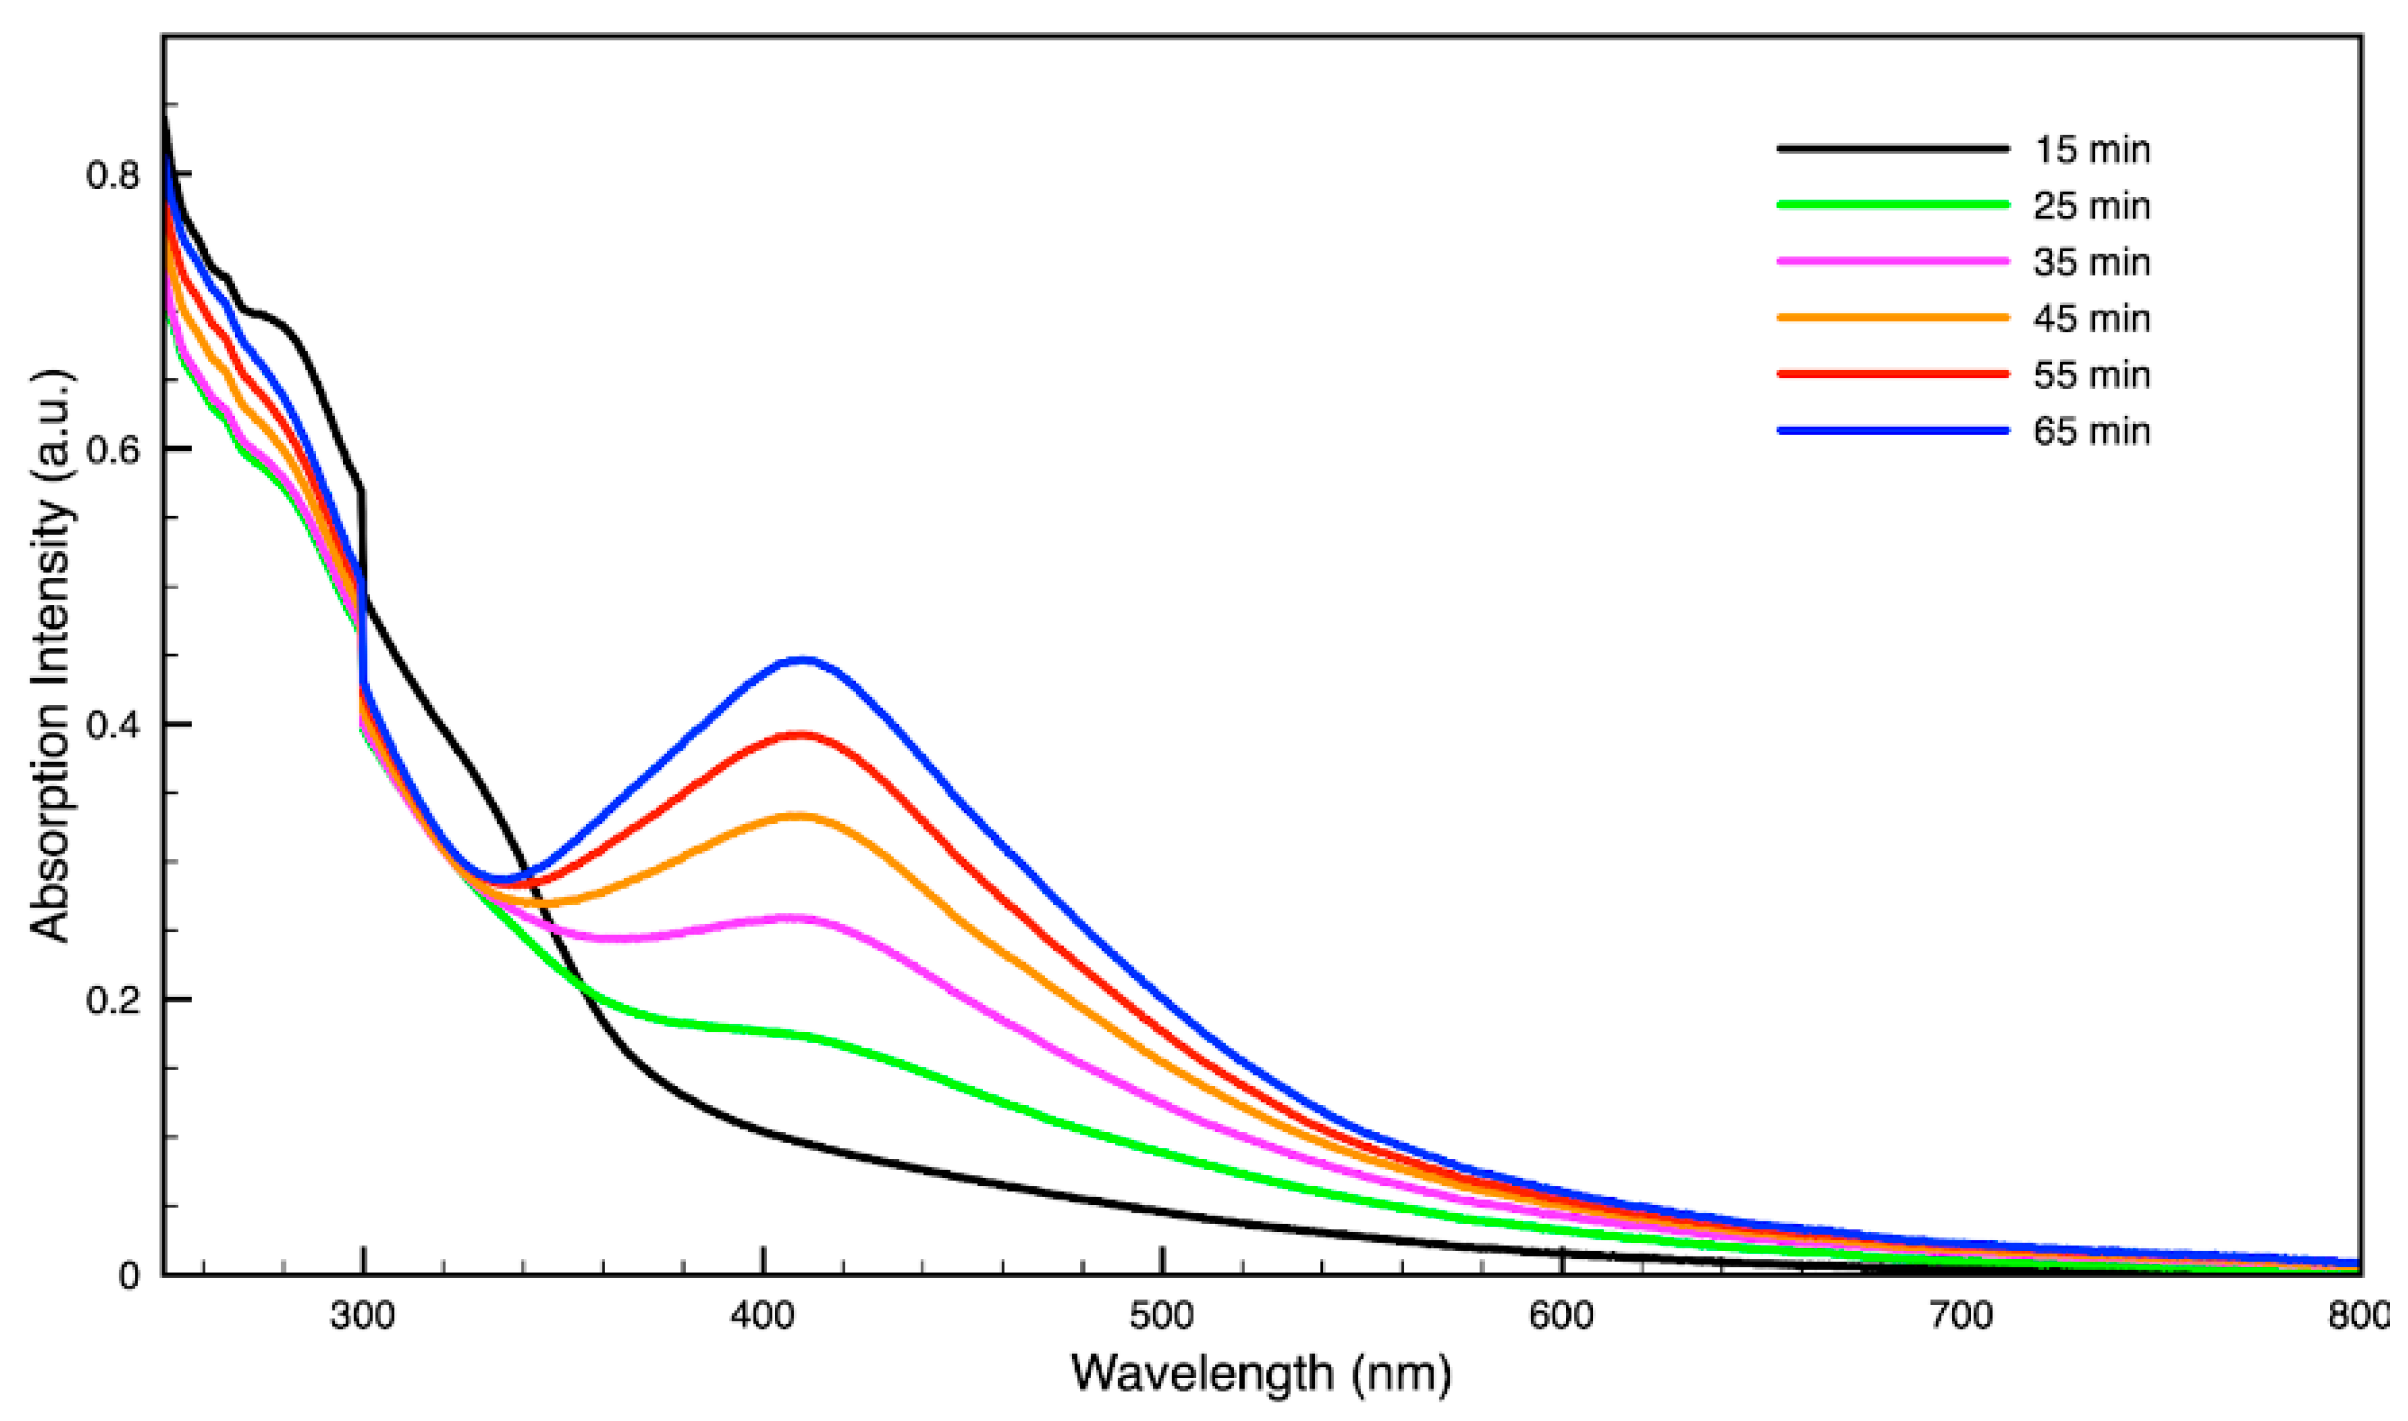
| SCG Samples | Peak Wavelength of Silver NPs | Peak Wavelength of Gold NPs |
|---|---|---|
| SMC | 427 nm | 533 nm |
| SMH | 432 nm | 532 nm |
| SME | 419 nm | 532 nm |
| SDC | 433 nm | 530 nm |
| SDH | 423 nm | 534 nm |
| SDE | 410 nm | 529 nm |
Publisher’s Note: MDPI stays neutral with regard to jurisdictional claims in published maps and institutional affiliations. |
© 2022 by the authors. Licensee MDPI, Basel, Switzerland. This article is an open access article distributed under the terms and conditions of the Creative Commons Attribution (CC BY) license (https://creativecommons.org/licenses/by/4.0/).
Share and Cite
Yust, B.G.; Rao, N.Z.; Schwarzmann, E.T.; Peoples, M.H. Quantification of Spent Coffee Ground Extracts by Roast and Brew Method, and Their Utility in a Green Synthesis of Gold and Silver Nanoparticles. Molecules 2022, 27, 5124. https://doi.org/10.3390/molecules27165124
Yust BG, Rao NZ, Schwarzmann ET, Peoples MH. Quantification of Spent Coffee Ground Extracts by Roast and Brew Method, and Their Utility in a Green Synthesis of Gold and Silver Nanoparticles. Molecules. 2022; 27(16):5124. https://doi.org/10.3390/molecules27165124
Chicago/Turabian StyleYust, Brian G., Niny Z. Rao, Evan T. Schwarzmann, and Madisyn H. Peoples. 2022. "Quantification of Spent Coffee Ground Extracts by Roast and Brew Method, and Their Utility in a Green Synthesis of Gold and Silver Nanoparticles" Molecules 27, no. 16: 5124. https://doi.org/10.3390/molecules27165124