Abstract
In recent years, there has been an increased interest in products of natural origin. The extraction procedure of bioactive compounds from plant matrices is a crucial step in the development of useful new bioproducts for everyday life. The utilisation of analyses enabling the rapid identification of the presence of a given group of compounds can be helpful in the early stages of the development of new products in order to save time and reduce costs. Within this article, we have presented a comparison of different, accessible methods for the identification of various bioactive compounds, e.g., saponins, carboxylic acids, oils and fats, proteins and amino acids, steroids, and alkaloids in plant-based extracts. Additionally, the multielemental composition of extracts was also examined. The applied methods allowed for confirmation of the presence of biologically active compounds in bio-products obtained by ultrasound-assisted extraction. At a later stage, these procedures should be supplemented by advanced analytical techniques in order to determine the plant chemicals’ content qualitatively and quantitatively.
1. Introduction
Plants are a rich source of phytochemicals that occur naturally in their leaves, stems, barks, flowers, seeds, fruits, and roots [1,2,3,4]. Nowadays, botanical products, containing a broad spectrum of compounds, are of great interest to scientists and consumers [2,5,6,7,8] due to their natural origin and availability [9]. The global market of plant extracts accounted for USD 30.8 billion in 2021 and is estimated to reach USD 55.3 billion by 2026 [10]. Medicinal and aromatic plants are widely used for aromatic, culinary, and therapeutic purposes as components of cosmetics, food, and medicinal and health products [5,6,8,11,12]. Moreover, plant-based extracts are incorporated into natural products, that are used in crop cultivation in order to increase their quality and tolerance to environmental stresses [13,14,15,16,17]. Primary plant constituents (e.g., sugars, proteins, amino acids, chlorophyll, and purines and pyrimidines of nucleic acids) are principally nutritional substances of plants and, in most cases, do not possess medicinal properties. Secondary plant constituents (secondary metabolites) such as alkaloids, carotenoids, flavonoids, glycosides, lignans, phenolic compounds, terpenoids, saponins, steroids, and tannins are accountable for multifarious biological, ecological, pharmacological, and toxicological activities [3,8,9,11,18,19]. Most of these secondary metabolites have a role in the defence against environmental factors (e.g., pollution, drought, UV light, pathogens) [3,19] and can be found in plants either permanently or only at certain stages of their growth [20]. Natural phytochemicals isolated from plants are considered to be attractive alternatives to synthetic chemicals [5,15,21,22,23]. From approximately 500,000 plant species, a mere 1–10% have been phytochemically examined [5,19,24]; therefore, there is a promising prospect to unveiling unique bioactive compounds [5]. These compounds are present in plants in trace quantities and are synthesised in specific cell types at various developmental stages; hence, they are hard to extract and purify [11]. The studies on bioactive plant compounds are dependent mainly on the selection of appropriate extraction methods, which are affected by different variables (e.g., matrix properties, pressure, solvents, temperature, time) [2]. Extraction is a crucial step in the analyses of plants and requires adequate preparation of raw materials (pre-washing, drying, grinding) to maintain the activity of the desired substances [8,9,25], as well as the selection of the appropriate solvent and standardised extraction procedure [9]. The choice of solvent type depends on the nature of the bioactive compound being targeted [25]. The extraction of hydrophilic compounds (e.g., flavonoids, organic acids, phenolic acids, sugars) requires the use of polar solvents (e.g., ethanol, methanol, or ethyl-acetate). In the extraction of lipophilic compounds (e.g., alkaloids, carotenoids, fatty acids, steroids, terpenoids, tocopherols), nonpolar solvents (e.g., dichloromethane, dichloromethane/methanol) should be utilised [2,8,25]. The selection of the solvent should consider the principles of Green Chemistry. For plant extraction, various methods are applied, for example: maceration, decoction, percolation, sonication, Soxhlet extraction, solid-phase micro-extraction, microwave-assisted extraction, ultrasound-assisted extraction, subcritical water extraction, supercritical fluid extraction, pressurised-liquid extraction, accelerated solvent extraction, and enzyme-assisted extraction [8,19,25,26]. For this study, we carried out experiments with the use of water as a solvent, because it dissolves a broad range of compounds and is nontoxic and non-flammable [9,26]. To disrupt plant cells, the ultrasound-assisted extraction was chosen, as it allows for a reduction in time and the amount of solvent [9]. Ultrasounds (above 20 kHz) enhance the solvent’s ability to penetrate the cells, increase the extraction yield [1], and lower solvent consumption [8].
The objective of this paper is to provide insight into the impact of ultrasound-assisted extraction on the phytochemical composition of plant-based extracts. Screening tests were conducted to detect the presence of metabolites (saponins, carboxylic acids, oil and fats, proteins and amino acids, steroids, terpenes, terpenoids, alkaloids) in 26 botanical extracts, as well as their multielemental composition, content of dry weight, and pH value.
2. Results
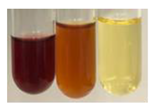
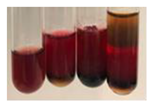
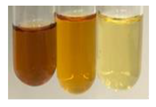
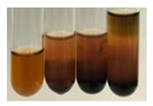
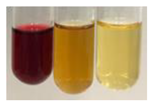
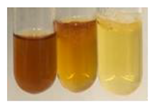
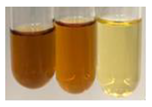
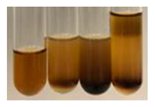
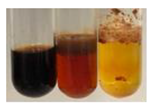
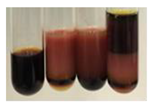
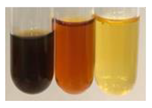
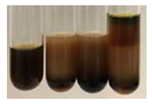
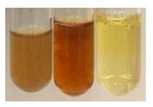
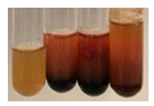
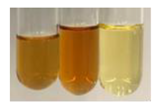
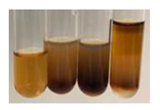
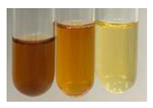
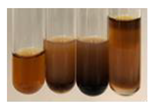
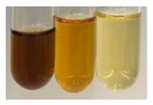
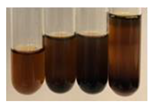
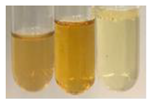
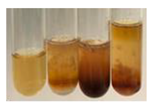
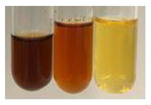
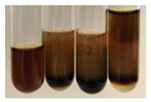
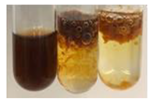
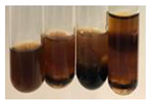
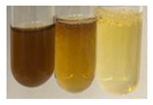
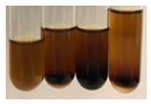
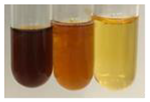
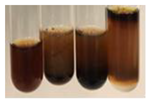
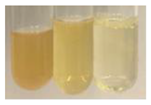
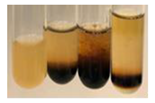
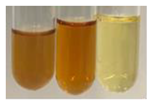
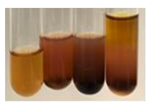
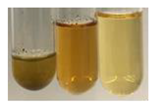
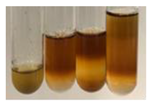
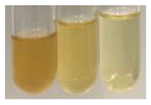
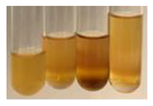
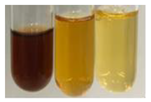
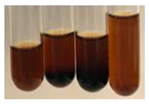
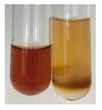
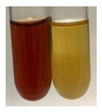
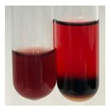
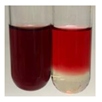
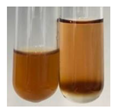
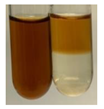
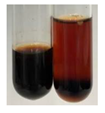
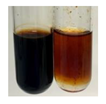
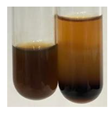
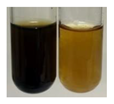
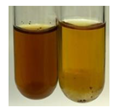
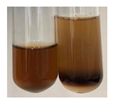
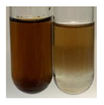
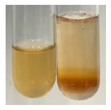
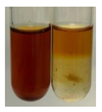
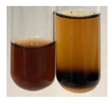
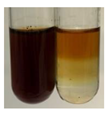
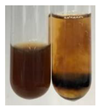
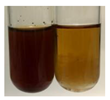
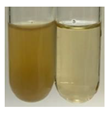
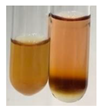
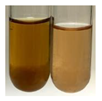
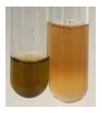
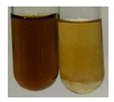
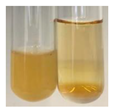
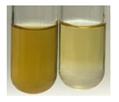
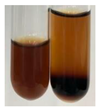
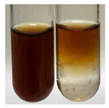
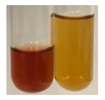
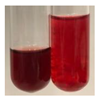
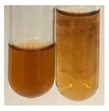
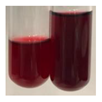
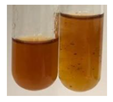
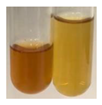
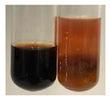
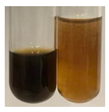
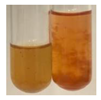
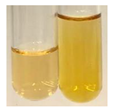
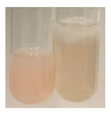
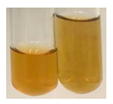
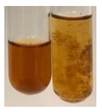
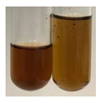
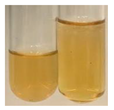
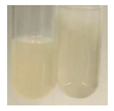
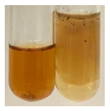
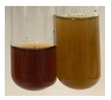
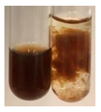
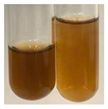
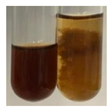
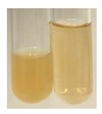
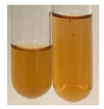
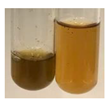
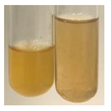
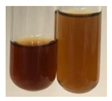
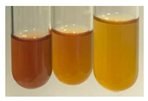
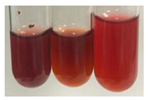
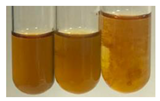
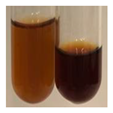
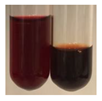
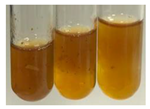
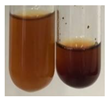
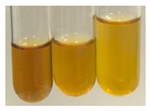
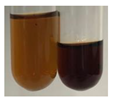
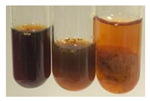
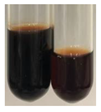
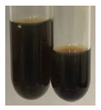
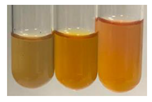
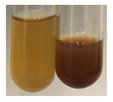
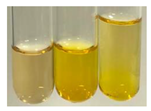
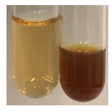
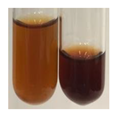
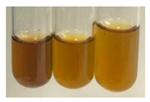
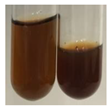
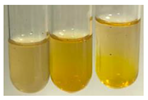
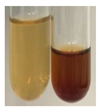
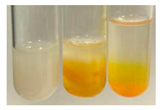
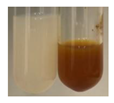
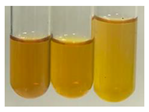
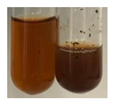
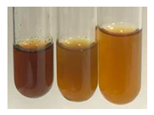
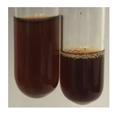
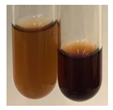
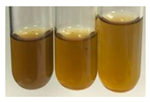
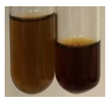
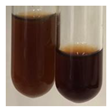
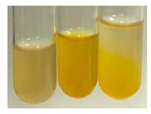
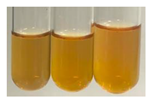
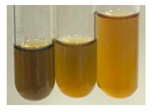
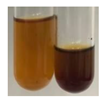
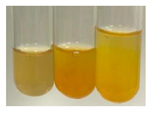
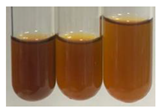
The applied methods were used to visually determine the presence of bioactive compounds in bio-extracts. They can be useful for quick screening; however, advanced analytical techniques are necessary to determine bio-extracts’ content qualitatively and quantitatively. To maintain clarity in the results, the following abbreviations were used: Alv L—aloe leaves; Am Fr—black chokeberry fruits; Arv H—common mugwort herb; Bv R—beetroot roots; Co F—common marigold flowers; Ea H—field horsetail herb; Ep F—purple coneflower flowers; Ep L—purple coneflower leaves; Hp H—St. John’s wort herb; Hr Fr—sea-buckthorn fruits; Lc S—red lentil seeds; Mc F—chamomile flowers; Ob H—basil herb; Pm H—broadleaf plantain herb; Poa H—common knotgrass herb; Ps S—pea seeds; Pta L—common bracken leaves; Sg L—giant goldenrod leaves; So R—comfrey roots; To F—common dandelion flowers; To L—common dandelion leaves; To R—common dandelion roots; Tp F—red clover flowers; Ur L—nettle leaves; Ur R—nettle roots; Vo R—valerian roots. The main factors in the selection of raw materials were their prevalence in Europe and the content of biologically active compounds. In all the tables in this article, the first tube from the left represents the control—aqueous extract without additives. Usually, in most cases, visual changes were observed immediately after mixing the extracts with appropriate reagents or after waiting a few minutes (up to 5 min).
2.1. Determination of Dry Weight
The highest dry weights of extracts were measured for extracts produced from black chokeberry fruits (Am Fr) and the roots of beetroot (Bv R), comfrey (So R,) and common dandelion (To R), whereas the lowest dry weights were found for the following biomasses: nettle roots (Ur R) and herbs such as common knotgrass (Poa H), St. John’s wort (Hp H) and common mugwort (Arv H). On average, the latter were three times lower than for those with the highest biomasses (Table 1).

Table 1.
The pH value (n = 3), dry weight (n = 3), and the presence of saponins in botanical extracts.
2.2. Determination of pH
The pH of all examined extracts was acidic. Only for the extract from nettle leaves (Ur L) was the pH neutral. The highest acidic pH (about 6) was for extracts produced from purple coneflower leaves (Ep L), seeds of pea (Ps S), and red lentil (Lc S) and comfrey roots (So R). The lowest pH was measured for extracts obtained from fruits of sea-buckthorn (Hr Fr) and black chokeberry (Am Fr). In most cases, the pH was in the range of 4 to 5 (Table 1).
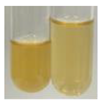
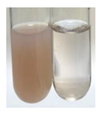
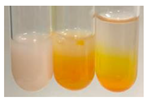
2.3. Determination of Saponins
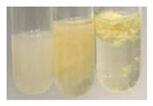
The Froth test is used to detect saponins. A froth/foam formation indicates the presence of saponins (honeycomb froth) [25,27,28,29,30,31,32,33,34,35,36,37,38,39,40,41]. Saponins are amphiphilic glycosidic secondary metabolites with foaming properties, which are produced by plants [42]. The highest foam height was obtained for the extract from giant goldenrod leaves (Sg L) and seeds of pea (Ps S) and red lentil (Lc S). The results obtained for Sg L (Solidago gigantea) are in accordance with the results presented by Góral and Wojciechowski [42], in which the extract from the herb of Solidago virgaurea (woundwort) was indicated as saponin-rich. In the aforementioned work, soybean (Glycine max (L.) Merr.) was also proposed as one of the best sources of saponins; the soybean belongs to the same family (Fabaceae) as the pea (Pisum sativum) and red lentil (Lens culinaris) selected in the present study (Table 1).
2.4. Determination of Carboxylic Acids
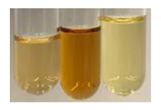
NaHCO3 test–brisk effervescence indicates the presence of carboxylic acids [29]. In the present study, the NaHCO3 test did not indicate the presence of carboxylic acids in the examined extracts (Table 2).

Table 2.
The presence of carboxylic acid, oils, and fats in botanical extracts.
2.5. Determination of Oils and Fats
- (a)
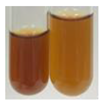
- Saponification test–a soupy solution indicates the presence of oils and fats [27]. The application of this test to the examined extracts showed no presence of oils and fats (Table 2).
- (b)
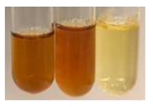
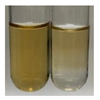
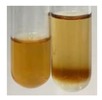
- Sudan test–a shining orange colour indicates the presence of fixed oil and fat [33]. The colour change in the extract was observed in many cases: Alv L (aloe leaves), Arv H (common mugwort herb), Co F (common marigold flowers), Ea H (field horsetail herb), Ep L (purple coneflower leaves), Hp H (St. John’s wort herb), Mc F (chamomile flowers), Ob H (basil herb), Pm H (broadleaf plantain herb), Poa H (common knotgrass herb), Pta L (common bracken leaves), Sg L (giant goldenrod leaves), So R (comfrey roots), To F (common dandelion flowers), To L (common dandelion leaves), To R (common dandelion roots), Tp F (red clover flowers), and Vo R (valerian roots). Generally, oils and fats were not present in extracts produced from fruits (e.g., chokeberry, sea-buckthorn), beetroot roots, representatives from the Fabaceae family such as as pea and red lentil, as well as nettle leaves and roots (Table 2).
The Sudan test was more effective at detecting oils and fats in aqueous extracts of higher plants than the saponification test.
2.6. Determination of Proteins and Amino Acids
There are many methods to visualise the presence of proteins and amino acids in plant extracts. These techniques include, for example:
- (a)
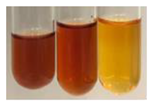
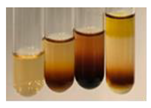
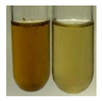
- Biuret test (proteins)–a violet or pink colour precipitate indicates the presence of proteins [31,33,34,37,39]. This method showed the presence of proteins only in extracts produced from representatives of the Fabaceae family—pea and red lentil (Table 3).
 Table 3. The presence of proteins and amino acids in botanical extracts—biuret and ninhydrin tests.
 - (b)
- Ninhydrin test (amino acids)–a violet/purple/bluish colour indicates the presence of amino acids [27,28,31,37,38,40]. The change of the initial colour of extract into violet/purple/bluish was observed in almost all the examined extracts, aside from Alv L (aloe leaves), Am Fr (black chokeberry fruits), Ep F (purple coneflower flowers), Hp H (St. John’s wort herb), Hr Fr (sea-buckthorn fruits), Sg L (giant goldenrod leaves), and Ur L (nettle leaves) (Table 3).
- (c)
- Millon’s test (proteins)–white precipitate, which turns red after heating, indicates the presence of proteins [28,37] and free amino acids [34,39]. This method turned out to be imprecise in determining the presence of proteins. White precipitation in the first stage was observed only for extracts from pea (Ps S) and red lentil (Lc S), but it did not turn into red, whereas red precipitate occurred after extract heating only in extracts produced from purple coneflower flowers (Ep F) and comfrey roots (So R) (Table 4).
 Table 4. The presence of proteins and amino acids in botanical extracts–Millon’s and H2SO4 tests.
 - (d)
- H2SO4 test (proteins)–white precipitate that turned to yellow after heating and orange after the addition of NH4OH revealed the presence of proteins [37]. The colour recognition of the precipitate was difficult due to the presence of diversified colours of extracts. Nonetheless, according to the expected observations, the following bioproducts that could contain some amounts of proteins can be mentioned: aloe leaves (Alv L), black chokeberry fruits (Am Fr), common marigold flowers (Co F), purple coneflower flowers (Ep F), purple coneflower leaves (Ep L), St. John’s wort herb (Hp H), red lentil seeds (Lc S), chamomile flowers (Mc F), common knotgrass herb (Poa H), pea seeds (Ps S), common bracken leaves (Pta L), giant goldenrod leaves (Sg L), comfrey roots (So R), common dandelion leaves (To L), common dandelion roots (To R), red clover flowers (Tp F).
2.7. Determination of Steroids, Terpenes, Terpenoids
The results of steroid, terpene, and terpenoid detection in plant extracts are presented in Table 5. The following methods were used to detect these secondary metabolites:

Table 5.
The presence of steroids, terpenes, and terpenoids in botanical extracts.
- (a)
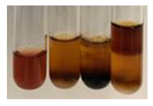
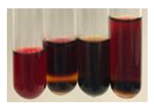
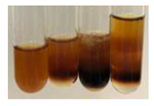
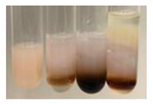
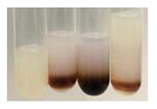
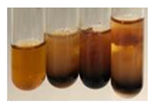
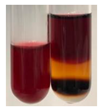
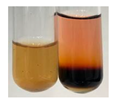
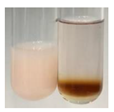
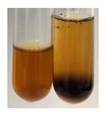
- Salkowski test–a red chloroform layer and greenish yellow fluorescence/green fluorescence of acid layer indicate the presence of steroids [34,36,39,40]. According to Shetty and Vijayalaxmi [27], a red precipitate can indicate the presence of steroids. A brown ring can also indicate the presence of steroids, and the appearance of bluish-brown ring can indicate the presence of phytosteroids [41]. Such observations were visible for the following extracts: beetroot roots (Bv R), common marigold flowers (Co F), chamomile flowers (Mc F), basil herb (Ob H), broadleaf plantain herb (Pm H), and pea seeds (Ps S).
A reddish-brown colouration of the interface indicated the presence of terpenoids [25,32,33,35,41]. The formation of two layers at the junction and a red colour in the lower layer indicates the presence of sterols, and a yellow colour in the upper layer can indicate the presence of triterpenoids [28]. No clear separation of the two phases was observed in tested plant extracts, but it can be assumed that triterpenoids were present in extracts produced from aloe leaves (Alv L), common marigold flowers (Co F), field horsetail herb (Ea H), sea-buckthorn fruits (Hr Fr), and common knotgrass herb (Poa H).
A golden yellow colour indicates the presence of triterpenes [38]. Based on the photos in the Table 5, it can be assumed that triterpenes were present in the following extracts: aloe leaves (Alv L), common marigold flowers (Co F), field horsetail herb (Ea H), sea-buckthorn fruits (Hr Fr), chamomile flowers (Mc F), common knotgrass herb (Poa H), red clover flowers (Tp F), nettle leaves (Ur L), and roots (Ur R). A solution colour change to cherry red indicates the presence of phytosterols [29]. On the basis of the colours of plant extracts presented in Table 5, most of them contained phytosterols.
- (b)
- Acetic acid and H2SO4 test–a blue-green ring indicates the presence of terpenoids [31]. In the examined extracts, there was no blue-green ring. This method did not allow for the detection of terpenoids in plant extracts.
- (c)
- Liebermann–Burchard test–a pink or red colour indicates the presence of steroids [25]. This was only observed for the extracts produced from black chokeberry fruits (Am Fr) and purple coneflower flowers (Ep F). According to Jayapriya et al. [41], a green colour indicates the presence of phytosterols. In the present study, these compounds can be detected in extracts from chamomile flowers (Mc F) and from nettle roots (Ur R). In the examined extracts, there was no green precipitate, which can indicate the presence of steroids [27]. In tested extracts we did not observe (1) the change of red colour through blue to green can indicate the presence of steroids [33]; (2) the formation of a reddish-violet colour at the junction can indicate the presence of steroids, triterpenoids, and cardiac glycosides [36]; and (3) a brown ring appears at the junction of two layers—a green colour in the upper layer can indicate the presence of sterols, and the formation of deep-red colour in the lower layer indicates the presence of triterpenoids [28].
2.8. Determination of Alkaloids
The observations for the alkaloids’ detection in plant extracts are summarised in Table 6 and Table 7.

Table 6.
The presence of alkaloids in botanical extracts–Hager’s, Tannic acid, Mayer’s tests.

Table 7.
The presence of alkaloids in botanical extracts–Dragendroff’s and Wagner’s tests.
- (a)
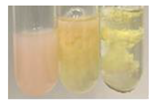
- Hager’s test–a yellow precipitate indicates the presence of alkaloids [28,33,34,37]. Such a precipitate was observed only in extracts from pea seeds (Ps S) and red lentil seeds (Lc S)–Table 6.
- (b)
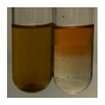
- Tannic acid test–a buff colour indicates the presence of alkaloids [28]. A more intensive colour of extract was observed only for black chokeberry fruits (Am Fr), beetroot roots (Bv R), giant goldenrod leaves (Sg L), comfrey roots (So R), and valerian roots (Vo R)–Table 6.
- (c)
- Mayer’s test (1)–a pale, white, creamy precipitate indicates the presence of alkaloids [27,28,29,35,37,38]. The application of this test didn’t indicate the presence of alkaloids in examined plant extracts–Table 6.
- (d)
- Mayer’s test (2)–a green colour or white precipitate indicates the presence of alkaloids [41]. An opalescence or yellowish precipitate indicates the presence of alkaloids [30,36,39]. This technique was more sensitive for the detection of alkaloids in the extracts than the previous one. A white precipitate was observed in extract from pea seeds (Ps S). Yellow-orange fine precipitate was detected in more extracts, for example, from common mugwort herb (Arv H), common marigold flowers (Co F), St. John’s wort herb (Hp H), basil herb (Ob H), pea seeds (Ps S), common bracken leaves (Pta L), comfrey roots (So R), and common dandelion leaves (To L)–Table 6.
- (e)
- Dragendroff’s test (1)–the presence of alkaloids can be indicated by a reddish-brown precipitate [33,43], an orange-brown precipitate [29,30], and an orange precipitate [27]. In the present study, the precipitate described above was observed in extracts produced from common marigold flowers (Co F), red lentil seeds (Lc S), and pea seeds (Ps S)–Table 7.
- (f)
- Dragendroff’s test (2) –indicates the presence of alkaloids when an orange or red precipitate [35,40] or an orange-brown precipitate [34,36,39] occurs. The plant extracts that indicated the presence of alkaloids were common mugwort herb (Arv H), common marigold flowers (Co F), purple coneflower flowers (Ep F) and leaves (Ep L), basil herb (Ob H), pea seeds (Ps S), comfrey roots (So R), and common dandelion leaves (To L)–Table 7.
- (g)
- Wagner’s test–a reddish-brown precipitate indicates the presence of alkaloids [27,28,29,33,35,37]. In the examined extracts, their colour was generally changed into reddish brown, but no evident precipitate was present–Table 7.
2.9. Determination of Multielemental Composition
The selected raw materials (RMs) and their extracts (Es) differed significantly in terms of elemental composition (Table 8, Table 9 and Table 10).

Table 8.
The content of elements–Al, B, Ba, Ca, Cd, Cr–in raw materials (mg·kg−1) and botanical extracts (mg·L−1) (n = 3).

Table 9.
The content of elements–Cu, Fe, K, Mg, Mn, Na–in raw materials (mg·kg−1) and botanical extracts (mg·L−1) (n = 3).

Table 10.
The content of elements–Ni, P, Pb, S, Sr, Zn–in raw materials (mg·kg−1) and botanical extracts (mg·L−1) (n = 3).
For instance, amidst microelements, the highest content of Al in RMs was found in nettle roots (Ur R), common marigold flowers (Co F), and So R (comfrey roots), and the content ranged from 831 to 587 mg·kg−1. In the case of extracts, the greatest level of Al was present in the product based on So R (6.08 mg·L−1), followed by Vo R (2.92 mg·L−1) and Alv L (2.20 mg·L−1). The lowest amounts occurred in pea seeds (Ps S) (0.943 mg·kg−1) and their extract (0.023 mg·L−1). The purple coneflower leaves (Ep L) and their extract contained the highest amount of B (222 mg·kg−1 and 7.86 mg·L−1, respectively). The lowest amount of this element was observed in red lentil seeds (Lc S) (6.56 mg·kg−1), Ps S (7.08 mg·kg−1), and So R (9.25 mg·kg−1). The vast majority of extracts contained less than 1 mg·L−1 of boron. The amount of Fe ranged from 19.4 mg·kg−1 (for black chokeberry fruits, Am Fr) to 720 mg·kg−1 (for common marigold flowers, Co F). Most of the extracts contained less than 1 mg·L−1 of iron, with the exception of aloe leaves (Alv L, 5.21 mg·L−1) and So R (comfrey roots, 4.85 mg·L−1) along with nettle roots (Ur R, 1.11 mg·L−1), (Co F, 1.27 mg·L−1), basil herb (Ob H, 1.34 mg·L−1), pea seeds (Ps S, 1.44 mg·L−1), red lentil seeds (Lc S, 1.58 mg·L−1), and valerian roots (Vo R, 1.58 mg·L−1). The amount of Zn among the raw materials was diverse and varied from 5.41 mg·kg−1 (for black chokeberry fruits, Am Fr) to 50.1 mg·kg−1 (common knotgrass herb, Poa H). The generality of extracts contained less than 1 mg·L−1 of zinc, and the lowest value was noted for black chokeberry fruits (Am Fr, 0.093 mg·L−1). The exceptions were purple coneflower flowers (Ep F, 3.37 mg·L−1), common bracken leaves (Pta L, 1.71 mg·L−1), St. John’s wort herb (Hp H, 1.12 mg·L−1), and pea seeds (Ps S, 1.07 mg·L−1). It can be seen that the highest content of a given microelement in the biomass did not always indicate its highest content in the extract.
In the case of macroelements, the content of Ca was the highest in nettle leaves (Ur L, 45,964 mg·kg−1) and purple coneflower leaves (Ep L, 40,254 mg·kg−1), whereas it was the lowest in red lentil seeds (Lc S, 300 mg·kg−1) and pea seeds (Ps S, 642 mg·kg−1). The extract based on purple coneflower leaves (Ep L, 1234 mg·L−1) was also characterised by a high content of calcium, as was the one obtained from aloe leaves (Alv L, 1193 mg·L−1). Lentil seed extract (Lc S, 7.43 mg·L−1) and sea-buckthorn fruit extract (Hr Fr, 10.5 mg·L−1) contained low levels of calcium. The content of K in the extracts mostly depended on its amount in raw materials: more potassium was transferred to the extract while more of it was in the biomass. For example, raw materials, such as purple coneflower flowers (Ep F, 39,187 mg·kg−1), common dandelion leaves (To L, 39,140 mg·kg−1), and basil herb (Ob H, 33,427 mg·kg−1) and their extracts (Ep F, 1414 mg·L−1; To L, 1319 mg·L−1; Ob H, 1218 mg·L−1) contained the highest content of potassium. In turn, red lentil seeds (Lc S, 8702 mg·kg−1), sea-buckthorn fruits (Hr Fr, 8467 mg·kg−1), black chokeberry fruits (Am Fr, 8118 mg·kg−1), St. John’s wort herb (Hp H, 7608 mg·kg−1) and their extracts (Lc S, 171 mg·L−1; Hr Fr, 234 mg·L−1; Am Fr, 206 mg·L−1; Hp H, 283 mg·L−1) were characterised by one of the lowest amounts of potassium. A similar trend can be observed in the magnesium content. The biomasses that contained the highest amount of Mg were: aloe leaves, basil herb, and nettle leaves (Alv L, 7472 mg·kg−1; Ob H, 6978 mg·kg−1; Ur L, 8611 mg·kg−1), and their extracts contained 319 mg·L−1, 217 mg·L−1, and 206 mg·L−1, respectively. Among the sources (biomasses and extracts), those with the lowest magnesium content can be mentioned: black chokeberry fruits (Am Fr, 795 mg·kg−1; 13.8 mg·L−1), red lentil seeds (Lc S, 781 mg·kg−1; 17.2 mg·L−1), and sea-buckthorn fruits (Hr Fr, 684 mg·kg−1; 16.7 mg·L−1). The sodium content ranged from 20 mg·kg−1 in black chokeberry fruits (Am Fr) and 0.760 mg·L−1 in purple coneflower leaves’ extract (Ep L) to 8327 mg·kg−1 and 442 mg·L−1 in broadleaf plantain herb (Pm H). The amount of P was the highest in chamomile flowers (Mc F, 4960 mg·kg−1) and common dandelion flowers (To F, 4853 mg·kg−1), and the lowest was in black chokeberry fruits (Am Fr, 1331 mg·kg−1). The extracts of common dandelion flowers (To F, 182 mg·L−1) contained the highest level of potassium, whereas sea-buckthorn fruits (Hr Fr, 18.0 mg·L−1) and nettle leaves (Ur L, 12.6 mg·L−1) contained the lowest. The amount of S ranged from 455 mg·kg−1 and 4.53 mg·L−1 in black chokeberry fruits (Am Fr) and their extract to 9683 mg·kg−1 and 453 mg·L−1 in broadleaf plantain herb (Pm H) and its extract.
Most of the raw materials contained less than 0.7 mg·kg−1 of Cd, with the exception of the common mugwort herb (Arv H), which included 1.84 mg·kg−1 of this element. The cadmium content was below the limit of detection (LOD) in the vast majority of extracts; the highest amount was in common mugwort herb extract (Arv H) (0.011 mg·L−1). The content of Cr ranged from 0.269 mg·kg−1 in common dandelion leaves (To L) to 6.08 mg·kg−1 in common knotgrass herb (Poa H). In the extracts, the concentration was from 0.0015 mg·L−1 in common mugwort herb (Arv H) to 0.248 mg·L−1 in common dandelion flowers (To F) (except in purple coneflower flowers (Ep F), which amounted 1.84 mg·L−1). The nickel quantity in raw materials was diversified: some contained a lower amount of Ni (such as beetroot roots (Bv R)–0.702 mg·kg−1), whereas others had higher amounts (e.g., red lentil seeds (Lc S)–10.8 mg·kg−1, pea seeds (Ps S)–11.8 mg·kg−1, nettle roots (Ur R)–10.7 mg·kg−1). Extracts based on purple coneflower flowers (Ep F), purple coneflower leaves (Ep L), and common dandelion flowers (To F) contained the highest levels of nickel (4.92 mg·L−1, 1.27 mg·L−1, 1.08 mg·L−1, respectively), whereas others contained less than 0.362 mg·L−1 (present in common marigold flowers, Co F). In the majority of cases, the lead quantity was below the limit of detection. The conducted analysis revealed that only three raw materials (common marigold flowers (Co F), common bracken leaves (Pta L), and purple coneflower leaves (Ep L)) contained above 2.00 mg·kg−1 of this heavy metal (2.83 mg·kg−1, 2.74 mg·kg−1, and 2.60 mg·kg−1, respectively), and five of them contained more than 1.00 mg·kg−1 (broadleaf plantain herb (Pm H)–1.82 mg·kg−1, nettle leaves (Ur R)–1.49 mg·kg−1, valerian roots (Vo R)–1.41 mg·kg−1, comfrey roots (So R)–1.34 mg·kg−1, red clover flowers (Tp F)–1.05 mg·kg−1).
3. Discussion
Plants, due to the content of bioactive compounds and secondary metabolites (e.g., alkaloids, flavonoids, phenolics, steroids, tannins, and terpenoids) provide significant ecological, pharmacological, and economical benefits [2]. At present, approximately 80% of the global population employs plant extracts for basic healthcare needs [25,44]. Natural products (NPs), being a source of complex mixtures of compounds, exhibit miscellaneous biological activities, including antibiotic, anticancer, antidiarrheal, antidiabetic, antihypertensive, anti-inflammatory, antimicrobial, antioxidant, antiparasitic, and hypoglycemic [25,44,45], as well as analgesic and wound-healing properties [25]. NPs (as pure compounds or as standardised extracts) offer endless possibilities for novel drug inventions by virtue of their peerless availability of chemical variety [25]. Natural products are successfully used in cosmetic, phytotherapy, and food-additive applications [44]. Plant secondary metabolites (e.g., terpenes, flavonoids, phenolic and polyphenolic compounds, nitrogen-containing and sulphur-containing compounds) also play a significant ecological role in crop defence (against, for example, bacteria, fungi, herbivores, plants, viruses), attraction and stimulation (e.g., nutrient sequestration, pollination), and counter abiotic stresses [18].
Saponins, a group of structurally varied molecules, are widely distributed surface-active glycosides with specific foaming properties [46,47,48,49]. Triterpenoid saponins are common in cultivated plants (soybeans, peas, beans, lucerne, tea, spinach, sunflower), whereas steroidal saponins mostly occur in herbs (soapbark, soapberry, soap root, soapwort) [47,48]. These compounds exhibit numerous properties that encompass both favourable and adverse impacts on human health, pesticidal, insecticidal, and molluscicidal activity, allelopathic action, antinutritional effects, sweetness and bitterness, and as phyto-protectants (against microbes and herbivores) [47,48,49]. Saponins are used in numerous applications, for example, medicine (due to their antimicrobial, anticancer, anti-inflammatory activity and beneficial role in cardiovascular disease), and in the pharmaceutical industry, they are used in the semi-synthesis of steroidal drugs. They are also utilised in the production of cosmetics (as stabilisers of emulsions, foam intensifications), food (as foaming agents in beverages and confectionery), (3) detergents, and (4) fire extinguishers [46,49,50]. Based on our primary research on the determination of saponins using the Froth test, the best source of these compounds was the extract obtained from giant goldenrod leaves (Sg L), whereas they were virtually not present in black chokeberry fruit (Am Fr) and sea-buckthorn fruit (Hr Fr) extracts.
Carboxylic acids or organic acids, possessing the carboxyl functional group [51,52,53], are grouped as aromatic, saturated, or unsaturated acids. They are intermediates in the degradation pathways of amino acids, carbohydrates, and fats [52]. These acids are widely spread in nature [52,53] or can be obtained in laboratory [52]. Due to their multiple functions, they are used for various applications in agriculture, the food industry, pharmacy, or medicine [51,52,54]. Carboxylic acids are used in the production of a broad range of products, e.g., adhesives, biopolymers, coatings, drugs, polymers, foods and beverages (as acidulants, antioxidants, emulsifiers, flavours, or preservatives) [52,54]. The quantitative assessment of organic acids levels in human body fluids can supply an initial identification of diverse ailments. They also find an application in pharmaceuticals (as solubilisers, prodrugs, bioprecursors, and pharmacophores) [52,55], cosmetics (to clean pores, improve the skin texture, or in acne treatment) [52,56], as well in the production of air fresheners, deodorants, and perfumes [52,57]. As presented in the Results section, the method of carboxylic acids’ extraction with the use of the NaHCO3 test did not allow for an indication of the presence of these chemicals in the examined plant extracts.
Fats and oils are triglycerides (solid, semi-solid, or liquid) that are suppliers of energy and nutrients [58,59,60,61]. Plants constitute an essential resource of these compounds from nature [62]. Their roles in the human body include, e.g., hormonal effects, protection of delicate organs, carrying soluble vitamins, or sensory palatability [61], and in food systems, they provide flavours and textures and improve aeration and moisture retention, therefore being effective cooking in frying [59,61]. In the pharmaceutical and cosmetic industry, oils are used as excipients, coadjuvants, transdermal carriers, and skin emolliency agents [63]. Plant oils can be used as well as a liquid fuel, which could be beneficial in view of rising petroleum prices and environmental concerns [62,64]. They can be applied in the production of lubricants and inks [62], soaps, and corrosion inhibitors [65]. The Sudan test allows for the observation of the presence of fixed oil and fat in numerous botanical extracts, for instance, in products based on aloe leaves (Alv L), common mugwort herb (Arv H), common marigold flowers (Co F), field horsetail herb (Ea H), purple coneflower leaves (Ep L), St. John’s wort herb (Hp H), chamomile flowers (Mc F), basil herb (Ob H), broadleaf plantain herb (Pm H), common knotgrass herb (Poa H), common bracken leaves (Pta L), giant goldenrod leaves (Sg L), comfrey roots (So R), common dandelion flowers, leaves, and roots (To F, To L, To R), red clover flowers (Tp F), as well as valerian roots (Vo R). Fixed oils and fats were not noted in the extracts obtained, for example, from black chokeberry fruits (Am Fr), sea-buckthorn fruits (Hr Fr), beetroot roots (Bv R), pea seeds (Ps S), red lentil seeds (Lc S), and nettle leaves and roots (Ur L, Ur R).
Plants, due to the large quantities of carbohydrates that make up their structure, contain lower amounts of protein compared to animal cells [66]. However, the vegetal food production has a lower environmental footprint than animal husbandry. Beyond 60% of the proteins necessary for human growth and development originate from plant resources [67]. Amino acids (AA) are components of proteins [66,67] and affect plethora of plant physiological processes (e.g., growth and development, resistance to environmental stresses, control of intracellular pH) [66,68]. On the basis of their synthesis in humans, they are classified as essential (synthesised only by plants) and non-essential (synthesised by plants and human) amino acids [67,69,70]. These compounds affect human physiological function and are used in medicine and nutrition [65]. Amino acids play a crucial role in metabolic processes and in the transport and storage of nutrients. The proper composition of AA is a requisite to correcting metabolic dysfunction and protecting from multiple diseases (e.g., arthritis, diabetes, insomnia, obesity) [67,70]. The application of the biuret test to detect proteins allowed for the confirmation of their presence in the extracts of pea seeds (Ps S) and red lentil seeds (Lc S), and the use of Millon’s test confirmed their presence in extracts based on purple coneflower flowers (Ep F) and comfrey roots (So R). On the other hand, the use of the sulphuric acid test enabled the observation of proteins in extracts produced from aloe leaves (Alv L), black chokeberry fruits (Am Fr), common marigold flowers (Co F), purple coneflower flowers (Ep F), purple coneflower leaves (Ep L), St. John’s wort herb (Hp H), red lentil seeds (Lc S), chamomile flowers (Mc F), common knotgrass herb (Poa H), pea seeds (Ps S), common bracken leaves (Pta L), giant goldenrod leaves (SgL), comfrey roots (So R), common dandelion leaves (To L), common dandelion roots (To R), and red clover flowers (Tp F). In most cases, the amino acids (marked by the use of the ninhydrin test) were present in plant extracts, with the exception of products based on aloe leaves (Alv L), black chokeberry fruits (Am Fr), purple coneflower flowers (Ep F), St. John’s wort herb (Hp H), sea-buckthorn fruits (Hr Fr), giant goldenrod leaves (Sg L), and nettle leaves (Ur L).
Steroids are secondary metabolites produced by animals, plants, and microorganisms [71,72], and those found in plants can be grouped into (1) compounds with physiological function in the plant itself (e.g., hormones, pheromones), (2) allelochemical compounds related to animal hormones, and (3) allelochemical compounds with protective functions [73,74,75,76]. They are used in agriculture [77], cosmetics, herbal medicine, and nutrition [78]. They play a key role in the pharmacological activities of medicines [72]. Phytosterols are considered to be crucial dietary agents for lowering blood cholesterol, as well as improving immune function [74], protection against cancer [74,76], and cardiotonic [78] and antioxidant enzymes activity [74], as well as containing antibacterial properties [79]. They are used in food production (margarine and milk derivatives). Through the manipulation of phytosterol profiles, the level of other metabolites (improper for consumption or industrial processing) can be influenced [74]. Terpenoids are a large and structurally varied class of plant natural products that occur in many plants [80,81,82] and are essential to their survival [80]. More than 50 000 different structures of these compounds have been reported to date [83]. Terpenoids are active compounds that possess miscellaneous properties beneficial to humans [80]. They are widely applied in the industrial sector as flavours, fragrances, and spices, as well as in cosmetics, medicine, nutraceuticals, and perfumery [80,81]. They exhibit a broad spectrum of activities, for example: antimicrobial, anticancer, antifoaming, carminative, hepatoprotective, neuroprotective, anti-inflammatory, and antinociceptive actions [81,84]. The implementation of the Salkowski test confirmed that the following extracts—beetroot roots (Bv R), common marigold flowers (Co F), chamomile flowers (Mc F), basil herb (Ob H), broadleaf plantain herb (Pm H), and pea seeds (Ps S)—contained steroids, whereas triterpenoids were present in the extracts produced from aloe leaves (Alv L), common marigold flowers (Co F), field horsetail herb (Ea H), sea-buckthorn fruits (Hr Fr), and common knotgrass herb (Poa H). Triterpenes were present in the extracts obtained from aloe leaves (Alv L), common marigold flowers (Co F), field horsetail herb (Ea H), sea-buckthorn fruits (Hr Fr), chamomile flowers (Mc F), common knotgrass herb (Poa H), red clover flowers (Tp F), nettle leaves (Ur L), and roots (Ur R). Most of the plant extracts contained phytosterols. The acetic acid and H2SO4 test did not allow for the detection of terpenoids in plant extracts. The steroids, verified by the Liebermann–Burchard test, were only observed in extracts produced from black chokeberry fruits (Am Fr) and purple coneflower flowers (Ep F), whereas extracts from chamomile flowers (Mc F) and nettle roots (Ur R) contained phytosterols.
Alkaloids are a large group of approximately 27,000 organic nitrogen-containing compounds that constitute one of the most abundant classes of metabolites [85,86,87]. Most alkaloids are biosynthetically derived from amino acids (e.g., lysine, ornithine, phenylalanine, tryptophan, and tyrosine [87,88]) and are often classified, based on their molecular skeletons, into: pyridine, tropane, quinoline, isoquinoline, phenanthrene, phenylethylamine, indole, purine, imidazole, and terpenoid groups of alkaloids [85,89]. These compounds are normally produced by plants (especially flowering) as toxic substances [86]. They take part in the improvement of reproductive rates, among other methods, by the incrementation of defences against plant growth stressors (biotic and abiotic) [85]. They are also of great importance in human life [88]. It is estimated that over than 17,000 of them exhibit pharmacological activities [86], in particular: anticancer, antibacterial, antiviral, anti-inflammatory, analgesic, antiasthmatic, antiarrhythmic, antipyretics, antihypertensive, antihyperglycemic, and antihypertensive effects [87,90]. They are frequently used in clinical practice, for example: morphine as a narcotic analgesic, codeine to reduce coughing, vinblastine to treat cancer, and berberine hydrochloride as an antibacterial agent [87]. The major attention of alkaloid research is focused in pharmacology/pharmacy (17.53%), plant sciences (13.24%), and medicinal chemistry (9.96%) [88]. Due to diversified activities, their production, extraction, and processing are one of the key research directions and developments [88,91]. The applied methods showed different sensitivities of the alkaloid detection in plant extracts. The preparations that could be considered a potential source of these compounds include, among others, common mugwort herb (Arv H), common marigold flowers (Co F), red lentil seeds (Lc S), basil herb (Ob H), pea seeds (Ps S), common bracken leaves (Pta L), comfrey roots (So R), and common dandelion leaves (To L).
For the proper growth of plants, seventeen elements are required (i.e., C, H, O, N, P, K, Ca, Mg, S, Fe, Zn, Mn, B, Cu, Mo, Cl, Ni) [92,93]. The carbon, hydrogen, and oxygen are uptaken from carbon dioxide and water, while the remaining elements, termed mineral nutrients, are from the soil [92,94]. The mineral nutrients are divided into two groups: macronutrients (consisting of elements in large supply, such as Ca, K, Mg, N, P, S) and micronutrients (usually needed in small amounts, such as B, Cl, Cu, Fe, Mn, Mo, Ni, Zn) [92]. The demand of living organisms for micronutrients is low, yet despite this, micronutrients are crucial for the essential cell functions and can significantly affect the growth and quality of plants, as well as the health of animals and humans [94,95]. Sufficient intake of these elements may help in the prevention or treatment of varied ailments (e.g., arterial hypertension and bone demineralization) and hidden hunger. Plants are a good source of these minerals and should be an integral part of the human diet [94]. However, the mineral content of plants depends on their species and parts as well as growth conditions, in particular, their geographic location, soil constitution, water source, irrigation, and type of fertilisers [96]. For this reason, proper attempts are necessary to overcome the shortages of micronutrients. The results of this study revealed that the botanical extracts could be considered a source of micro- and macroelements. On average, the macronutrients were present in the greatest amounts in the extracts based on aloe leaves (Alv L), purple coneflower leaves (Ep L), broadleaf plantain herb (Pm H), nettle leaves (Ur L), basil herb (Ob H), and common dandelion leaves (To L), whereas micronutrients were present in products obtained from common marigold flowers (Co F), purple coneflower flowers (Ep F), basil herb (Ob H), common dandelion flowers (To F), aloe leaves (Alv L), valerian roots (Vo R), common knotgrass herb (Poa H), giant goldenrod leaves (Sg L), and common dandelion leaves (To L).
In the present research, the selected methods allowed for the detection of the biologically active compounds in plant materials. Ultrasound-assisted extraction can be used to easily extract these natural chemicals, which are generally recognised as safe. Phytochemicals elicit many beneficial health effects in man and animals and will continue to play an important role in numerous therapies and as preventive agents against diseases, as well as in other industries.
4. Materials and Methods
4.1. Chemicals and Reagents
The following chemicals were used for analysis of the content of bioactive compounds: sodium bicarbonate (Honeywell), potassium sodium tartrate tetrahydrate (Merck), potassium hydroxide (Merck), phenolphthalein (Avantor), Sudan III (Waldeck), sodium hydroxide (Avantor), copper(II) sulphate (Avantor), mercuric chloride (Avantor), mercuric nitrate (Sigma Aldrich), mercurous nitrate (Alfa Aesar), nitric acid (Merck), sulphuric acid (Avantor), ammonium hydroxide (Supelco), ninhydrin (Sigma Aldrich), acetone (Stanlab), chloroform (Avantor), acetic acid (Supelco), acetic anhydride (Avantor), picric acid (Sigma Aldrich), tannic acid (Alfa Aesar), mercury(II) chloride (Avantor), bismuth subnitrate (Honeywell), glacial acetic acid (Supelco), potassium iodide (Sigma Aldrich), hydrochloric acid (Avantor), iodine (Sulpeco), multi-elemental stock ICP standard solution (no. XVI, Merck), single ICP stocks of As, Hg, P, S, and Se (Merck).
4.2. Plant Materials Used for Extraction of Compounds
Raw materials (with abbreviations) selected for the preparation of extracts used in this study included:
- Alv L–aloe leaves, Aloe vera (L.) Burm. f.;
- Am Fr–black chokeberry fruits, Aronia melanocarpa (Michx.) Elliott;
- Arv H–common mugwort herb, Artemisia vulgaris L.;
- Bv R–beetroot roots, Beta vulgaris L.;
- Co F–common marigold flowers, Calendula officinalis L.;
- Ea H–field horsetail herb, Equisetum arvense L.;
- Ep F–purple coneflower flowers, Echinacea purpurea (L.) Moench;
- Ep L–purple coneflower leaves, Echinacea purpurea (L.) Moench;
- Hp H–St. John’s wort herb, Hypericum perforatum L.;
- Hr Fr–sea-buckthorn fruits, Hippophae rhamnoides L.;
- Lc S–red lentil seeds, Lens culinaris Medik.;
- Mc F–chamomile flowers, Matricaria chamomilla L.;
- Ob H–basil herb, Ocimum basilicum L.;
- Pm H–broadleaf plantain herb, Plantago major L.;
- Poa H–common knotgrass herb, Polygonum aviculare L.;
- Ps S–pea seeds, Pisum sativum L.;
- Pta L–common bracken leaves, Pteridium aquilinum (L.) Kuhn;
- Sg L–giant goldenrod leaves, Solidago gigantea Ait.;
- So R–comfrey roots, Symphytum officinale L.;
- To F–common dandelion flowers, Taraxacum officinale (L.) Weber ex F.H. Wigg.;
- To L–common dandelion leaves, Taraxacum officinale (L.) Weber ex F.H. Wigg.;
- To R–common dandelion roots, Taraxacum officinale (L.) Weber ex F.H. Wigg.;
- Tp F–red clover flowers, Trifolium pratense L.;
- Ur L–nettle leaves, Urtica dioica L.;
- Ur R–nettle roots, Urtica dioica L.;
- Vo R–valerian roots, Valeriana officinalis L.
4.3. Extraction
Bioproducts were obtained by means of ultrasound-assisted extraction (UAE) using the homogeniser UP 50 H (Hielscher Ultrasonics GmbH, Teltow, Germany). Dried and ground (500 μm mesh size) biomass was well-mixed in a glass beaker with deionised water (ratio 1:20 w/v), left for maceration (30 min, room temperature), sonicated (30 min), and centrifuged (4500 rpm, 10 min, Heraeus Megafuge 40, rotor TX-750, Thermo Scientific, Waltham, MA, USA). The obtained supernatants were used for analyses.
4.4. Analyses of Extracts
4.4.1. Determination of Dry Weight
Extracts were dried at 50 °C to the constant weight.
4.4.2. Determination of pH
The pH of extracts was measured using a pH meter (Mettler Toledo, Seven Multi).
4.4.3. Determination of Saponins
Aqueous test–distilled water (5 mL) was added to the extract (1 mL), and the resulting mixture was shaken vigorously for 15 min (Shatty and V 2012). The height of the foam (which lasted for 5 min) was measured.
4.4.4. Determination of Carboxylic Acid
NaHCO3 test–the extract (2 mL) was treated with NaHCO3 (5%, 2 mL) [29].
4.4.5. Determination of Oils and Fats
- (a)
- Saponification test–KOH (0.1 N, 10 drops) and phenophthalein idndicator (5 drops) were added to the extract (2 mL), and then the mixture was heated in a water bath (70 °C, 1.5 h) [27].
- (b)
- Sudan test–Sudan III solution (few drops) (0.5 g of dye was diluted in 100 mL of 99% isopropanol) was added to the extract (2 mL) [33].
4.4.6. Determination of Proteins and Amino Acids
- (a)
- Biuret test (for proteins)–biuret reagent (a few drops) was added to the extract (2 mL) [34]. The reagent was prepared by dissolving pentavalent copper sulphate (1.5 g) and potassium sodium tartrate (6.0 g) in distilled water (500 mL). Sodium hydroxide (2 M, 375 mL) was added, and the volumetric flask was filled up with distilled water (up to 1000 mL).
- (b)
- Millon’s test (for proteins)–Millon’s reagent (2 mL) was added to the extract (2 mL) and heated in a water bath (5 min) [37]. The Millon’s reagent was made by dissolving mercuric nitrate (160 g) and mercurous nitrate (160 g) in concentrated nitric acid (400 mL) and made up to 1000 mL with distilled water.
- (c)
- H2SO4 test (for proteins)–concentrated H2SO4 (1 mL) was added to the extract (3 mL). Subsequently, NH4OH (1 mL) was appended [37].
- (d)
- Ninhydrin test (for amino acids)–a ninhydrin solution (2 mL, 0.2% in acetone) was added to the extract (2 mL), and the solution was boiled in a water bath (10 min) [31].
4.4.7. Determination of Steroids
- (a)
- Salkowski test–chloroform (2 mL) and concentrated H2SO4 (2 mL) were added to the extract (2 mL) [34].
- (b)
- Acetic acid and H2SO4 test (terpenoids)–the extract (2 mL) was treated with acetic acid (2 mL) and sulphuric acid (1 mL) [31].
- (c)
- Liebermann–Burchard test–chloroform (1 mL), acetic anhydride (2 mL), and concentrated sulphuric acid (2 drops) were added to the extract (1 mL) [25].
4.4.8. Determination of Alkaloids
- (a)
- Hager’s test–Hager’s reagent (5 drops) (1% solution of picric acid in water) was added to the extract (2 mL) [37].
- (b)
- Tannic acid test–tannic acid solution (1 mL, 10% in water) was added to the extract (2 mL) [28].
- (c)
- Mayer’s test (1)–Mayer’s reagent (10 drops) was added on the sides of the test tube containing the extract (3 mL) [35]. The Mayer’s reagent was prepared by mixing two separately prepared aqueous solutions: mercuric chloride (1.36 g in 60 mL of distilled water) and potassium iodide (5 g in 10 mL of distilled water). The solutions were combined in a 100 mL volumetric flask and filled up to the mark with distilled water.
- (d)
- Mayer’s test (2)–concentrated hydrochloric acid (2 mL) and Mayer’s reagent (8 drops) were added to the extract (2 mL) [41].
- (e)
- Dragendroff’s test (1)–Dragendroff’s reagent (1 mL) was added to the extract (2 mL) [43]. The Dragendroff’s reagent was prepared by mixing (in ratio 1:1) solution A, prepared by dissolving bismuth nitrate (0.85 g) in water (40 mL) and acetic acid (10 mL), and solution B was prepared by dissolving potassium iodine (8 g) in water (20 mL). Then, 5 mL of each solution was transferred to a 100 mL volumetric flask, mixed with glacial acetic acid (20 mL), diluted with water to volume, and mixed [97,98,99].
- (f)
- Dragendroff’s test (2)–HCl (1 mL) and Dragendroff’s reagent (0.5 mL) were added to the extract (2.5 mL) [40].
- (g)
- Wagner’s test–Wagner’s reagent (5 drops) was added to the extract (2 mL) [29].
4.4.9. Determination of Multielemental Composition
Sample preparation: the total concentrations of elements in the raw materials and extracts were determined by ICP OES following the microwave-assisted closed-vessel digestion. Plant biomasses (0.250 g) and extracts (5.0 mL) were placed into PTFE vessels and poured over with 5.0 mL of concentrated HNO3. The digestion in the microwave reaction system employed a six-step microwave-assisted heating program (190 °C, 60 min). The obtained remnants were cooled down to room temperature and quantitatively transferred into 30-mL polypropylene containers (Equimed, Wrocław, Poland), diluted with deionised water to 25.0 g, and kept at 4 °C until measurement. Analyses were made in triplicate (n = 3). The digestion of samples was carried out using a Multiwave PRO microwave reaction system (Anton Paar GmbH, Austria; 24HVT50 rotor; 50 mL PTFE-TFM pressure-activated-venting vessels).
Instrumentation: the spectrometric analyses were conducted with the use of bench-top simultaneous optical emission Ar-ICP spectrometer (Agilent, model 720) with the torch in the axial alignment. The apparatus consists of a four-channel peristaltic pump, a high-resolution Echelle-type polychromator with temperature-controlled optics, and a VistaChip II CCD detector. To sustain and operate the plasma, a standard, one-piece, quartz torch with an injector tube (2.4 mm ID) was used. For the pneumatic nebulisation of the sample solution, a glass single-pass cyclonic spray chamber (Agilent) combined with a concentric OneNeb nebuliser (Agilent) was applied. The operating settings were as follows: the RF power was 1.2 kW; gas flow rates (in L·min−1) were 15.0 (plasma), 1.5 (auxiliary), and 0.75 (nebuliser); the sample flow rate was 0.75 mL·min−1, and the instrument stabilisation and sample uptake delays were 15 s, rinsed and replicated times 10 and 1 s (three replicates). The analytical lines selected for measurements were as follows: 396.1 nm (Al), 188.9 nm for (As), 249.7 (B), 455.5 nm (Ba), 317.9 nm (Ca), 214.4 nm (Cd), 267.7 nm (Cr), 327.3 nm (Cu), 238.2 nm (Fe), 253.6 nm (Hg), 766.4 nm (K), 285.2 nm (Mg), 257.6 nm (Mn), 589.5 nm (Na), 231.6 (Ni), 213.6 nm (P), 220.6 nm (Pb), 181.9 nm (S), 196.0 nm (Se), 407.7 nm (Sr), and 213.8 (Zn). To quantify the content of the elements, external calibration curves (six points, concentration range from 0 to 5 mg·L−1) were applied.
5. Conclusions
Plant-based extracts will continue to be essential and renewable sources of biologically active compounds in most sectors of industry, starting from foods, through cosmetics and agriculture agents, to medicine products and drugs. The presented techniques for the detection of valuable compounds are accessible and inexpensive and provide a quick answer as to the composition of the obtained bio-products. However, continuous progress in analytical techniques, especially chromatographics, should allow for the identification of as-yet unidentified plant chemicals and open up new perspectives for their utilisation in the near future.
Author Contributions
Conceptualisation, K.G.; methodology, K.G. and I.M.; formal analysis, K.G., P.P. and I.M.; investigation, K.G., A.S.-M. and M.W.; resources, K.G.; writing—original draft preparation, K.G., P.P. and I.M.; writing—review and editing, A.S.; supervision, K.G. and I.M.; funding acquisition, K.G. All authors have read and agreed to the published version of the manuscript.
Funding
This work was financed in the framework of the grant entitled Mechanism of Action of Novel Plant-Derived Extracts and Their Impact on Stress Resilience of Arabidopsis thaliana (2018/29/N/NZ9/02430) attributed by The National Science Center in Poland.
Institutional Review Board Statement
Not applicable.
Informed Consent Statement
Not applicable.
Data Availability Statement
Not applicable.
Conflicts of Interest
The authors declare no conflict of interest.
Sample Availability
Not applicable.
References
- Altemimi, A.; Lakhssassi, N.; Baharlouei, A.; Watson, D.G.; Lightfoot, D.A. Phytochemicals: Extraction, isolation, and identification of bioactive compounds from plant extracts. Plants 2017, 6, 42. [Google Scholar] [CrossRef] [PubMed]
- Goyal, M.R.; Ayeleso, A.O. Bioactive Compounds of Medicinal Plants. Properties and Potential for Human Health; Apple Academic Press, Inc.: Oakville, ON, Canada; Waretown, NJ, USA, 2021; ISBN 9781774631454. [Google Scholar]
- Aung, E.E.; Kristanti, A.N.; Aminah, N.S.; Takaya, Y.; Ramadhan, R. Plant description, phytochemical constituents and bioactivities of Syzygium genus: A review. Open Chem. 2020, 18, 1256–1281. [Google Scholar] [CrossRef]
- Adeyinka, A.; Richard, F. Application of phytochemical extracts and essential oils in food products: A review. Int. J. Biotechnol. Food Sci. 2015, 3, 31–35. [Google Scholar]
- Palombo, E.A. Traditional medicinal plant extracts and natural products with activity against oral bacteria: Potential application in the prevention and treatment of oral diseases. Evid.-Based Complement. Altern. Med. 2011, 2011, 680354. [Google Scholar] [CrossRef]
- Rodino, S.; Butu, M. Herbal Extracts-New Trends in Functional and Medicinal Beverages; Elsevier Inc.: Amsterdam, The Netherlands, 2019; ISBN 9780128163979. [Google Scholar]
- Iordache, A.; Culea, M.; Gherman, C.; Cozar, O. Characterization of some plant extracts by GC-MS. Nucl. Instrum. Methods Phys. Res. Sect. B Beam Interact. Mater. Atoms 2009, 267, 338–342. [Google Scholar] [CrossRef]
- Yahya, N.A.; Attan, N.; Wahab, R.A. An overview of cosmeceutically relevant plant extracts and strategies for extraction of plant-based bioactive compounds. Food Bioprod. Process. 2018, 112, 69–85. [Google Scholar] [CrossRef]
- Abubakar, A.R.; Haque, M. Preparation of medicinal plants: Basic extraction and fractionation procedures for experimental purposes. Asian J. Pharm. Clin. Res. 2020, 12, 1–10. [Google Scholar] [CrossRef]
- Available online: www.marketsandmarkets.com (accessed on 5 February 2022).
- Özaslan, M.; Oguzkan, S.B. Use of plant extracts in alternative medicine. Pakistan J. Biol. Sci. 2018, 21, 1–7. [Google Scholar] [CrossRef]
- Yu, X.Y.; Zhang, Y.; Chen, X.Q.; Zu, Y.G. The product life cycle design in plant extracts industry. In Proceedings of the 2011 IEEE 18th International Conference on Industrial Engineering and Engineering Management, Changchun, China, 3–5 September 2011; pp. 573–575. [Google Scholar] [CrossRef]
- Isman, M.B.; Miresmailli, S.; MacHial, C. Commercial opportunities for pesticides based on plant essential oils in agriculture, industry and consumer products. Phytochem. Rev. 2011, 10, 197–204. [Google Scholar] [CrossRef]
- Adesina, J.M.; Rajashekar, Y. Phytochemical composition and insecticidal potentials of some plant aqueous extracts in suppressing Podagrica spp. (Coleoptera: Chrysomelidae) infestation on Okra (Abelmoschus esculentus L. Moench). Adv. Hortic. Sci. 2018, 32, 71–78. [Google Scholar] [CrossRef]
- Lengai, G.M.W.; Muthomi, J.W.; Mbega, E.R. Phytochemical activity and role of botanical pesticides in pest management for sustainable agricultural crop production. Sci. African 2020, 7, e00239. [Google Scholar] [CrossRef]
- Godlewska, A.; Ciepiela, G.A. Italian ryegrass (Lolium multiflorum Lam.) fiber fraction content and dry matter digestibility following biostimulant application against the background of varied nitrogen regime. Agronomy 2021, 11, 39. [Google Scholar] [CrossRef]
- Godlewska, K.; Ronga, D.; Michalak, I. Plant extracts—Importance in sustainable agriculture. Ital. J. Agron. 2021, 16, 1–23. [Google Scholar] [CrossRef]
- Clemensen, A.K.; Provenza, F.D.; Hendrickson, J.R.; Grusak, M.A. Ecological Implications of Plant Secondary Metabolites—Phytochemical Diversity Can Enhance Agricultural Sustainability. Front. Sustain. Food Syst. 2020, 4, 547826. [Google Scholar] [CrossRef]
- Dekebo, A. Introductory Chapter. In Plant Extracts; IntechOpen: London, UK, 2019; pp. 1–10. [Google Scholar] [CrossRef]
- Rasoanaivo, P.; Wright, C.W.; Willcox, M.L.; Gilbert, B. Whole plant extracts versus single compounds for the treatment of malaria: Synergy and positive interactions. Malar. J. 2011, 10, S4. [Google Scholar] [CrossRef] [PubMed]
- Alsheikh, H.M.A.; Sultan, I.; Kumar, V.; Rather, I.A.; Al-sheikh, H.; Jan, A.T.; Haq, Q.M.R. Plant-based phytochemicals as possible alternative to antibiotics in combating bacterial drug resistance. Antibiotics 2020, 9, 480. [Google Scholar] [CrossRef]
- Zerazion, E.; Rosa, R.; Ferrari, E.; Veronesi, P.; Leonelli, C.; Saladini, M.; Ferrari, A.M. Phytochemical compounds or their synthetic counterparts? A detailed comparison of the quantitative environmental assessment for the synthesis and extraction of curcumin. Green Chem. 2016, 18, 1807–1818. [Google Scholar] [CrossRef]
- Nxumalo, K.A.; Aremu, A.O.; Fawole, O.A. Potentials of medicinal plant extracts as an alternative to synthetic chemicals in postharvest protection and preservation of horticultural crops: A review. Sustainability 2021, 13, 5897. [Google Scholar] [CrossRef]
- Tuama, A.A.; Mohammed, A.A. Phytochemical screening and in vitro antibacterial and anticancer activities of the aqueous extract of Cucumis sativus. Saudi J. Biol. Sci. 2019, 26, 600–604. [Google Scholar] [CrossRef]
- Sasidharan, S.; Chen, Y.; Saravanan, D.; Sundram, K.M.; Yoga Latha, L. Extraction, isolation and characterization of bioactive compounds from plants’ extracts. African J. Tradit. Complement. Altern. Med. 2011, 8, 1–10. [Google Scholar] [CrossRef]
- Pateiro, M.; Gómez-Salazar, J.A.; Jaime-Patlán, M.; Sosa-Morales, M.E.; Lorenzo, J.M. Plant extracts obtained with green solvents as natural antioxidants in fresh meat products. Antioxidants 2021, 10, 181. [Google Scholar] [CrossRef] [PubMed]
- Shetty, S.; Vijayalaxmi, K.K. Phytochemical investigation of extract/solvent fractions of Piper nigrum Linn. Seeds and Piper betle Linn. leaves. Int. J. Pharma Bio Sci. 2012, 3, 344–349. [Google Scholar]
- Ramya, G.L.P.; Vasanth, P.M.; Prasad, P.V.; Sarath Babu, V. Qualitative Phytochemical Screening Tests of Alpinia. World J. Pharm. Res. 2019, 8, 1064. [Google Scholar] [CrossRef]
- Anoma, G.; Ajantha; Kumari, C.; Anjan. Alcoholic Extraction and Phyto-Chemical Evaluation of Chakramarda Seeds (Cassia tora Linn.). Int. J. Res. Ayurveda Pharm. 2017, 8, 157–161. [Google Scholar] [CrossRef]
- Auwal, M.S.; Saka, S.; Mairiga, I.A.; Sanda, K.A.; Shuaibu, A.; Ibrahim, A. Preliminary phytochemical and elemental analysis of aqueous and fractionated pod extracts of Acacia nilotica (Thorn mimosa). Vet. Res. forum an Int. Q. J. 2014, 5, 95–100. [Google Scholar]
- Muniyandi, J.M.; Jothi Muniyandi, M.; Professor, A. Preliminary Studies of Phytochemical Investigation on Coastal Medicinal Plants of Boloor, Mangalore. Indo Am. J. P. Sci. 2018, 5, 5. [Google Scholar]
- Tan, K.K.; Khoo, T.J.; Wiart, C. Phytochemical screening of Artabotrys crassifolius Hook. F. & Thomson (Anninaceae Juss.). Innovare J. Ayurvedic Sci. 2013, 1, 14–17. [Google Scholar]
- Le BaoDuy, N.; Trang, D.T.D.; Trang, N.P.M. Preliminary phytochemical analysis of leaf extracts of Thuja orientalis (L.) Endl. Int. J. Res. Sscience Manag. 2015, 2, 21–25. [Google Scholar]
- Rufai, Y.; Isah, Y.; Isyaka, M.S. Comparative Phyto-Constituents Analysis from the Root Bark and Root Core Extractives of Cassia ferruginea (Schrad D. C) Plant. Sch. J. Agric. Vet. Sci. 2016, 3, 275–283. [Google Scholar] [CrossRef]
- Abdalla, A.A.; Mustafa, I.; Makhawi, A.M.; Mustafa, M.I. Phytochemical screening and antimicrobial activities studies of Acacia nilotica fruit cover. bioRxiv 2020, 1–16. [Google Scholar] [CrossRef]
- Shukla, S.; Mehta, A.; Bajpai, V.K. Phytochemical Screening and Anthelmintic and Antifungal Activities of Leaf Extracts of Stevia rebaudiana. J. Biol. Act. Prod. Nat. 2013, 3, 56–63. [Google Scholar] [CrossRef][Green Version]
- Kumar, S.; Singh, B.B.; Kumar, N. Physico-chemical and phytochemical investigation of plant Sesbania sesban. Res. J. Pharm. Biol. Chem. Sci. 2014, 5, 110–117. [Google Scholar]
- Azalea Berenguer-Rivas, C.; Mas-Ortiz, M.; Batista-Corbal, P.L.; Costa-Acosta, J.; Julio César Escalona-Arranz, C. Chemical composition and in-vitro antioxidant activity of extracts of Adelia ricinella L. Rev. Cuba. Quim. 2018, 30, 191–209. [Google Scholar]
- Kakpure, M.R.; Rothe, S.P.; Shivaji, S. Phytochemical Screening of Alectra Parasitica a. Rich—A rare medicinal parasitic plant. Adv. Res. Pharm. Biol. 2012, 2, 103–111. [Google Scholar]
- Shah, M.D.; Hossain, M.A. Total flavonoids content and biochemical screening of the leaves of tropical endemic medicinal plant Merremia borneensis. Arab. J. Chem. 2014, 7, 1034–1038. [Google Scholar] [CrossRef]
- Jayapriya, G.; Gricilda Shoba, F. Screening for phytochemical activity of Urechites lutea plant. Pelagia Res. Libr. Asian J. Plant Sci. Res. 2014, 4, 20–24. [Google Scholar]
- Góral, I.; Wojciechowski, K. Surface activity and foaming properties of saponin-rich plants extracts. Adv. Colloid Interface Sci. 2020, 279, 102145. [Google Scholar] [CrossRef]
- Das, P.E.; Abu-Yousef, I.A.; Majdalawieh, A.F.; Narasimhan, S.; Poltronieri, P. Green Synthesis of Encapsulated Copper Nanoparticles Using a Hydroalcoholic Extract of Moringa oleifera Leaves and Assessment of Their Antioxidant and Antimicrobial Activities. Molecules 2020, 25, 555. [Google Scholar] [CrossRef]
- Armendáriz-Barragán, B.; Zafar, N.; Badri, W.; Galindo-Rodríguez, S.A.; Kabbaj, D.; Fessi, H.; Elaissari, A. Plant extracts: From encapsulation to application. Expert Opin. Drug Deliv. 2016, 13, 1165–1175. [Google Scholar] [CrossRef]
- Atanasov, A.G.; Zotchev, S.B.; Dirsch, V.M.; Orhan, I.E.; Banach, M.; Rollinger, J.M.; Barreca, D.; Weckwerth, W.; Bauer, R.; Bayer, E.A.; et al. Natural products in drug discovery: Advances and opportunities. Nat. Rev. Drug Discov. 2021, 20, 200–216. [Google Scholar] [CrossRef]
- Sparg, S.G.; Light, M.E.; Van Staden, J. Biological activities and distribution of plant saponins. J. Ethnopharmacol. 2004, 94, 219–243. [Google Scholar] [CrossRef]
- Desai, S.D.; Desai, D.G.; Kaur, H. Saponins and their biological activities. Pharma Times 2009, 41, 13–16. [Google Scholar]
- Francis, G.; Kerem, Z.; Makkar, H.P.S.; Becker, K. The biological action of saponins in animal systems: A review. Br. J. Nutr. 2002, 88, 587–605. [Google Scholar] [CrossRef] [PubMed]
- Moghimipour, E.; Handali, S. Saponin: Properties, Methods of Evaluation and Applications. Annu. Res. Rev. Biol. 2015, 5, 207–220. [Google Scholar] [CrossRef]
- Kregiel, D.; Berlowska, J.; Witonska, I.; Antolak, H.; Proestos, C.; Babic, M.; Babic, L.; Zhang, B. Saponin-Based, Biological-Active Surfactants from Plants. Appl. Charact. Surfactants 2017, 183–205. [Google Scholar] [CrossRef]
- Emam, K.A. Effect of carboxylic acids fertilization on growth and chemical composition of Althaea rosea Cav. grown in different soil types. Middle East J. Agric. Res. 2017, 6, 1313–1327. [Google Scholar]
- Badea, G.I.; Radu, G.L. Introductory Chapter. In Carboxylic Acid—Key Role in Life Sciences; IntechOpen: London, UK, 2018; pp. 1–6. [Google Scholar] [CrossRef]
- Godlewska-żyłkiewicz, B.; Świsłocka, R.; Kalinowska, M.; Golonko, A.; Świderski, G.; Arciszewska, Ż.; Nalewajko-Sieliwoniuk, E.; Naumowicz, M.; Lewandowski, W. Biologically active compounds of plants: Structure-related antioxidant, microbiological and cytotoxic activity of selected carboxylic acids. Materials 2020, 13, 4454. [Google Scholar] [CrossRef] [PubMed]
- Marchyshyn, S.; Slobodianiuk, L.; Budniak, L.; Skrynchuk, O. Analysis of carboxylic acids of Crambe cordif olia Steven. Pharmacia 2021, 68, 15–21. [Google Scholar] [CrossRef]
- Lamberth, C.; Dinges, J. Different Roles of Carboxylic Functions in Pharmaceuticals and Agrochemicals. In Bioactive Carboxylic Compound Classes: Pharmaceuticals and Agrochemicals; Wiley: Hoboken, NJ, USA, 2016; pp. 1–11. [Google Scholar] [CrossRef]
- Yu, R.J.; Van Scott, E.J. Alpha-hydroxyacids and carboxylic acids. J. Cosmet. Dermatol. 2004, 3, 76–87. [Google Scholar] [CrossRef]
- Talzi, V.P. A 13C and 1H NMR analysis of perfumes. Russ. J. Appl. Chem. 2006, 79, 107–116. [Google Scholar] [CrossRef]
- Damude, H.G.; Kinney, A.J. Enhancing plant seed oils for human nutrition. Plant Physiol. 2008, 147, 962–968. [Google Scholar] [CrossRef] [PubMed]
- Aremu, M.O.; Ibrahim, H.; Bamidele, T.O. Physicochemical Characteristics of the Oils Extracted from Some Nigerian Plant Foods—A Review. Chem. Process Eng. Res. 2015, 32, 36–52. [Google Scholar]
- Dilworth, L.L.; Riley, C.K.; Stennett, D.K. Plant Constituents: Carbohydrates, Oils, Resins, Balsams, and Plant Hormones; Elsevier Inc.: Amsterdam, The Netherlands, 2017; Volume 1, ISBN 9780128020999. [Google Scholar]
- Ogori, A.F. Source, extraction and constituents of fats and oils. Food Sci. Nutr. 2020, 6, 100060. [Google Scholar] [CrossRef]
- Dyer, J.M.; Stymne, S.; Green, A.G.; Carlsson, A.S. High-value oils from plants. Plant J. 2008, 54, 640–655. [Google Scholar] [CrossRef]
- Hernandez, E.M. Specialty Oils: Functional and Nutraceutical Properties. In Functional Dietary Lipids; Elsevier Ltd.: Amsterdam, The Netherlands, 2015; ISBN 9781782422570. [Google Scholar]
- Muniyappa, P.R.; Brammer, S.C.; Noureddini, H. Improved conversion of plant oils and animal fats into biodiesel and co-product. Bioresour. Technol. 1996, 56, 19–24. [Google Scholar] [CrossRef]
- Scott, E.; Peter, F.; Sanders, J. Biomass in the manufacture of industrial products-the use of proteins and amino acids. Appl. Microbiol. Biotechnol. 2007, 75, 751–762. [Google Scholar] [CrossRef]
- Hildebrandt, T.M.; Nunes Nesi, A.; Araújo, W.L.; Braun, H.P. Amino Acid Catabolism in Plants. Mol. Plant 2015, 8, 1563–1579. [Google Scholar] [CrossRef]
- Kumar, V.; Sharma, A.; Kaur, R.; Thukral, A.K.; Bhardwaj, R.; Ahmad, P. Differential distribution of amino acids in plants. Amino Acids 2017, 49, 821–869. [Google Scholar] [CrossRef]
- Ortiz-Lopez, A.; Chang, H.-C.; Bush, D.R. Amino acid transporters in plants. Plant Membr. Vacuolar Transp. 2008, 1465, 267–282. [Google Scholar] [CrossRef]
- Ufaz, S.; Galili, G. Improving the content of essential amino acids in crop plants: Goals and opportunities. Plant Physiol. 2008, 147, 954–961. [Google Scholar] [CrossRef]
- Wu, G. Functional amino acids in nutrition and health. Amino Acids 2013, 45, 407–411. [Google Scholar] [CrossRef] [PubMed]
- Castilla, V.; Ramirez, J.; Coto, C.E. Plant and Animal Steroids a New Hope to Search for Antiviral Agents. Curr. Med. Chem. 2010, 17, 1858–1873. [Google Scholar] [CrossRef] [PubMed]
- Gunaherath, G.M.K.B.; Gunatilaka, A.A.L. Plant Steroids: Occurrence, Biological Significance and their Analysis. Encycl. Anal. Chem. 2014, 1–26. [Google Scholar] [CrossRef]
- Dinan, L.; Harmatha, J.; Lafont, R. Chromatographic procedures for the isolation of plant steroids. J. Chromatogr. A 2001, 935, 105–123. [Google Scholar] [CrossRef]
- Vriet, C.; Russinova, E.; Reuzeaua, C. Boosting crop yields with plant steroids. Plant Cell 2012, 24, 842–857. [Google Scholar] [CrossRef]
- Macías, F.A.; Chinchilla, N.; Varela, R.M.; Molinillo, J.M.G. Bioactive steroids from Oryza sativa L. Steroids 2006, 71, 603–608. [Google Scholar] [CrossRef]
- Malíková, J.; Swaczynová, J.; Kolář, Z.; Strnad, M. Anticancer and antiproliferative activity of natural brassinosteroids. Phytochemistry 2008, 69, 418–426. [Google Scholar] [CrossRef]
- Zhabinskii, V.N.; Khripach, N.B.; Khripach, V.A. Steroid plant hormones: Effects outside plant kingdom. Steroids 2015, 97, 87–97. [Google Scholar] [CrossRef]
- Shyamala Gowri, S.; Vasantha, K. Phytochemical screening and antibacterial activity of Syzygium cumini (L.) (Myrtaceae) leaves extracts. Int. J. PharmTech Res. 2010, 2, 1569–1573. [Google Scholar] [CrossRef]
- Vollaro, A.; Esposito, A.; Antonaki, E.; Iula, V.D.; D’alonzo, D.; Guaragna, A.; De Gregorio, E. Steroid derivatives as potential antimicrobial agents against staphylococcus aureus planktonic cells. Microorganisms 2020, 8, 468. [Google Scholar] [CrossRef]
- Singh, B.; Sharma, R.A. Plant terpenes: Defense responses, phylogenetic analysis, regulation and clinical applications. 3 Biotech 2015, 5, 129–151. [Google Scholar] [CrossRef] [PubMed]
- Ludwiczuk, A.; Skalicka-Woźniak, K.; Georgiev, M.I. Terpenoids; Elsevier: Amsterdam, The Netherlands, 2017; ISBN 9780128020999. [Google Scholar]
- Tetali, S.D. Terpenes and isoprenoids: A wealth of compounds for global use. Planta 2019, 249, 1–8. [Google Scholar] [CrossRef] [PubMed]
- Yang, W.; Chen, X.; Li, Y.; Guo, S.; Wang, Z.; Yu, X. Advances in Pharmacological Activities of Terpenoids. Nat. Prod. Commun. 2020, 15, 1934578X2090355. [Google Scholar] [CrossRef]
- Kiyama, R. Estrogenic terpenes and terpenoids: Pathways, functions and applications. Eur. J. Pharmacol. 2017, 815, 405–415. [Google Scholar] [CrossRef]
- Matsuura, H.N.; Fett-Neto, A.G. Plant Alkaloids: Main Features, Toxicity, and Mechanisms of Action. In Plant Toxins; Springer: Berlin/Heidelberg, Germany, 2015; pp. 1–15. [Google Scholar] [CrossRef]
- Habli, Z.; Toumieh, G.; Fatfat, M.; Rahal, O.N.; Gali-Muhtasib, H. Emerging cytotoxic alkaloids in the battle against cancer: Overview of molecular mechanisms. Molecules 2017, 22, 250. [Google Scholar] [CrossRef]
- Yan, Y.; Li, X.; Zhang, C.; Lv, L.; Gao, B.; Li, M. Research progress on antibacterial activities and mechanisms of natural alkaloids: A review. Antibiotics 2021, 10, 318. [Google Scholar] [CrossRef]
- Heinrich, M.; Mah, J.; Amirkia, V. Alkaloids used as medicines: Structural phytochemistry meets biodiversity—An update and forward look. Molecules 2021, 26, 1836. [Google Scholar] [CrossRef]
- Kasote, D.M.; Katyare, S.S.; Hegde, M.V.; Bae, H. Significance of antioxidant potential of plants and its relevance to therapeutic applications. Int. J. Biol. Sci. 2015, 11, 982–991. [Google Scholar] [CrossRef]
- Zhou, L.G.; Wu, J.Y. Development and application of medicinal plant tissue cultures for production of drugs and herbal medicinals in China. Nat. Prod. Rep. 2006, 23, 789–810. [Google Scholar] [CrossRef]
- Zhou, S.; Huang, G. The synthesis and biological activity of marine alkaloid derivatives and analogues. RSC Adv. 2020, 10, 31909–31935. [Google Scholar] [CrossRef]
- Zekri, M.; Obreza, T.A. Plant Nutrients for Citrus Trees; University of Florida Cooperative Extension Service, Institute of Food and Agricultural Sciences, EDIS: Gainesville, FL, USA, 2003; pp. 1–5. [Google Scholar] [CrossRef]
- Bojtor, C.; Mousavi, S.M.N.; Illés, Á.; Golzardi, F.; Széles, A.; Szabó, A.; Nagy, J.; Marton, C.L. Nutrient Composition Analysis of Maize Hybrids Affected by Different Nitrogen Fertilisation Systems. Plants 2022, 11, 1593. [Google Scholar] [CrossRef] [PubMed]
- Cvijanović, V.; Sarić, B.; Dramićanin, A.; Kodranov, I.; Manojlović, D.; Momirović, N.; Momirović, N.; Milojković-Opsenica, D. Content and distribution of macroelements, microelements, and rare-earth elements in different tomato varieties as a promising tool for monitoring the distinction between the integral and organic systems of production in zeleni hit—Official enza and vital. Agriculture 2021, 11, 1009. [Google Scholar] [CrossRef]
- Godswill, A.G.; Somtochukwu, I.V.; Ikechukwu, A.O.; Kate, E.C. Health Benefits of Micronutrients (Vitamins and Minerals) and their Associated Deficiency Diseases: A Systematic Review. Int. J. Food Sci. 2020, 3, 1–32. [Google Scholar] [CrossRef]
- Yada, S.; Lapsley, K.; Huang, G. A review of composition studies of cultivated almonds: Macronutrients and micronutrients. J. Food Compos. Anal. 2011, 24, 469–480. [Google Scholar] [CrossRef]
- Xu, W.Y.; Tang, J.; Ji, C.J.; He, W.J.; Tan, N.H. Application of a TLC chemical method to detection of cyclotides in plants. Chin. Sci. Bull. 2008, 53, 1671–1674. [Google Scholar] [CrossRef]
- Alsaffar, D.F.; Abbas, I.S.; Dawood, A.H. Investigation of the main alkaloid of london rocket (Sisymbrium irio L.) as a wild medicinal plant grown in Iraq. Int. J. Pharm. Sci. Rev. Res. Available 2016, 39, 279–281. [Google Scholar]
- Raal, A.; Meos, A.; Hinrikus, T.; Heinämäki, J.; Romāne, E.; Gudienė, V.; Jakštas, V.; Koshovyi, O.; Kovaleva, A.; Fursenco, C.; et al. Dragendorff’s reagent: Historical perspectives and current status of a versatile reagent introduced over 150 years ago at the University of Dorpat, Tartu, Estonia. Pharmazie 2020, 75, 299–306. [Google Scholar] [CrossRef]
Publisher’s Note: MDPI stays neutral with regard to jurisdictional claims in published maps and institutional affiliations. |
© 2022 by the authors. Licensee MDPI, Basel, Switzerland. This article is an open access article distributed under the terms and conditions of the Creative Commons Attribution (CC BY) license (https://creativecommons.org/licenses/by/4.0/).
