
Methods for Rapid Screening of Biologically Active Compounds Present in Plant-Based Extracts
 , ,
, ,  , , and
Abstract
:1. Introduction
2. Results
2.1. Determination of Dry Weight
2.2. Determination of pH
2.3. Determination of Saponins
2.4. Determination of Carboxylic Acids
2.5. Determination of Oils and Fats
- (a)
- (b)
- Sudan test–a shining orange colour indicates the presence of fixed oil and fat [33]. The colour change in the extract was observed in many cases: Alv L (aloe leaves), Arv H (common mugwort herb), Co F (common marigold flowers), Ea H (field horsetail herb), Ep L (purple coneflower leaves), Hp H (St. John’s wort herb), Mc F (chamomile flowers), Ob H (basil herb), Pm H (broadleaf plantain herb), Poa H (common knotgrass herb), Pta L (common bracken leaves), Sg L (giant goldenrod leaves), So R (comfrey roots), To F (common dandelion flowers), To L (common dandelion leaves), To R (common dandelion roots), Tp F (red clover flowers), and Vo R (valerian roots). Generally, oils and fats were not present in extracts produced from fruits (e.g., chokeberry, sea-buckthorn), beetroot roots, representatives from the Fabaceae family such as as pea and red lentil, as well as nettle leaves and roots (Table 2).
2.6. Determination of Proteins and Amino Acids
- (a)
- (b)
- Ninhydrin test (amino acids)–a violet/purple/bluish colour indicates the presence of amino acids [27,28,31,37,38,40]. The change of the initial colour of extract into violet/purple/bluish was observed in almost all the examined extracts, aside from Alv L (aloe leaves), Am Fr (black chokeberry fruits), Ep F (purple coneflower flowers), Hp H (St. John’s wort herb), Hr Fr (sea-buckthorn fruits), Sg L (giant goldenrod leaves), and Ur L (nettle leaves) (Table 3).
- (c)
- Millon’s test (proteins)–white precipitate, which turns red after heating, indicates the presence of proteins [28,37] and free amino acids [34,39]. This method turned out to be imprecise in determining the presence of proteins. White precipitation in the first stage was observed only for extracts from pea (Ps S) and red lentil (Lc S), but it did not turn into red, whereas red precipitate occurred after extract heating only in extracts produced from purple coneflower flowers (Ep F) and comfrey roots (So R) (Table 4).
- (d)
- H2SO4 test (proteins)–white precipitate that turned to yellow after heating and orange after the addition of NH4OH revealed the presence of proteins [37]. The colour recognition of the precipitate was difficult due to the presence of diversified colours of extracts. Nonetheless, according to the expected observations, the following bioproducts that could contain some amounts of proteins can be mentioned: aloe leaves (Alv L), black chokeberry fruits (Am Fr), common marigold flowers (Co F), purple coneflower flowers (Ep F), purple coneflower leaves (Ep L), St. John’s wort herb (Hp H), red lentil seeds (Lc S), chamomile flowers (Mc F), common knotgrass herb (Poa H), pea seeds (Ps S), common bracken leaves (Pta L), giant goldenrod leaves (Sg L), comfrey roots (So R), common dandelion leaves (To L), common dandelion roots (To R), red clover flowers (Tp F).
2.7. Determination of Steroids, Terpenes, Terpenoids
- (a)
- Salkowski test–a red chloroform layer and greenish yellow fluorescence/green fluorescence of acid layer indicate the presence of steroids [34,36,39,40]. According to Shetty and Vijayalaxmi [27], a red precipitate can indicate the presence of steroids. A brown ring can also indicate the presence of steroids, and the appearance of bluish-brown ring can indicate the presence of phytosteroids [41]. Such observations were visible for the following extracts: beetroot roots (Bv R), common marigold flowers (Co F), chamomile flowers (Mc F), basil herb (Ob H), broadleaf plantain herb (Pm H), and pea seeds (Ps S).
- (b)
- Acetic acid and H2SO4 test–a blue-green ring indicates the presence of terpenoids [31]. In the examined extracts, there was no blue-green ring. This method did not allow for the detection of terpenoids in plant extracts.
- (c)
- Liebermann–Burchard test–a pink or red colour indicates the presence of steroids [25]. This was only observed for the extracts produced from black chokeberry fruits (Am Fr) and purple coneflower flowers (Ep F). According to Jayapriya et al. [41], a green colour indicates the presence of phytosterols. In the present study, these compounds can be detected in extracts from chamomile flowers (Mc F) and from nettle roots (Ur R). In the examined extracts, there was no green precipitate, which can indicate the presence of steroids [27]. In tested extracts we did not observe (1) the change of red colour through blue to green can indicate the presence of steroids [33]; (2) the formation of a reddish-violet colour at the junction can indicate the presence of steroids, triterpenoids, and cardiac glycosides [36]; and (3) a brown ring appears at the junction of two layers—a green colour in the upper layer can indicate the presence of sterols, and the formation of deep-red colour in the lower layer indicates the presence of triterpenoids [28].
2.8. Determination of Alkaloids
- (a)
- (b)
- (c)
- (d)
- Mayer’s test (2)–a green colour or white precipitate indicates the presence of alkaloids [41]. An opalescence or yellowish precipitate indicates the presence of alkaloids [30,36,39]. This technique was more sensitive for the detection of alkaloids in the extracts than the previous one. A white precipitate was observed in extract from pea seeds (Ps S). Yellow-orange fine precipitate was detected in more extracts, for example, from common mugwort herb (Arv H), common marigold flowers (Co F), St. John’s wort herb (Hp H), basil herb (Ob H), pea seeds (Ps S), common bracken leaves (Pta L), comfrey roots (So R), and common dandelion leaves (To L)–Table 6.
- (e)
- Dragendroff’s test (1)–the presence of alkaloids can be indicated by a reddish-brown precipitate [33,43], an orange-brown precipitate [29,30], and an orange precipitate [27]. In the present study, the precipitate described above was observed in extracts produced from common marigold flowers (Co F), red lentil seeds (Lc S), and pea seeds (Ps S)–Table 7.
- (f)
- Dragendroff’s test (2) –indicates the presence of alkaloids when an orange or red precipitate [35,40] or an orange-brown precipitate [34,36,39] occurs. The plant extracts that indicated the presence of alkaloids were common mugwort herb (Arv H), common marigold flowers (Co F), purple coneflower flowers (Ep F) and leaves (Ep L), basil herb (Ob H), pea seeds (Ps S), comfrey roots (So R), and common dandelion leaves (To L)–Table 7.
- (g)
2.9. Determination of Multielemental Composition
3. Discussion
4. Materials and Methods
4.1. Chemicals and Reagents
4.2. Plant Materials Used for Extraction of Compounds
- Alv L–aloe leaves, Aloe vera (L.) Burm. f.;
- Am Fr–black chokeberry fruits, Aronia melanocarpa (Michx.) Elliott;
- Arv H–common mugwort herb, Artemisia vulgaris L.;
- Bv R–beetroot roots, Beta vulgaris L.;
- Co F–common marigold flowers, Calendula officinalis L.;
- Ea H–field horsetail herb, Equisetum arvense L.;
- Ep F–purple coneflower flowers, Echinacea purpurea (L.) Moench;
- Ep L–purple coneflower leaves, Echinacea purpurea (L.) Moench;
- Hp H–St. John’s wort herb, Hypericum perforatum L.;
- Hr Fr–sea-buckthorn fruits, Hippophae rhamnoides L.;
- Lc S–red lentil seeds, Lens culinaris Medik.;
- Mc F–chamomile flowers, Matricaria chamomilla L.;
- Ob H–basil herb, Ocimum basilicum L.;
- Pm H–broadleaf plantain herb, Plantago major L.;
- Poa H–common knotgrass herb, Polygonum aviculare L.;
- Ps S–pea seeds, Pisum sativum L.;
- Pta L–common bracken leaves, Pteridium aquilinum (L.) Kuhn;
- Sg L–giant goldenrod leaves, Solidago gigantea Ait.;
- So R–comfrey roots, Symphytum officinale L.;
- To F–common dandelion flowers, Taraxacum officinale (L.) Weber ex F.H. Wigg.;
- To L–common dandelion leaves, Taraxacum officinale (L.) Weber ex F.H. Wigg.;
- To R–common dandelion roots, Taraxacum officinale (L.) Weber ex F.H. Wigg.;
- Tp F–red clover flowers, Trifolium pratense L.;
- Ur L–nettle leaves, Urtica dioica L.;
- Ur R–nettle roots, Urtica dioica L.;
- Vo R–valerian roots, Valeriana officinalis L.
4.3. Extraction
4.4. Analyses of Extracts
4.4.1. Determination of Dry Weight
4.4.2. Determination of pH
4.4.3. Determination of Saponins
4.4.4. Determination of Carboxylic Acid
4.4.5. Determination of Oils and Fats
- (a)
- Saponification test–KOH (0.1 N, 10 drops) and phenophthalein idndicator (5 drops) were added to the extract (2 mL), and then the mixture was heated in a water bath (70 °C, 1.5 h) [27].
- (b)
- Sudan test–Sudan III solution (few drops) (0.5 g of dye was diluted in 100 mL of 99% isopropanol) was added to the extract (2 mL) [33].
4.4.6. Determination of Proteins and Amino Acids
- (a)
- Biuret test (for proteins)–biuret reagent (a few drops) was added to the extract (2 mL) [34]. The reagent was prepared by dissolving pentavalent copper sulphate (1.5 g) and potassium sodium tartrate (6.0 g) in distilled water (500 mL). Sodium hydroxide (2 M, 375 mL) was added, and the volumetric flask was filled up with distilled water (up to 1000 mL).
- (b)
- Millon’s test (for proteins)–Millon’s reagent (2 mL) was added to the extract (2 mL) and heated in a water bath (5 min) [37]. The Millon’s reagent was made by dissolving mercuric nitrate (160 g) and mercurous nitrate (160 g) in concentrated nitric acid (400 mL) and made up to 1000 mL with distilled water.
- (c)
- H2SO4 test (for proteins)–concentrated H2SO4 (1 mL) was added to the extract (3 mL). Subsequently, NH4OH (1 mL) was appended [37].
- (d)
- Ninhydrin test (for amino acids)–a ninhydrin solution (2 mL, 0.2% in acetone) was added to the extract (2 mL), and the solution was boiled in a water bath (10 min) [31].
4.4.7. Determination of Steroids
- (a)
- Salkowski test–chloroform (2 mL) and concentrated H2SO4 (2 mL) were added to the extract (2 mL) [34].
- (b)
- Acetic acid and H2SO4 test (terpenoids)–the extract (2 mL) was treated with acetic acid (2 mL) and sulphuric acid (1 mL) [31].
- (c)
- Liebermann–Burchard test–chloroform (1 mL), acetic anhydride (2 mL), and concentrated sulphuric acid (2 drops) were added to the extract (1 mL) [25].
4.4.8. Determination of Alkaloids
- (a)
- Hager’s test–Hager’s reagent (5 drops) (1% solution of picric acid in water) was added to the extract (2 mL) [37].
- (b)
- Tannic acid test–tannic acid solution (1 mL, 10% in water) was added to the extract (2 mL) [28].
- (c)
- Mayer’s test (1)–Mayer’s reagent (10 drops) was added on the sides of the test tube containing the extract (3 mL) [35]. The Mayer’s reagent was prepared by mixing two separately prepared aqueous solutions: mercuric chloride (1.36 g in 60 mL of distilled water) and potassium iodide (5 g in 10 mL of distilled water). The solutions were combined in a 100 mL volumetric flask and filled up to the mark with distilled water.
- (d)
- Mayer’s test (2)–concentrated hydrochloric acid (2 mL) and Mayer’s reagent (8 drops) were added to the extract (2 mL) [41].
- (e)
- Dragendroff’s test (1)–Dragendroff’s reagent (1 mL) was added to the extract (2 mL) [43]. The Dragendroff’s reagent was prepared by mixing (in ratio 1:1) solution A, prepared by dissolving bismuth nitrate (0.85 g) in water (40 mL) and acetic acid (10 mL), and solution B was prepared by dissolving potassium iodine (8 g) in water (20 mL). Then, 5 mL of each solution was transferred to a 100 mL volumetric flask, mixed with glacial acetic acid (20 mL), diluted with water to volume, and mixed [97,98,99].
- (f)
- Dragendroff’s test (2)–HCl (1 mL) and Dragendroff’s reagent (0.5 mL) were added to the extract (2.5 mL) [40].
- (g)
- Wagner’s test–Wagner’s reagent (5 drops) was added to the extract (2 mL) [29].
4.4.9. Determination of Multielemental Composition
5. Conclusions
Author Contributions
Funding
Institutional Review Board Statement
Informed Consent Statement
Data Availability Statement
Conflicts of Interest
Sample Availability
References
- Altemimi, A.; Lakhssassi, N.; Baharlouei, A.; Watson, D.G.; Lightfoot, D.A. Phytochemicals: Extraction, isolation, and identification of bioactive compounds from plant extracts. Plants 2017, 6, 42. [Google Scholar] [CrossRef] [PubMed]
- Goyal, M.R.; Ayeleso, A.O. Bioactive Compounds of Medicinal Plants. Properties and Potential for Human Health; Apple Academic Press, Inc.: Oakville, ON, Canada; Waretown, NJ, USA, 2021; ISBN 9781774631454. [Google Scholar]
- Aung, E.E.; Kristanti, A.N.; Aminah, N.S.; Takaya, Y.; Ramadhan, R. Plant description, phytochemical constituents and bioactivities of Syzygium genus: A review. Open Chem. 2020, 18, 1256–1281. [Google Scholar] [CrossRef]
- Adeyinka, A.; Richard, F. Application of phytochemical extracts and essential oils in food products: A review. Int. J. Biotechnol. Food Sci. 2015, 3, 31–35. [Google Scholar]
- Palombo, E.A. Traditional medicinal plant extracts and natural products with activity against oral bacteria: Potential application in the prevention and treatment of oral diseases. Evid.-Based Complement. Altern. Med. 2011, 2011, 680354. [Google Scholar] [CrossRef] [Green Version]
- Rodino, S.; Butu, M. Herbal Extracts-New Trends in Functional and Medicinal Beverages; Elsevier Inc.: Amsterdam, The Netherlands, 2019; ISBN 9780128163979. [Google Scholar]
- Iordache, A.; Culea, M.; Gherman, C.; Cozar, O. Characterization of some plant extracts by GC-MS. Nucl. Instrum. Methods Phys. Res. Sect. B Beam Interact. Mater. Atoms 2009, 267, 338–342. [Google Scholar] [CrossRef]
- Yahya, N.A.; Attan, N.; Wahab, R.A. An overview of cosmeceutically relevant plant extracts and strategies for extraction of plant-based bioactive compounds. Food Bioprod. Process. 2018, 112, 69–85. [Google Scholar] [CrossRef]
- Abubakar, A.R.; Haque, M. Preparation of medicinal plants: Basic extraction and fractionation procedures for experimental purposes. Asian J. Pharm. Clin. Res. 2020, 12, 1–10. [Google Scholar] [CrossRef]
- Available online: www.marketsandmarkets.com (accessed on 5 February 2022).
- Özaslan, M.; Oguzkan, S.B. Use of plant extracts in alternative medicine. Pakistan J. Biol. Sci. 2018, 21, 1–7. [Google Scholar] [CrossRef] [Green Version]
- Yu, X.Y.; Zhang, Y.; Chen, X.Q.; Zu, Y.G. The product life cycle design in plant extracts industry. In Proceedings of the 2011 IEEE 18th International Conference on Industrial Engineering and Engineering Management, Changchun, China, 3–5 September 2011; pp. 573–575. [Google Scholar] [CrossRef]
- Isman, M.B.; Miresmailli, S.; MacHial, C. Commercial opportunities for pesticides based on plant essential oils in agriculture, industry and consumer products. Phytochem. Rev. 2011, 10, 197–204. [Google Scholar] [CrossRef]
- Adesina, J.M.; Rajashekar, Y. Phytochemical composition and insecticidal potentials of some plant aqueous extracts in suppressing Podagrica spp. (Coleoptera: Chrysomelidae) infestation on Okra (Abelmoschus esculentus L. Moench). Adv. Hortic. Sci. 2018, 32, 71–78. [Google Scholar] [CrossRef]
- Lengai, G.M.W.; Muthomi, J.W.; Mbega, E.R. Phytochemical activity and role of botanical pesticides in pest management for sustainable agricultural crop production. Sci. African 2020, 7, e00239. [Google Scholar] [CrossRef]
- Godlewska, A.; Ciepiela, G.A. Italian ryegrass (Lolium multiflorum Lam.) fiber fraction content and dry matter digestibility following biostimulant application against the background of varied nitrogen regime. Agronomy 2021, 11, 39. [Google Scholar] [CrossRef]
- Godlewska, K.; Ronga, D.; Michalak, I. Plant extracts—Importance in sustainable agriculture. Ital. J. Agron. 2021, 16, 1–23. [Google Scholar] [CrossRef]
- Clemensen, A.K.; Provenza, F.D.; Hendrickson, J.R.; Grusak, M.A. Ecological Implications of Plant Secondary Metabolites—Phytochemical Diversity Can Enhance Agricultural Sustainability. Front. Sustain. Food Syst. 2020, 4, 547826. [Google Scholar] [CrossRef]
- Dekebo, A. Introductory Chapter. In Plant Extracts; IntechOpen: London, UK, 2019; pp. 1–10. [Google Scholar] [CrossRef] [Green Version]
- Rasoanaivo, P.; Wright, C.W.; Willcox, M.L.; Gilbert, B. Whole plant extracts versus single compounds for the treatment of malaria: Synergy and positive interactions. Malar. J. 2011, 10, S4. [Google Scholar] [CrossRef] [PubMed] [Green Version]
- Alsheikh, H.M.A.; Sultan, I.; Kumar, V.; Rather, I.A.; Al-sheikh, H.; Jan, A.T.; Haq, Q.M.R. Plant-based phytochemicals as possible alternative to antibiotics in combating bacterial drug resistance. Antibiotics 2020, 9, 480. [Google Scholar] [CrossRef]
- Zerazion, E.; Rosa, R.; Ferrari, E.; Veronesi, P.; Leonelli, C.; Saladini, M.; Ferrari, A.M. Phytochemical compounds or their synthetic counterparts? A detailed comparison of the quantitative environmental assessment for the synthesis and extraction of curcumin. Green Chem. 2016, 18, 1807–1818. [Google Scholar] [CrossRef]
- Nxumalo, K.A.; Aremu, A.O.; Fawole, O.A. Potentials of medicinal plant extracts as an alternative to synthetic chemicals in postharvest protection and preservation of horticultural crops: A review. Sustainability 2021, 13, 5897. [Google Scholar] [CrossRef]
- Tuama, A.A.; Mohammed, A.A. Phytochemical screening and in vitro antibacterial and anticancer activities of the aqueous extract of Cucumis sativus. Saudi J. Biol. Sci. 2019, 26, 600–604. [Google Scholar] [CrossRef]
- Sasidharan, S.; Chen, Y.; Saravanan, D.; Sundram, K.M.; Yoga Latha, L. Extraction, isolation and characterization of bioactive compounds from plants’ extracts. African J. Tradit. Complement. Altern. Med. 2011, 8, 1–10. [Google Scholar] [CrossRef] [Green Version]
- Pateiro, M.; Gómez-Salazar, J.A.; Jaime-Patlán, M.; Sosa-Morales, M.E.; Lorenzo, J.M. Plant extracts obtained with green solvents as natural antioxidants in fresh meat products. Antioxidants 2021, 10, 181. [Google Scholar] [CrossRef] [PubMed]
- Shetty, S.; Vijayalaxmi, K.K. Phytochemical investigation of extract/solvent fractions of Piper nigrum Linn. Seeds and Piper betle Linn. leaves. Int. J. Pharma Bio Sci. 2012, 3, 344–349. [Google Scholar]
- Ramya, G.L.P.; Vasanth, P.M.; Prasad, P.V.; Sarath Babu, V. Qualitative Phytochemical Screening Tests of Alpinia. World J. Pharm. Res. 2019, 8, 1064. [Google Scholar] [CrossRef]
- Anoma, G.; Ajantha; Kumari, C.; Anjan. Alcoholic Extraction and Phyto-Chemical Evaluation of Chakramarda Seeds (Cassia tora Linn.). Int. J. Res. Ayurveda Pharm. 2017, 8, 157–161. [Google Scholar] [CrossRef]
- Auwal, M.S.; Saka, S.; Mairiga, I.A.; Sanda, K.A.; Shuaibu, A.; Ibrahim, A. Preliminary phytochemical and elemental analysis of aqueous and fractionated pod extracts of Acacia nilotica (Thorn mimosa). Vet. Res. forum an Int. Q. J. 2014, 5, 95–100. [Google Scholar]
- Muniyandi, J.M.; Jothi Muniyandi, M.; Professor, A. Preliminary Studies of Phytochemical Investigation on Coastal Medicinal Plants of Boloor, Mangalore. Indo Am. J. P. Sci. 2018, 5, 5. [Google Scholar]
- Tan, K.K.; Khoo, T.J.; Wiart, C. Phytochemical screening of Artabotrys crassifolius Hook. F. & Thomson (Anninaceae Juss.). Innovare J. Ayurvedic Sci. 2013, 1, 14–17. [Google Scholar]
- Le BaoDuy, N.; Trang, D.T.D.; Trang, N.P.M. Preliminary phytochemical analysis of leaf extracts of Thuja orientalis (L.) Endl. Int. J. Res. Sscience Manag. 2015, 2, 21–25. [Google Scholar]
- Rufai, Y.; Isah, Y.; Isyaka, M.S. Comparative Phyto-Constituents Analysis from the Root Bark and Root Core Extractives of Cassia ferruginea (Schrad D. C) Plant. Sch. J. Agric. Vet. Sci. 2016, 3, 275–283. [Google Scholar] [CrossRef]
- Abdalla, A.A.; Mustafa, I.; Makhawi, A.M.; Mustafa, M.I. Phytochemical screening and antimicrobial activities studies of Acacia nilotica fruit cover. bioRxiv 2020, 1–16. [Google Scholar] [CrossRef] [Green Version]
- Shukla, S.; Mehta, A.; Bajpai, V.K. Phytochemical Screening and Anthelmintic and Antifungal Activities of Leaf Extracts of Stevia rebaudiana. J. Biol. Act. Prod. Nat. 2013, 3, 56–63. [Google Scholar] [CrossRef] [Green Version]
- Kumar, S.; Singh, B.B.; Kumar, N. Physico-chemical and phytochemical investigation of plant Sesbania sesban. Res. J. Pharm. Biol. Chem. Sci. 2014, 5, 110–117. [Google Scholar]
- Azalea Berenguer-Rivas, C.; Mas-Ortiz, M.; Batista-Corbal, P.L.; Costa-Acosta, J.; Julio César Escalona-Arranz, C. Chemical composition and in-vitro antioxidant activity of extracts of Adelia ricinella L. Rev. Cuba. Quim. 2018, 30, 191–209. [Google Scholar]
- Kakpure, M.R.; Rothe, S.P.; Shivaji, S. Phytochemical Screening of Alectra Parasitica a. Rich—A rare medicinal parasitic plant. Adv. Res. Pharm. Biol. 2012, 2, 103–111. [Google Scholar]
- Shah, M.D.; Hossain, M.A. Total flavonoids content and biochemical screening of the leaves of tropical endemic medicinal plant Merremia borneensis. Arab. J. Chem. 2014, 7, 1034–1038. [Google Scholar] [CrossRef] [Green Version]
- Jayapriya, G.; Gricilda Shoba, F. Screening for phytochemical activity of Urechites lutea plant. Pelagia Res. Libr. Asian J. Plant Sci. Res. 2014, 4, 20–24. [Google Scholar]
- Góral, I.; Wojciechowski, K. Surface activity and foaming properties of saponin-rich plants extracts. Adv. Colloid Interface Sci. 2020, 279, 102145. [Google Scholar] [CrossRef]
- Das, P.E.; Abu-Yousef, I.A.; Majdalawieh, A.F.; Narasimhan, S.; Poltronieri, P. Green Synthesis of Encapsulated Copper Nanoparticles Using a Hydroalcoholic Extract of Moringa oleifera Leaves and Assessment of Their Antioxidant and Antimicrobial Activities. Molecules 2020, 25, 555. [Google Scholar] [CrossRef]
- Armendáriz-Barragán, B.; Zafar, N.; Badri, W.; Galindo-Rodríguez, S.A.; Kabbaj, D.; Fessi, H.; Elaissari, A. Plant extracts: From encapsulation to application. Expert Opin. Drug Deliv. 2016, 13, 1165–1175. [Google Scholar] [CrossRef]
- Atanasov, A.G.; Zotchev, S.B.; Dirsch, V.M.; Orhan, I.E.; Banach, M.; Rollinger, J.M.; Barreca, D.; Weckwerth, W.; Bauer, R.; Bayer, E.A.; et al. Natural products in drug discovery: Advances and opportunities. Nat. Rev. Drug Discov. 2021, 20, 200–216. [Google Scholar] [CrossRef]
- Sparg, S.G.; Light, M.E.; Van Staden, J. Biological activities and distribution of plant saponins. J. Ethnopharmacol. 2004, 94, 219–243. [Google Scholar] [CrossRef]
- Desai, S.D.; Desai, D.G.; Kaur, H. Saponins and their biological activities. Pharma Times 2009, 41, 13–16. [Google Scholar]
- Francis, G.; Kerem, Z.; Makkar, H.P.S.; Becker, K. The biological action of saponins in animal systems: A review. Br. J. Nutr. 2002, 88, 587–605. [Google Scholar] [CrossRef] [PubMed]
- Moghimipour, E.; Handali, S. Saponin: Properties, Methods of Evaluation and Applications. Annu. Res. Rev. Biol. 2015, 5, 207–220. [Google Scholar] [CrossRef] [Green Version]
- Kregiel, D.; Berlowska, J.; Witonska, I.; Antolak, H.; Proestos, C.; Babic, M.; Babic, L.; Zhang, B. Saponin-Based, Biological-Active Surfactants from Plants. Appl. Charact. Surfactants 2017, 183–205. [Google Scholar] [CrossRef] [Green Version]
- Emam, K.A. Effect of carboxylic acids fertilization on growth and chemical composition of Althaea rosea Cav. grown in different soil types. Middle East J. Agric. Res. 2017, 6, 1313–1327. [Google Scholar]
- Badea, G.I.; Radu, G.L. Introductory Chapter. In Carboxylic Acid—Key Role in Life Sciences; IntechOpen: London, UK, 2018; pp. 1–6. [Google Scholar] [CrossRef] [Green Version]
- Godlewska-żyłkiewicz, B.; Świsłocka, R.; Kalinowska, M.; Golonko, A.; Świderski, G.; Arciszewska, Ż.; Nalewajko-Sieliwoniuk, E.; Naumowicz, M.; Lewandowski, W. Biologically active compounds of plants: Structure-related antioxidant, microbiological and cytotoxic activity of selected carboxylic acids. Materials 2020, 13, 4454. [Google Scholar] [CrossRef] [PubMed]
- Marchyshyn, S.; Slobodianiuk, L.; Budniak, L.; Skrynchuk, O. Analysis of carboxylic acids of Crambe cordif olia Steven. Pharmacia 2021, 68, 15–21. [Google Scholar] [CrossRef]
- Lamberth, C.; Dinges, J. Different Roles of Carboxylic Functions in Pharmaceuticals and Agrochemicals. In Bioactive Carboxylic Compound Classes: Pharmaceuticals and Agrochemicals; Wiley: Hoboken, NJ, USA, 2016; pp. 1–11. [Google Scholar] [CrossRef]
- Yu, R.J.; Van Scott, E.J. Alpha-hydroxyacids and carboxylic acids. J. Cosmet. Dermatol. 2004, 3, 76–87. [Google Scholar] [CrossRef]
- Talzi, V.P. A 13C and 1H NMR analysis of perfumes. Russ. J. Appl. Chem. 2006, 79, 107–116. [Google Scholar] [CrossRef]
- Damude, H.G.; Kinney, A.J. Enhancing plant seed oils for human nutrition. Plant Physiol. 2008, 147, 962–968. [Google Scholar] [CrossRef] [PubMed] [Green Version]
- Aremu, M.O.; Ibrahim, H.; Bamidele, T.O. Physicochemical Characteristics of the Oils Extracted from Some Nigerian Plant Foods—A Review. Chem. Process Eng. Res. 2015, 32, 36–52. [Google Scholar]
- Dilworth, L.L.; Riley, C.K.; Stennett, D.K. Plant Constituents: Carbohydrates, Oils, Resins, Balsams, and Plant Hormones; Elsevier Inc.: Amsterdam, The Netherlands, 2017; Volume 1, ISBN 9780128020999. [Google Scholar]
- Ogori, A.F. Source, extraction and constituents of fats and oils. Food Sci. Nutr. 2020, 6, 100060. [Google Scholar] [CrossRef]
- Dyer, J.M.; Stymne, S.; Green, A.G.; Carlsson, A.S. High-value oils from plants. Plant J. 2008, 54, 640–655. [Google Scholar] [CrossRef]
- Hernandez, E.M. Specialty Oils: Functional and Nutraceutical Properties. In Functional Dietary Lipids; Elsevier Ltd.: Amsterdam, The Netherlands, 2015; ISBN 9781782422570. [Google Scholar]
- Muniyappa, P.R.; Brammer, S.C.; Noureddini, H. Improved conversion of plant oils and animal fats into biodiesel and co-product. Bioresour. Technol. 1996, 56, 19–24. [Google Scholar] [CrossRef] [Green Version]
- Scott, E.; Peter, F.; Sanders, J. Biomass in the manufacture of industrial products-the use of proteins and amino acids. Appl. Microbiol. Biotechnol. 2007, 75, 751–762. [Google Scholar] [CrossRef] [Green Version]
- Hildebrandt, T.M.; Nunes Nesi, A.; Araújo, W.L.; Braun, H.P. Amino Acid Catabolism in Plants. Mol. Plant 2015, 8, 1563–1579. [Google Scholar] [CrossRef] [Green Version]
- Kumar, V.; Sharma, A.; Kaur, R.; Thukral, A.K.; Bhardwaj, R.; Ahmad, P. Differential distribution of amino acids in plants. Amino Acids 2017, 49, 821–869. [Google Scholar] [CrossRef]
- Ortiz-Lopez, A.; Chang, H.-C.; Bush, D.R. Amino acid transporters in plants. Plant Membr. Vacuolar Transp. 2008, 1465, 267–282. [Google Scholar] [CrossRef]
- Ufaz, S.; Galili, G. Improving the content of essential amino acids in crop plants: Goals and opportunities. Plant Physiol. 2008, 147, 954–961. [Google Scholar] [CrossRef] [Green Version]
- Wu, G. Functional amino acids in nutrition and health. Amino Acids 2013, 45, 407–411. [Google Scholar] [CrossRef] [PubMed] [Green Version]
- Castilla, V.; Ramirez, J.; Coto, C.E. Plant and Animal Steroids a New Hope to Search for Antiviral Agents. Curr. Med. Chem. 2010, 17, 1858–1873. [Google Scholar] [CrossRef] [PubMed]
- Gunaherath, G.M.K.B.; Gunatilaka, A.A.L. Plant Steroids: Occurrence, Biological Significance and their Analysis. Encycl. Anal. Chem. 2014, 1–26. [Google Scholar] [CrossRef]
- Dinan, L.; Harmatha, J.; Lafont, R. Chromatographic procedures for the isolation of plant steroids. J. Chromatogr. A 2001, 935, 105–123. [Google Scholar] [CrossRef]
- Vriet, C.; Russinova, E.; Reuzeaua, C. Boosting crop yields with plant steroids. Plant Cell 2012, 24, 842–857. [Google Scholar] [CrossRef] [Green Version]
- Macías, F.A.; Chinchilla, N.; Varela, R.M.; Molinillo, J.M.G. Bioactive steroids from Oryza sativa L. Steroids 2006, 71, 603–608. [Google Scholar] [CrossRef]
- Malíková, J.; Swaczynová, J.; Kolář, Z.; Strnad, M. Anticancer and antiproliferative activity of natural brassinosteroids. Phytochemistry 2008, 69, 418–426. [Google Scholar] [CrossRef]
- Zhabinskii, V.N.; Khripach, N.B.; Khripach, V.A. Steroid plant hormones: Effects outside plant kingdom. Steroids 2015, 97, 87–97. [Google Scholar] [CrossRef]
- Shyamala Gowri, S.; Vasantha, K. Phytochemical screening and antibacterial activity of Syzygium cumini (L.) (Myrtaceae) leaves extracts. Int. J. PharmTech Res. 2010, 2, 1569–1573. [Google Scholar] [CrossRef]
- Vollaro, A.; Esposito, A.; Antonaki, E.; Iula, V.D.; D’alonzo, D.; Guaragna, A.; De Gregorio, E. Steroid derivatives as potential antimicrobial agents against staphylococcus aureus planktonic cells. Microorganisms 2020, 8, 468. [Google Scholar] [CrossRef] [Green Version]
- Singh, B.; Sharma, R.A. Plant terpenes: Defense responses, phylogenetic analysis, regulation and clinical applications. 3 Biotech 2015, 5, 129–151. [Google Scholar] [CrossRef] [PubMed] [Green Version]
- Ludwiczuk, A.; Skalicka-Woźniak, K.; Georgiev, M.I. Terpenoids; Elsevier: Amsterdam, The Netherlands, 2017; ISBN 9780128020999. [Google Scholar]
- Tetali, S.D. Terpenes and isoprenoids: A wealth of compounds for global use. Planta 2019, 249, 1–8. [Google Scholar] [CrossRef] [PubMed]
- Yang, W.; Chen, X.; Li, Y.; Guo, S.; Wang, Z.; Yu, X. Advances in Pharmacological Activities of Terpenoids. Nat. Prod. Commun. 2020, 15, 1934578X2090355. [Google Scholar] [CrossRef] [Green Version]
- Kiyama, R. Estrogenic terpenes and terpenoids: Pathways, functions and applications. Eur. J. Pharmacol. 2017, 815, 405–415. [Google Scholar] [CrossRef]
- Matsuura, H.N.; Fett-Neto, A.G. Plant Alkaloids: Main Features, Toxicity, and Mechanisms of Action. In Plant Toxins; Springer: Berlin/Heidelberg, Germany, 2015; pp. 1–15. [Google Scholar] [CrossRef]
- Habli, Z.; Toumieh, G.; Fatfat, M.; Rahal, O.N.; Gali-Muhtasib, H. Emerging cytotoxic alkaloids in the battle against cancer: Overview of molecular mechanisms. Molecules 2017, 22, 250. [Google Scholar] [CrossRef] [Green Version]
- Yan, Y.; Li, X.; Zhang, C.; Lv, L.; Gao, B.; Li, M. Research progress on antibacterial activities and mechanisms of natural alkaloids: A review. Antibiotics 2021, 10, 318. [Google Scholar] [CrossRef]
- Heinrich, M.; Mah, J.; Amirkia, V. Alkaloids used as medicines: Structural phytochemistry meets biodiversity—An update and forward look. Molecules 2021, 26, 1836. [Google Scholar] [CrossRef]
- Kasote, D.M.; Katyare, S.S.; Hegde, M.V.; Bae, H. Significance of antioxidant potential of plants and its relevance to therapeutic applications. Int. J. Biol. Sci. 2015, 11, 982–991. [Google Scholar] [CrossRef]
- Zhou, L.G.; Wu, J.Y. Development and application of medicinal plant tissue cultures for production of drugs and herbal medicinals in China. Nat. Prod. Rep. 2006, 23, 789–810. [Google Scholar] [CrossRef]
- Zhou, S.; Huang, G. The synthesis and biological activity of marine alkaloid derivatives and analogues. RSC Adv. 2020, 10, 31909–31935. [Google Scholar] [CrossRef]
- Zekri, M.; Obreza, T.A. Plant Nutrients for Citrus Trees; University of Florida Cooperative Extension Service, Institute of Food and Agricultural Sciences, EDIS: Gainesville, FL, USA, 2003; pp. 1–5. [Google Scholar] [CrossRef]
- Bojtor, C.; Mousavi, S.M.N.; Illés, Á.; Golzardi, F.; Széles, A.; Szabó, A.; Nagy, J.; Marton, C.L. Nutrient Composition Analysis of Maize Hybrids Affected by Different Nitrogen Fertilisation Systems. Plants 2022, 11, 1593. [Google Scholar] [CrossRef] [PubMed]
- Cvijanović, V.; Sarić, B.; Dramićanin, A.; Kodranov, I.; Manojlović, D.; Momirović, N.; Momirović, N.; Milojković-Opsenica, D. Content and distribution of macroelements, microelements, and rare-earth elements in different tomato varieties as a promising tool for monitoring the distinction between the integral and organic systems of production in zeleni hit—Official enza and vital. Agriculture 2021, 11, 1009. [Google Scholar] [CrossRef]
- Godswill, A.G.; Somtochukwu, I.V.; Ikechukwu, A.O.; Kate, E.C. Health Benefits of Micronutrients (Vitamins and Minerals) and their Associated Deficiency Diseases: A Systematic Review. Int. J. Food Sci. 2020, 3, 1–32. [Google Scholar] [CrossRef]
- Yada, S.; Lapsley, K.; Huang, G. A review of composition studies of cultivated almonds: Macronutrients and micronutrients. J. Food Compos. Anal. 2011, 24, 469–480. [Google Scholar] [CrossRef]
- Xu, W.Y.; Tang, J.; Ji, C.J.; He, W.J.; Tan, N.H. Application of a TLC chemical method to detection of cyclotides in plants. Chin. Sci. Bull. 2008, 53, 1671–1674. [Google Scholar] [CrossRef]
- Alsaffar, D.F.; Abbas, I.S.; Dawood, A.H. Investigation of the main alkaloid of london rocket (Sisymbrium irio L.) as a wild medicinal plant grown in Iraq. Int. J. Pharm. Sci. Rev. Res. Available 2016, 39, 279–281. [Google Scholar]
- Raal, A.; Meos, A.; Hinrikus, T.; Heinämäki, J.; Romāne, E.; Gudienė, V.; Jakštas, V.; Koshovyi, O.; Kovaleva, A.; Fursenco, C.; et al. Dragendorff’s reagent: Historical perspectives and current status of a versatile reagent introduced over 150 years ago at the University of Dorpat, Tartu, Estonia. Pharmazie 2020, 75, 299–306. [Google Scholar] [CrossRef]

| Extract | Dry Weight, % | pH | Saponins-Froth Test (Foam Height) |
|---|---|---|---|
| Alv L | 0.42 ± 0.02 | 4.26 ± 0.06 | 1.4 cm |
| Am Fr | 0.62 ± 0.04 | 3.92 ± 0.11 | 0.1 cm |
| Arv H | 0.20 ± 0.01 | 4.97 ± 0.04 | 0.6 cm |
| Bv R | 0.61 ± 0.03 | 5.00 ± 0.04 | 0.6 cm |
| Co F | 0.38 ± 0.03 | 4.18 ± 0.10 | 0.4 cm |
| Ea H | 0.25 ± 0.03 | 5.27 ± 0.04 | 0.2 cm |
| Ep F | 0.43 ± 0.03 | 4.77 ± 0.09 | 1.0 cm |
| Ep L | 0.38 ± 0.05 | 6.35 ± 0.12 | 0.2 cm |
| Hp H | 0.20 ± 0.02 | 4.06 ± 0.05 | 1.4 cm |
| Hr Fr | 0.39 ± 0.04 | 2.32 ± 0.13 | not present |
| Lc S | 0.32 ± 0.04 | 5.96 ± 0.12 | 2.0 cm |
| Mc F | 0.23 ± 0.03 | 4.41 ± 0.05 | 0.2 cm |
| Ob H | 0.27 ± 0.02 | 5.30 ± 0.11 | 0.4 cm |
| Pm H | 0.36 ± 0.02 | 4.70 ± 0.03 | 0.4 cm |
| Poa H | 0.16 ± 0.03 | 4.68 ± 0.14 | 0.4 cm |
| Ps S | 0.27 ± 0.03 | 6.11 ± 0.11 | 2.2 cm |
| Pta L | 0.24 ± 0.02 | 5.09 ± 0.10 | 1.0 cm |
| Sg L | 0.31 ± 0.02 | 4.78 ± 0.03 | 4.2 cm |
| So R | 0.61 ± 0.04 | 5.63 ± 0.14 | 0.4 cm |
| To F | 0.36 ± 0.03 | 4.06 ± 0.08 | 0.1 cm |
| To L | 0.36 ± 0.03 | 5.04 ± 0.12 | 0.2 cm |
| To R | 0.63 ± 0.06 | 5.14 ± 0.12 | 0.2 cm |
| Tp F | 0.22 ± 0.02 | 4.90 ± 0.05 | 1.0 cm |
| Ur L | 0.23 ± 0.05 | 7.14 ± 0.65 | 0.2 cm |
| Ur R | 0.17 ± 0.02 | 5.43 ± 0.12 | 0.4 cm |
| Vo R | 0.41 ± 0.06 | 4.41 ± 0.07 | 0.4 cm |
| Method | Carboxylic Acids–NaHCO3 Test | Oils and Fats–Saponification Test | Oils and Fats–Sudan Test | ||||||
|---|---|---|---|---|---|---|---|---|---|
| Extract | Observations | Result | Photograph | Observations | Result | Photograph | Observations | Result | Photograph |
| Alv L | Colour change of the solution to orange-brick-red | – |  | Colour change of the solution to brown | – |  | Colour change of the solution to orange | + |  |
| Am Fr | Colour change of the solution brownish grey | – |  | Colour change of the solution to claret | – | 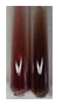 | No changes were observed | – |  |
| Arv H | Colour change of the solution to brownish yellow | – | 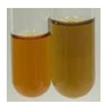 | Colour change of the solution to brick red | – | 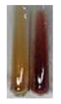 | Colour change of the solution to orange | + |  |
| Bv R | No changes were observed | – |  | Colour change of the solution to brownish yellow | – | 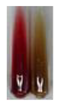 | No changeswere observed | – |  |
| Co F | Colour change of the solution to bright orange | – |  | Colour change of the solution to orange, a fine precipitation formed | – |  | Colour change of the solution to orange | + |  |
| Ea H | Colour change of the solution to bright orange | – |  | Colour change of the solution to brownish yellow; a fine precipitation formed | – |  | Colour change of the solution to orange | + |  |
| Ep F | Colour change of the solution to brown | – | 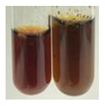 | Colour change of the solution to brown | – |  | No changes were observed | – |  |
| Ep L | Colour change of the solution to olive green | – |  | Colour change of the solution to brown; a fine precipitation formed | – |  | Tonal colour change of the solution | + |  |
| Hp H | Colour change of the solution to orange yellow | – | 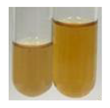 | Colour change of the solution to brick-red | – |  | Colour change of the solution to red- orange | + |  |
| Hr Fr | Colour change of the solution to lemon yellow | – |  | Colour change of the solution to cloudy yellow | – |  | Colour change of the solution to bright orange | – |  |
| Lc S | Colour change of the solution to flesh-coloured/colourless | – | 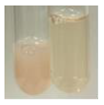 | Colour change of the solution to pink | – |  | Colour change of the solution to bright pink | – |  |
| Mc F | No changes were observed | – | 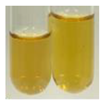 | Colour change of the solution to orange | – | 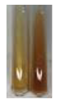 | Colour change of the solution to orange | + |  |
| Ob H | Colour change of the solution to brown-orange | – | 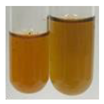 | Colour change of the solution to brown; a fine precipitation formed | – |  | Colour change of the solution to orange | + |  |
| Pm H | Colour change of the solution to yellow-orange-brown | – | 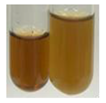 | Colour change of the solution to brown | – |  | Colour change of the solution to amber- orange | + | 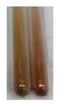 |
| Poa H | Colour change of the solution to bright yellow | – | 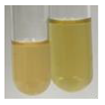 | Colour change of the solution to raspberry | – | 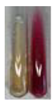 | Colour change of the solution to orange | + | 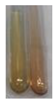 |
| Ps S | Colour change of the solution to light straw | – | 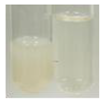 | Colour change of the solution to pink | – |  | Colour change of the solution to light pink | – |  |
| Pta L | Colour change of the solution to orange | – |  | Colour change of the solution to intense pink | – | 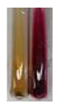 | Colour change of the solution to orange | + | 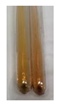 |
| Sg L | Colour change of the solution to brown-orange | – | 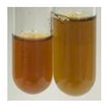 | Colour change of the solution to brown | – |  | Colour change of the solution to orange | + |  |
| So R | Colour change of the solution to brown-orange | – | 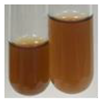 | Colour change of the solution to brick-red | – | 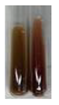 | Colour change of the solution to amber- orange | + |  |
| To F | Colour change of the solution to bright orange | – | 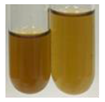 | No changeswere observed | – |  | Colour change of the solution to amber with orange glow | + | 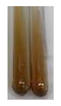 |
| To L | Colour change of the solution to light brown | – | 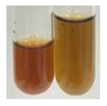 | Colour change of the solution to brown | – |  | Colour change of the solution to orange | + |  |
| To R | Colour change of the solution to light straw | – |  | Colour change of the solution orange-red | – |  | Colour change of the solution to pinkish-orange | + |  |
| Tp F | Colour change of the solution to light yellow | – | 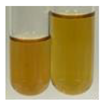 | Colour change of the solution to orange | – |  | Colour change of the solution to orange | + |  |
| Ur L | Colour change of the solution to yellow-olive | – | 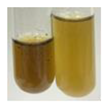 | Colour change of the solution to pink | – | 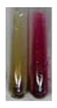 | Colour change of the solution to amber | – |  |
| Ur R | Colour change of the solution to light yellow | – | 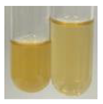 | Colour change of the solution to red-pink | – |  | Colour change of the solution to orange | + | 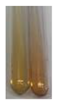 |
| Vo R | Colour change of the solution to brown-orange | – | 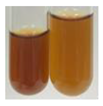 | Colour change of the solution to brown | – |  | Colour change of the solution to amber- orange | + |  |
| Method | Biuret Test | Ninhydrin Test | ||||
|---|---|---|---|---|---|---|
| Extract | Observations | Result | Photograph | Observations | Result | Photograph |
| Alv L | Colour change of the solution to yellow | – | 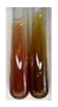 | Colour change of the solution to light orange | – |  |
| Am Fr | Colour change of the solution on the sides of the test tube to brown | – |  | Tonal colour change of the solution to light red | - |  |
| Arv H | Colour change of the solution to yellow-green | – |  | Colour change of the solution to purple | + | 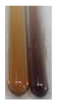 |
| Bv R | Colour change of the solution to orange | – |  | Colour change of the solution to purple | + |  |
| Co F | Colour change of the solution to dirty-yellow | – |  | Colour change of the solution to purple | + |  |
| Ea H | Colour change of the solution on the sides of the test tube to green-yellow | – | 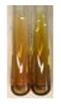 | Colour change of the solution to purple | + |  |
| Ep F | Colour change of the solution on the sides of the test tube to yellow-green | – | 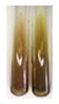 | Colour change of the solution to amber-yellow | – | 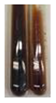 |
| Ep L | Colour change of the solution on the sides of the test tube to yellow-green | – | 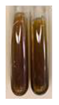 | Colour change of the solution to purple-brown | + | 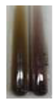 |
| Hp H | Colour change of the solution to yellow | – | 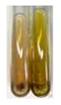 | No changes were observed | – |  |
| Hr Fr | Colour change of the solution on the sides of the test tube to yellow | – |  | Colour change of the solution to light brown | – |  |
| Lc S | Colour change of the solution to violet | + |  | Colour change of the solution to purple; a white precipitation formed | + |  |
| Mc F | Colour change of the solution to yellow | – |  | Colour change of the solution to purple | + |  |
| Ob H | Colour change of the solution to yellow | – |  | Colour change of the solution to purple | + | 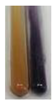 |
| Pm H | Colour change of the solution to yellow-green | – |  | Colour change of the solution to purple | + |  |
| Poa H | Colour change of the solution to green-yellow | – | 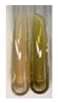 | Colour change of the solution to purple | + | 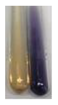 |
| Ps S | Colour change of the solution to violet | + | 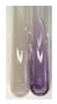 | Colour change of the solution to purple; a white precipitation formed | + |  |
| Pta L | Colour change of the solution to copper | – | 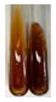 | Colour change of the solution to purple | + |  |
| Sg L | Colour change of the solution to brown- yellow | – |  | Colour change of the solution to orange-yellow | – |  |
| So R | Colour change of the solution to dirty yellow | – | 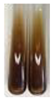 | Colour change of the solution to purple-brown | + |  |
| To F | Colour change of the solution to yellow | – | 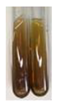 | Colour change of the solution to purple | + |  |
| To L | Colour change of the solution to yellow | – | 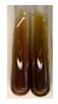 | Colour change of the solution to purple | + | 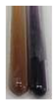 |
| To R | Colour change of the solution to green | – |  | Colour change of the solution to purple | + |  |
| Tp F | Colour change of the solution to yellow | – |  | Colour change of the solution to purple | + |  |
| Ur L | Colour change of the solution on the sides of the test tube to green | – |  | Colour change of the solution to orange-red | – |  |
| Ur R | Colour change of the solution on the sides of the test tube to green | – |  | Colour change of the solution to purple | + |  |
| Vo R | Colour change of the solution to dirty yellow | – |  | Colour change of the solution to purple | + | 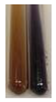 |
| Method | Millon’s Test | H2SO4 Test | ||||
|---|---|---|---|---|---|---|
| Extract | Observations | Result | Photograph | Observations | Result | Photograph |
| Alv L | Before boiling: red solution After boiling: orange- yellow solution | Before: – After: – | 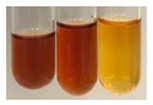 | After addition of H2SO4: the colour changed to orange and brown. After boiling with H2SO4: the colour changed to orange, red-black, and precipitation formed. After addition of H2SO4 and NH4OH: the colour changed to brown-red, orange, brown. | 1: – 2: +/– 3: – |  |
| Am Fr | Before boiling: orange-yellow solution After boiling: lemon solution | Before: – After: – | 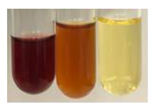 | After addition of H2SO4: the colour changed to red and black. After boiling with H2SO4: the colour changed to red and black, and a fine precipitation formed. After addition of H2SO4 and NH4OH: the colour changed to orange, brown, and red, plus fine precipitation | 1: – 2: +/– 3: +/– | 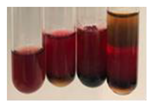 |
| Arv H | Before boiling: orange solution After boiling: lemon solution | Before: – After: – |  | After addition of H2SO4: the colour changed to orange-red, brown, and black. After boiling with H2SO4: the colour changed to brown-red and black. After addition of H2SO4 and NH4OH: the colour changed to olive-green, red, brown, and black. | 1: – 2: – 3: – |  |
| Bv R | Before boiling: orange solution After boiling: lemon solution | Before: – After: – | 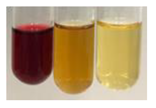 | After addition of H2SO4: the colour changed to burgundy, orange, and black. After boiling with H2SO4: the colour changed to brown and black. After addition of H2SO4 and NH4OH: the colour changed to red and black. | 1: – 2: – 3: – | 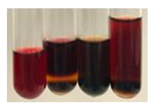 |
| Co F | Before boiling: orange solution + orange-brown precipitation formed After boiling: yellow-lemon solution + a white precipitation formed | Before: – After: – | 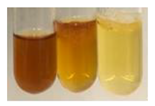 | After addition of H2SO4: the colour changed to amber-orange and red. After boiling with H2SO4: the colour changed to red-brown and black, and a brown precipitation formed. After addition of H2SO4 and NH4OH: the colour changed to yellow, orange, red, and black, plus a colourless glow | 1: – 2: +/– 3: – | 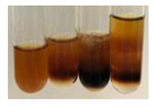 |
| Ea H | Before boiling: orange solution After boiling: lemon solution | Before: – After: – | 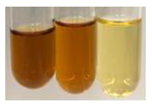 | After addition of H2SO4: the colour changed to orange-brown. After boiling with H2SO4: the colour changed to brown and black. After addition of H2SO4 and NH4OH: the colour changed to brown, orange, and yellow. | 1: – 2: – 3: – | 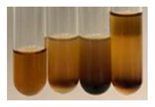 |
| Ep F | Before boiling: red colour and brown precipitation After boiling: yellow solution and red precipitation | Before: – After: + | 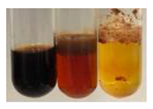 | After addition of H2SO4: the colour changed to red- orange, formation of a yellow-black ring. After boiling with H2SO4: the colour changed to black and red. After addition of H2SO4 and NH4OH: the colour changed to brown, dirty pink-red, and black. | 1: + 2: +/– 3: +/– | 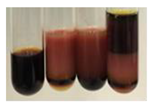 |
| Ep L | Before boiling: orange-red solution After boiling: yellow solution | Before: – After: – |  | After addition of H2SO4: the colour changed to “cappuccino” colour, black. After boiling with H2SO4: the colour changed to brown and black. After addition of H2SO4 and NH4OH: the colour changed to green, brown, and black. | 1: + 2: +/– 3: +/– |  |
| Hp H | Before boiling: orange solution and orange precipitation After boiling: lemon solution | Before: – After: – |  | After addition of H2SO4: the colour changed to orange-red along with a fine precipitation; a black colour developed. After boiling with H2SO4: the colour changed to red, with red-brown precipitation. After addition of H2SO4 and NH4OH: the colour changed to orange, brown-red, and dark maroon. | 1: + 2: +/– 3: +/– |  |
| Hr Fr | Before boiling: orange solution After boiling: yellow solution | Before: – After: – |  | After addition of H2SO4: the colour changed to yellow-orange and brown. After boiling with H2SO4: the colour changed to orange, brown, and black. After addition of H2SO4 and NH4OH: the colour changed to yellow, light lemon, and brown. | 1: – 2: – 3: – | 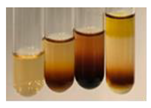 |
| Lc S | Before boiling: yellow-orange solution and precipitation of a white colour After boiling: light-lemon solution + formation of a white precipitation | Before: + After: – | 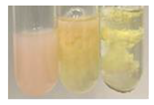 | After addition of H2SO4: the colour changed to orange-brown, pink precipitation formation. After boiling with H2SO4: the colour changed to brown-orange, pink precipitation formation. After addition of H2SO4 and NH4OH: the colour changed to light lemon, plus a fine precipitation and red-orange colour. | 1: + 2: +/– 3: +/– | 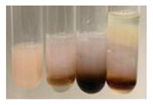 |
| Mc F | Before boiling: orange solution After boiling: lemon solution | Before: – After: – |  | After addition of H2SO4: the colour change to light orange and brown. After boiling with H2SO4: the colour changed to brown, dark brown. After addition of H2SO4 and NH4OH: the colour changed to amber, orange, red-brown, plus a colourless glow. | 1: + 2: – 3: – | 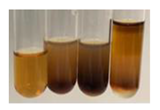 |
| Ob H | Before boiling: orange solution After boiling: lemon solution | Before: – After: – | 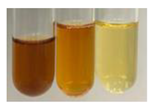 | After addition of H2SO4: the colour changed to cloudy orange and brown. After boiling with H2SO4: the colour changed to brown and black. After addition of H2SO4 and NH4OH: the colour changed to amber, orange. | 1: + 2: – 3: – | 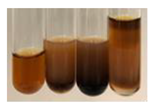 |
| Pm H | Before boiling: orange solution After boiling: lemon solution | Before: – After: – | 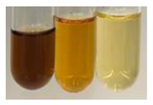 | After addition of H2SO4: the colour changed to brown-red and dark maroon. After boiling with H2SO4: the colour changed to brown, blood-brown, and black. After addition of H2SO4 and NH4OH: the colour changed to brown, orange, and black. | 1: – 2: – 3: – | 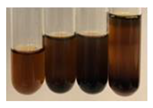 |
| Poa H | Before boiling: yellow- orange solution After boiling: lemon solution | Before: – After: – | 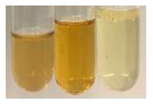 | After addition of H2SO4: the colour changed to yellow and orange. After boiling with H2SO4: the colour changed to brown, orange, and red. After addition of H2SO4 and NH4OH: the colour changed to red, orange, yellow, and dark yellow. | 1: +/– 2: +/– 3: +/– | 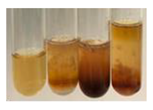 |
| Ps S | Before boiling: yellow- colourless solution + precipitation formed After boiling: light-lemon solution + precipitation of a white precipitation | Before: + After: – | 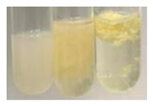 | After addition of H2SO4: the colour changed to light pink and red-brown. After boiling with H2SO4: the colour changed to light pink and brown. After addition of H2SO4 and NH4OH: the colour changed to lemon, white precipitation, red-brown. | 1: + 2: +/– 3: +/– | 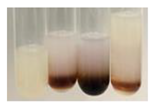 |
| Pta L | Before boiling: orange solution After boiling: lemon solution | Before: – After: – |  | After addition of H2SO4: the colour changed to yellow-orange and black. After boiling with H2SO4: the colour changed to orange; a fine precipitation formed, black colour. After addition of H2SO4 and NH4OH: the colour changed to orange, yellow, and black, plus orange Precipitation. | 1: + 2: +/– 3: +/– | 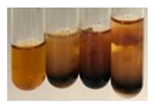 |
| Sg L | Before boiling: orange-red solution After boiling: yellow solution | Before: – After: – | 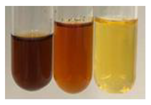 | After addition of H2SO4: the colour changed to amber, yellow/green, and black. After boiling with H2SO4: formation of olive/brown Precipitation; the colour change to black and yellow-brown. After addition of H2SO4 and NH4OH: the colour changed to brown, yellow-orange, plus a colourless glow. | 1: + 2: +/– 3: +/– | 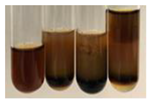 |
| So R | Before boiling: yellow-lemon solution + brown precipitation After boiling: yellow-lemon solution + precipitation of a brick-red colour | Before: – After: + | 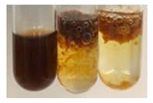 | After addition of H2SO4: formation of a jelly-like consistency; the colour changed to orange/brown/black After boiling with H2SO4: formation of a jelly-like consistency; the colour changed to brown/black. After addition of H2SO4 and NH4OH: the colour changed to brown, and black, plus a colourless glow. | 1: + 2: +/– 3: +/– | 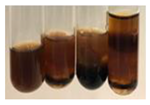 |
| To F | Before boiling: orange solution + formation of an amber-coloured precipitation After boiling: yellow-lemon solution | Before: – After: – | 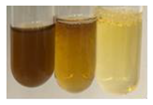 | After addition of H2SO4: the colour changed to brown and black. After boiling with H2SO4: the colour change to dark brown plus a black glow After addition of H2SO4 and NH4OH: the colour changed to orange, amber, and blood-brown. | 1: – 2: – 3: – | 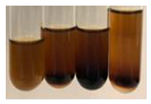 |
| To L | Before boiling: orange solution + formation of a fine precipitation After boiling: yellow solution | Before: – After: – |  | After addition of H2SO4: formation of brown-orange and fine precipitation. After boiling with H2SO4: the colour changed to brown plus a black glow. After addition of H2SO4 and NH4OH: the colour changed to black and orange, plus a colourless glow. | 1: + 2: +/– 3: +/– | 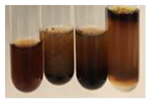 |
| To R | Before boiling: cloudy orange solution After boiling: light lemon solution | Before: – After: – |  | After addition of H2SO4: the colour changed to light yellow and black. After boiling with H2SO4: the colour changed to orange plus fine precipitation, black-brown colour. After addition of H2SO4 and NH4OH: the colour changed to yellow, lemon, black, and yellow/colourless. | 1: – 2: +/– 3: – | 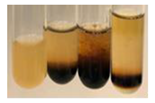 |
| Tp F | Before boiling: orange solution After boiling: lemon solution | Before: – After: – | 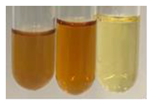 | After addition of H2SO4: the colour changed to red- orange and brown. After boiling with H2SO4: the colour changed to brown-red, black colour. After addition of H2SO4 and NH4OH: the colour changed to yellow-orange, pale orange, and brown. | 1: +/– 2: +/– 3: – | 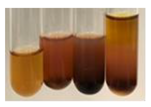 |
| Ur L | Before boiling: light-orange solution After boiling: lemon solution | Before: – After: – | 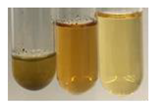 | After addition of H2SO4: the colour changed to amber, orange, and colourless. After boiling with H2SO4: the colour changed to brown- yellow with an amber glow. After addition of H2SO4 and NH4OH: the colour changed to yellow, orange, and amber. | 1: – 2: – 3: – | 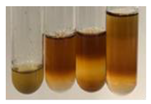 |
| Ur R | Before boiling: light-yellow solution After boiling: light lemon solution | Before: – After: – | 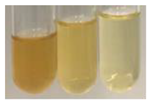 | After addition of H2SO4: the colour changed to yellow-orange. After boiling with H2SO4: the colour changed to orange, yellow, amber colour. After addition of H2SO4 and NH4OH: the colour changed to yellow, pale yellow, and colourless solution. | 1: – 2: – 3: – |  |
| Vo R | Before boiling: orange solution After boiling: yellow solution | Before: – After: – | 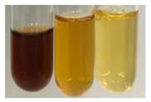 | After addition of H2SO4: the colour changed to brown-red and black. After boiling with H2SO4: the colour changed to brown and black. After addition of H2SO4 and NH4OH: the colour changed to orange-brown. | 1: – 2: – 3: – | 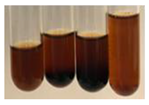 |
| Method | Salkowski Test | Acetic acid and H2SO4 Test | Liebermann-Burchard Test | ||||||
|---|---|---|---|---|---|---|---|---|---|
| Extract | Observations | Result | Photograph | Observations | Result | Photograph | Observations | Result | Photograph |
| Alv L | The separation of 4 phases was observed: orange, colourless, amber and colourless. | + triterpenoids, triterpenes |  | The formation of 3 phases: orange, white precipitate, orange-brown. | – |  | A yellow colour change of the solution was observed with precipitation | – |  |
| Am Fr | The separation of 3 phases was observed: dirty blood, translucent, and dark maroon. | + phytosterols |  | The formation of 2 phases: red, black. | – |  | The separation of 2 red and colourless phases was observed | + steroids |  |
| Arv H | The separation of 3 phases was observed: brick, colourless, and black. | + phytosterols | 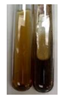 | The formation of 2 phases: orange, brown. | – |  | The separation of 2 phases: light orange and colourless. | – | 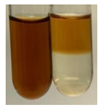 |
| Bv R | The separation of 4 phases was observed: blood, colourless, black, and slightly yellow. | + steroids, phytosterols |  | The formation of 3 phases: dark raspberry, orange, and black and red. | – | 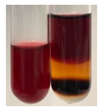 | The separation of 3 phases was observed: orange, yellow, and colourless. | – | 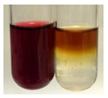 |
| Co F | The separation of 4 phases was observed: amber, slightly yellow, brown, and yellow. | + steroids, triterpenoids, triterpenes |  | The formation of 2 phases: orange and red-black. | – | 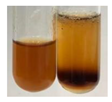 | The separation of 3 phases was observed: orange, lemon, and colourless. A slight precipitation was noticed in the highest phase. | – | 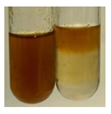 |
| Ea H | Two phases were distinguished: yellow and dark amber. | + triterpenoids, triterpenes | 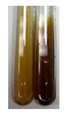 | The formation of 2 phases: yellow and red-brown. | – | 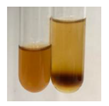 | The separation of 2 phases with a light precipitate was observed: yellow and colourless. | – | 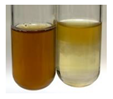 |
| Ep F | The separation of 2 phases was observed: dirty brown and colourless. | + phytosterols |  | The appearance of a black ring was observed; the solution turned red. | – | 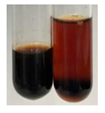 | The separation of 2 phases was observed: colourless and brick-red. | + steroids |  |
| Ep L | The separation of 2 phases was observed: black and colourless. | – |  | The formation of 3 phases: orange, cloudy light brown, black. | – |  | Precipitation of a yellow-orange solid was observed. | – | 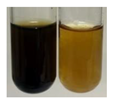 |
| Hp H | The separation of 3 phases was observed: brick, colourless, and black. | + phytosterols | 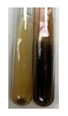 | The formation of 3 phases: red-salmon, orange, black, and red. | – | 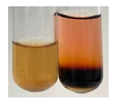 | The separation of 2 phases was observed: salmon and colourless. | – | 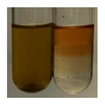 |
| Hr Fr | The separation of 4 phases was observed: colourless twice, yellow, and brick. | + triterpenoids, triterpenes | 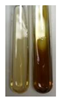 | The formation of 2 phases: a light lemon and an orange-red ring. | – | 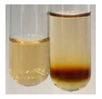 | The separation of 2 phases was observed: slightly yellow and colourless. | – |  |
| Lc S | Separation of 2 phases was observed: colourless and red- orange. | – |  | The formation of 2 phases: light powder pink and a red-brown ring. | – | 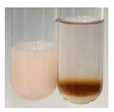 | Discolouration of the solution was observed, with a slight salmon glow. | – |  |
| Mc F | The separation of 3 phases was observed: maroon, yellow, and orange-yellow. | + steroids, triterpenes |  | The formation of 2 phases: yellow and orange. | – | 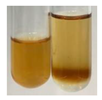 | Colour change of the solution to light green was observed. | + phytosterols |  |
| Ob H | The separation of 2 phases was observed: dark brown and slightly yellow. | + steroids, phytosterols |  | The formation of 2 phases: orange and red-brown. | – |  | A colour change to orange-yellow in the solution and precipitation were observed. | – | 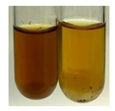 |
| Pm H | The separation of 2 phases was observed: dark brown and slightly lemon. | + steroids, phytosterols | 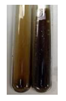 | The formation of 2 phases: brown solution and brown ring. | – |  | The separation of 3 phases was observed: orange, salmon with a delicate precipitation, and colourless. | – |  |
| Poa H | The separation of 4 phases was observed: orange, colourless, brick-red, and light red. | + triterpenoids, triterpenes |  | The formation of 3 phases: bright orange, orange, and dark orange. | – |  | The separation of 2 phases was observed: orange and colourless. | – |  |
| Ps S | The separation of 4 phases was observed: dirty beige, colourless, brick-red, and slightly yellow. | + steroids |  | The formation of 2 phases: light powder pink and red-brown ring. | – |  | The colour of the solution changed to a delicate powder pink, and the formation of a weak precipitate was observed. | – | 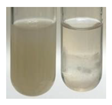 |
| Pta L | The separation of 3 phases was observed: black, colourless, and brick-orange | + phytosterols |  | The formation of 2 phases: yellow, black and red. | – | 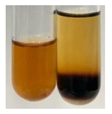 | The separation of 3 phases was observed: orange, yellow and colourless. | – | 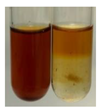 |
| Sg L | Development of a yellow ring was observed. | + phytosterols |  | The formation of 2 phases: orange and red-black. | – |  | The separation of 3 phases was observed: orange, lemon, and colourless. | – |  |
| So R | The separation of 3 phases was observed: brick-red with a gelatinous consistency, colourless, and black. | + phytosterols |  | The formation of 2 phases: orange with dispersed precipitation and a black ring. | – | 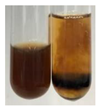 | The separation of 2 phases was observed: amber and colourless. | – | 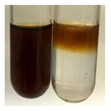 |
| To F | The separation of 3 phases was observed: amber, colourless, and black. | – | 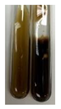 | The formation of 2 phases: orange and reddish brown ring. | – | 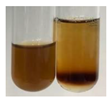 | The separation of 2 phases was observed: orange and colourless. | – |  |
| To L | The separation of 2 phases was observed: dirty brown and colourless. | + phytosterols |  | The formation of 2 phases: orange and red ring. | – | 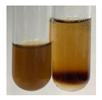 | A slight precipitate was observed at the bottom, and the solution turned orange. | – | 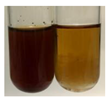 |
| To R | The separation of 3 phases was observed: light brown, colourless, and black. | – | 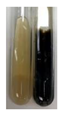 | The formation of 2 phases: light yellow and black and red. | – | 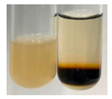 | The colour change of the solution to lemon was observed. | – | 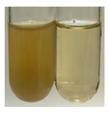 |
| Tp F | The separation of 2 phases was observed: amber and yellow. | + steroids, triterpenes | 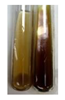 | The formation of 2 phases: orange and red-brown. | – |  | The colour of the solution changed to a delicate salmon orange colour with precipitation. | – | 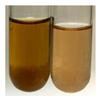 |
| Ur L | The separation of 2 phases was observed: dark amber and colourless. | + triterpenes | 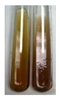 | The formation of 2 phases: dirty orange and bright orange. | – | 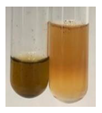 | The formation of a white precipitate and a change of colour of the solution to yellow-straw were observed. | – |  |
| Ur R | The separation of 2 phases was observed: colourless and light amber. | + triterpenes |  | The formation of 3 phases: light lemon, yellow and orange. | – |  | The separation of 2 phases was observed: light green and colourless. | + phytosterols | 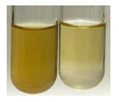 |
| Vo R | The separation of 3 phases was observed: brown, colourless, and dark brown. | + terpenoids |  | The formation of 2 phases: orange and red-black. | – | 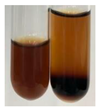 | The separation of 2 phases was observed: orange and colourless. | – | 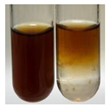 |
| Method | Hager’s Test | Tannic Acid Test | Mayer’s Test (1) | Mayer’s Test (2) | ||||||||
|---|---|---|---|---|---|---|---|---|---|---|---|---|
| Extract | Observations | Result | Photograph | Observations | Result | Photograph | Observations | Result | Photograph | Observations | Result | Photograph |
| Alv L | Colour change of the solution to orange-yellow | – |  | Cappuccino- coloured precipitation | – | 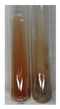 | No changes were observed | – | 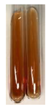 | Colour change of the solution to orange-yellow | – | 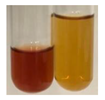 |
| Am Fr | Colour change of the solution to orange-yellow | – |  | Colour change of the solution to more intense red | + | 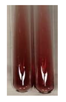 | No changes were observed | – |  | Colour change of the solution to vivid red | – |  |
| Arv H | Colour change of the solution to yellow | – |  | Colour change of the solution to orange | – |  | No changes were observed | – | 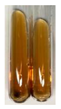 | Colour change of the solution to yellow-orange; a fine precipitate formed | + |  |
| Bv R | Colour change of the solution to intense red | – |  | Colour change of the solution to more intense red | + |  | No changes were observed | – |  | Colour change of the solution to intense raspberry | – | 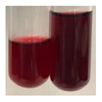 |
| Co F | Colour change of the solution to intense yellow with an orange glow | – |  | Colour change of the solution to orange with precipitation | – |  | Turbidity of the solution was observed. | – |  | Colour change of the solution to orange; a fine precipitation formed | + |  |
| Ea H | Colour change of the solution to yellow-orange | – |  | Colour change of the solution to orange-yellow | – |  | Colour change of the solution to slightly yellow | – | 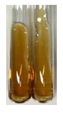 | Colour change of the solution to dirty yellow | – | 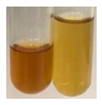 |
| Ep F | Colour change of the solution to orange-yellow | – |  | Colour change of the solution to brown-orange | – |  | No changes were observed | – |  | Colour change of the solution to red-orange; a red precipitate formed | – | 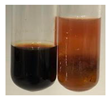 |
| Ep L | Colour change of the solution to yellow-brown | – |  | Colour change of the solution to orange-yellow | – |  | Colour change of the solution to dirty orange | – |  | Colour change of the solution to yellow-brown | – |  |
| Hp H | Colour change of the solution to intense yellow | – | 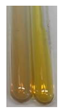 | Colour change of the solution to orange | – |  | No changes were observed | – |  | Colour change of the solution to orange; a fine precipitation formed | + |  |
| Hr Fr | Colour change of the solution to intense yellow | – | 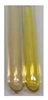 | No changes were observed | – | 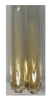 | No changes were observed | – | 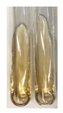 | Colour change of the solution to intense yellow | – | 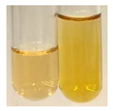 |
| Lc S | Colour change of the solution to neon yellow; precipitation of a white precipitate | + | 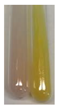 | Formation of a powdery pink deposit | – |  | The solution became clearer | – |  | Formation of a white precipitate | – | 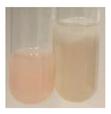 |
| Mc F | Colour change of the solution to intense yellow with an orange glow | – | 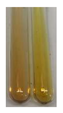 | Colour change of the solution to orange-yellow | – | 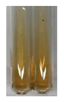 | No changes were observed | – |  | Colour change of the solution to green-yellow | – | 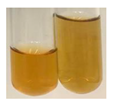 |
| Ob H | Colour change of the solution to orange-yellow | – |  | No changes were observed | – | 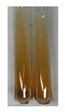 | No changes were observed | – |  | Colour change of the solution to yellow-orange; a fine precipitate formed | + | 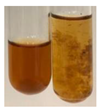 |
| Pm H | Colour change of the solution to intense yellow | – |  | No changes were observed | – |  | No changes were observed | – |  | Colour change of the solution to brown | – |  |
| Poa H | Colour change of the solution to neon yellow | – |  | Colour change of the solution to bright orange | – |  | No changes were observed | – |  | Colour change of the solution to intense yellow | – |  |
| Ps S | Colour change of the solution to neon yellow; precipitation of a white precipitate | + |  | Formation of a white precipitate | – |  | The solution became clearer | – | 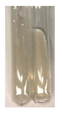 | The formation of a white precipitate | + |  |
| Pta L | The colour change of the solution to orange-yellow | – | 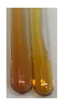 | The colour change of the solution to yellow | – | 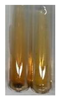 | No changes were observed | – | 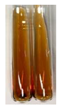 | Colour change of the solution to brownish-orange; a fine precipitation formed | + |  |
| Sg L | Colour change of the solution to orange-yellow | – |  | Colour change of the solution to brown-orange | + |  | It was observed that the solution became more yellowish | – |  | Colour change of the solution to orange-green | – |  |
| So R | Colour change of the solution to intense yellow; discharge of a delicate gelatinous deposit | – | 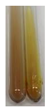 | Colour change of the solution to brown-orange | + | 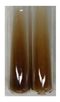 | No changes were observed | – |  | Colour change of the solution to colourless; a brown-reddish precipitate formed | + |  |
| To F | Colour change of the solution to yellow | – | 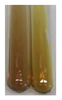 | No changes were observed | – |  | No changes were observed | – | 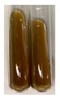 | Colour change of the solution to brown-orange | – | 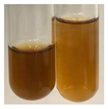 |
| To L | Colour change of the solution to yellow-orange | – |  | Colour change of the solution to orange | – |  | A change in degree to a brighter one was observed | – |  | Colour change of the solution to orange; a brownish precipitate formed | + | 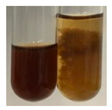 |
| To R | Colour change of the solution to intense yellow | – |  | No changes were observed | – |  | No changes were observed | – |  | Colour change of the solution to light yellow | – |  |
| Tp F | Colour change of the solution to intense yellow with an orange glow | – |  | No changes were observed | – |  | The solution became clearer | – |  | Colour change of the solution to orange-yellow | – |  |
| Ur L | The colour change of the solution to intense yellow | – |  | The colour change of the solution to orange | – | 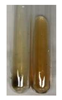 | No changes were observed | – |  | The colour change of the solution to yellow-orange | – | 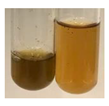 |
| Ur R | Colour change of the solution to intense yellow | – |  | Colour change of the solution to bright orange | – | 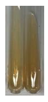 | No changes were observed | – |  | Colour change of the solution to dirty yellow | – | 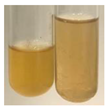 |
| Vo R | Colour change of the solution to orange-yellow | – |  | Colour change of the solution to brown | + |  | No changes were observed | – | 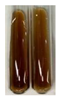 | Colour change of the solution to brown-orange | – | 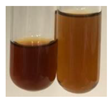 |
| Method | Dragendroff’s Test (1) and (2) | Wagner’s Test | ||||
|---|---|---|---|---|---|---|
| Extract | Observations | Result | Photograph | Observations | Result | Photograph |
| Alv L | (1) Orange solution (2) Yellow-orange solution | (1) – (2) – | 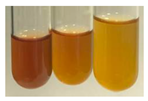 | Colour change of the solution to bloody | – | 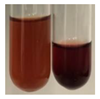 |
| Am Fr | (1) Change in the shade of red colour (2) Colour change to red | (1) – (2) – |  | Colour change of the solution to brown-brick | – |  |
| Arv H | (1) Brown-orange solution (2) Brown-orange solution with precipitate | (1) – (2) + | 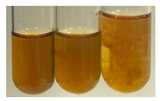 | Colour change of the solution to orange-red-brown | – |  |
| Bv R | (1) No changes were observed (2) No changes were observed | (1) – (2) – | 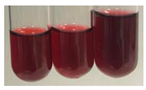 | Colour change of the solution to dark-blooded | – |  |
| Co F | (1) Brown-orange solution (2) Brown-orange solution | (1) + (2) + |  | Colour change of the solution to orange-red | – |  |
| Ea H | (1) Orange solution (2) Orange-yellow solution | (1) – (2) – |  | Colour change of the solution to brown-red | – |  |
| Ep F | (1) Brown solution (2) Orange solution + precipitation formed | (1) – (2) + |  | Colour change of the solution to brown-red | – |  |
| Ep L | (1) Cloudiness of the solution (2) Orange solution + precipitation formed | (1) – (2) + |  | Colour change of the solution to brown | – |  |
| Hp H | (1) Orange solution (2) Orange solution | (1) – (2) – |  | Colour change of the solution to brown | – |  |
| Hr Fr | (1) Intense yellow solution (2) Yellow solution | (1) – (2) – |  | Colour change of the solution to brown | – |  |
| Lc S | (1) The formation of 2 layers: orange and cloudy white (2) The separation of 3 layers: salmon, yellow, and orange | (1) + (2) – |  | Colour change of the solution to orange | – |  |
| Mc F | (1) Yellow solution (2) Yellow solution | (1) – (2) – | 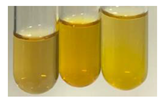 | Colour change of the solution to orange-red | – |  |
| Ob H | (1) Brown-orange solution (2) Yellow-orange solution with fine precipitation | (1) – (2) + |  | Colour change of the solution to brown-red | – | 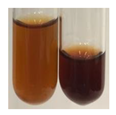 |
| Pm H | (1) Brown-orange solution (2) Brown-orange solution | (1) – (2) – | 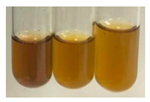 | Colour change of the solution to brown | – | 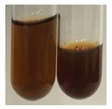 |
| Poa H | (1) Yellow solution (2) The formation of 2 layers: intense yellow and lemon | (1) – (2) – | 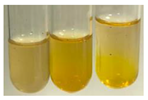 | Colour change of the solution to brown-red | – | 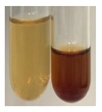 |
| Ps S | (1) The formation of 2 layers: orange and light yellow (2) The formation of 3 layers: salmon, yellow, and orange (fine precipitation) | (1) + (2) + | 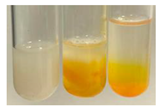 | Colour change of the solution to orange | – | 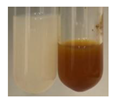 |
| Pta L | (1) Orange solution (2) Yellow-orange solution | (1) – (2) – |  | Colour change of the solution to amber; precipitation formed | + | 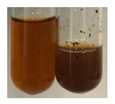 |
| Sg L | (1) Brown-orange solution (2) Brown-orange solution | (1) – (2) – | 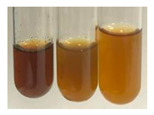 | Colour change of the solution to brown-orange | – | 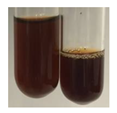 |
| So R | (1) Brown-orange solution (2) Yellow-orange solution with fine precipitation | (1) – (2) + | 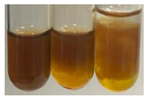 | Colour change of the solution to brown | – | 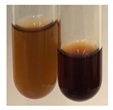 |
| To F | (1) Orange-brown solution (2) Brown-orange solution | (1) – (2) – | 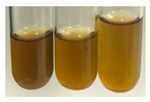 | Colour change of the solution to brown-red | – | 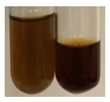 |
| To L | (1) Orange-brown solution (2) Brown-orange solution with fine precipitation | (1) – (2) + | 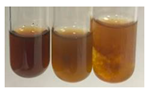 | Colour change of the solution to brown | – | 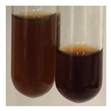 |
| To R | (1) Yellow solution (2) The formation of two layers: yellow and lemon | (1) – (2) – |  | Colour change of the solution to orange-brown | – | 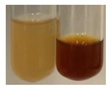 |
| Tp F | (1) Orange solution (2) Orange solution | (1) – (2) – | 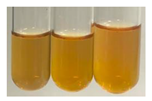 | Colour change of the solution to brown-red | – |  |
| Ur L | (1) Brown-orange solution (2) Orange solution | (1) – (2) – | 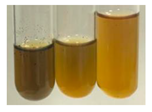 | Colour change of the solution to brown-red | – | 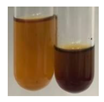 |
| Ur R | (1) Orange solution (2) Orange-yellow solution | (1) – (2) – |  | Colour change of the solution to orange-red | – |  |
| Vo R | (1) Brown-orange solution (2) Brown-orange solution | (1) – (2) – | 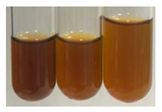 | Colour change of the solution to dark brown | – | 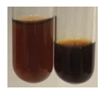 |
| Source | Al | B | Ba | Ca | Cd | Cr | ||||||
|---|---|---|---|---|---|---|---|---|---|---|---|---|
| Raw Material | Extract | Raw Material | Extract | Raw Material | Extract | Raw Material | Extract | Raw Material | Extract | Raw Material | Extract | |
| Alv L | 246 ± 3 | 2.20 ± 0.03 | 15.9 ± 0.20 | 0.245 ± 0.005 | 58.6 ± 0.8 | 1.32 ± 0.01 | 37,440 ± 165 | 1193 ± 9 | 0.114 ± 0.003 | <LOD | 4.83 ± 0.10 | 0.023 ± 0.001 |
| Am Fr | 8.42 ± 0.17 | 0.030 ± 0.001 | 22.4 ± 0.40 | 0.431 ± 0.002 | 4.14 ± 0.16 | 0.024 ± 0.001 | 1746 ± 85 | 16.5 ± 0.1 | 0.111 ± 0.008 | <LOD | 2.27 ± 0.01 | 0.031 ± 0.002 |
| Arv H | 30.4 ± 0.8 | 0.102 ± 0.003 | 19.4 ± 0.20 | 0.214 ± 0.001 | 13.8 ± 0.6 | 0.058 ± 0.001 | 5992 ± 17 | 49.0 ± 0.3 | 1.84 ± 0.07 | 0.011 ± 0.001 | 0.367 ± 0.021 | 0.0015 ± 0.0001 |
| Bv R | 29.1 ± 1.2 | 0.060 ± 0.001 | 19.3 ± 0.2 | 0.268 ± 0.002 | 24.5 ± 0.7 | 0.199 ± 0.002 | 2147 ± 108 | 12.9 ± 0.1 | 0.197 ± 0.009 | <LOD | 0.183 ± 0.008 | 0.0047 ± 0.0002 |
| Co F | 675 ± 3 | 1.26 ± 0.01 | 52.4 ± 0.3 | 1.08 ± 0.01 | 4.69 ± 0.03 | 0.033 ± 0.001 | 5932 ± 21 | 84.7 ± 0.2 | 0.197 ± 0.005 | <LOD | 2.73 ± 0.05 | 0.081 ± 0.002 |
| Ea H | 37.0 ± 0.2 | 0.181 ± 0.002 | 22.7 ± 0.20 | 0.572 ± 0.007 | 22.8 ± 0.2 | 0.237 ± 0.004 | 20,815 ± 271 | 428 ± 1 | 0.123 ± 0.002 | <LOD | 2.42 ± 0.05 | 0.012 ± 0.001 |
| Ep F | 46.8 ± 0.4 | 0.965 ± 0.031 | 89.1 ± 0.90 | 1.83 ± 0.01 | 8.69 ± 0.0 | 0.140 ± 0.007 | 20,620 ± 31 | 500 ± 6 | <LOD | <LOD | 2.29 ± 0.03 | 1.84 ± 0.01 |
| Ep L | 62.5 ± 3.5 | 0.223 ± 0.011 | 222 ± 2 | 7.86 ± 0.16 | 26.8 ± 0.1 | 0.355 ± 0.002 | 40,254 ± 785 | 1234 ± 39 | <LOD | <LOD | 3.14 ± 0.11 | 0.160 ± 0.008 |
| Hp H | 19.5 ± 0.2 | 0.229 ± 0.007 | 20.3 ± 0.60 | 0.531 ± 0.005 | 17.9 ± 0.1 | 0.185 ± 0.001 | 3601 ± 69 | 75.1 ± 0.8 | 0.701 ± 0.017 | 0.0074 ± 0.0004 | 0.287 ± 0.02 | 0.0031 ± 0.0002 |
| Hr Fr | 18.6 ± 0.1 | 0.050 ± 0.002 | 15.2 ± 0.10 | 0.335 ± 0.005 | 0.977 ± 0.008 | 0.011 ± 0.001 | 1286 ± 11 | 10.5 ± 0.5 | <LOD | <LOD | 2.07 ± 0.04 | 0.014 ± 0.001 |
| Lc S | 6.51 ± 0.01 | 0.048 ± 0.002 | 6.56 ± 0.03 | 0.090 ± 0.001 | 1.64 ± 0.01 | 0.013 ± 0.001 | 300 ± 2 | 7.43 ± 0.06 | <LOD | <LOD | 2.64 ± 0.02 | 0.0076 ± 0.0004 |
| Mc F | 83.2 ± 1.1 | 0.140 ± 0.003 | 35.5 ± 0.4 | 0.749 ± 0.004 | 3.11 ± 0.04 | 0.022 ± 0.001 | 8061 ± 11 | 128 ± 1 | 0.524 ± 0.024 | <LOD | 1.79 ± 0.03 | 0.021 ± 0.001 |
| Ob H | 562 ± 8 | 1.66 ± 0.01 | 31.1 ± 0.30 | 0.465 ± 0.001 | 26.8 ± 0.3 | 0.276 ± 0.003 | 24,738 ± 210 | 348 ± 1 | 0.205 ± 0.010 | <LOD | 1.21 ± 0.03 | 0.0045 ± 0.0002 |
| Pm H | 334 ± 2 | 0.981 ± 0.006 | 29.8 ± 0.2 | 0.338 ± 0.003 | 52.3 ± 0.3 | 1.44 ± 0.01 | 28,384 ± 312 | 935 ± 2 | 0.210 ± 0.011 | 0.0037 ± 0.0001 | 1.42 ± 0.02 | 0.0055 ± 0.0003 |
| Poa H | 492 ± 26 | 1.37 ± 0.01 | 21.4 ± 0.20 | 0.181 ± 0.003 | 18.4 ± 0.6 | 0.069 ± 0.001 | 7326 ± 37 | 15.2 ± 0.2 | 0.376 ± 0.001 | <LOD | 6.08 ± 0.13 | 0.0066 ± 0.0002 |
| Ps S | 0.943 ± 0.013 | 0.023 ± 0.001 | 7.08 ± 0.06 | 0.104 ± 0.001 | 1.36 ± 0.01 | 0.011 ± 0.001 | 642 ± 17 | 12.8 ± 0.1 | <LOD | <LOD | 2.11 ± 0.05 | 0.0097 ± 0.0003 |
| Pta L | 165 ± 4 | 1.03 ± 0.01 | 26.2 ± 0.20 | 0.296 ± 0.004 | 161 ± 3.0 | 0.305 ± 0.002 | 6043 ± 21 | 45.4 ± 0.3 | 0.272 ± 0.008 | <LOD | 2.95 ± 0.05 | 0.0031 ± 0.0003 |
| Sg L | 50.0 ± 0.6 | 0.139 ± 0.007 | 66.7 ± 0.6 | 1.20 ± 0.01 | 13.2 ± 0.1 | 0.055 ± 0.001 | 12,182 ± 88 | 127 ± 1 | 0.144 ± 0.008 | <LOD | 0.314 ± 0.015 | 0.0037 ± 0.0001 |
| So R | 587 ± 6 | 6.08 ± 0.05 | 9.25 ± 0.05 | 0.096 ± 0.001 | 16.6 ± 0.1 | 0.205 ± 0.002 | 4041 ± 24 | 68.2 ± 0.5 | 0.220 ± 0.006 | <LOD | 1.74 ± 0.01 | 0.018 ± 0.001 |
| To F | 124 ± 6 | 0.309 ± 0.005 | 39.7 ± 0.1 | 0.834 ± 0.005 | 3.51 ± 0.06 | 0.032 ± 0.001 | 5094 ± 40 | 70.0 ± 1.1 | 0.240 ± 0.010 | 0.0037 ± 0.0002 | 0.997 ± 0.048 | 0.248 ± 0.004 |
| To L | 42.3 ± 0.4 | 0.148 ± 0.003 | 34.3 ± 0.3 | 0.409 ± 0.006 | 16.0 ± 0.2 | 0.127 ± 0.001 | 14412 ± 104 | 264 ± 2.6 | 0.685 ± 0.030 | 0.0057 ± 0.0001 | 0.269 ± 0.006 | 0.0076 ± 0.0003 |
| To R | 154 ± 1 | 1.51 ± 0.01 | 12.3 ± 0.2 | 0.099 ± 0.002 | 14.0 ± 0.2 | 0.089 ± 0.001 | 2038 ± 31 | 32.9 ± 0.3 | 0.371 ± 0.008 | 0.0056 ± 0.0002 | 1.05 ± 0.04 | 0.0096 ± 0.0004 |
| Tp F | 110 ± 2 | 0.311 ± 0.003 | 22.1 ± 0.3 | 0.164 ± 0.002 | 18.9 ± 0.3 | 0.151 ± 0.001 | 15,413 ± 170 | 137 ± 1 | <LOD | <LOD | 0.819 ± 0.016 | 0.011 ± 0.001 |
| Ur L | 98.8 ± 0.5 | 0.142 ± 0.003 | 63.3 ± 0.60 | 0.772 ± 0.007 | 41.3 ± 0.2 | 0.258 ± 0.001 | 45,964 ± 250 | 606 ± 3 | <LOD | <LOD | 2.15 ± 0.04 | 0.012 ± 0.001 |
| Ur R | 831 ± 39 | 1.46 ± 0.02 | 19.9 ± 0.90 | 0.115 ± 0.001 | 24.8 ± 0.9 | 0.076 ± 0.001 | 10,496 ± 268 | 43.2 ± 0.6 | 0.149 ± 0.006 | <LOD | 4.71 ± 0.22 | 0.0089 ± 0.0003 |
| Vo R | 517 ± 4 | 2.92 ± 0.02 | 16.0 ± 0.1 | 0.197 ± 0.001 | 16.5 ± 0.2 | 0.123 ± 0.001 | 2013 ± 9 | 29.2 ± 0.3 | 0.260 ± 0.003 | 0.0047 ± 0.0002 | 2.96 ± 0.027 | 0.013 ± 0.001 |
| Source | Cu | Fe | K | Mg | Mn | Na | ||||||
|---|---|---|---|---|---|---|---|---|---|---|---|---|
| Raw Material | Extract | Raw Material | Extract | Raw Material | Extract | Raw Material | Extract | Raw Material | Extract | Raw Material | Extract | |
| Alv L | 6.52 ± 0.09 | 0.203 ± 0.004 | 360 ± 3 | 5.21 ± 0.04 | 19,791 ± 297 | 798 ± 9 | 7472 ± 43 | 319 ± 3 | 67.4 ± 1.3 | 2.90 ± 0.02 | 2634 ± 16 | 133 ± 1 |
| Am Fr | 2.97 ± 0.11 | 0.035 ± 0.001 | 19.4 ± 0.9 | 0.048 ± 0.001 | 8118 ± 100 | 206 ± 4 | 795 ± 27 | 13.8 ± 0.2 | 15.1 ± 0.2 | 0.246 ± 0.004 | 20.0 ± 0.9 | 0.853 ± 0.03 |
| Arv H | 10.6 ± 0.1 | 0.231 ± 0.003 | 52.3 ± 1.5 | 0.132 ± 0.001 | 18,407 ± 271 | 586 ± 3 | 1165 ± 20 | 21.0 ± 0.1 | 78.6 ± 3.3 | 1.17 ± 0.01 | 28.6 ± 1.9 | 1.18 ± 0.02 |
| Bv R | 5.94 ± 0.15 | 0.098 ± 0.001 | 49.4 ± 1.7 | 0.277 ± 0.002 | 31,542 ± 127 | 745 ± 1 | 2068 ± 38 | 44.4 ± 0.1 | 23.0 ± 0.8 | 0.269 ± 0.003 | 6523 ± 36 | 126 ± 1 |
| Co F | 51.1 ± 0.2 | 0.999 ± 0.006 | 720 ± 3 | 1.27 ± 0.01 | 25,872 ± 160 | 729 ± 7 | 3989 ± 12 | 84.1 ± 0.5 | 34.6 ± 0.1 | 0.610 ± 0.003 | 5918 ± 22 | 213 ± 1 |
| Ea H | 6.33 ± 0.05 | 0.107 ± 0.002 | 64.7 ± 0.6 | 0.125 ± 0.002 | 27,797 ± 473 | 973 ± 9 | 4320 ± 60 | 146 ± 1 | 37.8 ± 0.3 | 0.896 ± 0.014 | 96.8 ± 1.1 | 2.62 ± 0.04 |
| Ep F | 9.32 ± 0.06 | 0.319 ± 0.004 | 67.6 ± 0.5 | 0.399 ± 0.019 | 39,187 ± 302 | 1414 ± 1 | 2587 ± 14 | 71.1 ± 0.7 | 17.1 ± 0.2 | 0.455 ± 0.004 | 36.9 ± 0.4 | 1.38 ± 0.09 |
| Ep L | 9.42 ± 0.14 | 0.182 ± 0.003 | 92.4 ± 3.7 | 0.297 ± 0.003 | 27,762 ± 341 | 940 ± 30 | 5417 ± 80 | 182 ± 6 | 56.3 ± 0.7 | 0.607 ± 0.004 | 35.9 ± 0.5 | 0.760 ± 0.04 |
| Hp H | 9.53 ± 0.02 | 0.290 ± 0.007 | 45.0 ± 1.2 | 0.115 ± 0.001 | 7608 ± 128 | 283 ± 2 | 1364 ± 25 | 41.6 ± 0.5 | 122 ± 4 | 3.67 ± 0.03 | 42.6 ± 2.1 | 2.24 ± 0.12 |
| Hr Fr | 4.73 ± 0.03 | 0.068 ± 0.004 | 38.4 ± 0.1 | 0.069 ± 0.003 | 8467 ± 110 | 234 ± 2 | 684 ± 7 | 16.7 ± 0.1 | 11.1 ± 0.1 | 0.305 ± 0.008 | 654 ± 7 | 17.0 ± 0.1 |
| Lc S | 8.62 ± 0.06 | 0.234 ± 0.003 | 71.3 ± 0.4 | 1.58 ± 0.02 | 8702 ± 57 | 171 ± 1 | 781 ± 2 | 17.2 ± 0.2 | 13.2 ± 0.2 | 0.362 ± 0.005 | 23.0 ± 0.2 | 0.973 ± 0.012 |
| Mc F | 9.06 ± 0.09 | 0.149 ± 0.002 | 116 ± 1 | 0.192 ± 0.001 | 20,513 ± 150 | 645 ± 4 | 2804 ± 11 | 43.4 ± 0.5 | 64.4 ± 0.7 | 1.23 ± 0.01 | 619 ± 11 | 19.4 ± 0.1 |
| Ob H | 23.1 ± 0.2 | 0.321 ± 0.004 | 582 ± 5 | 1.34 ± 0.01 | 33,427 ± 401 | 1218 ± 16 | 6978 ± 84 | 217 ± 1 | 65.0 ± 0.8 | 1.26 ± 0.01 | 735 ± 11 | 23.4 ± 0.1 |
| Pm H | 8.88 ± 0.09 | 0.212 ± 0.002 | 326 ± 2 | 0.662 ± 0.002 | 23,457 ± 375 | 924 ± 4 | 6093 ± 97 | 244 ± 1 | 39.0 ± 0.3 | 1.38 ± 0.01 | 8327 ± 150 | 442 ± 6 |
| Poa H | 5.73 ± 0.13 | 0.064 ± 0.001 | 464 ± 17 | 0.943 ± 0.002 | 20,924 ± 365 | 576 ± 6 | 3013 ± 39 | 44.4 ± 0.5 | 136 ± 2 | 1.84 ± 0.01 | 97.6 ± 4.9 | 2.81 ± 0.03 |
| Ps S | 7.59 ± 0.10 | 0.250 ± 0.004 | 49.1 ± 0.3 | 1.44 ± 0.02 | 9383 ± 197 | 237 ± 4 | 1144 ± 21 | 28.0 ± 0.5 | 13.7 ± 0.3 | 0.410 ± 0.007 | 23.8 ± 0.1 | 1.00 ± 0.01 |
| Pta L | 9.13 ± 0.13 | 0.178 ± 0.002 | 166 ± 3 | 0.210 ± 0.002 | 28,725 ± 112 | 779 ± 2 | 4053 ± 30 | 107 ± 1 | 47.2 ± 0.9 | 0.751 ± 0.004 | 72.7 ± 1.3 | 3.33 ± 0.02 |
| Sg L | 6.12 ± 0.16 | 0.132 ± 0.001 | 86.9 ± 0.5 | 0.164 ± 0.004 | 22,216 ± 267 | 677 ± 8 | 2829 ± 23 | 53.1 ± 0.4 | 62.0 ± 0.4 | 1.88 ± 0.01 | 38.2 ± 0.3 | 1.28 ± 0.01 |
| So R | 27.6 ± 0.20 | 1.09 ± 0.01 | 479 ± 4 | 4.85 ± 0.02 | 28,515 ± 485 | 960 ± 10 | 906 ± 4 | 22.5 ± 0.2 | 151 ± 1 | 0.485 ± 0.005 | 1757 ± 15 | 57.0 ± 0.2 |
| To F | 12.5 ± 0.1 | 0.306 ± 0.004 | 197 ± 9 | 0.427 ± 0.003 | 26,867 ± 362 | 846 ± 21 | 2490 ± 27 | 56.7 ± 1.2 | 27.4 ± 0.9 | 0.537 ± 0.004 | 233 ± 12 | 6.26 ± 0.04 |
| To L | 9.15 ± 0.12 | 0.235 ± 0.004 | 112 ± 1 | 0.179 ± 0.008 | 39,140 ± 391 | 1319 ± 20 | 5505 ± 66 | 161 ± 2 | 123 ± 1 | 2.87 ± 0.03 | 549 ± 8 | 16.7 ± 0.1 |
| To R | 5.60 ± 0.09 | 0.216 ± 0.004 | 129 ± 1 | 0.964 ± 0.006 | 12,623 ± 215 | 418 ± 2 | 904 ± 16 | 21.8 ± 0.2 | 37.3 ± 0.3 | 0.974 ± 0.004 | 219 ± 2 | 6.66 ± 0.06 |
| Tp F | 9.07 ± 0.14 | 0.134 ± 0.002 | 128 ± 1 | 0.238 ± 0.001 | 17,333 ± 151 | 445 ± 3 | 2876 ± 40 | 64.0 ± 0.4 | 51.7 ± 0.6 | 1.07 ± 0.01 | 122 ± 2 | 2.94 ± 0.02 |
| Ur L | 7.42 ± 0.04 | 1.32 ± 0.01 | 160 ± 1 | 0.138 ± 0.002 | 17,423 ± 174 | 520 ± 2 | 8611 ± 112 | 206 ± 1 | 240 ± 1 | 0.747 ± 0.004 | 94.2 ± 0.6 | 1.81 ± 0.08 |
| Ur R | 9.20 ± 0.39 | 0.119 ± 0.003 | 657 ± 28 | 1.11 ± 0.01 | 14,074 ± 321 | 202 ± 1 | 2597 ± 34 | 26.8 ± 0.3 | 39.3 ± 1.7 | 0.201 ± 0.002 | 48.0 ± 1.3 | 1.19 ± 0.01 |
| Vo R | 5.92 ± 0.07 | 0.176 ± 0.002 | 437 ± 3 | 1.58 ± 0.01 | 15,765 ± 57 | 561 ± 6 | 2927 ± 4 | 83.0 ± 0.7 | 61.0 ± 0.3 | 1.58 ± 0.01 | 56.0 ± 0.4 | 3.30 ± 0.03 |
| Source | Ni | P | Pb | S | Sr | Zn | ||||||
|---|---|---|---|---|---|---|---|---|---|---|---|---|
| Raw Material | Extract | Raw Material | Extract | Raw Material | Extract | Raw Material | Extract | Raw Material | Extract | Raw Material | Extract | |
| Alv L | 2.51 ± 0.06 | 0.105 ± 0.003 | 1806 ± 8 | 69.6 ± 0.7 | <LOD | NA | 2725 ± 35 | 115 ± 1 | 117 ± 1 | 4.17 ± 0.02 | 14.3 ± 0.1 | 0.681 ± 0.007 |
| Am Fr | 9.68 ± 0.22 | 0.162 ± 0.001 | 1331 ± 59 | 31.4 ± 0.4 | <LOD | NA | 455 ± 34 | 4.53 ± 0.10 | 5.76 ± 0.13 | 0.037 ± 0.001 | 5.41 ± 0.21 | 0.093 ± 0.004 |
| Arv H | 1.32 ± 0.06 | 0.066 ± 0.003 | 2050 ± 36 | 75.0 ± 1.1 | <LOD | NA | 1321 ± 23 | 38.8 ± 0.1 | 8.97 ± 0.1 | 0.050 ± 0.001 | 39.5 ± 0.2 | 0.520 ± 0.003 |
| Bv R | 0.702 ± 0.009 | 0.073 ± 0.004 | 2765 ± 25 | 73.6 ± 0.3 | <LOD | NA | 1166 ± 1 | 28.2 ± 0.5 | 19.3 ± 0.5 | 0.126 ± 0.001 | 27.8 ± 0.6 | 0.409 ± 0.003 |
| Co F | 2.26 ± 0.11 | 0.362 ± 0.006 | 3793 ± 7 | 131 ± 1 | 2.83 ± 0.12 | NA | 2366 ± 40 | 67.3 ± 0.9 | 59.0 ± 0.5 | 0.788 ± 0.009 | 9.55 ± 0.05 | 0.647 ± 0.006 |
| Ea H | 9.45 ± 0.11 | 0.120 ± 0.006 | 2717 ± 23 | 87.6 ± 0.6 | <LOD | NA | 6809 ± 65 | 327 ± 1 | 39.2 ± 0.6 | 0.875 ± 0.014 | 31.0 ± 0.2 | 0.239 ± 0.001 |
| Ep F | 9.05 ± 0.22 | 4.92 ± 0.02 | 2772 ± 50 | 99.3 ± 3.8 | <LOD | NA | 987 ± 12 | 21.9 ± 0.9 | 23.8 ± 0.2 | 0.450 ± 0.002 | 20.3 ± 0.2 | 3.37 ± 0.02 |
| Ep L | 8.26 ± 0.19 | 1.27 ± 0.01 | 2964 ± 84 | 34.6 ± 0.1 | 2.60 ± 0.05 | NA | 1590 ± 40 | 30.3 ± 0.4 | 70.1 ± 0.7 | 1.76 ± 0.01 | 18.9 ± 0.1 | 0.469 ± 0.018 |
| Hp H | 1.39 ± 0.06 | 0.058 ± 0.002 | 2412 ± 18 | 92.6 ± 2 | <LOD | NA | 1430 ± 18 | 46.9 ± 0.7 | 11.7 ± 0.2 | 0.164 ± 0.002 | 39.8 ± 0.1 | 1.12 ± 0.01 |
| Hr Fr | 9.67 ± 0.26 | 0.082 ± 0.003 | 1808 ± 12 | 18.0 ± 0.1 | <LOD | NA | 1496 ± 31 | 20.7 ± 0.5 | 3.60 ± 0.04 | 0.036 ± 0.001 | 11.1 ± 0.1 | 0.276 ± 0.007 |
| Lc S | 10.8 ± 0.1 | 0.100 ± 0.001 | 3603 ± 35 | 86.1 ± 0.3 | <LOD | NA | 2013 ± 38 | 56.4 ± 1.4 | 2.02 ± 0.01 | 0.016 ± 0.001 | 37.6 ± 0.2 | 0.869 ± 0.004 |
| Mc F | 1.89 ± 0.04 | 0.132 ± 0.001 | 4960 ± 55 | 98.6 ± 0.5 | <LOD | NA | 2734 ± 44 | 54.5 ± 0.4 | 6.29 ± 0.06 | 0.065 ± 0.001 | 34.5 ± 0.4 | 0.337 ± 0.002 |
| Ob H | 1.46 ± 0.02 | 0.083 ± 0.004 | 3929 ± 22 | 105 ± 1 | <LOD | NA | 3541 ± 53 | 90.4 ± 1.4 | 177 ± 2 | 3.25 ± 0.03 | 44.0 ± 0.3 | 0.337 ± 0.002 |
| Pm H | 1.14 ± 0.05 | 0.055 ± 0.001 | 2968 ± 26 | 100 ± 1 | 1.82 ± 0.09 | NA | 9683 ± 55 | 453 ± 12 | 132 ± 1 | 4.53 ± 0.02 | 36.1 ± 0.2 | 0.686 ± 0.005 |
| Poa H | 7.93 ± 0.10 | 0.094 ± 0.001 | 3089 ± 19 | 97.3 ± 0.5 | <LOD | NA | 2048 ± 59 | 48.0 ± 0.9 | 21.6 ± 0.6 | 0.067 ± 0.001 | 50.1 ± 1.6 | 0.616 ± 0.003 |
| Ps S | 11.8 ± 0.20 | 0.085 ± 0.00 | 4034 ± 30 | 121 ± 1 | <LOD | NA | 1773 ± 10 | 56.6 ± 1.5 | 2.15 ± 0.01 | 0.018 ± 0.001 | 34.4 ± 0.2 | 1.07 ± 0.02 |
| Pta L | 5.33 ± 0.06 | 0.209 ± 0.002 | 2596 ± 15 | 49.6 ± 0.4 | 2.74 ± 0.02 | NA | 2478 ± 23 | 65.4 ± 1.3 | 37.9 ± 0.4 | 0.370 ± 0.004 | 19.6 ± 0.3 | 1.71 ± 0.02 |
| Sg L | 1.10 ± 0.05 | 0.096 ± 0.004 | 2193 ± 17 | 63.2 ± 0.2 | <LOD | NA | 1484 ± 31 | 16.8 ± 0.7 | 23.7 ± 0.1 | 0.138 ± 0.001 | 48.2 ± 0.4 | 0.496 ± 0.001 |
| So R | 2.54 ± 0.12 | 0.162 ± 0.008 | 3327 ± 33 | 143 ± 2 | 1.34 ± 0.04 | NA | 1155 ± 16 | 44.4 ± 0.4 | 23.2 ± 0.3 | 0.316 ± 0.004 | 28.1 ± 0.2 | 0.544 ± 0.004 |
| To F | 3.03 ± 0.06 | 1.08 ± 0.01 | 4853 ± 106 | 182 ± 1 | <LOD | NA | 2459 ± 3 | 54.2 ± 0.9 | 5.84 ± 0.11 | 0.061 ± 0.001 | 37.4 ± 0.2 | 0.861 ± 0.005 |
| To L | 1.21 ± 0.02 | 0.099 ± 0.001 | 3034 ± 27 | 105 ± 1 | <LOD | NA | 2666 ± 26 | 76.3 ± 1.4 | 19.9 ± 0.2 | 0.244 ± 0.003 | 41.5 ± 0.3 | 0.534 ± 0.009 |
| To R | 3.49 ± 0.17 | 0.176 ± 0.006 | 2646 ± 24 | 109 ± 1 | <LOD | NA | 963 ± 33 | 38.6 ± 0.8 | 19.5 ± 0.2 | 0.149 ± 0.001 | 16.6 ± 0.1 | 0.488 ± 0.002 |
| Tp F | 6.64 ± 0.12 | 0.212 ± 0.008 | 2046 ± 17 | 48.9 ± 0.4 | 1.05 ± 0.06 | NA | 1361 ± 35 | 19.3 ± 0.5 | 37.1 ± 0.7 | 0.316 ± 0.001 | 24.8 ± 0.3 | 0.374 ± 0.001 |
| Ur L | 7.73 ± 0.25 | 0.280 ± 0.011 | 4220 ± 24 | 12.6 ± 0.2 | <LOD | NA | 8461 ± 127 | 257 ± 1 | 81.5 ± 1.1 | 1.21 ± 0.01 | 29.8 ± 0.2 | 0.532 ± 0.001 |
| Ur R | 10.7 ± 0.2 | 0.074 ± 0.004 | 4305 ± 141 | 67.4 ± 0.7 | 1.49 ± 0.03 | NA | 2923 ± 142 | 38.2 ± 0.8 | 60.0 ± 3.0 | 0.285 ± 0.002 | 25.4 ± 0.8 | 0.162 ± 0.002 |
| Vo R | 3.79 ± 0.06 | 0.134 ± 0.003 | 3828 ± 50 | 159 ± 1 | 1.41 ± 0.08 | NA | 1852 ± 50 | 57.1 ± 0.5 | 12.3 ± 0.1 | 0.133 ± 0.001 | 27.2 ± 0.1 | 0.588 ± 0.004 |
Publisher’s Note: MDPI stays neutral with regard to jurisdictional claims in published maps and institutional affiliations. |
© 2022 by the authors. Licensee MDPI, Basel, Switzerland. This article is an open access article distributed under the terms and conditions of the Creative Commons Attribution (CC BY) license (https://creativecommons.org/licenses/by/4.0/).
Share and Cite
Godlewska, K.; Pacyga, P.; Szumny, A.; Szymczycha-Madeja, A.; Wełna, M.; Michalak, I. Methods for Rapid Screening of Biologically Active Compounds Present in Plant-Based Extracts. Molecules 2022, 27, 7094. https://doi.org/10.3390/molecules27207094
Godlewska K, Pacyga P, Szumny A, Szymczycha-Madeja A, Wełna M, Michalak I. Methods for Rapid Screening of Biologically Active Compounds Present in Plant-Based Extracts. Molecules. 2022; 27(20):7094. https://doi.org/10.3390/molecules27207094
Chicago/Turabian StyleGodlewska, Katarzyna, Paweł Pacyga, Antoni Szumny, Anna Szymczycha-Madeja, Maja Wełna, and Izabela Michalak. 2022. "Methods for Rapid Screening of Biologically Active Compounds Present in Plant-Based Extracts" Molecules 27, no. 20: 7094. https://doi.org/10.3390/molecules27207094