Article

AIE+ESIPT Active Hydroxybenzothiazole for Intracellular Detection of Cu2+: Anticancer and Anticounterfeiting Applications

1
Department of Chemistry, UGC Centre for Advanced Studies-II, Guru Nanak Dev University, Amritsar 143001, India
2
Department of Botanical and Environmental Sciences, Guru Nanak Dev University, Amritsar 143001, India
3
Apotex Inc., Toronto, ON M9L 1T9, Canada
*
Author to whom correspondence should be addressed.
Molecules 2022, 27(22), 7678; https://doi.org/10.3390/molecules27227678
Submission received: 30 September 2022 / Revised: 28 October 2022 / Accepted: 30 October 2022 / Published: 8 November 2022
(This article belongs to the Special Issue Functional Organic Molecules: Synthesis and Applications)

Abstract

:
Here, in the present work, a new hydroxybenzothiazole derivative (HBT 2) with AIE+ESIPT features was synthesized by Suzuki–Miyora coupling of HBT 1 with 4-formylphenylboronic acid. The AIE and ESIPT features were confirmed by optical, microscopic (AFM) and dynamic light scattering (DLS) techniques. The yellow fluorescent aggregates of HBT 2 can specifically detect Cu2+/Cu+ ions with limits of detection as low as 250 nM and 69 nM. The Job’s plot revealed the formation of a 1:1 complex. The Cu2+ complexation was further confirmed by optical, NMR, AFM and DLS techniques. HBT 2 was also used for the detection of Cu2+ ions in real water samples collected from different regions of Punjab. HBT 2 was successfully used for the bio-imaging of Cu2+ ions in live A549 and its anticancer activity was checked on different cancer cell lines, such as MG63, and HeLa, and normal cell lines such as L929. We successfully utilized HBT 2 to develop security labels for anticounterfeiting applications.

1. Introduction

The hydroxyphenyl benzothiazole (HBT) based derivatives have been extensively used in supramolecular chemistry as chemosensors for cations and anions, Refs. [1,2,3] for bioimaging, Refs. [4,5] in medicinal chemistry, Refs. [6,7] as photocatalysts and photosensitizers [8,9], for tracking enzymatic activity [10,11], in latent fingerprinting [12,13,14], easy synthesis [15,16], and for optoelectronic applications [17]. The main reason behind their potential application in various fields relies on their structure which exhibits ESIPT (excited state intramolecular charge transfer) or AIE (aggregation induced enhancement) and in some cases AIE+ESIPT characteristics. In the ESIPT process, lone pairs of electrons on nitrogen atoms, are involved in hydrogen bonding with hydroxyl groups on the phenyl ring [18,19]. AIE-based fluorophores remain non-fluorescent in the solution; however, they become AIE-active in the aggregated state either due to restriction in the rotation or through isolation from the bulk solvent system due to aggregation [20]. Normally, the ESIPT process is inhibited in polar protic solvents such as H2O, due to H-bonding. However, organic molecules constructively aggregate in aqueous media and the hydrophobic core allows the ESIPT process to occur. AIE-ESIPT properties of such molecules overcome the ACQ (aggregation caused quenching) phenomena and make it almost non-emissive in dilute solution but highly emissive in the aggregated state [21,22]. Recently, Goswami and coworkers reported benzimidazole-based ESIPT active fluorescent chemosensor for the detection of Cu2+ ions with LOD as low as 4.22 nM in 90% aqueous solution, in MCF-7 cells and plants [23]. Liang, Zhao and coworkers reported an AIE+ESIPT-based colorimetric Schiff base sensor for the detection of Cu2+ ions in aqueous medium [24]. Iyer and coworkers reported HBT based “turn-on” fluorometric probe for the detection of Cu2+ ions in aqueous medium, real water samples and for bioimaging Cu2+ in live cells [25]. However, the literature reports for the detection of Cu2+/Cu+ using HBT as a potential probe are rare in recent years. To address the problem related to HBT derivatives such as complicated synthesis, working in organic solvents and delayed response time, molecular probes for the selective detection of Cu2+ ions in aqueous medium with a lower detection limit are required.
Copper (Cu2+) is known as the third most abundant trace element in aerobic organisms and it is involved in many biological pathways [26,27,28,29,30]. Various fundamental physiological functions in the body utilize Cu2+ ions, such as in metalloenzymes, respiration, blood formation, transcriptional events, etc. However, the abrupt alteration of Cu2+ homeostasis in the body may cause Alzheimer’s disease, anaemia, hypoglycaemia, coronary heart failure, and Wilson’s disease, etc. [31,32,33]. The high level of Cu2+ ions is harmful to the human body so the concentration of Cu2+ ions in aerobic organisms is regulated at the level of cell, organ and body. The elevated levels of copper are also harmful to aquatic organisms [34]. Copper is also used in machinery, in transportation, and weapons and is an important constituent of white gold in the form of alloy. Various analytical techniques to determine Cu2+ in literature includes polarographic methods, iodometric titration, and chemiluminescence method [35,36,37,38]. Apart from these methods, fluorescence-based detection of Cu2+ ions have been extensively employed due to its simplicity, high sensitivity, selectivity, rapid response under mild conditions, low cost and potential benefits for a better and deeper understanding of physiological conditions [39,40,41,42].
In continuation of our interest to develop multifunctional chemosensors, recently our group has reported several chemosensors for Cu2+ ions and Cu2+-based ensembles for the detection of anions, and neutral species in aqueous media, and in live cells and demonstrated their application to develop solid and solution-based kits [43,44,45,46,47,48,49]. Herein, we have reported the synthesis, and characterization of a novel hydroxy benzothiazole (HBT 2) based fluorophore featuring ESIPT coupled AIE characteristics for the selective detection of Cu2+/Cu+ in aqueous media, real water samples and live cells. The AIE+ESIPT characteristics and Cu2+ complexation by HBT 2 have been supported by optical, NMR, DLS and AFM techniques. We also successfully demonstrated the anticounterfeiting and anticancer properties of HBT 2.

2. Experimental Section

2.1. Material and Methods

All reagent-grade chemicals and solvents were purchased from commercial sources and used without further purification. HPLC-grade ethanol and acetonitrile were used. The thin layer chromatography (TLC) was performed on aluminum sheets coated with silica gel 60 F254 (Merck, Darmstadt, Germany). Solvents such as chloroform, ethyl acetate and hexane or their mixture were used to run the TLC. The separation and purification of the products were performed by column chromatography (silica gel 60–120 mesh).

2.2. Characterization and Measurements

NMR spectra were recorded on a BRUKER Biospin AVANCE-III FT-NMR HD-500 and JEOL 400 MHz spectrometer operating at 500/400 MHz for 1H; 125/100 MHz for 13C NMR in CDCl3 as a solvent. The peak values were obtained as ppm (δ) and referenced to the TMS in 1H NMR and deuterated solvent in 13C NMR spectra. Chemical shift (δ) values were reported in ppm, coupling constant (J values) in hertz (Hz) and the abbreviations used for splitting patterns are s = singlet, d = doublet, dd = doublet of doublet, t = triplet, q = quartet, m = multiplet. High-resolution mass spectra (HRMS) were recorded with the BRUKER DALTONIK micrOTOFQ11 spectrometer. The Fourier transform infrared (FT-IR) spectra were recorded on the Perkin Elmer 92,035 instrument. The absorbance spectra were recorded on a Cary 5000 UV-VIS-NIR spectrophotometer equipped with a Peltier system to control the temperature. Absorbance spectra were recorded in quartz cells having an appropriate 1 cm path length, 2 nm bandwidth and 140 nm min−1 scan rate. Fluorescence spectra were recorded with the Shimadzu RF-6000 spectrofluorophotometer. Quartz glass cuvettes of 10 mm thickness were used for recording emission data. A Nano-ZS Malvern Instrument was employed for performing dynamic light scattering (DLS) analysis. AFM images were captured using Tosca 400 instrument made by Anton Paar under ambient conditions. Before DLS/AFM measurements each stock solution was pre-filtered through a Millipore membrane filter (Acrodisc syringe filter, 0.2 µm Supor membrane). Thermal gravimetric analysis was carried out on the HITACHI STA7200 instrument.

2.3. UV-Visible and Fluorescence Studies

The stock solution for the photophysical studies of HBT 2 (0.001 M) was prepared in CH3CN. HEPES buffer (0.1 M, pH 7.2) was prepared using deionized water. A stock solution was diluted using CH3CN and HEPES buffer for the photophysical measurements. Further, stock solutions of analytes (0.1 M) were prepared and diluted in deionized water. For determining the binding constant and stoichiometry of the Cu2+ complex, the Benesi–Hildebrand equation, Job plot and SPECFIT 32 software were used.

2.4. Sample Preparation for Cu2+ Analysis in Real Samples

We collected real water samples from different locations in Punjab and these water samples were used to make the HEPES buffer solution. The solution of Cu2+ ions was also prepared in these water samples. HBT 2 (0.5 µM) in HEPES buffer–CH3CN (9:1, v/v pH 7.2) solution was taken in a cuvette and then Cu2+ ions were added to simulate a polluted water sample. Then, a recovery experiment was performed on the Cu2+ spiked samples. All of the experiments were conducted in triplicate. The fluorescence intensities of these real samples were recorded and compared with standard calibration curves.

2.5. Anticancer Studies (MTT Assay)

The cytotoxic potential of HBT 2 towards HeLa, MG63 and L929 cell lines was determined using an MTT assay. The cells were cultured at the standard density of 8 × 10³ cells/well in 96 well microplates in 100 μL of DMEM medium. These cultured cells were then incubated for 24 h to allow the adherence of cells. After incubation for 24 h, cells were treated with various concentrations of HBT 2. On completion of another 12 h, we added 20 µL of 3-(4,5-dimethylthiazol-2-yl)-2,5-diphenyltetrazolium bromide (MTT) dye solution in each well and incubation was continued for an additional 2 h for measuring the ability of viable cells to reduce it into purple coloured formazan. Subsequently, we removed the supernatant MTT solution and then added 100 µL of dimethyl sulphoxide (DMSO) to dissolve the intracellular insoluble, purple-coloured formazan. Then absorbance was taken at 310 nm using a multi-well plate reader (BioTek Synergy HT, BioTek, Winooski, VT, USA).
Cell viability = (Absorbance of treated sample/Absorbance of untreated control) × 100
The growth inhibition percentage was expressed by using the following equation
% Growth inhibition = 100% viability.

2.6. The Cell Imaging

A549 cells were incubated in an in vitro incubator under 5% humidified CO2 at 37 °C in DMEM containing 10% fetal bovine serum and antibiotic antimycotic solution. Later on, the DMEM was removed from culture plates and a trypsin solution was added followed by washing the culture palates 2–3 times with phosphate buffer saline (PBS). The cells were divided into four groups (i) blank containing A549 cells only; (ii) blank containing derivative HBT 2 (1 µM) only in 99% PBS buffer (1% CH3CN); (iii) HBT 2 (1 µM) + Cu2+ ions (10 equivalents); and (iv) HBT 2 (1 µM) + Cu2+ ions (20 equivalents). All the cells were incubated in triplicates and Cu2+ treated wells were incubated for 30 min. After washing three times with PBS, the fluorescence images were captured under a fluorescence microscope.

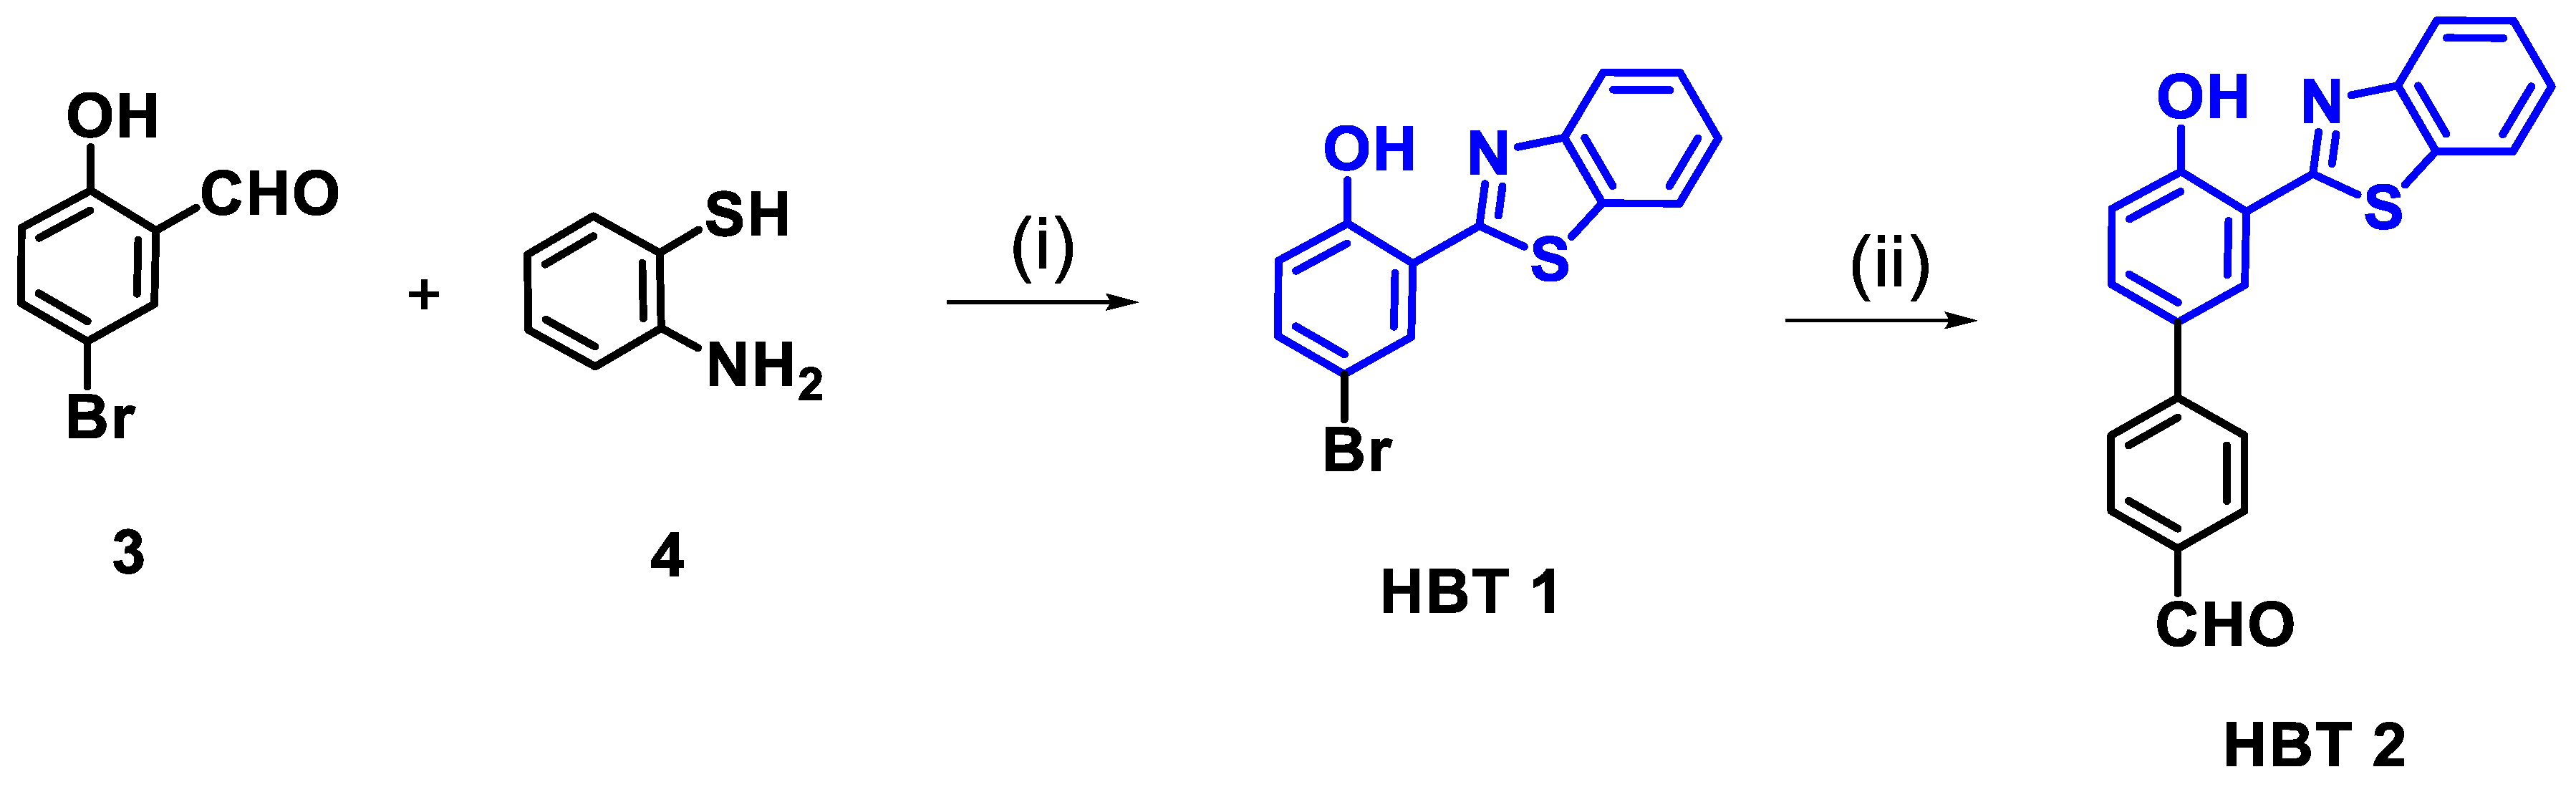
2.7. Synthesis of Derivative HBT 1

To the solution of 5-bromo salicylaldehyde (1.0 g, 4.9 mmol) and 2-aminothiophenol (0.62 g, 4.97 mmol) in ethanol (10 mL), 10 µL of H2O2 (30% v/v) and 20 µL HCl (2N) were added. The mixture was stirred for 2–3 h at 70–80 °C. The progress of the reaction was checked by TLC. After completion of the reaction, the mixture was cooled to room temperature and precipitates were filtered and washed with ethanol to afford compound HBT 1 as a yellow solid, (1.3 g, 85.5%). Rf = 0.35 (Hexane: CHCl3, 70: 30, v/v); 1H NMR (500 MHz, CDCl3, 25 °C) δ 12.55 (s, 1H), 8.00 (d, J = 8.1 Hz, 1H), 7.93 (d, J = 8.0 Hz, 1H), 7.79 (d, J = 2.4 Hz, 1H), 7.57–7.50 (m, 1H), 7.47–7.42 (m, 2H), 7.00 (d, J = 8.8 Hz, 1H) ppm; 13C NMR (125 MHz, CDCl3, 25 °C) δ 167.80, 157.04, 151.66, 135.34, 132.63, 130.50, 126.95, 125.97, 122.39, 121.65, 119.83, 118.36, 111.04 ppm; IR (ATR):ν (in cm−1) = 3056.4, 2952.1, 2773.1, 2109.7, 1997.9, 1878.6, 1781.7, 1572.9, 1476, 1267.3, 1088.4, 976.6, 872.2, 775.3, 626.2, 514.4, 454.7.

2.8. Synthesis of Derivative HBT 2

To a solution of HBT 1 (1.0 g, 3.27 mmol) in toluene (10 mL), Pd(PPh3)4 (0.566 g, 0.48 mmol) was added under a N2 stream. Subsequently, 4-formylphenylboronic acid (0.588 g, 3.9 mmol) and Na2CO3 (0.699 mg, 6.5 mmol) dissolved in ethanol:water (1:1) was added to the reaction mixture and stirred at 80℃ for 4–5 h. The solvent was evaporated under a rotary evaporator and water was added. The progress of the reaction was checked by TLC. The residue was extracted with CHCl3. The CHCl3 layers were dried over sodium sulfate and solvent was rotary evaporated. The crude mixture was column chromatographed on SiO2 using CHCl3: Hexane (70:30) as eluent to afford HBT 2 as pale-yellow solid (880 mg, 80.8%); Rf = 0.77 (CHCl3); 1H NMR (500 MHz, CDCl3) δ 12.73 (s, 1H), 10.07 (s, 1H), 8.02 (d, J = 8.1 Hz, 1H), 7.98 (d, J = 8.2 Hz, 2H), 7.95–7.91 (m, 2H), 7.76 (d, J = 8.2 Hz, 2H), 7.67 (dd, J1 = 8.6, J2 = 2.1 Hz, 1H), 7.54 (t, J = 7.7 Hz, 1H), 7.44 (t, J = 7.6 Hz, 1H), 7.22 (d, J = 8.6 Hz, 1H) ppm; 13C NMR (125 MHz, CDCl3) δ 191.84, 168.88, 158.42, 151.75, 145.98, 134.99, 132.58, 131.67, 131.23, 130.46, 127.12, 127.06, 126.93, 125.87, 122.34, 121.64, 118.74, 117.21, ppm; FTIR (ATR):ν (in cm−1) = 3705, 2981.9, 2832.8, 2743.3, 2363.1, 2117.1, 1923.3, 1692.2, 1483.5, 1386.6, 1304.6, 1170.4, 820.0, 745.5, 492.0; HRMS: calcd: 332.0701, found: 332.0738.

3. Results and Discussion

3.1. Synthetic Design

HBT 2 containing benzothiazole at the 2-position and 4-formyl phenyl at the 4-position of the phenol ring was synthesized in two steps. In the first step, compound HBT 1 was synthesized by condensation (Schiff-base) reaction between 5-bromosalicylaldehyde (3) and 2-aminothiophenol (4) in ethanol at 70 °C, followed by in-situ intramolecular cyclization reaction catalyzed by the H2O2/HCl mixture. In the second step, a Suzuki–Miyora coupling reaction between 4-formylphenylboronic acid and HBT 1 in toluene afforded HBT 2 at a 80% yield (Scheme 1) [46]. The characterization of compounds HBT 1, and HBT 2 was accomplished with 1H, 13C NMR, IR and high-resolution mass spectrometry (HRMS) techniques (Figures S1 and S2 from Supplementary Materials). The observance of 1H NMR signals at 10.07 ppm (s, -CHO) and 12.73 ppm (s, -OH), along with other aromatic proton signals in the range δ = 8.02–7.22 ppm confirmed the structure of HBT 2. HRMS data showed a mass peak at m/z 332.0738 (M+H)+. The fluorescence spectrum of HBT 2 showed an emission maximum located at 550 nm in the solution or solid state. Thermogravimetric analysis (TGA) of HBT 2 showed stability up to 280 °C and then a drastic mass loss of 85% occurred up to 400 °C (Figure S3 from Supplementary Materials). On the other hand, HBT 1 is stable only up to 200 °C and complete mass loss (78%) occurred at 280 °C (Figure S4 from Supplementary Materials).

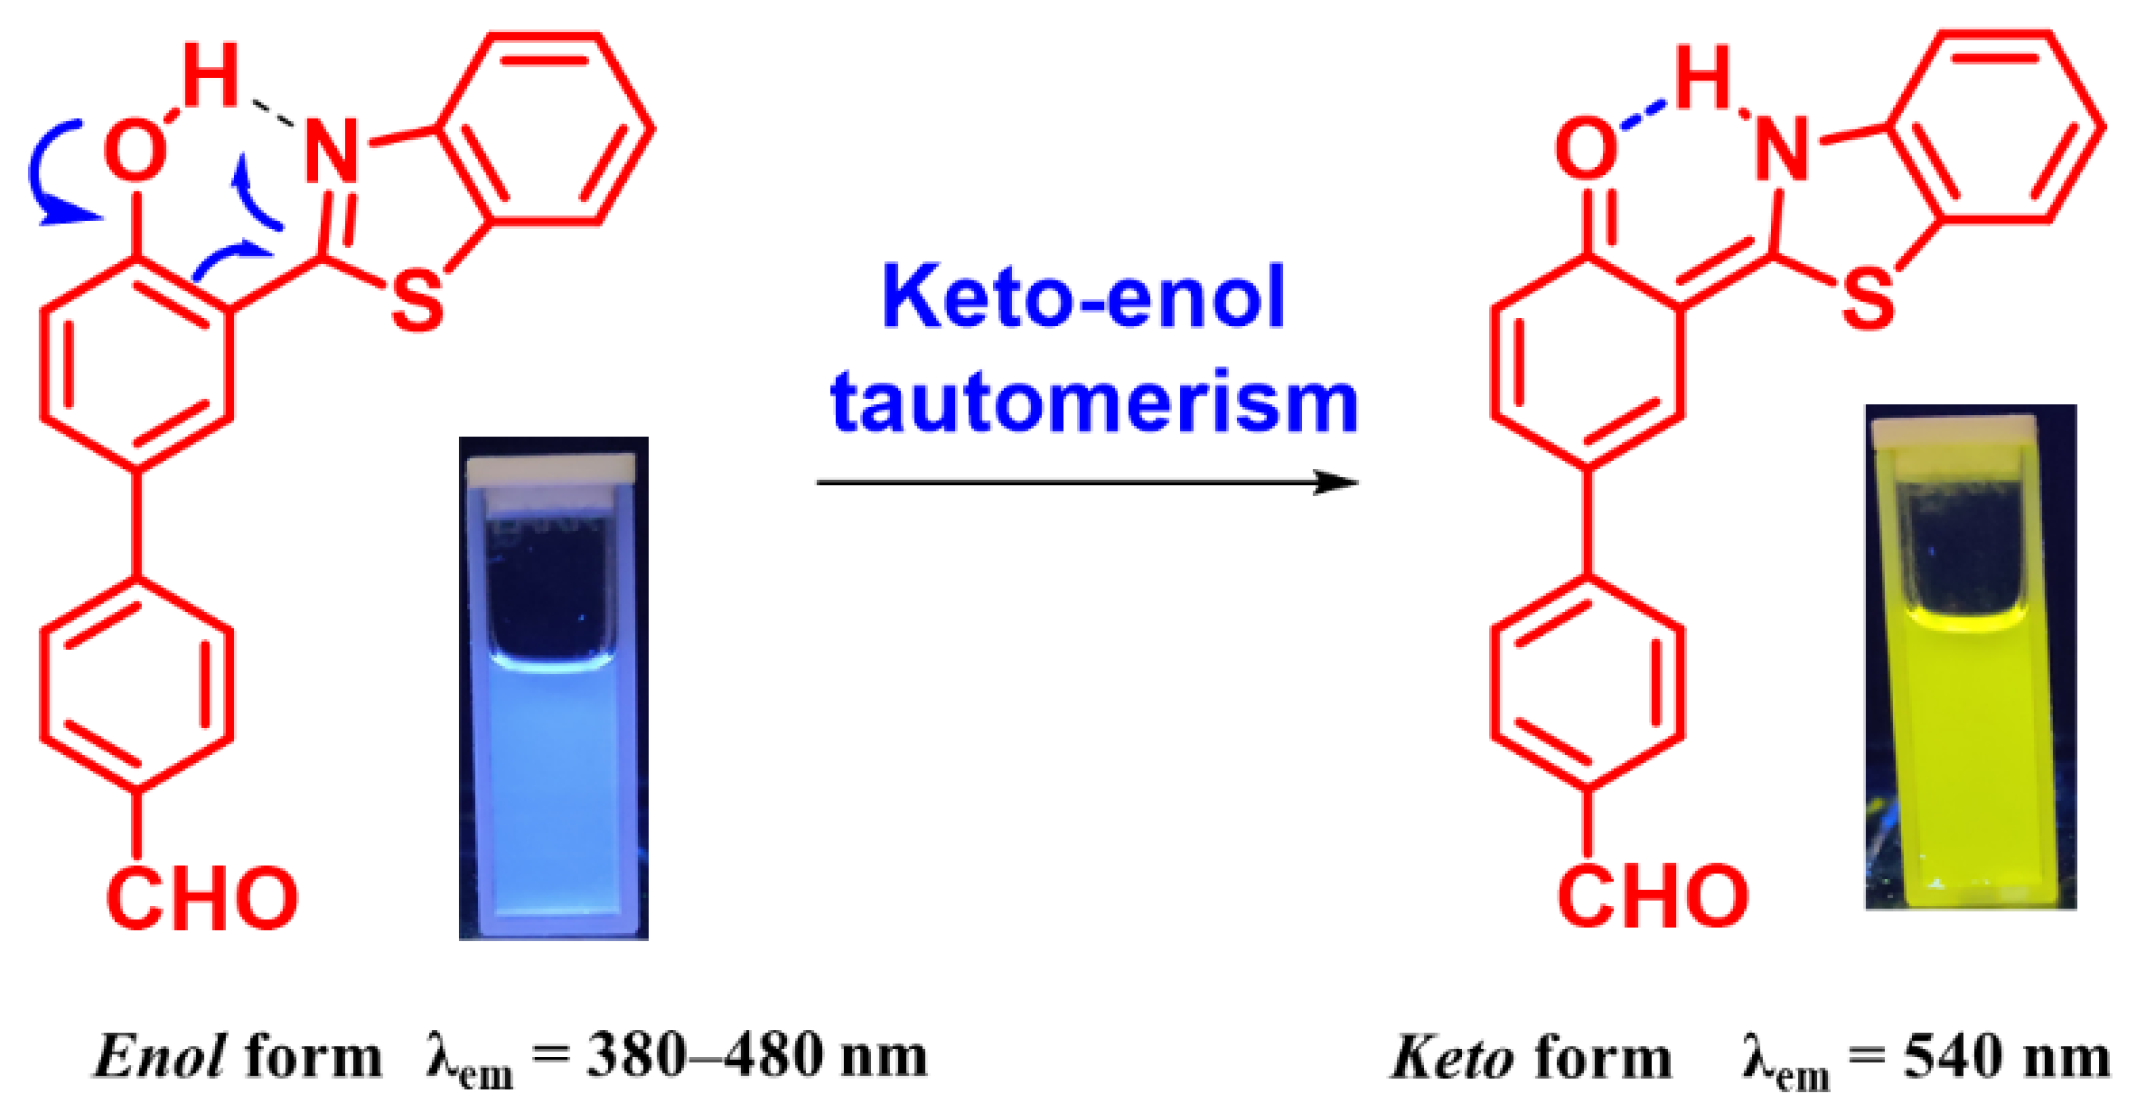
3.2. Photophysical Studies to Support AIE+ESIPT Features in HBT 2

In the literature, the aggregation induced emission (AIE) process is normally associated with a restriction in intramolecular rotation (RIR) in a solid state or in an aggregated state [19]; however, many reports are available where the occurrence of an excited state intramolecular proton transfer (ESIPT) process in an aggregated state results in an enhancement in emission intensity commonly known as ESIPT coupled AIE [20]. In HBT 2, there is a possibility of ESIPT and AIE process. The ESIPT process was first validated by recording the absorbance and emission spectra of HBT 2 (10 µM) in solvents of different polarities (Figure 1). In non-polar solvents, HBT 2 showed absorption bands at 295, and 310 nm and the shoulder band at 340 nm, whereas in polar solvents the appearance of an additional band between 390 and 460 nm was also observed. This additional red-shifted band in polar solvents could be attributed to either a hydrogen bond cluster or due to the formation of an anion via deprotonation of the -OH group (Figure 1c). Similarly, the emission spectra of HBT 2 in non-polar solvents such as CHCl3, DCM and THF showed an emission band at 540 nm (λex = 360 nm), but in polar (protic) solvents a new band in the range of 380–480 nm was observed. This emission band at 380–480 nm could be attributed to the enol form while the bathochromically shifted emission band at 540 nm could be attributed to keto form arising due to the ESIPT process in HBT 2. The color of the HBT 2 solution in polar solvents is blue and in non-polar solvents, it is yellow, which is in good agreement with the assumption of the existence of enol-tautomer in polar solvents, and keto-tautomer in non-polar solvents (Figure 1a and Figure 2).
The rationalization of the enolketo equilibrium in HBT 2, was also performed using a B3LYP/6-31G set in Gaussian 09 software. Analysis of the optimized structures shows that the HOMO and LUMO of keto-form are more stable than the enol-form by −0.53 and −0.24 eV. Time-dependent density functional theory revealed that the lowest energy absorption transitions correspond to 340 nm (Figure S5 from Supplementary Materials).
To validate the existence of AIE in HBT 2, we have recorded the optical spectra of HBT 2 in different binary aqueous mixtures where we have continuously varied the fraction of water (bad solvent) in CH3CN (good solvent) (Figure 3). In CH3CN, HBT 2 (0.5 μM) exhibits a very weak broad emission band between 500 and 600 nm. Upon incremental addition of the water fraction from 0–70%, no change in the emission spectrum was observed and the fluorescence remained low [φf = 0.022, measured against quinine sulfate (φf = 0.54) as standard solution in H2SO4]. When the fraction of water was further increased from >70–100% in CH3CN, a drastic boost in fluorescence intensity (~30 times) at 550 nm was observed (φf = 0.096) due to the formation of fluorescent nanoaggregates. The colorless solution of HBT 2 in ˂70% H2O–CH3CN mixture indicates the existence of HBT 2 in a non-aggregated state, whereas the observance of bright greenish-yellow-colored nanoaggregates in 70–99% water indicates the existence of HBT 2 in the aggregated state (Figure 3a,c).
Similarly, UV-vis spectra of HBT 2 in CH3CN and H2O–CH3CN (0–100%) mixture were also recorded. HBT 2 showed an absorbance band at 295 nm. In addition to 0–80% water in CH3CN, it showed a decrease in the molar absorptivity of the absorbance band at 295 nm. However, on further addition of water fraction (>80%) in CH3CN, the absorption spectra broadened and the molar absorptivity of the absorbance band increased (Figure S6 from Supplementary Materials). These spectroscopic changes are associated with the AIE+ESIPT mechanism and the explanation is as follows. In the 50% H2O–CH3CN mixture, the -OH group remains H-bonded with water molecules (protic solvent). As the water fraction increases, HBT 2 starts organizing itself to make supramolecular nanoaggregates. In an aggregated state, the access of water molecules decreases and ESIPT becomes operative in the aggregated state of HBT 2 and fluorescence at 550 nm increases.

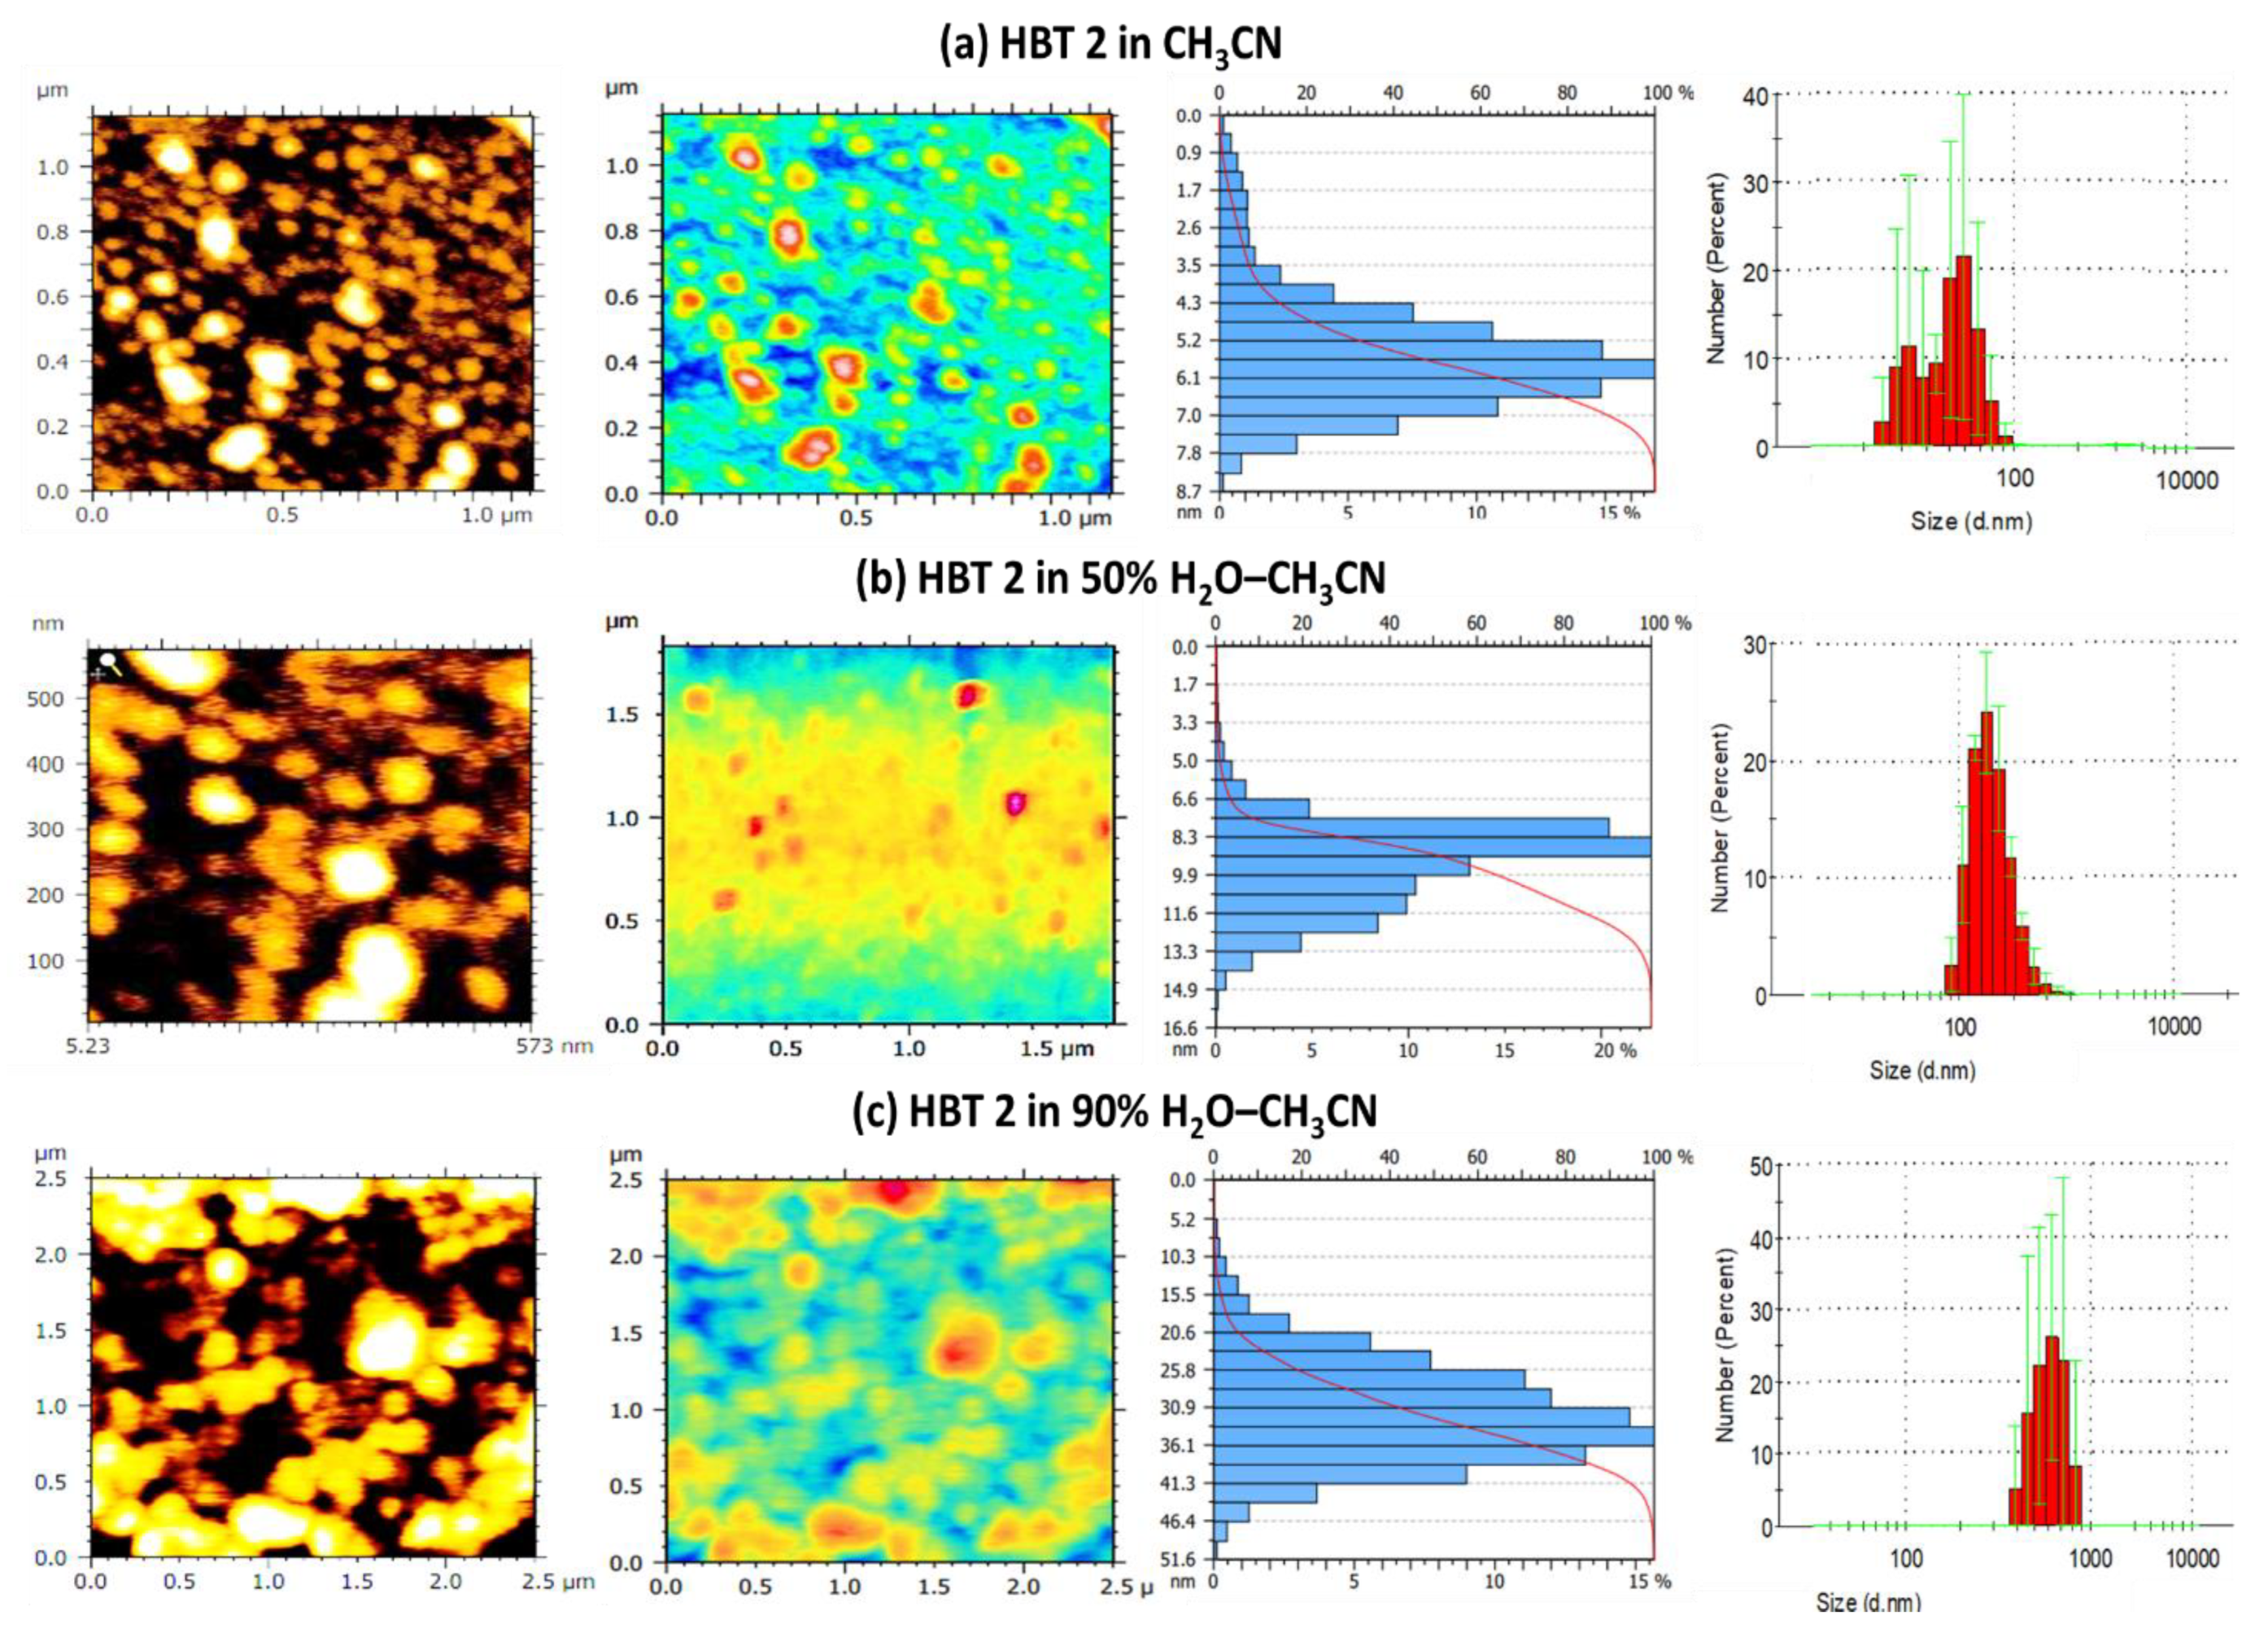
3.3. Validation of Aggregation in HBT 2 Using AFM and DLS Techniques

To shed more insight on the aggregation process and morphology of the aggregates of HBT 2 upon the addition of H2O to CH3CN, we have performed atomic force microscopic (AFM) imaging of HBT 2 in pure CH3CN, 50% HEPES buffer–CH3CN and 90% HEPES buffer–CH3CN solution. The AFM micrographs of HBT 2 (1 µM) in CH3CN showed spherical aggregates of the size of 0.9–7.8 nm uniformly distributed all over the surface. However, the size of the aggregates of HBT 2 increased to 1.7–14.9 nm in 50% H2O–CH3CN solution. On the other hand, in the 90% H2O–CH3CN solution, the size of the aggregates of HBT 2 increased to 10.3–47.4 nm. Interestingly, the morphology of the aggregates of HBT 2 in CH3CN, 50% HEPES buffer–CH3CN and 90% HEPES buffer–CH3CN remains spherical in nature and no change in morphology of these aggregates was observed as we move from CH3CN to 90% HEPES buffer–CH3CN solution (Figure 4a–c).
We further confirmed this aggregation process by performing dynamic light scattering (DLS) analysis. The hydrodynamic diameter of aggregates of HBT 2 (0.5 µM) in the CH3CN (where it exists as a molecularly dissolved state) was 92.6 nm (polydispersity index = 0.66). In a 1:1 (CH3CN: HEPES buffer) solution, the size of the aggregates was increased to 330.7 nm (polydispersity index = 0.63), which further increased to 615.5 nm (polydispersity index = 0.639) in 9:1 (HEPES buffer: CH3CN) solution (Figure 4a–c). This increase in the size of the aggregates of HBT 2 could be attributed to the aggregation process upon the gradual addition of water. Moreover, the high value of the polydispersity index (˃0.6) indicates the presence of aggregates of different sizes in the solution.

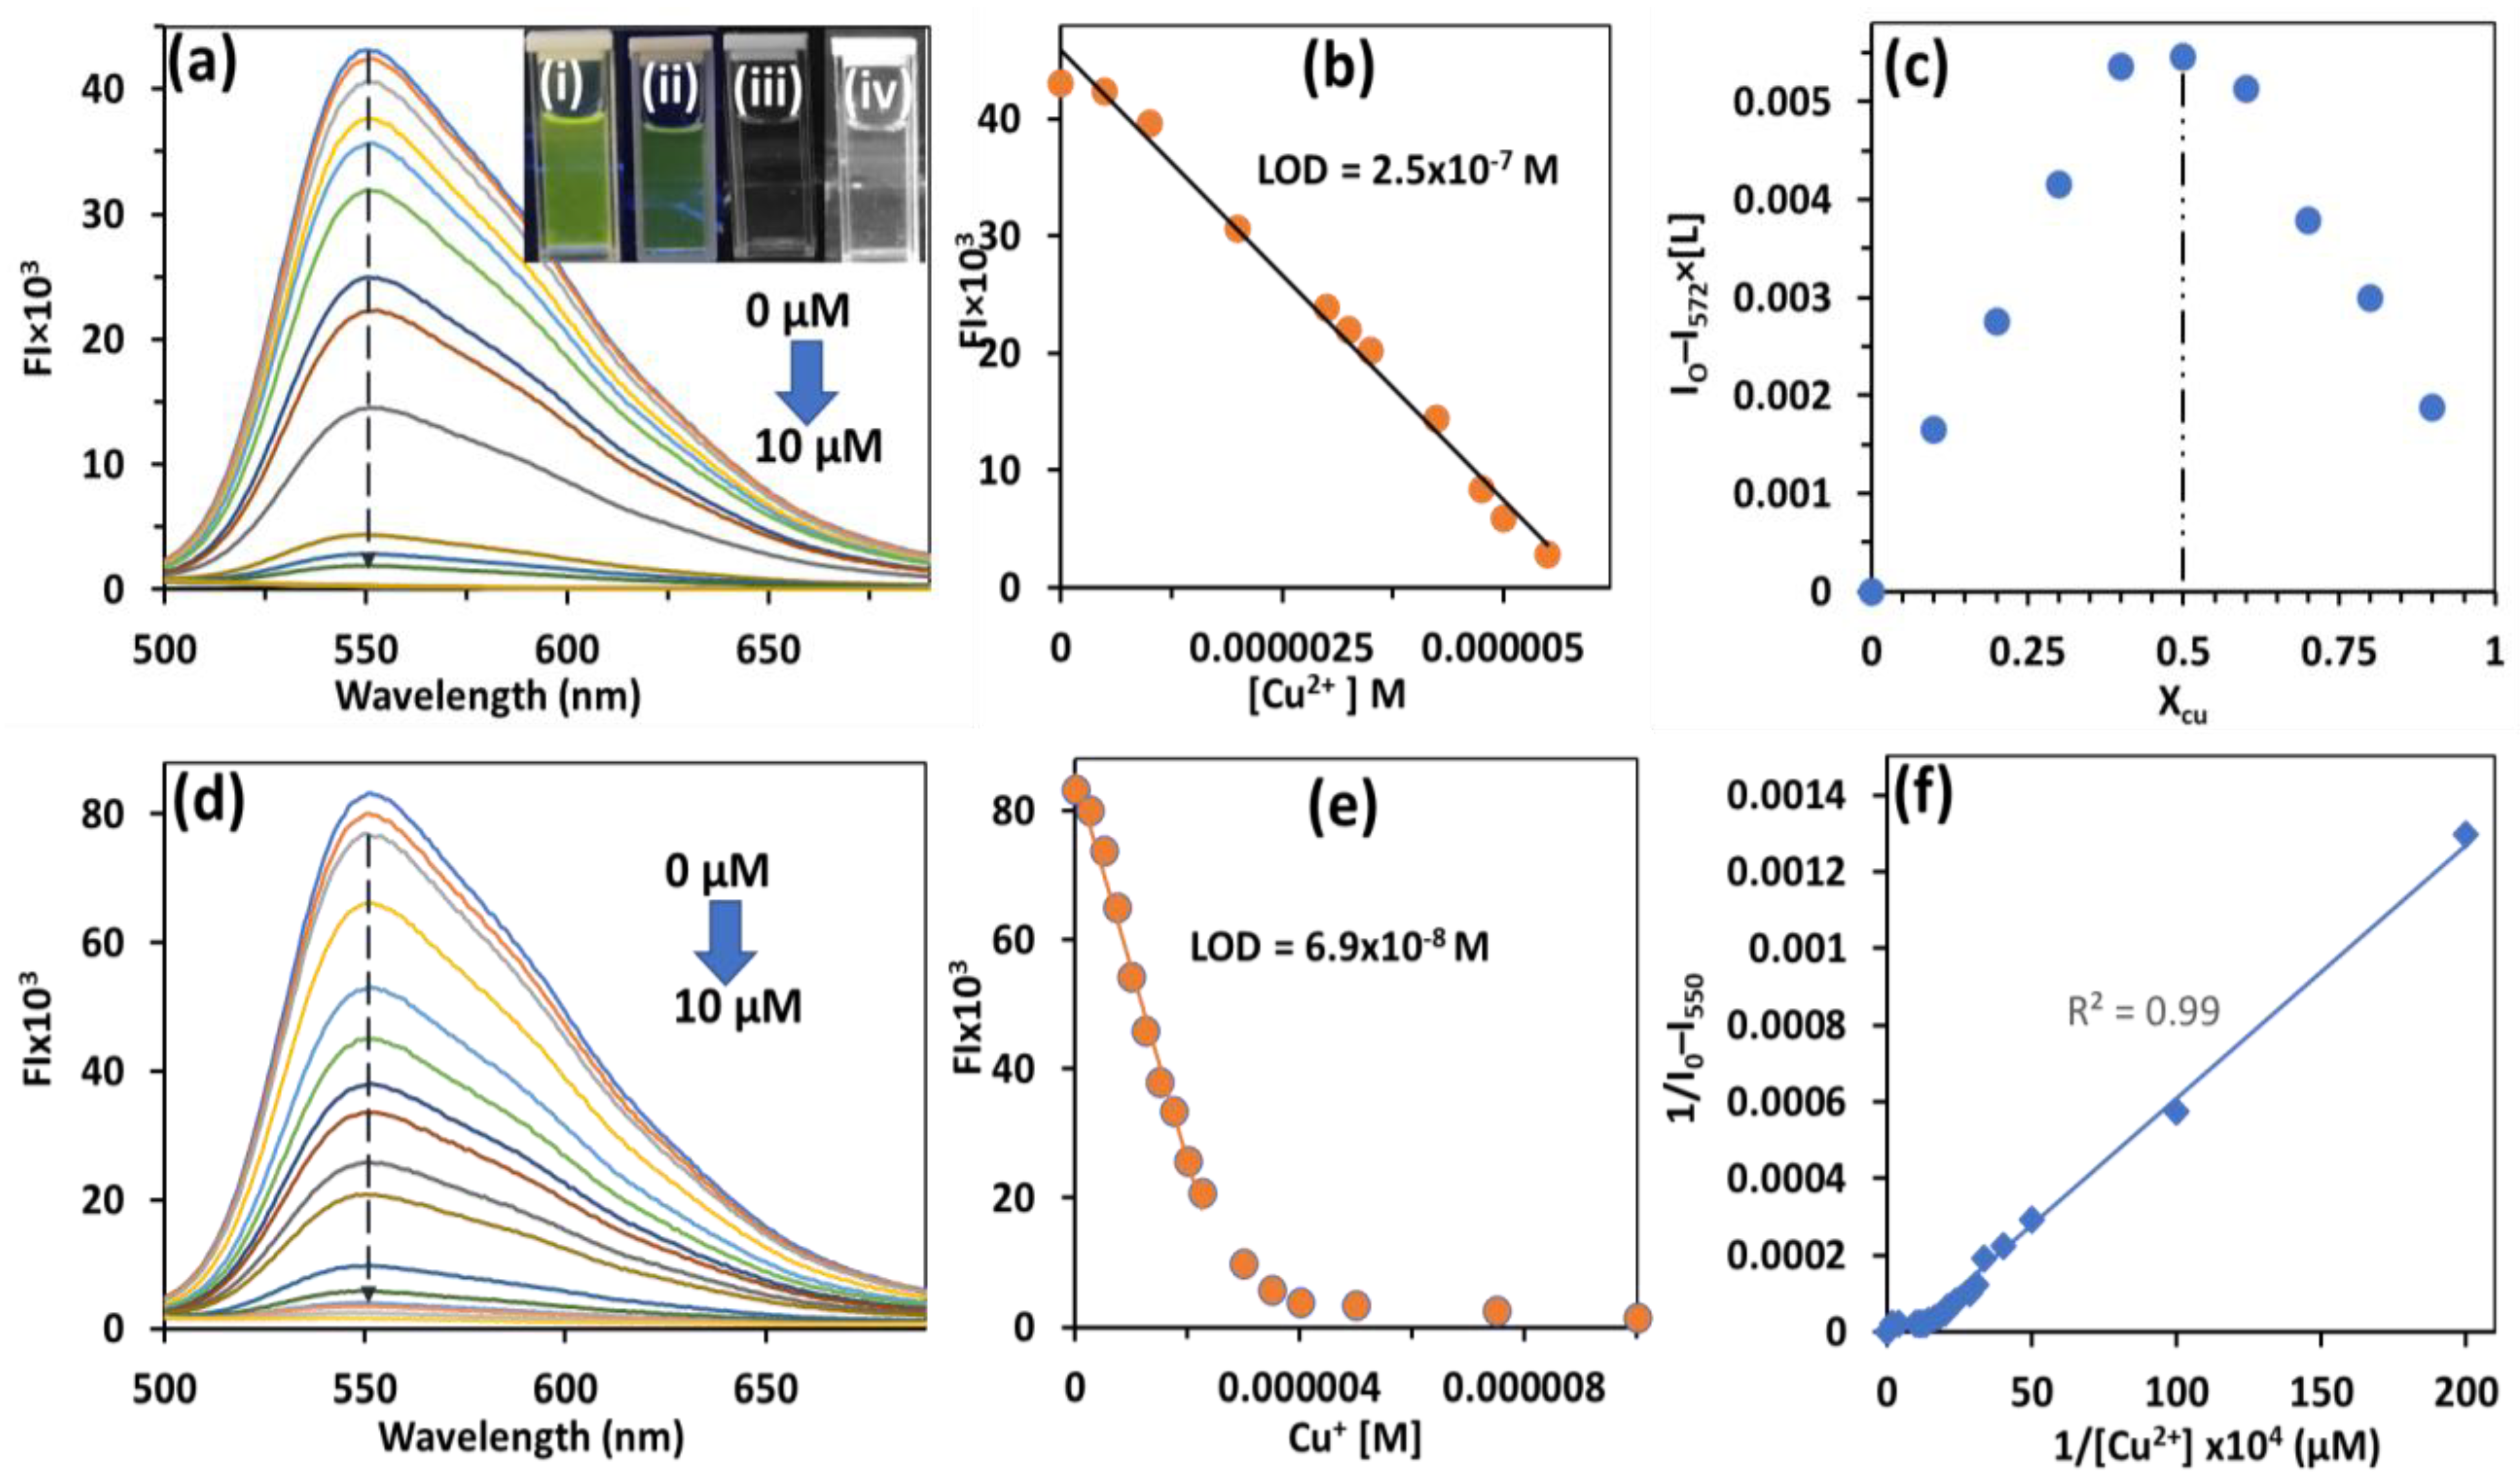
3.4. Application of HBT 2 for Detection of Cu2+/Cu+ Ions

We expect that different metal ions may interact with the hydroxy (-OH) group and nitrogen (N) atoms of HBT 2 and the complexation of HBT 2 with metal ions may inhibit or reverse the AIE+ESIPT phenomena. So, we recorded the optical response of HBT 2 in the presence of various metal ions such as Li+, Na+, NH4+, K+, Zn2+, Co2+, Ni2+, Pb2+, Fe2+, Fe3+, Ba2+ Cu+ and Cu2+ in 9:1 (HEPES buffer:CH3CN, pH 7.2, v/v) solution. The HBT 2 showed strong quenching of fluorescence in the presence of Cu+ and Cu2+ ions only, while the other competing metal ions did not show any interference (Figure S7 from Supplementary Materials). As shown in Figure S7 from Supplementary Materials, HBT 2 showed a response only towards Cu+ and Cu2+ ions, so next, we performed fluorescence titration with Cu2+/Cu+ ions.
Upon addition of 0–20 equivalents of Cu2+ and Cu+ ions, the emission spectrum of HBT 2 showed a regular decrease in fluorescence at 520 nm with concomitant fluorescence color change from bright yellow to colorless (Figure 5a,d). On further addition of Cu2+ and Cu+ ions (˃20 equivalents), no change in the fluorescence spectrum was observed and the plateau was achieved. It may be noted that plateau was achieved at lower concentrations for Cu+ (six equivalents) ions compared to Cu2+ (10 equivalents) ions. This decrease in fluorescence could be attributed to the complexation of Cu+ or Cu2+ ions with oxygen and nitrogen atoms of HBT 2 which results in the inhibition of the ESIPT process and fluorescence quenching was observed. Alternatively, the binding of Cu2+ or Cu+ ions with HBT 2 may disturb the aggregation of HBT 2 and consequently, the inhibition of AIE could lead to quenching of the fluorescence. The lowest limit of detection was found to be 69 nM (R2 = 0.99) and 250 nM (R2 = 0.99) for Cu+ and Cu2+, respectively (Figure 5b,e). The Job’s plot between HBT 2 and Cu2+ ions showed 1:1 binding stoichiometry (Figure 5c). The Benesi–Hildebrand (B-H) plot was used to find the binding constant of complexation between HBT 2 and Cu2+ ions and it was found to be 7.14 × 10⁴ M−1 (Figure 5f). The non-linear regression curve fitting analysis using SPECFIT programmer revealed 1:1 stoichiometry with a binding constant of log β = 5.829 (for Cu+) and log β = 5.454 (for Cu2+). The absorbance spectrum of HBT 2 did not show any variation upon the addition of Cu2+ ions in a 90% H2O–CH3CN mixture.
To develop metal–complex based displacement assay for the ‘turn-on’ detection of anions, we added different anions such as I, Br, CN, ClO4, ATP, AMP, ADP, UTP, UDP, UMP, GMP, CMP, S2O4, SCN, HSO4, HSO3, NO3, F, H2S and P2O4 to the solution of HBT 2-Cu2+ complex in 90% HEPES buffer–CH3CN, pH 7.2 solution. However, upon the addition of these anions even at higher concentrations (50 equivalents) to the HBT 2–Cu2+ complex, insignificant change was observed (Figure S8 from Supplementary Materials). This could be ascribed to the fact that the complexation of Cu2+ ion with HBT 2 is strong and the anion may not be able to sequester it from the binding site of HBT 2.

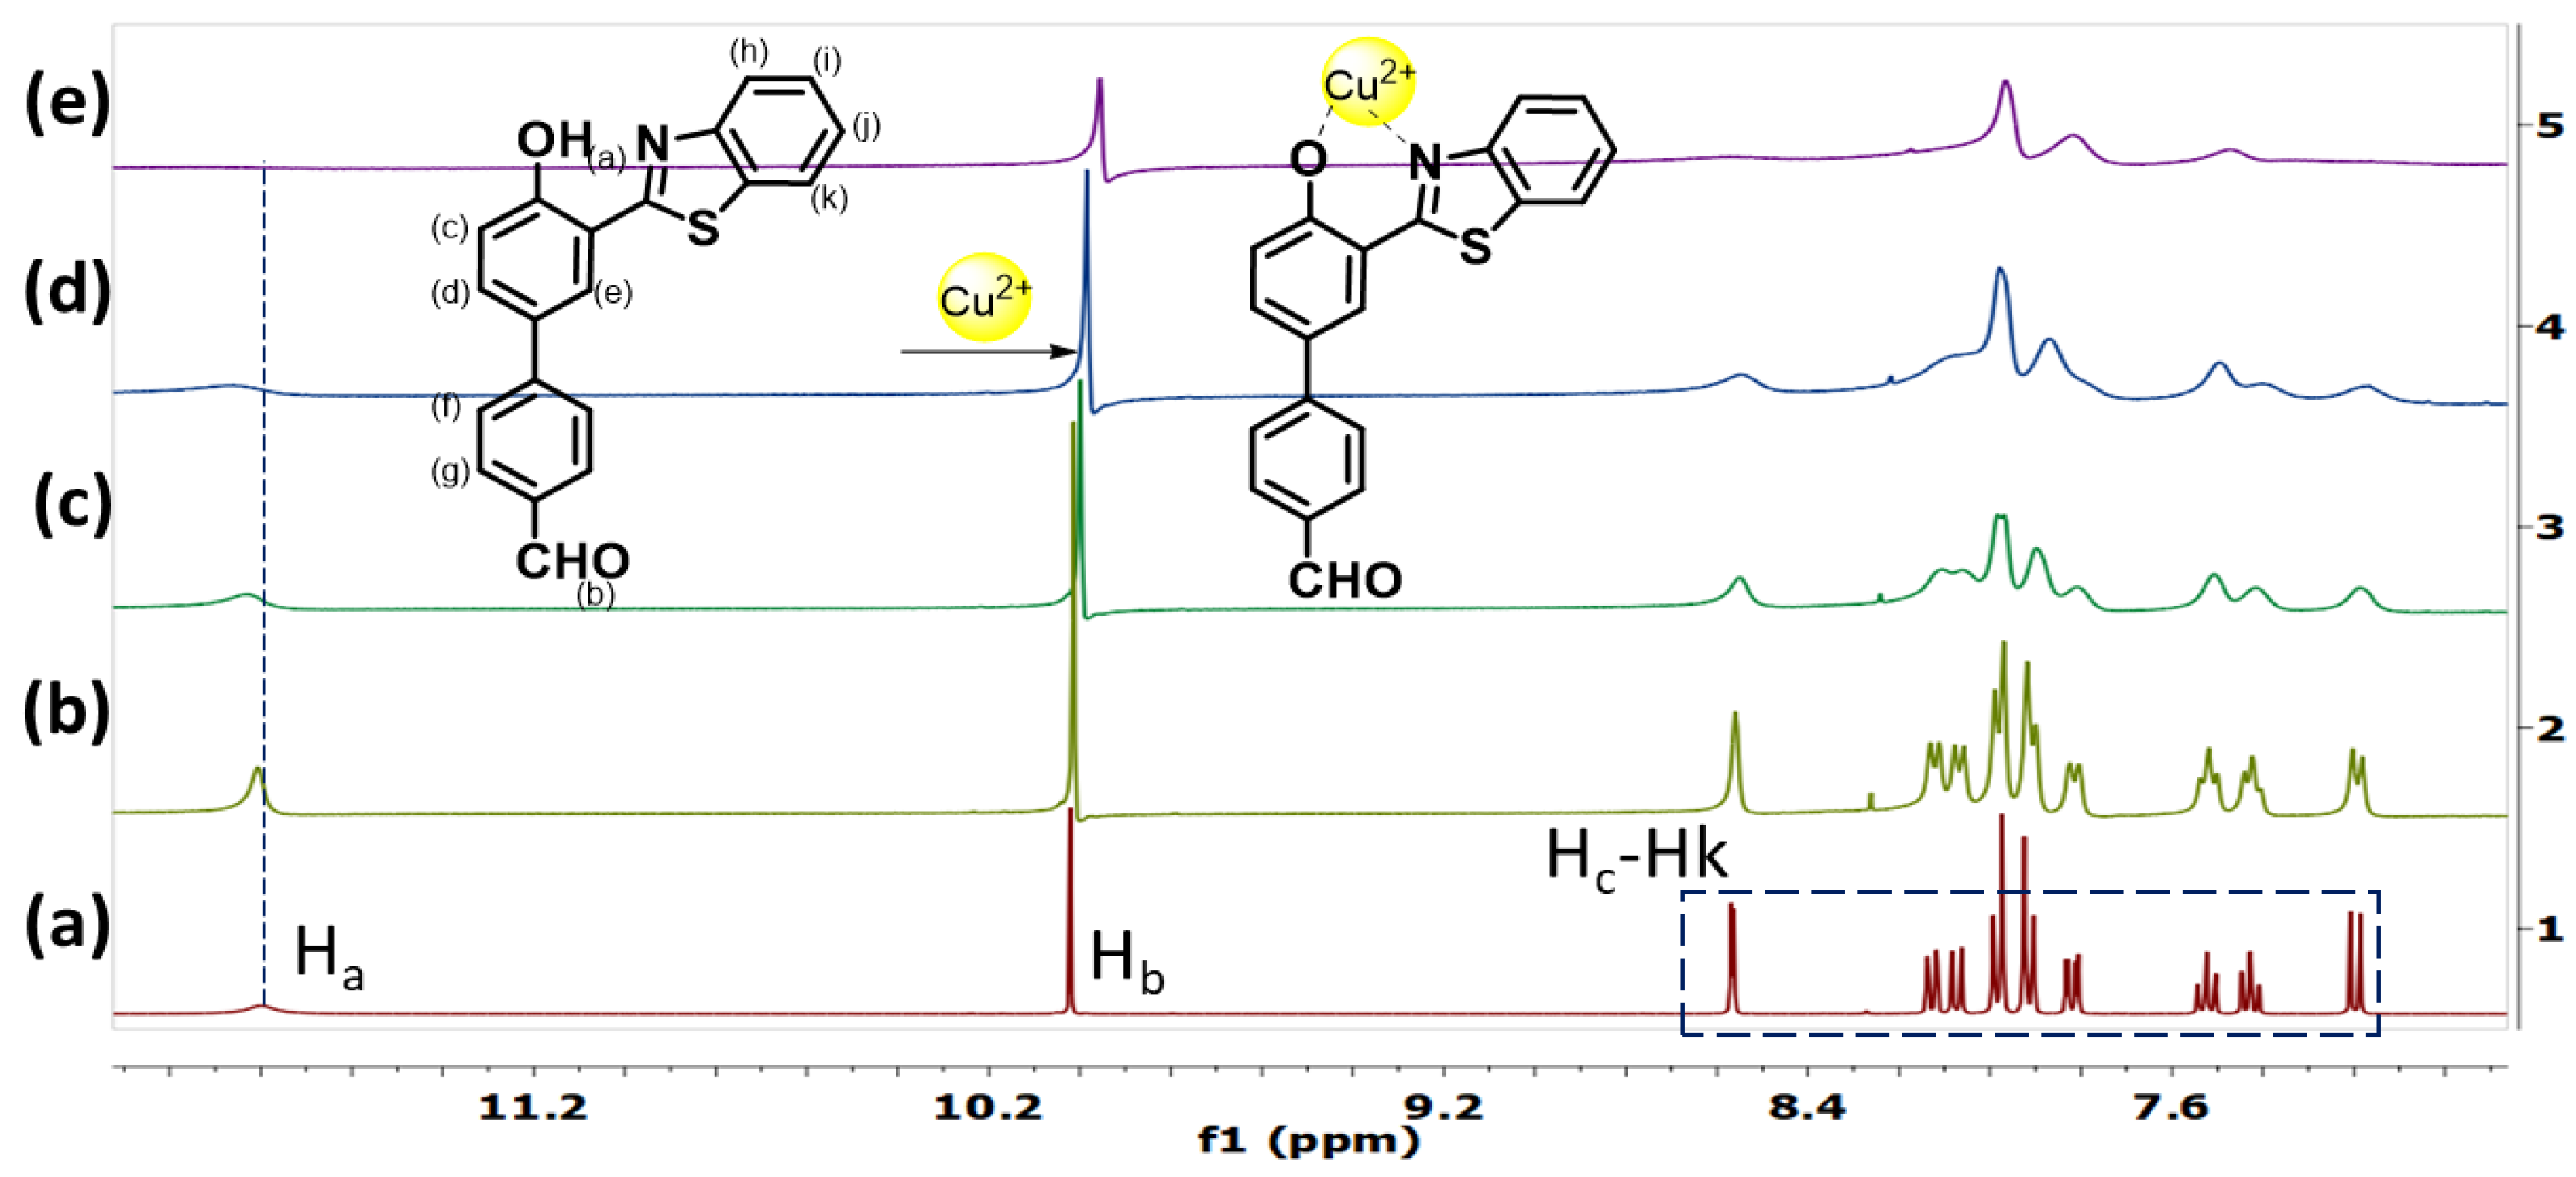
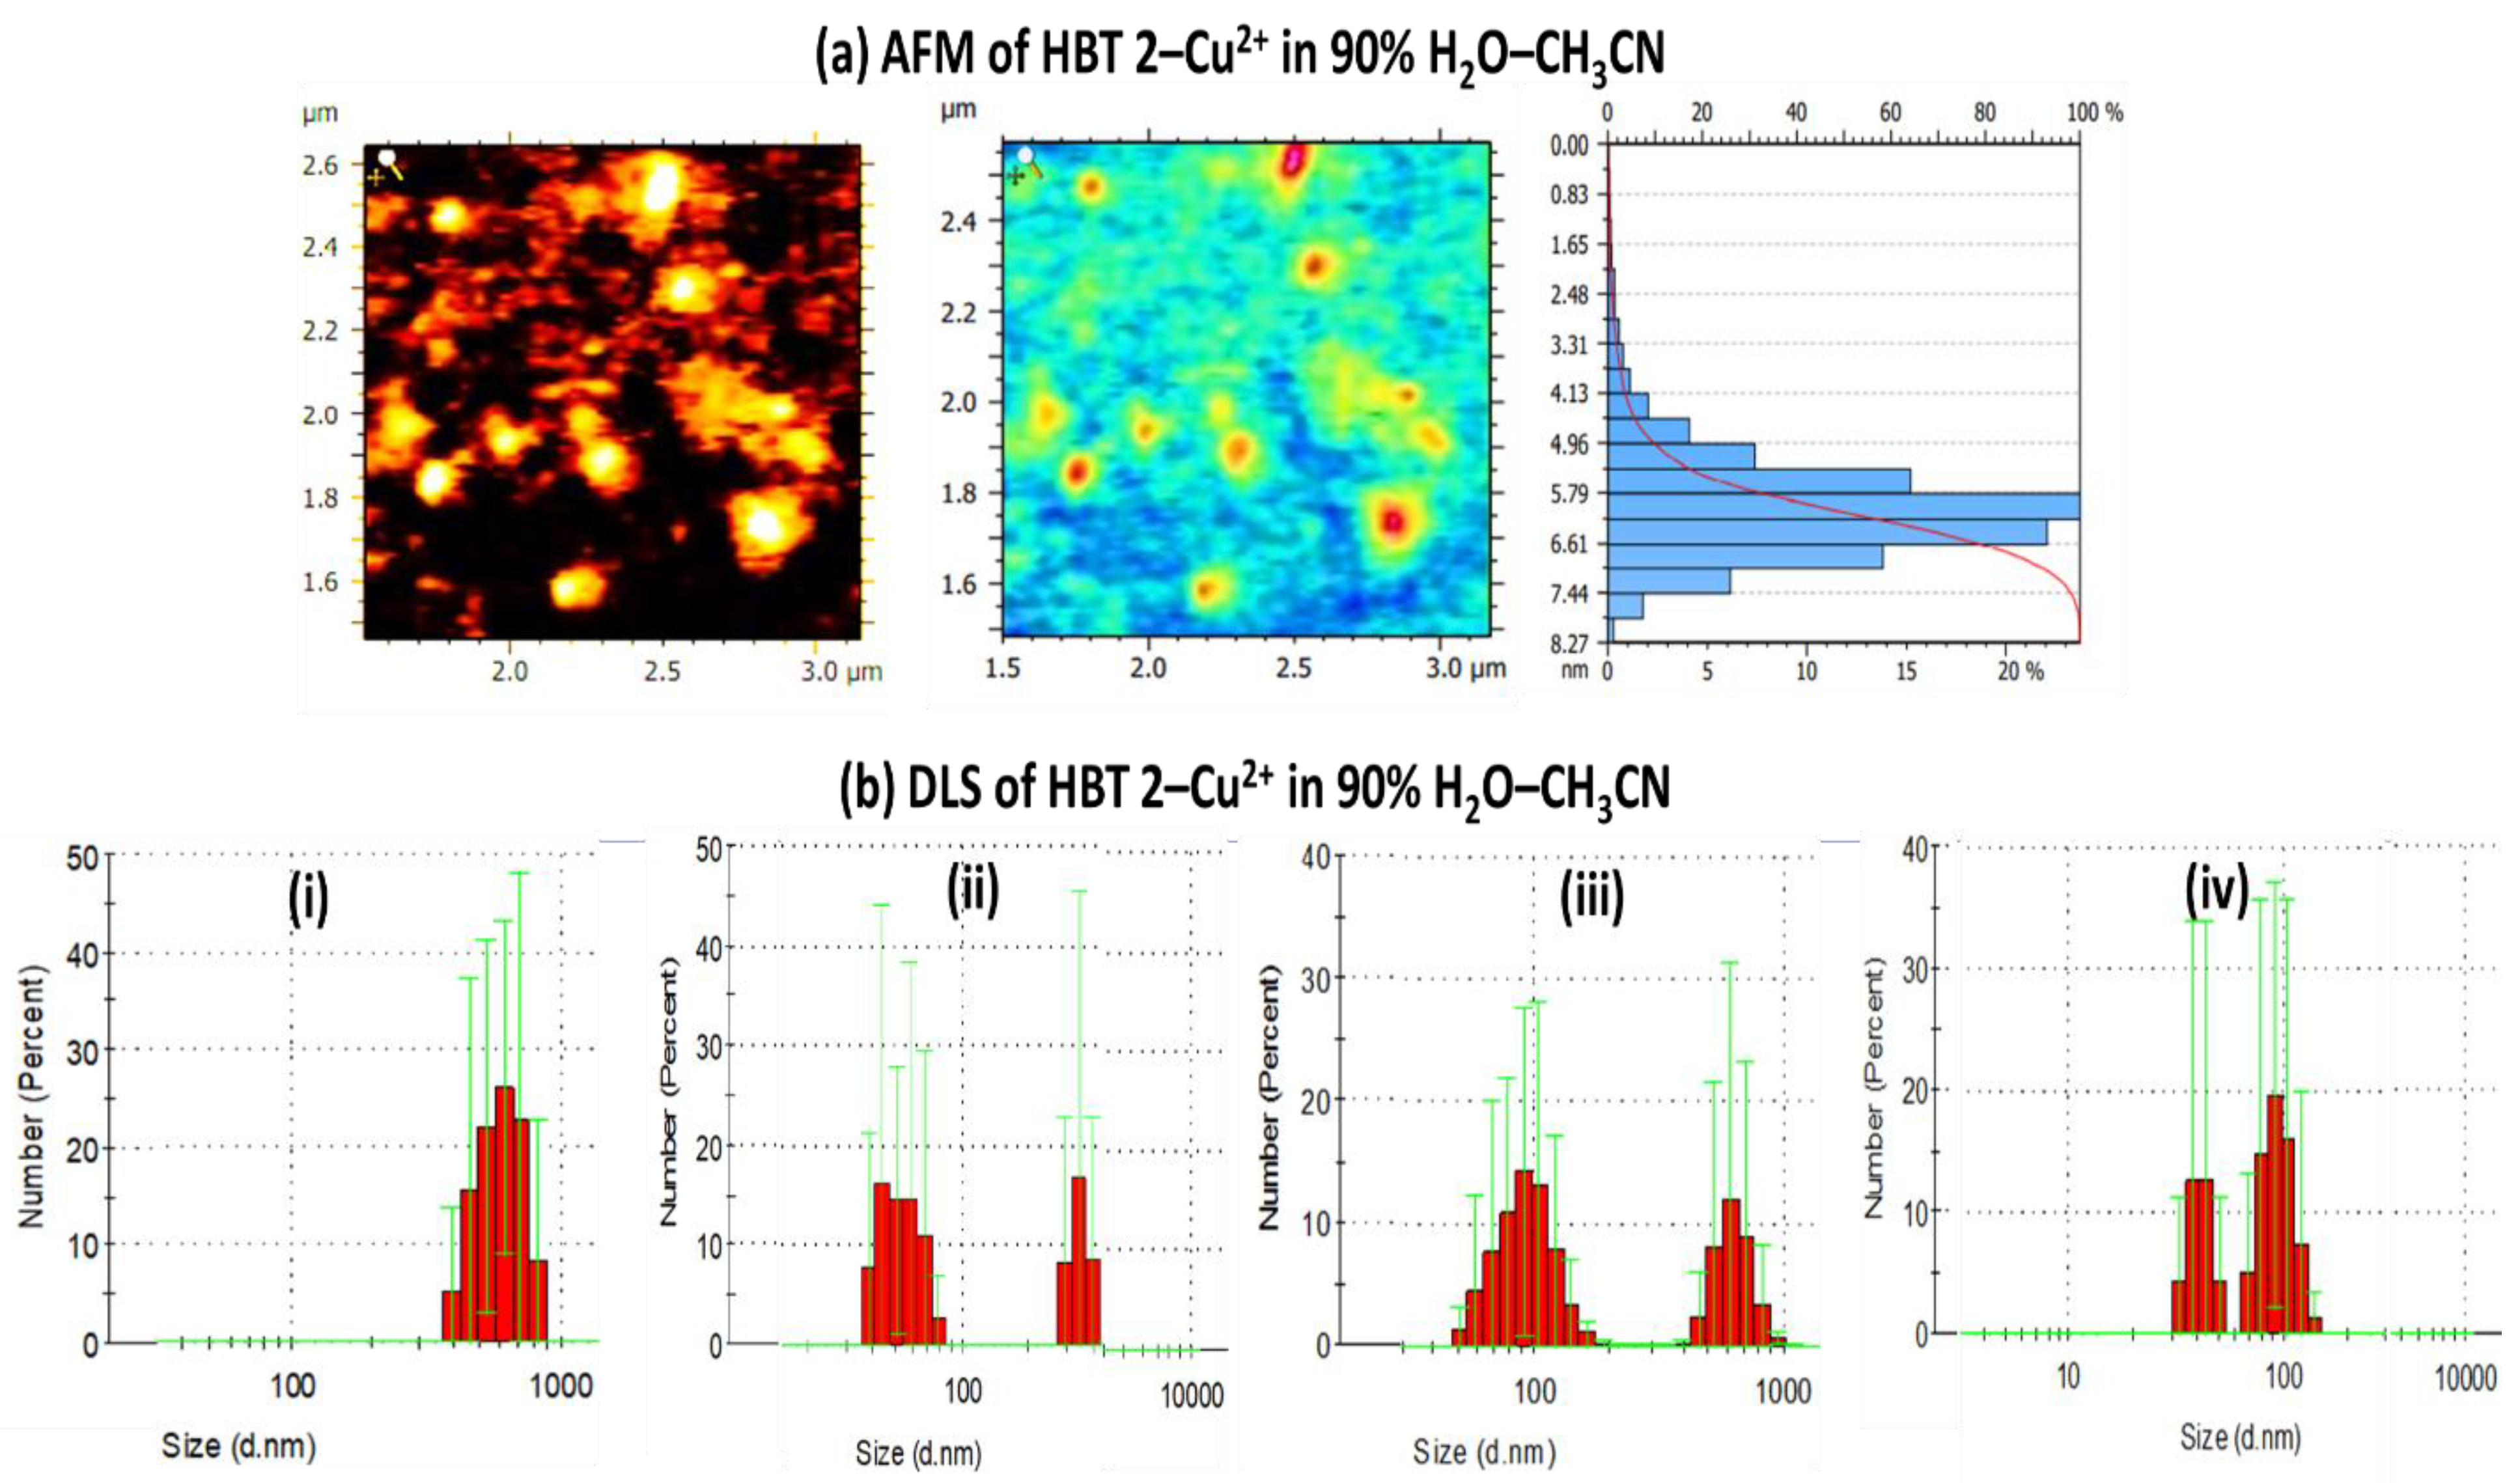
3.5. NMR, DLS and AFM Studies of HBT 2 with Cu2+ Ions

To obtain further insight into the mechanism of complexation between HBT 2 and Cu2+ ions, we have performed the NMR titration in the absence and presence of Cu2+ ions (Figure 6). Upon addition of 1, 3, 5 and 10 equivalents of Cu2+ ions in HBT 2, the -OH peak of HBT 2 at δ = 11.8 ppm broadened and then disappeared whereas the sharp doublet of Hc at δ = 8.565 ppm shifted up-field to δ = 8.547 and then broadened. Furthermore, the 1H NMR analysis showed an up-field shift of the aldehyde proton at δ = 10 ppm to 9.96 ppm whereas signals of the aromatic protons Hd–Hk become upfield shifted and merged with each other with concomitant broadening upon gradual addition of Cu2+ ions. These NMR changes could be due to the complexation of Cu2+ with -OH and -N of the HBT 2 which caused the deprotonation of -OH. The broadening of the signals may be due to the paramagnetic effect of the Cu2+ ions bound to HBT 2.
We have also performed the atomic force microscopic (AFM) analysis of HBT 2 in the absence (Figure S9 from Supplementary Materials) and the presence of Cu2+ ions. The AFM micrographs of the aggregates of HBT 2 (1 µM) in 9:1 (HEPES buffer: CH3CN) showed spherical aggregates of the size of 10.3–47.4 nm. Upon the addition of 20 equivalents of Cu2+ ions, the size of the aggregates decreased to 2.5–8 nm, however, the spherical morphology remains the same (Figure 7a). We further confirmed the de-aggregation process by performing a DLS analysis. The hydrodynamic diameter of HBT 2 (0.5 µM) in the aggregated state (HEPES buffer: CH3CN, 9:1) was 615.5 nm (polydispersity index = 0.66). Upon the addition of five equivalents of Cu2+, it was decreased to 192.91 nm (polydispersity index = 0.63), which further decreased to 91.28 nm (polydispersity index = 0.639) and 50.75 nm (polydispersity index = 0.491) on adding 10 and 20 equivalents of Cu2+ ions, respectively (Figure 7b). These results further support the disaggregation process in HBT 2 upon the addition of Cu2+ ions which consequently diminished the AIE phenomena.

3.6. Application in Determination of Cu2+ in Real Water Samples

To evaluate whether the HBT 2 can be used for the determination of Cu2+ ions in real water samples, we carried out the experiment of standard addition and recovery method by taking water samples from different areas of Punjab (India) such as Amritsar, Bathinda (rural, town), Muktsar and Faridkot. Different concentrations of Cu2+ ions in the range between (1–8 µM) were spiked into these water samples and then subsequently HBT 2 was added. The fluorescence spectra were recorded for each sample. The obtained fluorescence values at 550 nm for each real water sample spiked with Cu2+ were compared with the calibration curve and data are presented in Table 1 and Figure S10 from Supplementary Materials. The percentage recovery of Cu2+ ions from these samples ranged from 93–105% demonstrating the practical utility of HBT 2 for the detection of the Cu2+ ions in real water samples.

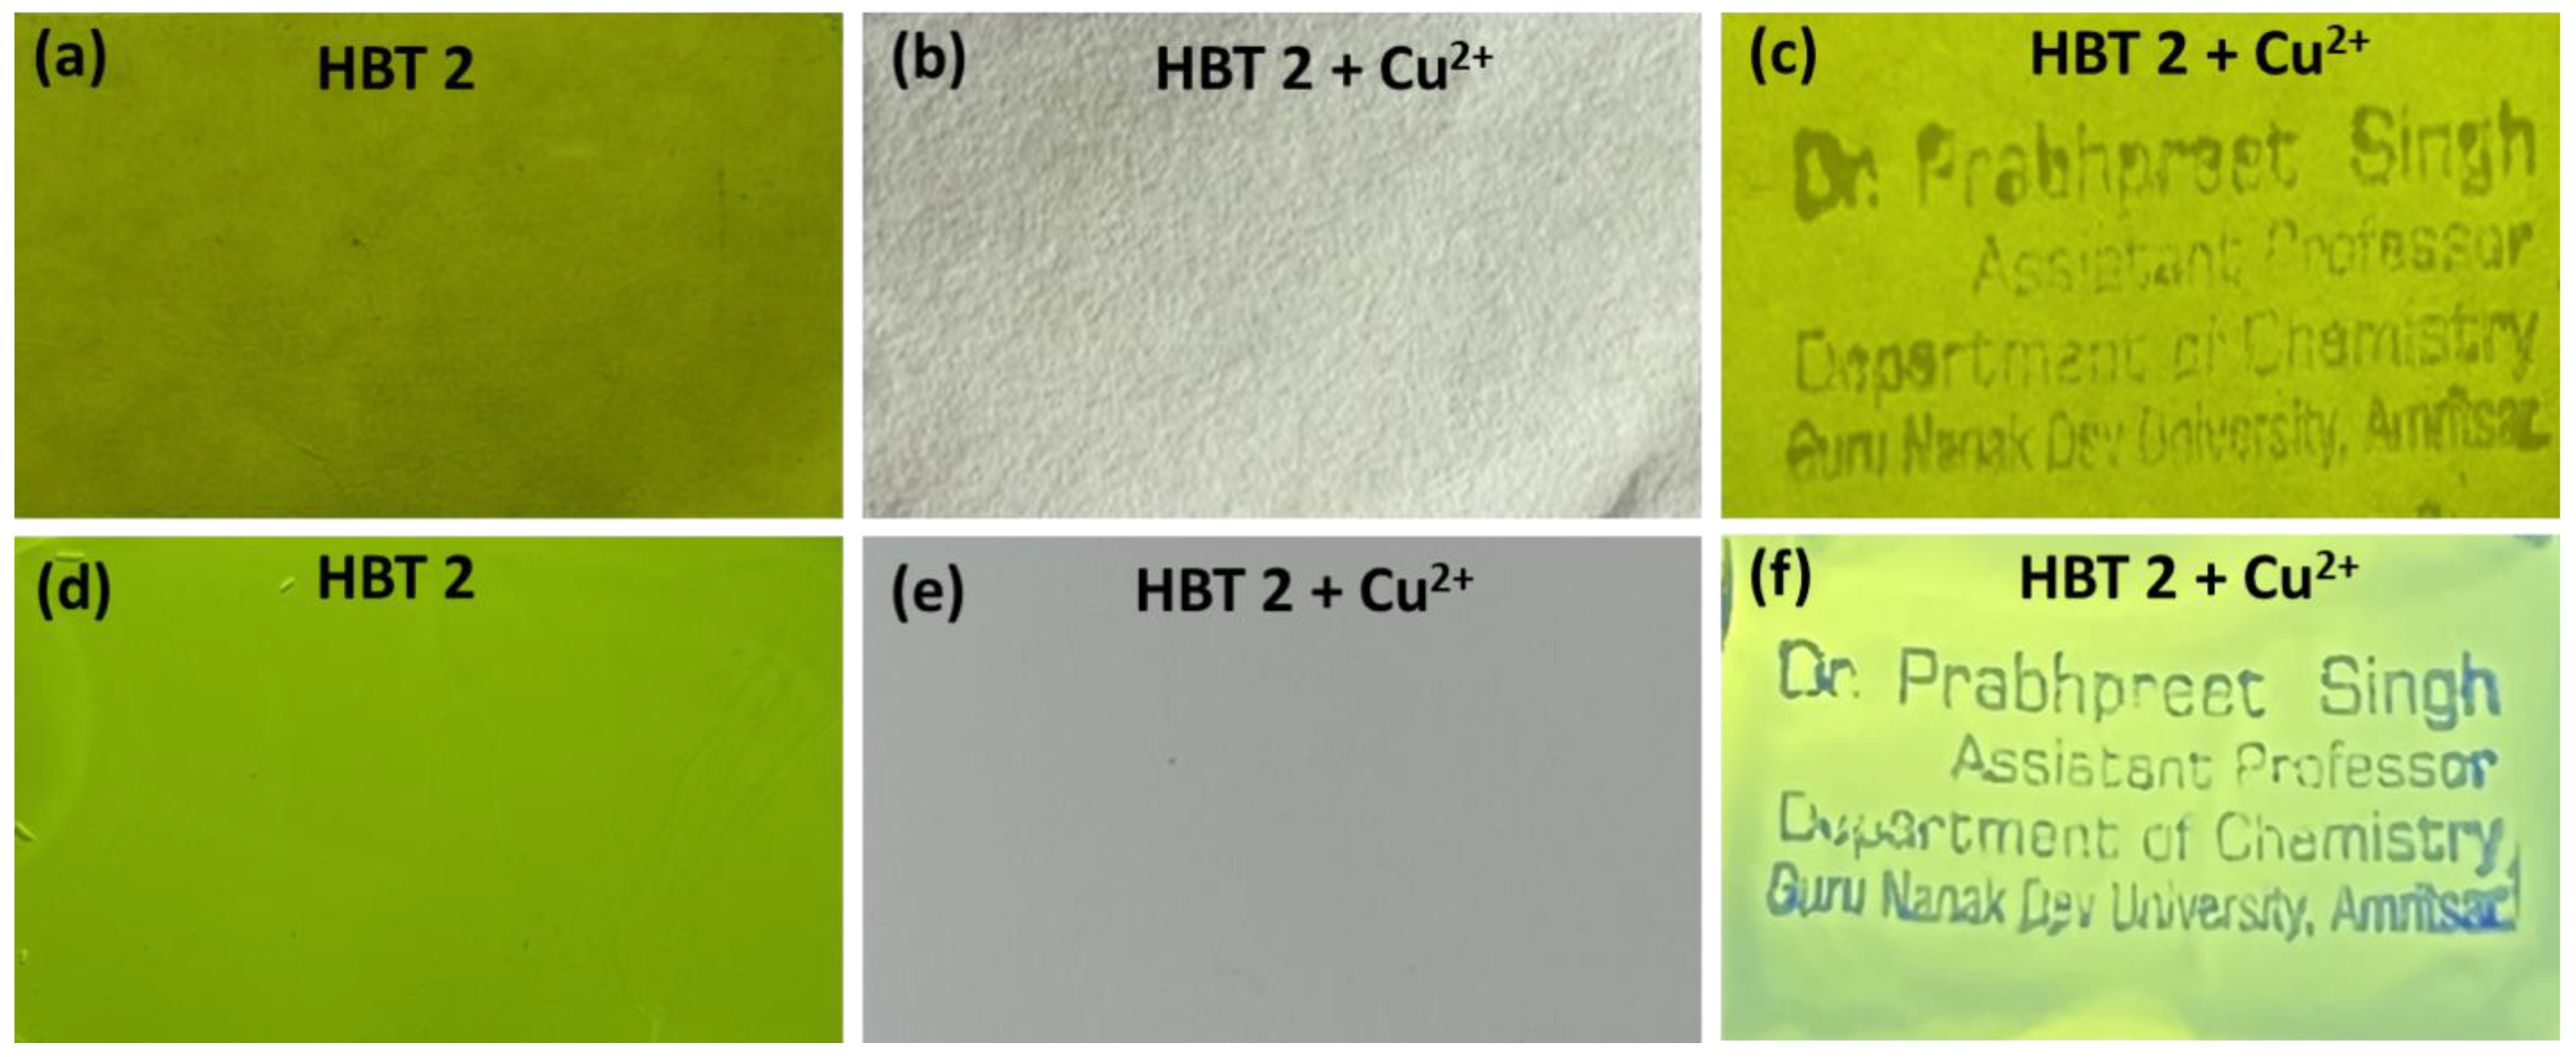
3.7. Application of HBT 2 as Anti-Counterfeiting Labels

HBT 2 is highly emissive in the solid state so we further used it for developing anti-counterfeiting labels. For this purpose, we first coated HBT 2 (1 mM) on filter paper and TLC strips by dip and dry method using CHCl3 solution. The fluorescent colour of the coated HBT 2 on filter paper and TLC strips was not visible to the naked eye or in daylight. However, on illumination under 365 nm UV lamps, it glows by emitting yellow-green fluorescence (Figure 8a,d).
Subsequently, we stamped several alphabets (using the stamp of the principal Investigator) on HBT 2 coated filter paper and TLC strips by using a stamp pad immersed in Cu2+ ions (1 mM) solution as a security ink. Under normal daylight, no alphabets were seen on these HBT 2 coated filter paper or TLC strips (Figure 8b,e). However, upon illumination of these HBT 2 coated filter paper and TLC strips with UV light of 365 nm, the dark coloured alphabets of the stamp can be clearly seen (Figure 8c,f). This could be ascribed to the quenching of the greenish-yellow fluorescence of the HBT 2 by Cu2+ ions. Moreover, by using a high concentration of Cu2+ ions (5 mM), it is possible to see the alphabets of stamps with the naked eye in daylight as green colour alphabets (Figure S11 from Supplementary Materials).

3.8. Intracellular Detection of Cu2+ in A549 Cells

To further validate the application of HBT 2 for the real-time monitoring of Cu2+ ions in live cells under physiological conditions, fluorescence microscopic imaging experiments were performed. The A549 cells were first pre-treated with HBT 2 (1 μM) for 30 min and then further incubated with different concentrations of Cu2+ ions (10 and 20 equivalents) for 30 min at 37 °C and imaged under inverted fluorescence microscopy. As shown in Figure 9b, the A549 cells, which were incubated with HBT 2 (1 μM), showed strong green fluorescence inside the cytoplasm which indicates that HBT 2 has good cell membrane permeability. The bright field images showed no change in the morphology of the cells. Upon the exogenous addition of Cu2+ ions (10 and 20 equivalents) to the cells pre-treated with HBT 2, the green fluorescence was quenched in a concentration-dependent manner (Figure 9c,d). These results are similar to the results obtained in the solution phase study. These observations suggested the potential application of HBT 2 in bioimaging and the detection of Cu2+ ions in live cells.

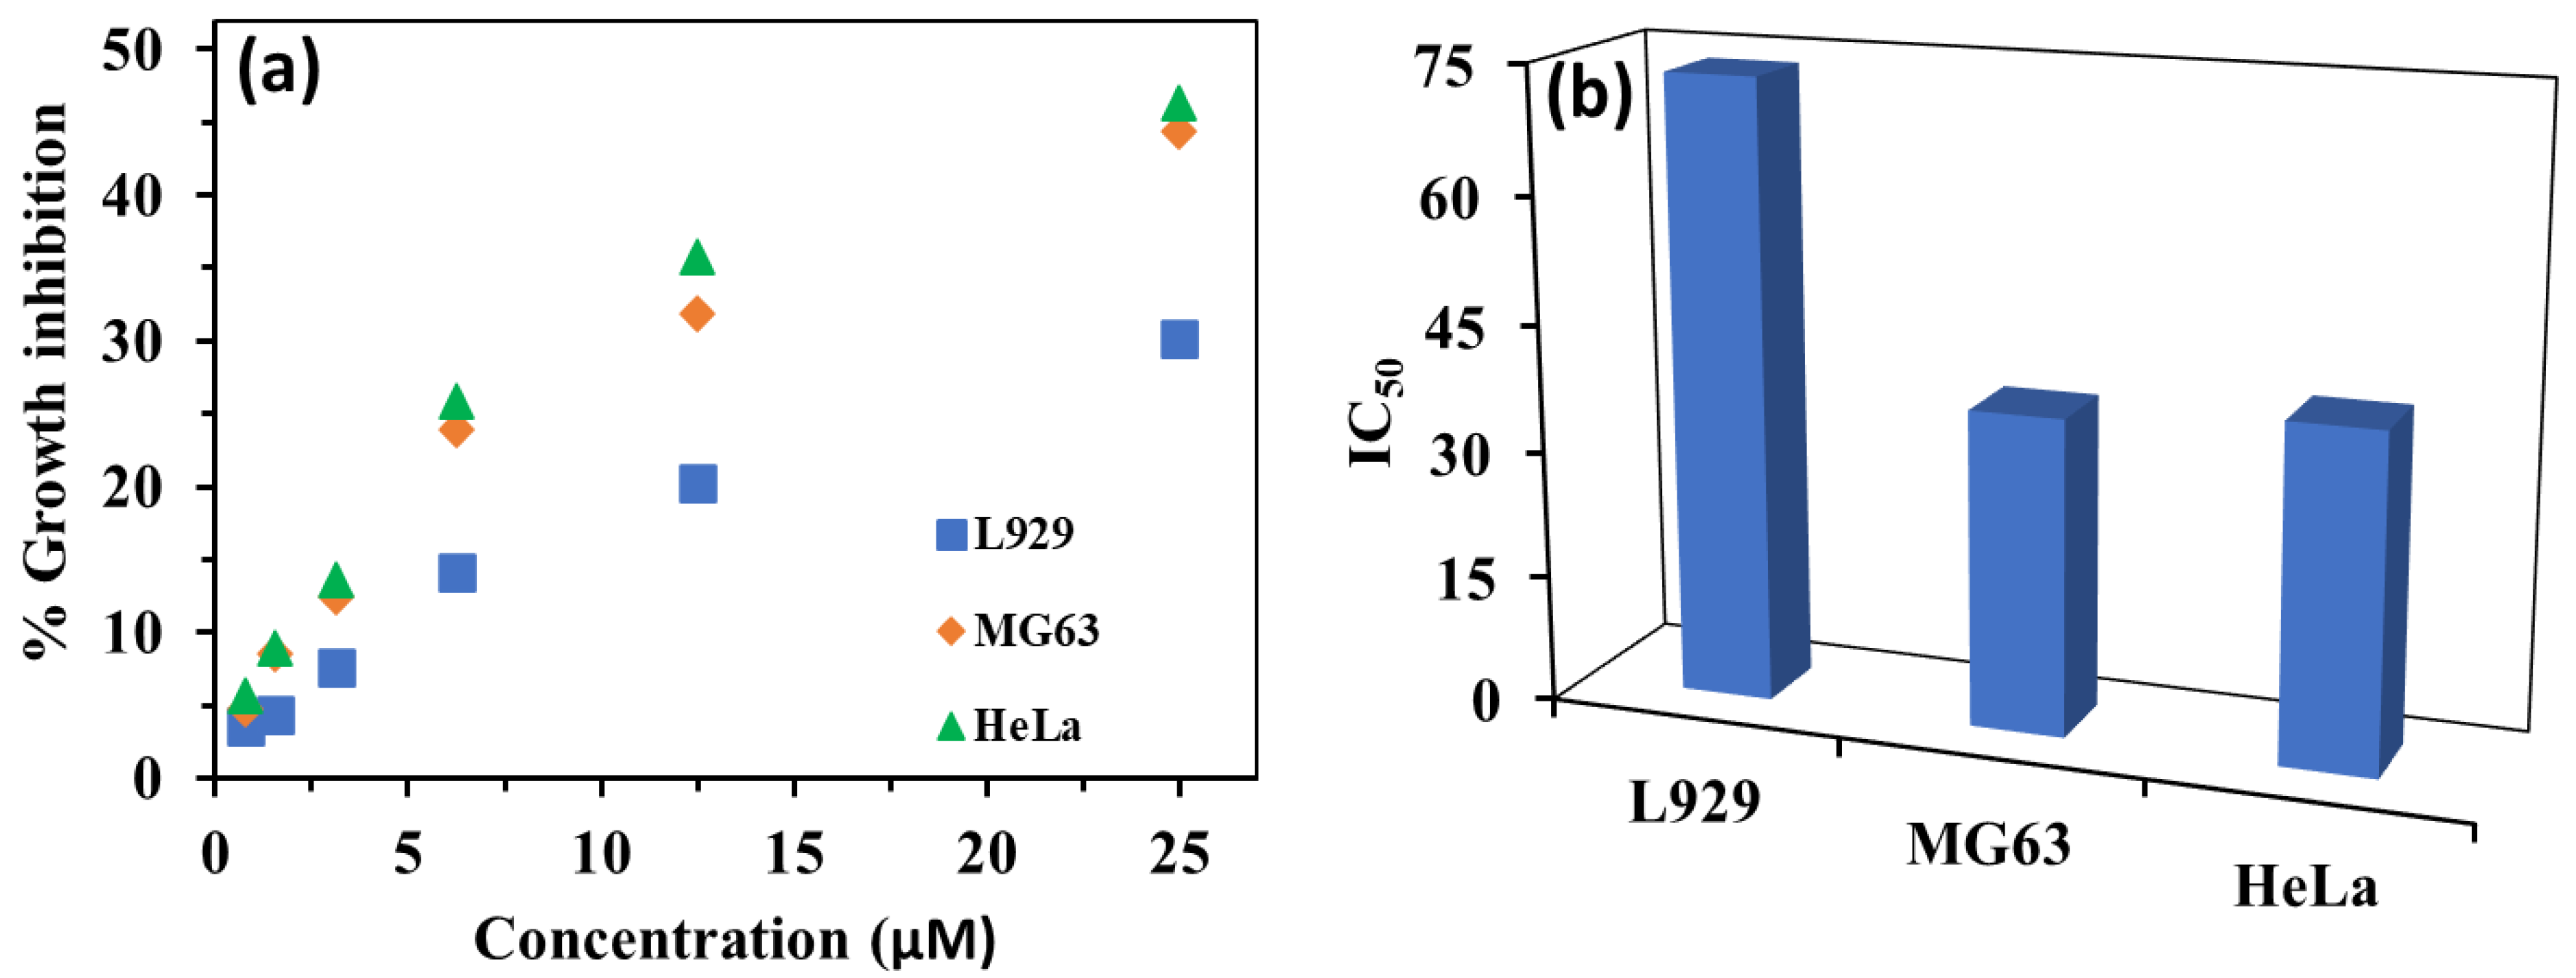
3.9. Anticancer Activity of HBT 2

To check the cytotoxicity of HBT 2, we performed the MTT assay on different cell lines such as HeLa cells (cervical cancer cells), MG 63 cells (bone cancer cells) and L929 cells (normal fibroblast cells) to confirm the cellular death response. The cells were treated with various concentrations of HBT 2 (0.78, 1.56, 3.125, 6.25, 12.5 and 25 µM) for HeLa, MG 63 and L929 cells followed by incubation for 24 h. We observed that HBT 2 showed cytotoxicity (IC50 = 37.3 ± 1.12 μM) and selectivity index = 1.96 against the MG 63 cells and IC50 = 39.58 ± 1.25 µM and selectivity index = 1.85 against HeLa cells in comparison to normal L929 cells (IC50 = 73.46 ± 1.28 µM). It has also been found that the cell viability has been reduced on treatment with HBT 2 in a dose-dependent manner (Figure 10 and Figure S12 from Supplementary Materials).

4. Conclusions

In conclusion, we have synthesized a hydroxybenzothiazole (HBT) based derivative HBT 2 possessing AIE+ESIPT properties in aqueous medium. HBT 2 showed excellent selectivity for Cu+/Cu2+ ions in 90% aqueous medium. The mechanism of interaction involves disaggregation of HBT 2 aggregates in the presence of Cu2+ ions supported by optical, NMR, AFM and DLS techniques. We have successfully demonstrated applications of HBT 2 for (i) determination of Cu2+ concentrations in real water samples; (ii) bioimaging and detection of Cu2+ ions in A549 cells; (iii) anticancer activity against MG-63, HeLa cells and (iv) anti-counterfeiting labels using HBT 2 coated filter paper and TLC strip and a solution of Cu2+ as a security ink.

Supplementary Materials

References from [22,50,51,52,53,54,55] are cited from supplementary materials. The supporting information can be downloaded at: https://www.mdpi.com/article/10.3390/molecules27227678/s1, the original spectral and photophysical data (Figures S1–S12 and Tables S1).

Author Contributions

Conceptualization, P.S.; Methodology, P.S., R.K. (Rajdeep Kaur) and S.S.M.; Investigation, R.K. (Rajdeep Kaur), R.K. (Rasdeep Kour) and S.K.; Writing-Original draft, P.S., R.K. (Rajdeep Kaur); Writing Review and Editing, P.S. and S.S.M.; Supervision, P.S.; Funding acquisition, P.S. All authors have read and agreed to the published version of the manuscript.

Funding

This research received no external funding.

Acknowledgments

This research work was supported by grants from University Grant Commis sion (UGC) to Guru Nanak Dev University, Amritsar under RUSA 2.0 Component 4.0 scheme. We also thanks DST for FIST and PURSE programs to the university.

Conflicts of Interest

The authors declare no conflict of interest.

Sample Availability

Samples of the compounds HBT 1 and 2 are available from the authors.

References

  1. Das, S.; Indurthi, H.K.; Asati, P.; Saha, P.; Sharma, D.K. Benzothiazole based fluorescent probes for the detection of biomolecules, physiological conditions, and ions responsible for diseases. Dye. Pigm. 2022, 199, 110074. [Google Scholar] [CrossRef]
  2. Yin, J.; Huang, L.; Wu, L.; Li, J.; James, T.D.; Lin, W. Small molecule based fluorescent chemosensors for imaging the microenvironment within specific cellular regions. Chem. Soc. Rev. 2021, 50, 12098–12150. [Google Scholar] [CrossRef] [PubMed]
  3. Sedgwick, A.C.; Wu, L.; Han, H.H.; Bull, S.D.; He, X.P.; James, T.D.; Sessler, J.L.; Tang, B.Z.; Tian, H.; Yoon, J. Excited-state intramolecular proton-transfer (ESIPT) based fluorescence sensors and imaging agents. Chem. Soc. Rev. 2018, 47, 8842–8880. [Google Scholar] [CrossRef] [PubMed] [Green Version]
  4. Udhaykumari, D.; Inbaraj, V. A Review on Schiff Base Fluorescent Chemosensors for Cell Imaging Applications. J. Fluoresc. 2020, 30, 1203–1223. [Google Scholar] [CrossRef] [PubMed]
  5. He, T.; Niu, N.; Chen, Z.; Li, S.; Liu, S.; Li, J. Novel Quercetin Aggregation-Induced Emission Luminogen (AIEgen) with Excited-State Intramolecular Proton Transfer for In Vivo Bioimaging. Adv. Funct. Mater. 2018, 28, 11. [Google Scholar] [CrossRef]
  6. Keri, R.S.; Patil, M.R.; Patil, S.A.; Budagumpi, S. A comprehensive review in current developments of benzothiazole-based molecules in medicinal chemistry. Eur. J. Med. Chem. 2015, 89, 207–251. [Google Scholar] [CrossRef]
  7. Pathak, N.; Rathi, E.; Kumar, N.; Kini, S.G.; Rao, C.M. A Review on Anticancer Potentials of Benzothiazole Derivatives. Mini Rev. Med. Chem. 2020, 20, 12–23. [Google Scholar] [CrossRef]
  8. Jiang, J.; Bian, Y.; Lin, C.; Liu, X.; Yu, B.; Han, C.; Gong, L.; Wang, C.; Gao, Y. Rational Modification of Two-Dimensional Donor-Acceptor Covalent Organic Frameworks for Enhanced Visible Light Photocatalytic Activity. ACS Appl. Mater. Inter. 2021, 23, 27041–27048. [Google Scholar]
  9. Chen, W.; Wang, L.; Mo, D.; He, F.; Wen, Z.; Wu, X.; Xu, H.; Chen, L. Modulating Benzothiadiazole-Based Covalent Organic Frameworks via Halogenation for Enhanced Photocatalytic Water Splitting. Angew. Chem. Int. Ed. Engl. 2020, 59, 16902–16909. [Google Scholar] [CrossRef]
  10. Singh, P.; Singh, H.; Sharma, R.; Bhargava, G.; Kumar, S. Diphenylpyrimidinone–salicylideneamine–new ESIPT based AIEgens with applications in latent fingerprinting. J. Mater. Chem. C 2016, 4, 11180–11189. [Google Scholar] [CrossRef]
  11. Singh, H.; Sharma, R.; Bhargava, G.; Kumar, S.; Singh, P. AIE+ESIPT based red fluorescent aggregates for visualization of latent fingerprints. N. J. Chem. 2018, 42, 12900–12907. [Google Scholar] [CrossRef]
  12. Ahmad, M.; Kumar, G.; Luxami, V.; Kaur, S.; Singh, P.; Kumar, S. Fluorescence Imaging of Surface-Versatile Latent Fingerprints at the Second and Third level using double ESIPT-based AIE fluorophore. N. J. Chem. 2021, 45, 7705–7713. [Google Scholar] [CrossRef]
  13. Makau, J.N.; Kitagawa, A.; Kitamura, K.; Yamaguchi, T.; Mizuta, S. Design and Development of an HBT-Based Ratiometric Fluorescent Probe to Monitor Stress-Induced Premature Senescence. ACS Omega 2020, 5, 11299–11307. [Google Scholar] [CrossRef]
  14. Zhou, P.; Han, K. ESIPT-based AIE luminogens: Design strategies, applications, and mechanisms. Aggregate 2022, 3, e160. [Google Scholar] [CrossRef]
  15. Azarifar, D.; Maleki, B.; Hojati, S.F.; Veisi, H.; Gholizadeh, M.; Salehabadi, H.; Moghadam, M.K. Efficient 2,4,6-Trichloro-1,3,5-triazine-Catalyzed Synthesis of 2-Arylbenzothiazoles and Bisbenzothiazoles by Condensation of 2-Aminithiophenol with Aldehydes under Mild Conditions. J. Hetero. Chem. 2011, 48, 449–453. [Google Scholar]
  16. Azarifar, D.; Malekim, B.; Setayeshnazar, M. A Simple, Microwave-Assisted, and Solvent-Free Synthesis of 2-Arylbenzothiazoles by Acetic Acid–Promoted Condensation of Aldehydes with 2- Aminothiophenol in Air. Phosphorus Sulfur Silicon 2009, 184, 2097–2102. [Google Scholar] [CrossRef]
  17. Kwon, J.E.; Park, S.Y. Advanced Organic Optoelectronic Materials: Harnessing Excited-State Intramolecular Proton Transfer (ESIPT) Process. Adv. Mater. 2011, 23, 3615–3642. [Google Scholar] [CrossRef]
  18. Demchenko, A.P.; Tang, K.-C.; Chou, P.-T. Excited-state proton coupled charge transfer modulated by molecular structure and media polarization. Chem. Soc. Rev. 2013, 42, 1379–1408. [Google Scholar] [CrossRef]
  19. Zhou, P.; Han, K. Unraveling the Detailed Mechanism of Excited-State Proton Transfer. Acc. Chem. Res. 2018, 51, 1681–1690. [Google Scholar] [CrossRef]
  20. Mei, J.; Leung, N.L.C.; Kwok, R.T.K.; Lam, J.W.Y.; Tang, B.Z. Aggregation-Induced Emission: Together We Shine, United We Soar! Chem. Rev. 2015, 115, 11718–11940. [Google Scholar] [CrossRef]
  21. Liang, J.; Tang, B.Z.; Liu, B. Specific light-up bioprobes based on AIEgen conjugates. Chem. Soc. Rev. 2015, 44, 2798–2811. [Google Scholar] [CrossRef] [PubMed] [Green Version]
  22. Goswami, S.; Bag, R.; Sikdar, Y.; Sahu, S.; Mukhopadhyay, C.D.; Drew, M. Benzimidazole based ESIPT active chemosensors enable nano-molar detection of Cu2+ in 90% aqueous solution, MCF-7 cells and plants. J. Photochem. Photobio. A 2022, 431, 114006. [Google Scholar]
  23. Liang, N.; Zhao, L.; Pan, W.; Yang, X.; Wu, L. AIE-ESIPT based colorimetric and “OFF-ON-OFF” fluorescence Schiff base sensor for visual and fluorescent determination of Cu2+ in aqueous media. J. Photochem. Photobio. A 2021, 420, 113506. [Google Scholar]
  24. Iyer, S.K.; Enbanathan, S.; Munusamy, S.; Jothi, D.; Kumar, S.M.; Gopal, A.P. A new fast-responding fluorometric “turn-on” sensor based on benzothiazole-phenanthridine for the sensitive, selective, and reversible detection of Cu2+ in real water samples and its use in bio-imaging. Dye. Pigm. 2022, 205, 111514. [Google Scholar]
  25. Tapiero, H.; Townsend, D.M.; Tew, K.D. Trace elements in human physiology and pathology. Copper. Biomed. Pharma. 2003, 57, 386–398. [Google Scholar] [CrossRef]
  26. Wei, Y.; Zhang, X.; Wang, D.; Zhou, X.; Ma, C.; Liu, M.; Huang, H.; Zhang, X. An amphiphilic fluorogen with aggregation-induced emission characteristic for highly sensitive and selective detection of Cu2+ in aqueous solution and biological system. Arab. J. Chem. 2021, 14, 103351. [Google Scholar]
  27. Yilmaz, I.; Savran, T.; Elmas, S.N.K.; Geyik, G.A.; Bostanci, A.; Aydin, D.; Arslan, F.N. “Turn-on” Fluorescence Chemosensor Based Probing of Cu2+ with Excellent Sensitivity: Experimental Study, DFT Calculations and Application in Living Cells and Natural Waters. Chem. Select. 2021, 6, 6286–6294. [Google Scholar]
  28. Bu, H.; Han, J.; Wang, Z.; Jia, N.; Zhou, X. Cu(I)-catalysed click reaction-triggered 3D DNA walker for constructing an “OFF-ON” Fluorescent Biosensor for Cu2+ detection. ACS Appl. Bio Mater. 2021, 4, 3571–3578. [Google Scholar]
  29. Liu, J.; Li, G.; Zhang, T.; Guan, P.; Liu, W.; Zhao, G.; Fang, Y.; Fug, H.; Guif, J.F. Copper stress induces zebrafish central neural system yelin defects via WNT/NOTCH-hoxb5b signalling and pou3f1/fam168a/168b DNA methylation. BBA Gene Regu. Mech. 2020, 1863, 194612. [Google Scholar]
  30. Stern, B.R. Essentiality and Toxicity in Copper health Risk Assessment: Overview, update and regulatory considerations. J. Toxico. Environ. Health Part A 2010, 73, 114–127. [Google Scholar] [CrossRef]
  31. Crisponi, G.; Nurchi, V.M.; Fanni, D.; Gerosa, C.; Nemolato, S.; Faa, G. Copper-related diseases: From chemistry to molecular pathology. Coord. Chem. Rev. 2010, 254, 876–889. [Google Scholar] [CrossRef]
  32. Kozlowski, H.; Luczkowski, M.; Remelli, M.; Valensin, D. Copper, zinc and iron in neurodegenerative diseases (Alzheimer’s, Parkinson’s and prion diseases). Coord. Chem. Rev. 2012, 256, 2129–2141. [Google Scholar] [CrossRef]
  33. Malhotra, N.; Ger, T.-R.; Uapipatanakul, B.; Huang, J.-C.; Chen, K.H.-C.; Hsiao, C.-D. Review of Copper and Copper Nanoparticle Toxicity in Fish. Nanomaterials 2020, 10, 1126. [Google Scholar] [CrossRef]
  34. Tsade, H.K. Atomic absorption spectroscopic determination of heavy metal concentrations in Kulufo River, Arbaminch, Gamo Gofa, Ethiopia. J. Environ. Anal. Chem. 2016, 3, 1–3. [Google Scholar]
  35. Alkas, F.B.; Shaban, J.A.; Sukuroglu, A.A.; Kurt, M.A.; Battal, D.; Saygi, S. Monitoring and assessment of heavy metal/metalloid concentration by inductively coupled plasma mass spectroscopy (ICP-MS) method in Gonyeli Lake, Cyprus. Environ. Monit. Assess. 2017, 189, 1–8. [Google Scholar] [CrossRef]
  36. Sangi, M.R.; Jayatissa, D.; Kim, J.P.; Hunter, K.A. Determination of labile Cu2+ in fresh waters by chemiluminescence: Interference by iron and other cations. Talanta 2004, 62, 924–930. [Google Scholar] [CrossRef]
  37. Mei, C.J.; Yusof, N.A.; Ahmad, S.A.A. Electrochemical Determination of Lead & Copper Ions Using Thiolated Calix [4]arene-Modified Screen-Printed Carbon Electrode. Chemosensors 2021, 9, 157. [Google Scholar]
  38. Cotruvo, J.J.A.; Aron, A.T.; Ramos-Torres, K.M.; Chang, C.J. Synthetic fluorescent probes for studying copper in biological systems. Chem. Soc. Rev. 2015, 44, 4400–4414. [Google Scholar] [CrossRef] [Green Version]
  39. Udhayakumari, D.; Naha, S.; Velmathi, S. Colorimetric and fluorescent chemosensors for Cu2+. A comprehensive review from the years 2013–2015. Anal. Methods 2017, 9, 552–578. [Google Scholar] [CrossRef]
  40. Li, L.; Feng, Q.; Niu, G.; Zhang, W.; Li, Y.; Kang, M.; Xu, K.; He, Z.; Hou, H.; Tang, B.Z. Benzothiazole-based AIEgen with tunable excited-state intramolecular proton transfer (ESIPT) and restricted intramolecular rotation (RIR) processes for highly sensitive physiological pH sensing. ACS Sens. 2018, 3, 920–928. [Google Scholar] [CrossRef]
  41. Chen, X.; Pradhan, T.; Wang, F.; Kim, J.S.; Yoon, J. Fluorescent Chemosensors Based on Spiroring-Opening of Xanthenes and Related Derivatives. Chem. Rev. 2012, 112, 1910–1956. [Google Scholar] [CrossRef] [PubMed]
  42. Kramer, J.; Kang, R.; Grimm, L.M.; Cola, L.D.; Picchetti, P.; Biedermann, F. Molecular Probes, Chemosensors, and Nanosensors for Optical Detection of Biorelevant Molecules and Ions in Aqueous Media and Biofluids. Chem. Rev. 2022, 122, 3459–3636. [Google Scholar] [CrossRef]
  43. Singh, P.; Sharma, P. A perylene diimide-based near-IR ratiometric sensor for detection of Cu2+ ions: Ensemble for discrimination of CN and S22− ions. Anal. Methods 2020, 12, 758–767. [Google Scholar]
  44. Singh, P.; Kumar, K.; Kaur, S.; Bhargava, G.; Kumar, S. Perylene diimide-Cu2+ based fluorescent nanoparticles for the detection of spermine in clinical and food samples: A step toward the development of a diagnostic kit as a POCT tool for spermine. J. Mater. Chem. B 2019, 7, 7218–7227. [Google Scholar]
  45. Singh, P.; Singh, H.; Bhargava, G.; Kumar, S. Triple-signaling mechanism-based three-in-one multi-channel chemosensor for discriminating Cu2+, acetate and ion pair mimicking AND, NOR, INH and IMP logic functions. J. Mater. Chem. C 2015, 3, 5524–5532. [Google Scholar] [CrossRef]
  46. Singh, P.; Sharma, P.; Sharma, N.; Kaur, S. Ratiometric ‘lightening up’ intracellular probe for Cu2+ and ClO and applications for real time detection. J. Photochem. Photobio. A 2022, 423, 113574. [Google Scholar] [CrossRef]
  47. Singh, P.; Sharma, P.; Kaur, S.; Kaur, S. Near-IR oxime-based solvatochromic perylene diimide probe as a chemosensor for Pd species and Cu2+ ions in water and live cells. Photochem. Photobiol. Sci. 2020, 19, 504. [Google Scholar]
  48. Singh, P.; Singh, H.; Vanita, V.; Sharma, R.; Bhargava, G.; Kumar, S. Nanomolar Cu2+ Detection in water on Disassembly of AIEgen: Applications in blood Serum, Cell imaging and complex Logic circuits. Chem. Sel. 2016, 1, 6880–6887. [Google Scholar] [CrossRef]
  49. Singh, P.; Kaur, R.; Sharma, P.; Kumar, S.; Kumar, S. Hydroxyphenyl Benzothiazole Derivative, its Method of Preparation and Use Thereof. Indian Patent Applications 202211017786.
  50. Guchhait, N.; Bhattacharyya, A.; Makhal, S.C.; Mandal, S. Exploring the hidden potential of a methoxy substituted HBT derivative as an efficient example of coupling of AIE and ESIPT process and as an energy harvesting platform. New J. Chem. 2019, 43, 15087–15096. [Google Scholar]
  51. Kim, C.; Heo, J.S.; Suh, B. Selective detection of Cu2+ by benzothiazole-based colorimetric chemosensor: A DFT study. J. Chem. Sci. 2022, 43, 134. [Google Scholar]
  52. Pu, S.; Wang, R.; Dong, X.; Leo, G.; Leo, P. A novel sensitive sensor for Cu2+ and multi-switch based on a diarylethene with a 2-(2′-hydroxyphenyl)benzothiazole unit. Tetrahedron 2016, 72, 2935–2942. [Google Scholar]
  53. Han, Y.; Yang, C.; Chen, Y.; Wu, K.; Wei, T.; Wang; Zhang, J.S. A reactive probe for Cu2+ based on the ESIPT mechanism and its application in live-cell imaging. Anal. Methods 2015, 7, 3327. [Google Scholar]
  54. Xing, Z.; Li, J.; Wang, J.; Tian, Z.; Wu, D.; Xiang, Y. A dual-functional probe for sensing pH changes and ratiometric detection of Cu2+. Spectrochim. Acta Part A Mol. Biomol. Spec. 2020, 235, 11831. [Google Scholar]
  55. Chansaenpak, K.; Nootem, J.; Daengngern, R.; Sattayanon, C.; Wattanathana, W.; Wannapaiboon, S.; Rashatasakhon, P. The synergy of CHEF and ICT toward fluorescence ‘turn-on’ probes based on push-pull benzothiazoles for selective detection of Cu2+ in acetonitrile/ water mixture. J. Photochem. Photobio. 2021, 415, 113318. [Google Scholar]
Scheme 1. Synthesis of derivatives HBT 1 and HBT 2; Reagents and conditions: (i) ethanol, 70 °C, 3 h, then H2O2/HCl (ii) 4-formylphenylboronic acid, Na2CO3, Pd(PPh3)4, toluene, C2H5OH:H2O (1:1), 80 °C, 5 h.
Molecules 27 07678 sch001
Figure 1. (a) Photographs (under 365 nm UV-illumination); (b) emission and (c) absorbance spectrum of HBT 2 (10 μM) recorded in various solvents of different polarity. Photographs were taken at concentration 10 μM of HBT 2.
Molecules 27 07678 g001
Figure 2. The general mechanism for keto–enol tautomerism in HBT 2.
Molecules 27 07678 g002
Figure 3. (a) Photographs (under 365 nm UV-illumination); (b) emission spectra (0.5 µM) of HBT 2 recorded in different fractions of water (0–100%) in CH3CN and (c) plot of fluorescence intensity versus fraction of water [inset of (c)] photograph of HBT 2 (solid) in daylight and HBT 2 mixed with silica under 365 nm UV lamp.
Molecules 27 07678 g003
Figure 4. AFM micrographs, electron density profile, histogram showing size of aggregates of HBT 2 (1 µM) and DLS bar graph of HBT 2 (0.5 µM) in (a) CH3CN; (b) 50% HEPES buffer:CH3CN and (c) 90% HEPES buffer:CH3CN solution.
Molecules 27 07678 g004
Figure 5. (a,d) Emission spectrum of HBT 2 (0.5 μM) upon addition of Cu2+ and Cu+ ions recorded in 90% HEPES buffer–CH3CN, pH 7.2; (b,e) plot of fluorescence intensity versus conc. of Cu2+ ions for calculating the limit of detection; (c) Job’s plot showing 1:1 stoichiometry between HBT 2 and Cu2+ ions; and (f) B–H plot between I/Io–I550 and 1/Cu2+ ion; [Inset of (a)] Photographs (under 365 nm UV lamp) showing quenching of fluorescence of (i) HBT 2 upon addition of (ii) 5, (iii) 10 and (iv) 20 equivalents of Cu2+ ions.
Molecules 27 07678 g005
Figure 6. 1H NMR spectra (partial) of HBT 2 (5 mM); (a) in the absence and presence of (b) 1; (c) 3; (d) 5 and (e) 10 equivalents of Cu2+ ions recorded in DMSO(d6).
Molecules 27 07678 g006
Figure 7. (a) AFM images, electron density profile, aggregate size-based bar graph of HBT 2 (1 µM), in the presence of Cu2+ ions recorded in 9:1 (HEPES buffer:CH3CN) solution and (b) DLS analysis of (i) HBT 2 (0.5 μM) upon addition of (ii) 5, (iii) 10 and (iv) 20 equivalents Cu2+ ions recorded in 9:1 (HEPES buffer: CH3CN) solution.
Molecules 27 07678 g007
Figure 8. Photographs of HBT 2 (under 365 nm UV lamp) alone; HBT 2 after stamping with Cu2+ ink under daylight and 365 nm UV lamp taken on (ac) filter papers and (df) TLC strips for developing anticounterfeiting labels.
Molecules 27 07678 g008
Figure 9. (a) Bright field image; (b) Fluorescence image (at 10×) of A549 lung cancer cells incubated with HBT 2 (1 μM); Fluorescence image of A549 cells incubated with HBT 2 followed by incubation with (c) 10 equivalents and (d) 20 equivalents of Cu2+ ions.
Molecules 27 07678 g009
Figure 10. (a) Effect of increasing dose of HBT 2 (0–25 µM) on viability of normal and cancer cell lines and (b) Bar graph of IC50 values.
Molecules 27 07678 g010
Table 1. Determination of Cu2+ ions in spiked real water samples taken from different areas of Punjab (India) using HBT 2 in HEPES buffer–CH3CN (9:1, v/v, pH 7.2) solution.
Technique UsedSamples Taken fromCu2+ Added
(µM)
Cu2+ Found
(µM)
% Age Recovery
FluorescenceAmritsar2.62.598.03
3.43.5102.94
5.65.599.09
7.77.599.29
Bathinda
(Rural)
3.53.095.38
4.54.595.23
6.26.0100.00
7.97.595.54
Bathinda
(Town)
1.61.595.23
3.23.093.75
4.74.596.77
7.67.599.33
Muktsar1.61.596.15
2.72.594.33
4.64.597.82
7.57.5100.00
Faridkot1.71.590.90
2.52.599.00
4.54.5100.00
6.26.5105.69
Publisher’s Note: MDPI stays neutral with regard to jurisdictional claims in published maps and institutional affiliations.

