

Insight into the Interaction Mechanism of HSA with Aztreonam: A Multispectroscopic and Computational Approach
Abstract
:1. Introduction
2. Results and Discussion
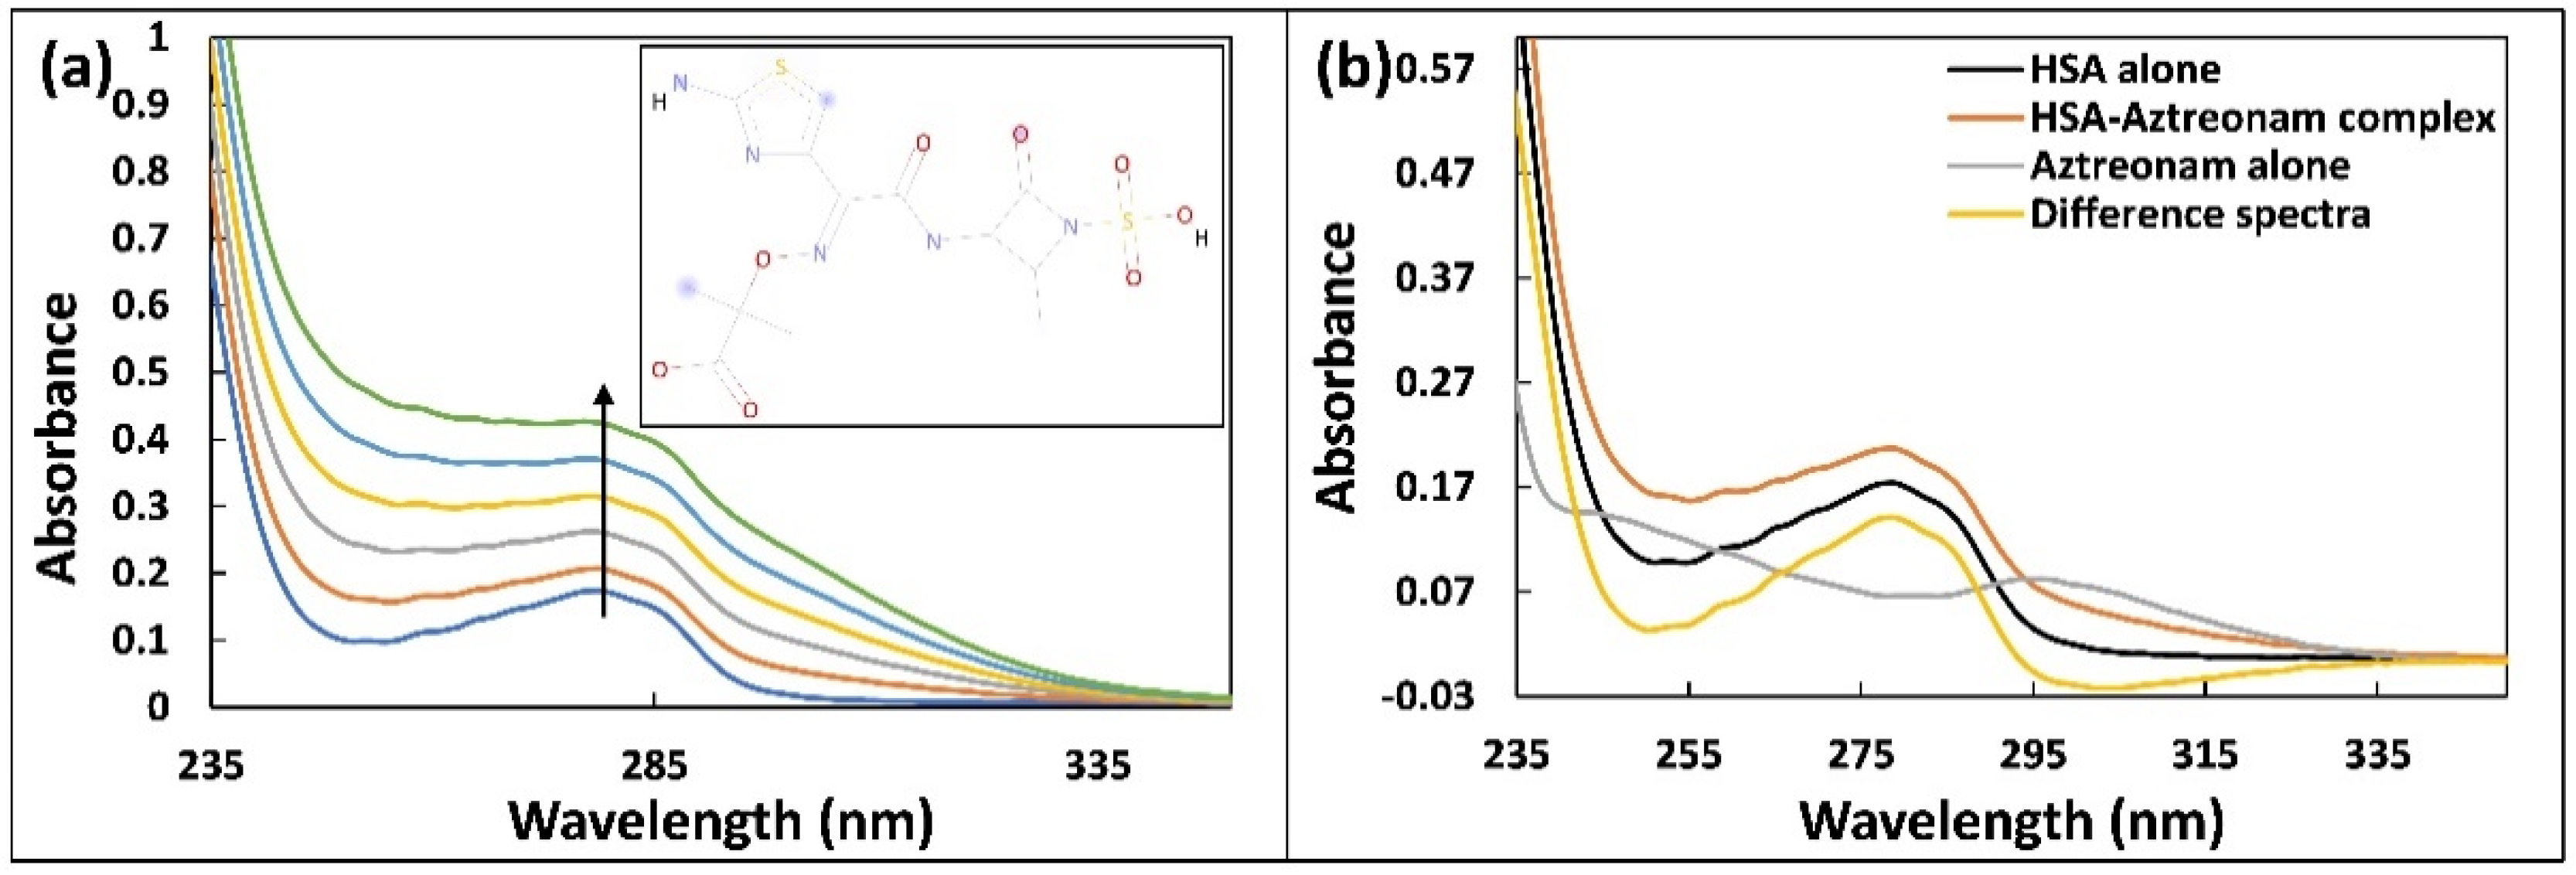
2.1. UV-Vis Absorption Spectroscopy
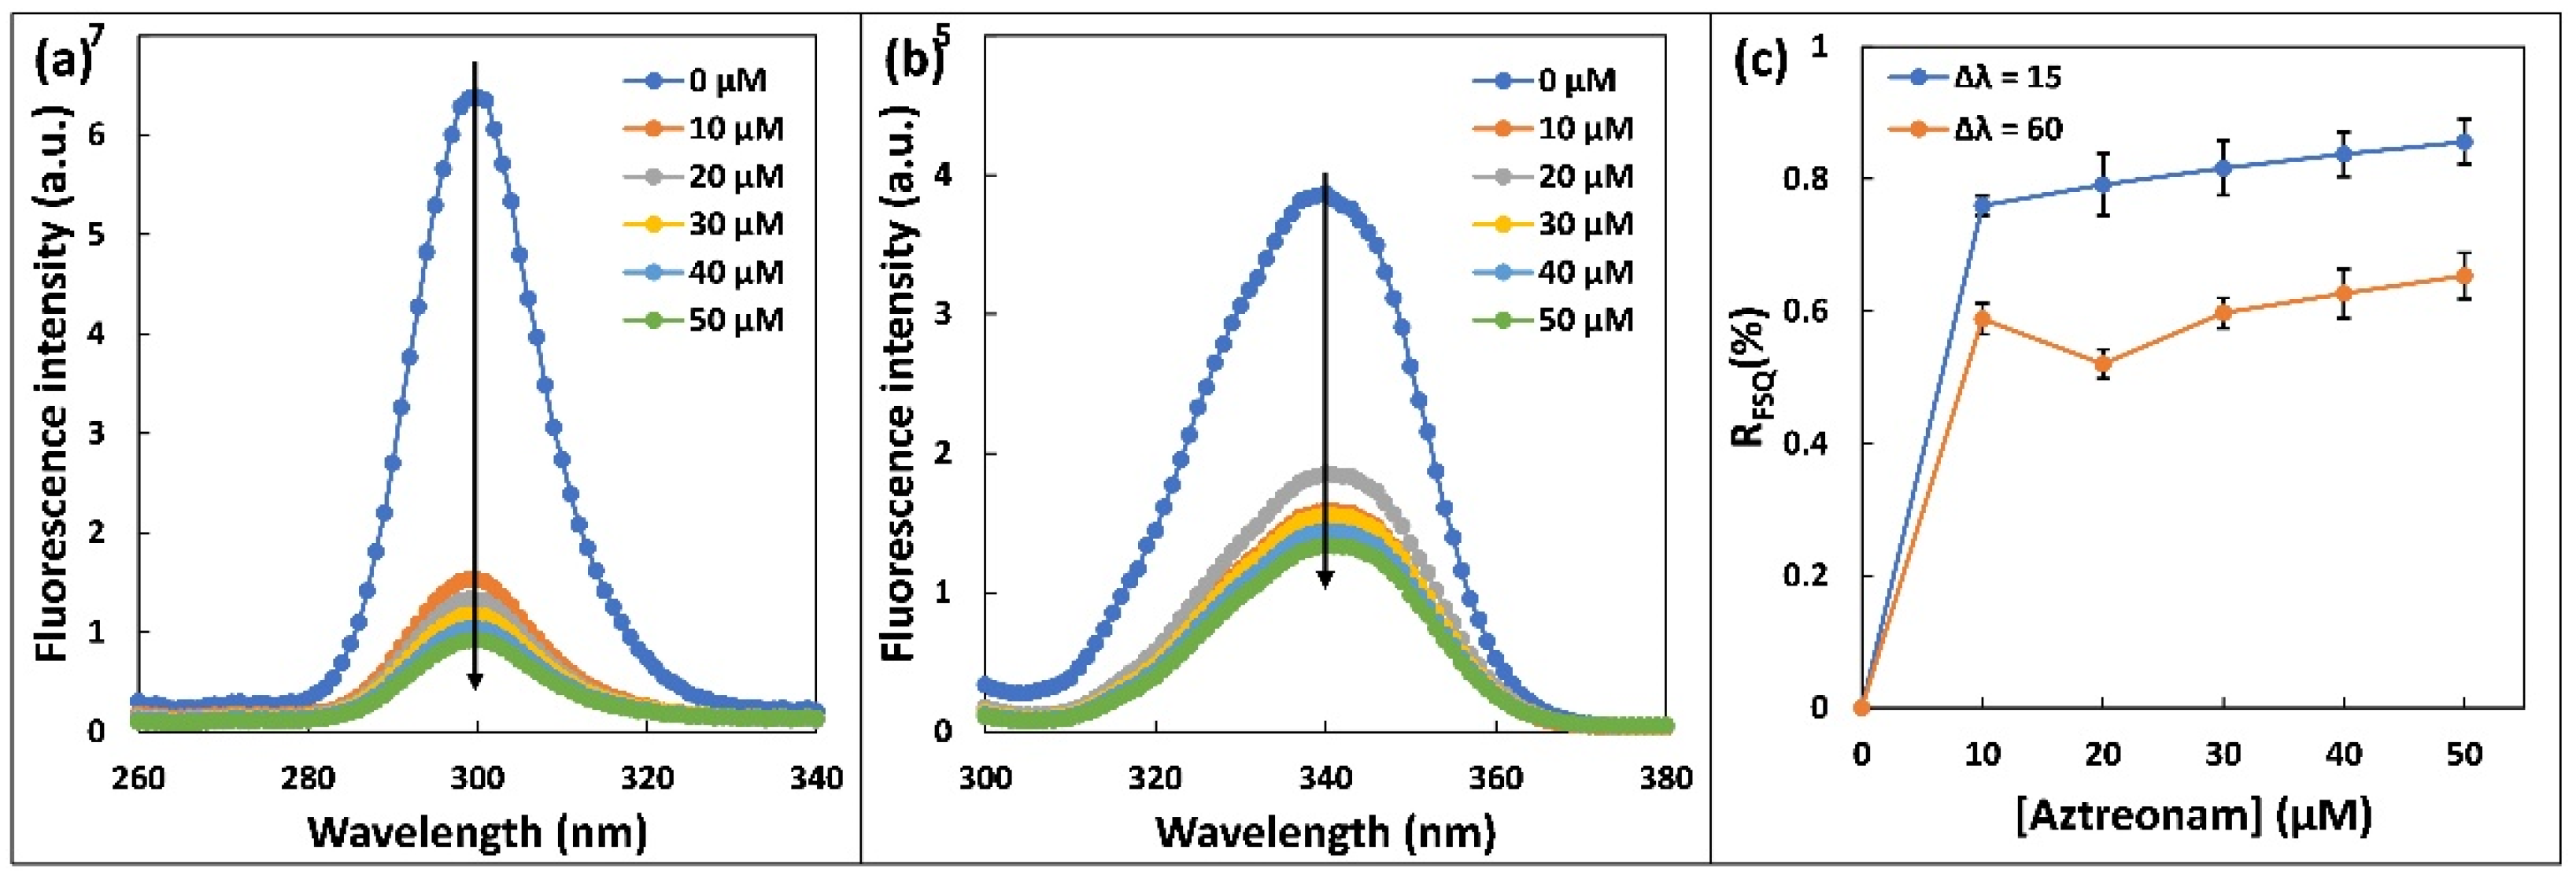
2.2. Steady State Fluorescence
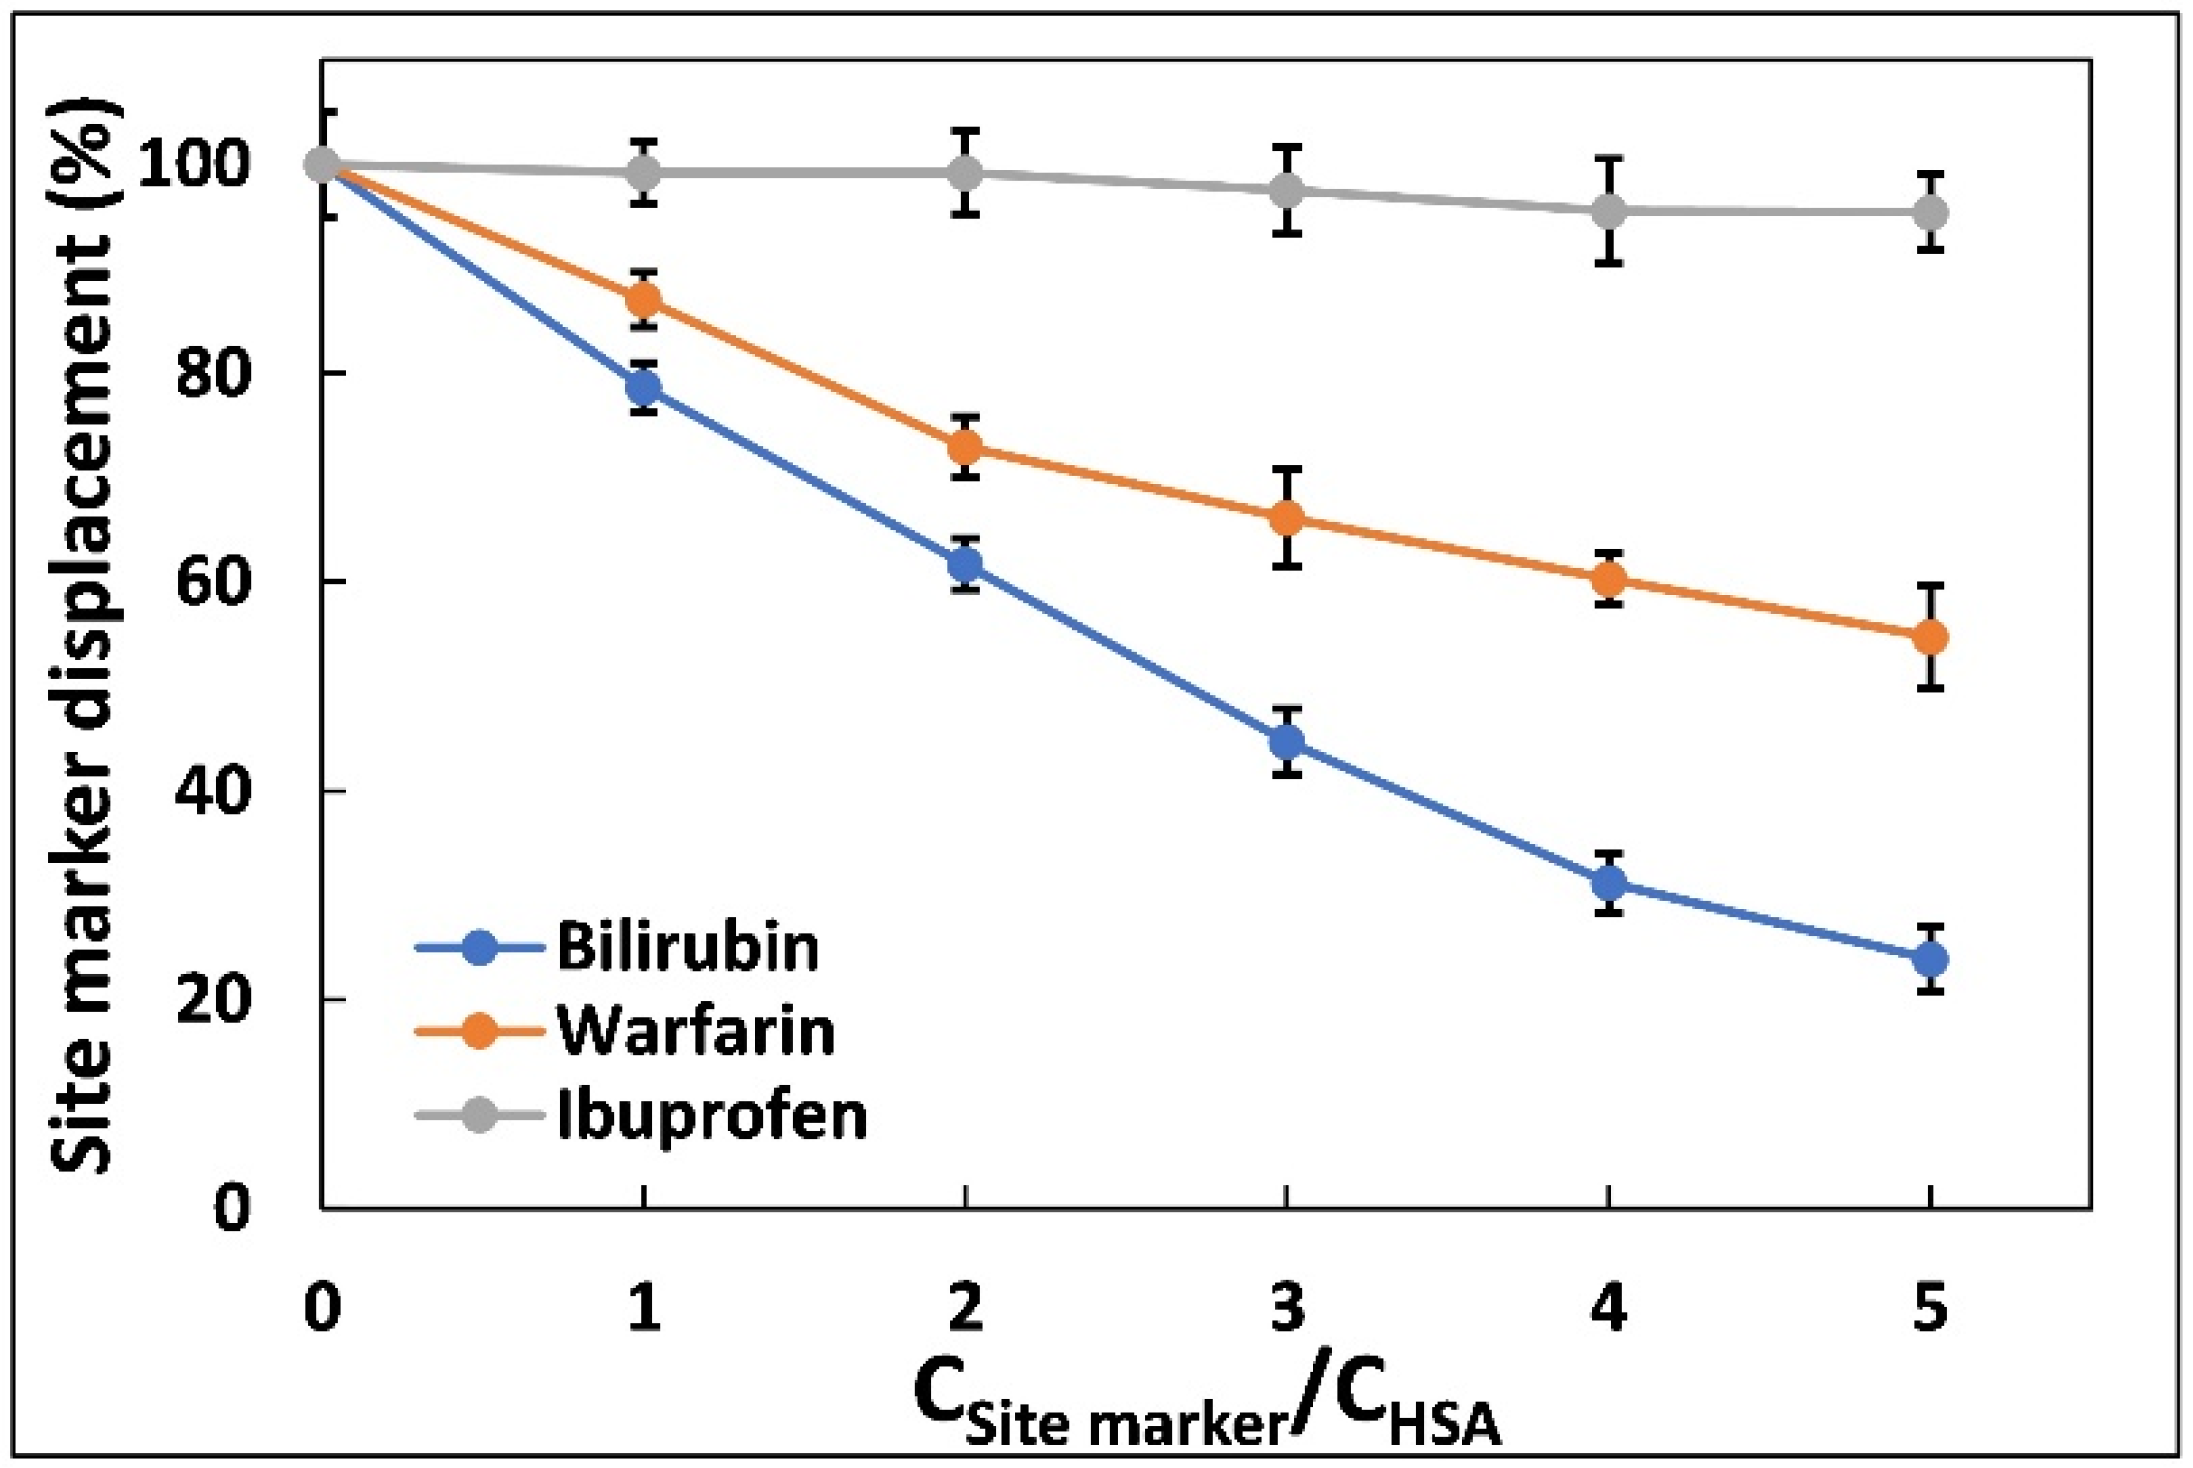
2.3. Site Marker Displacement Assay
2.4. Synchronous Fluorescence
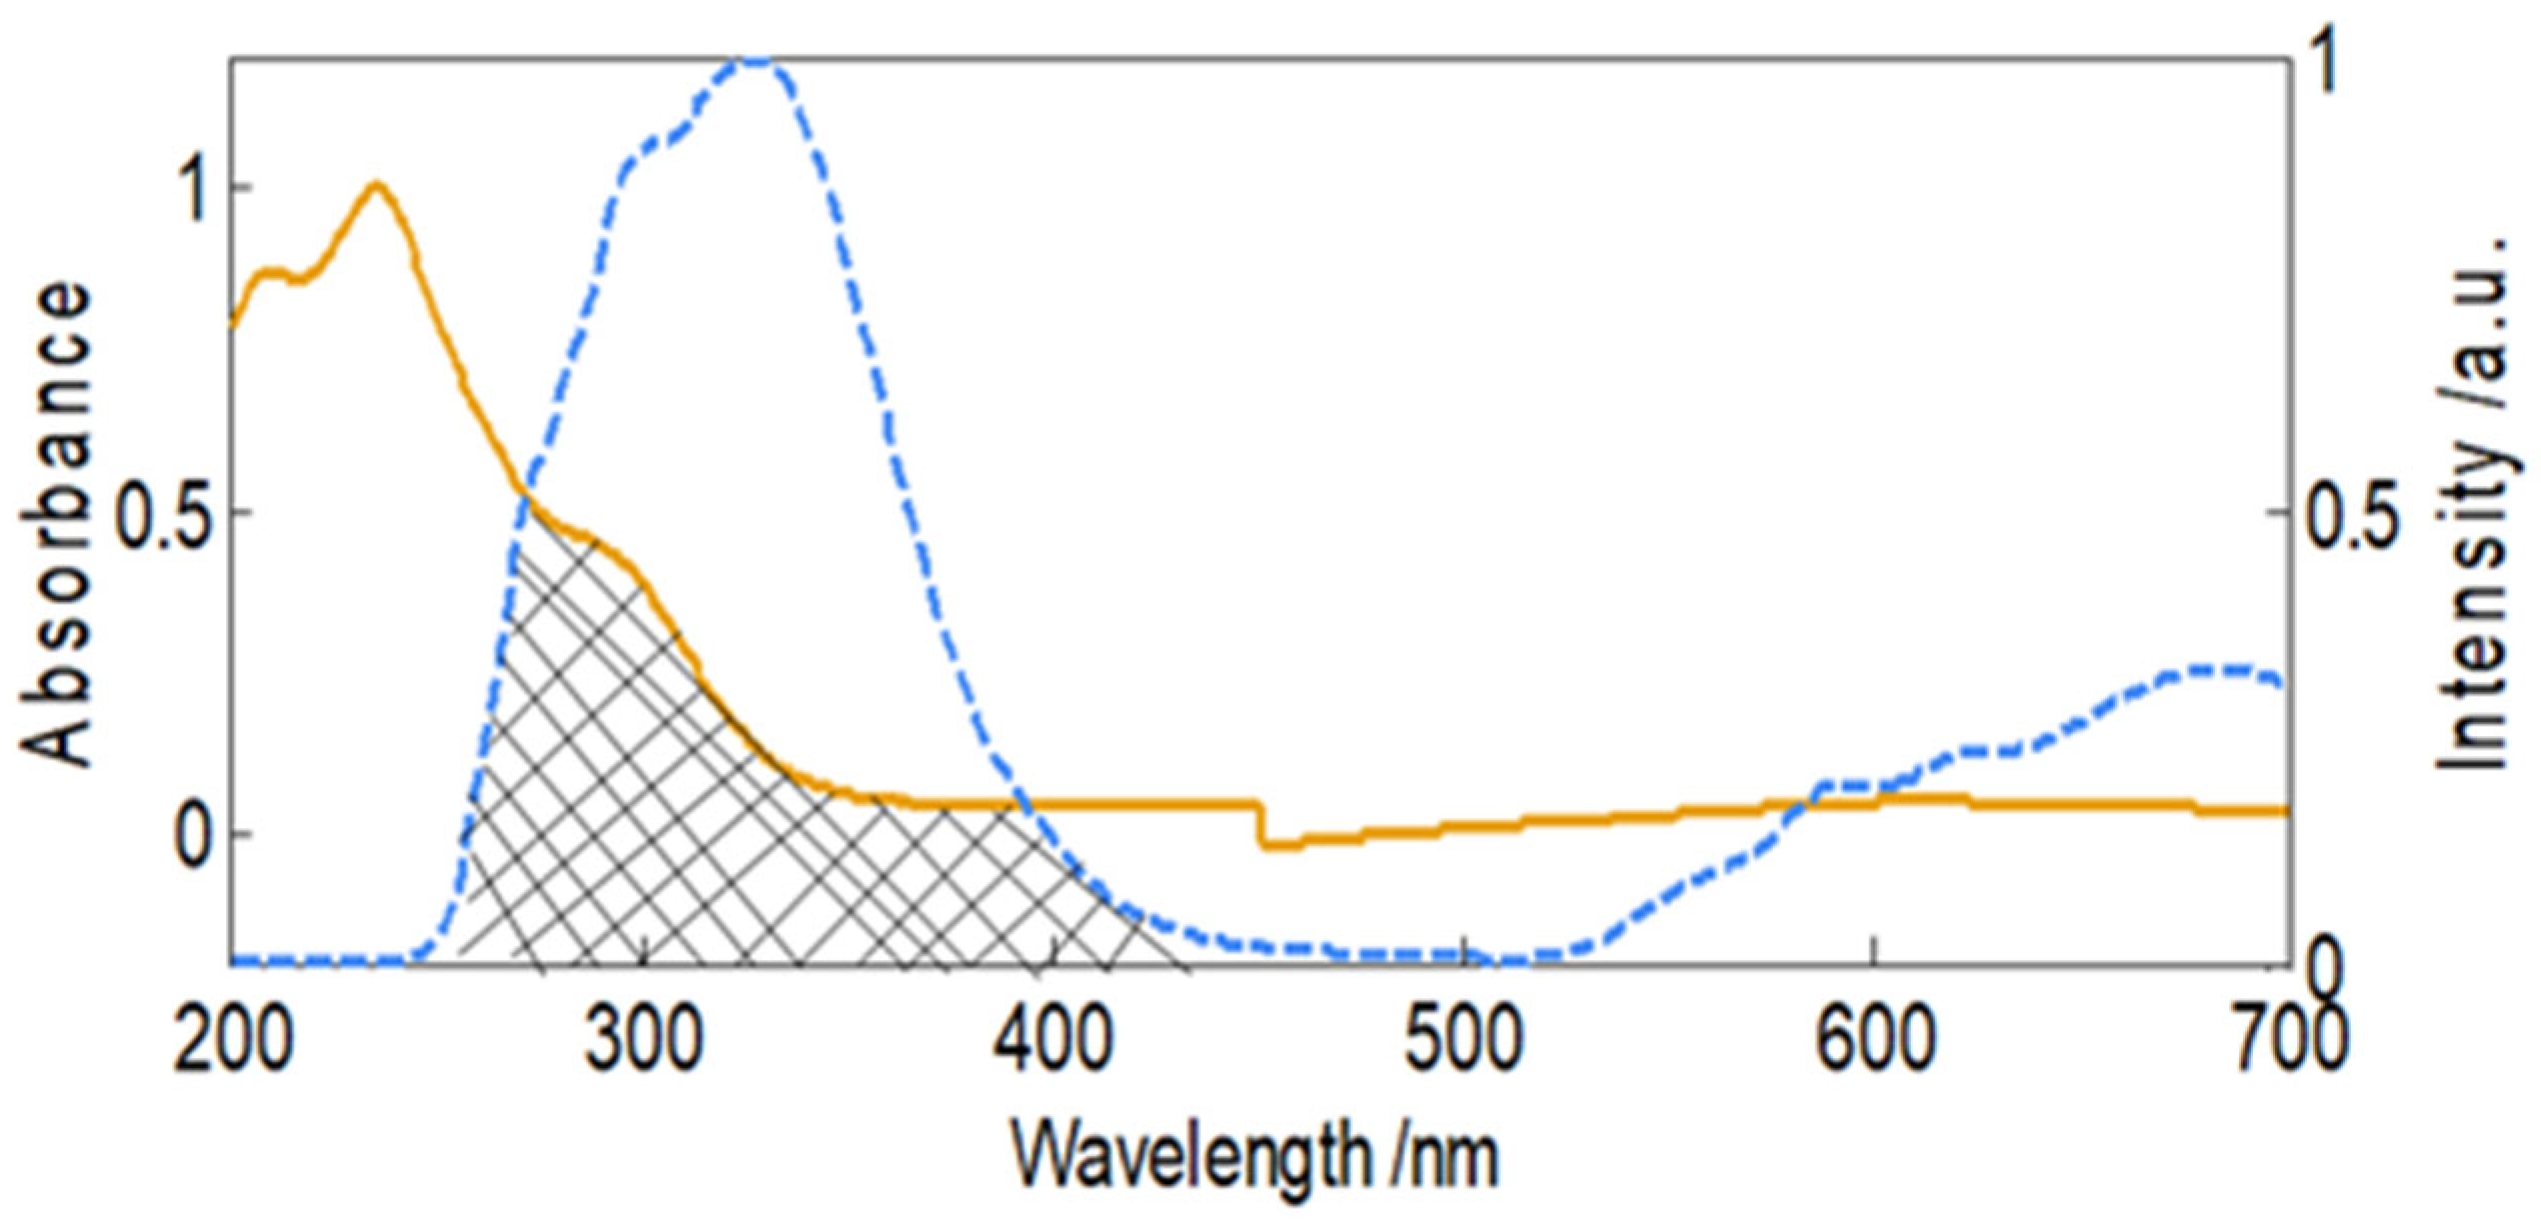
2.5. Fluorescence Resonance Energy Transfer
2.6. Three-Dimensional (3D) Fluorescence
2.7. Circular Dichroism
2.8. Molecular Docking
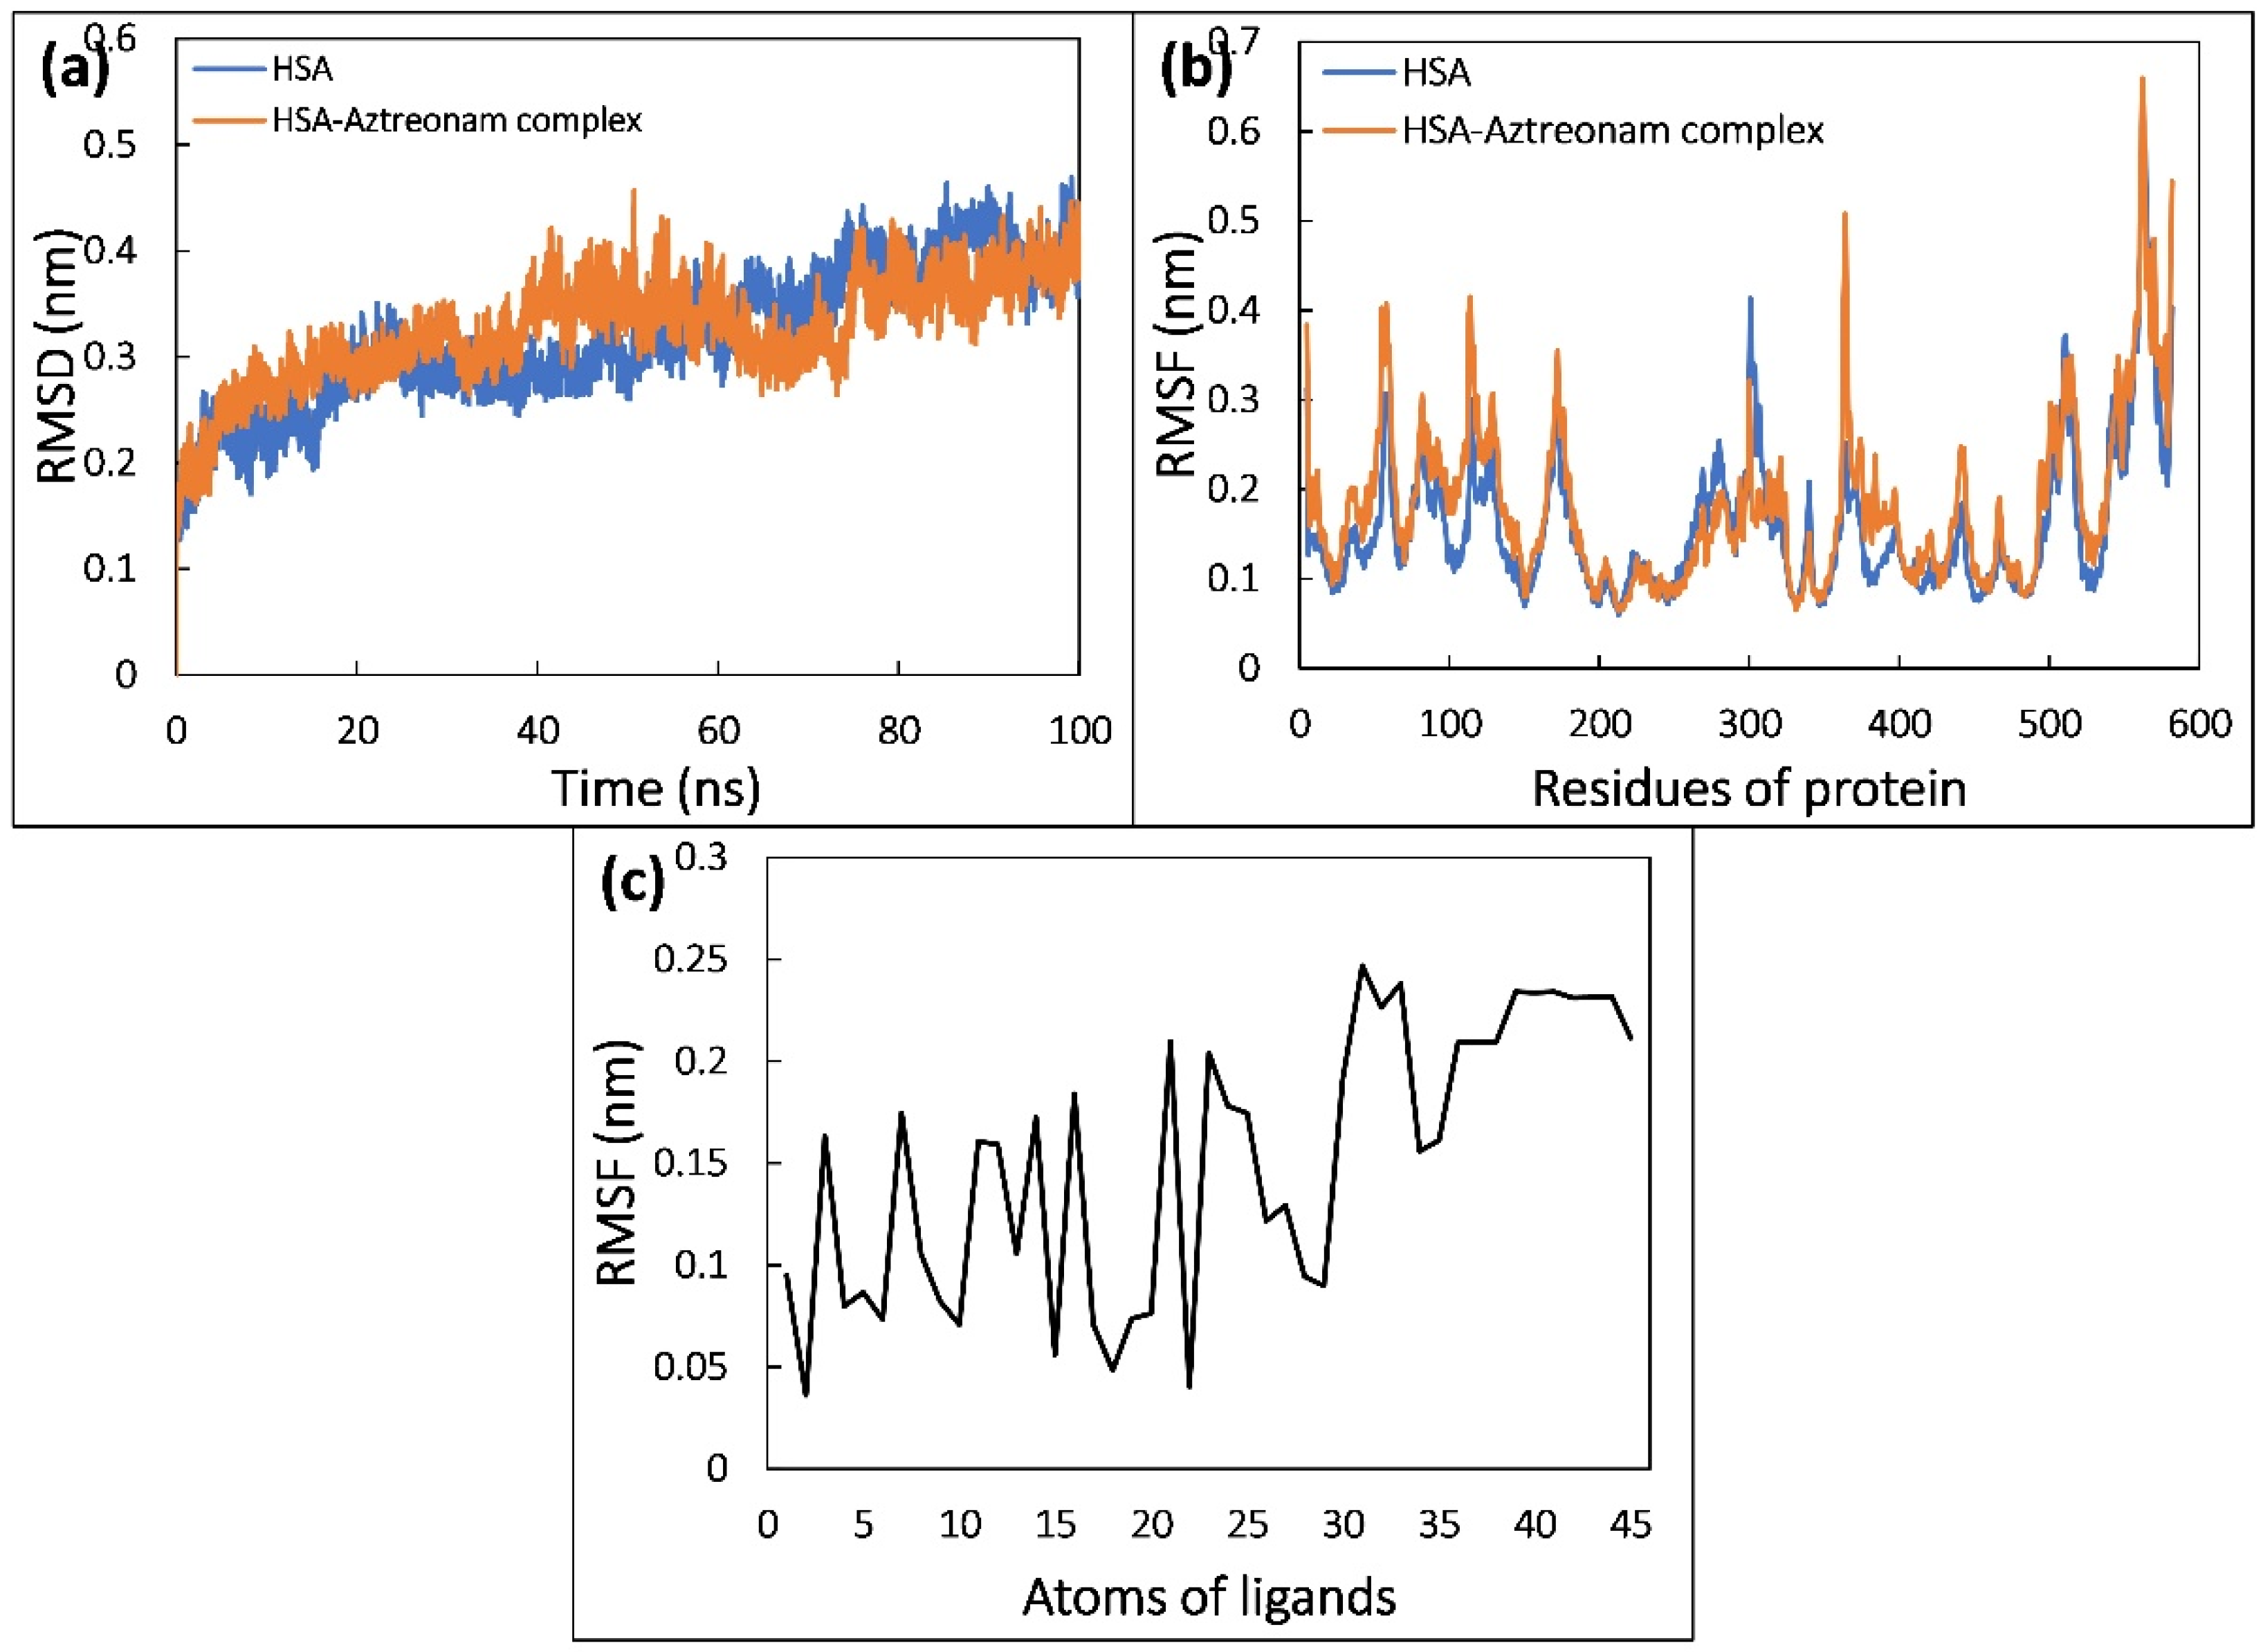
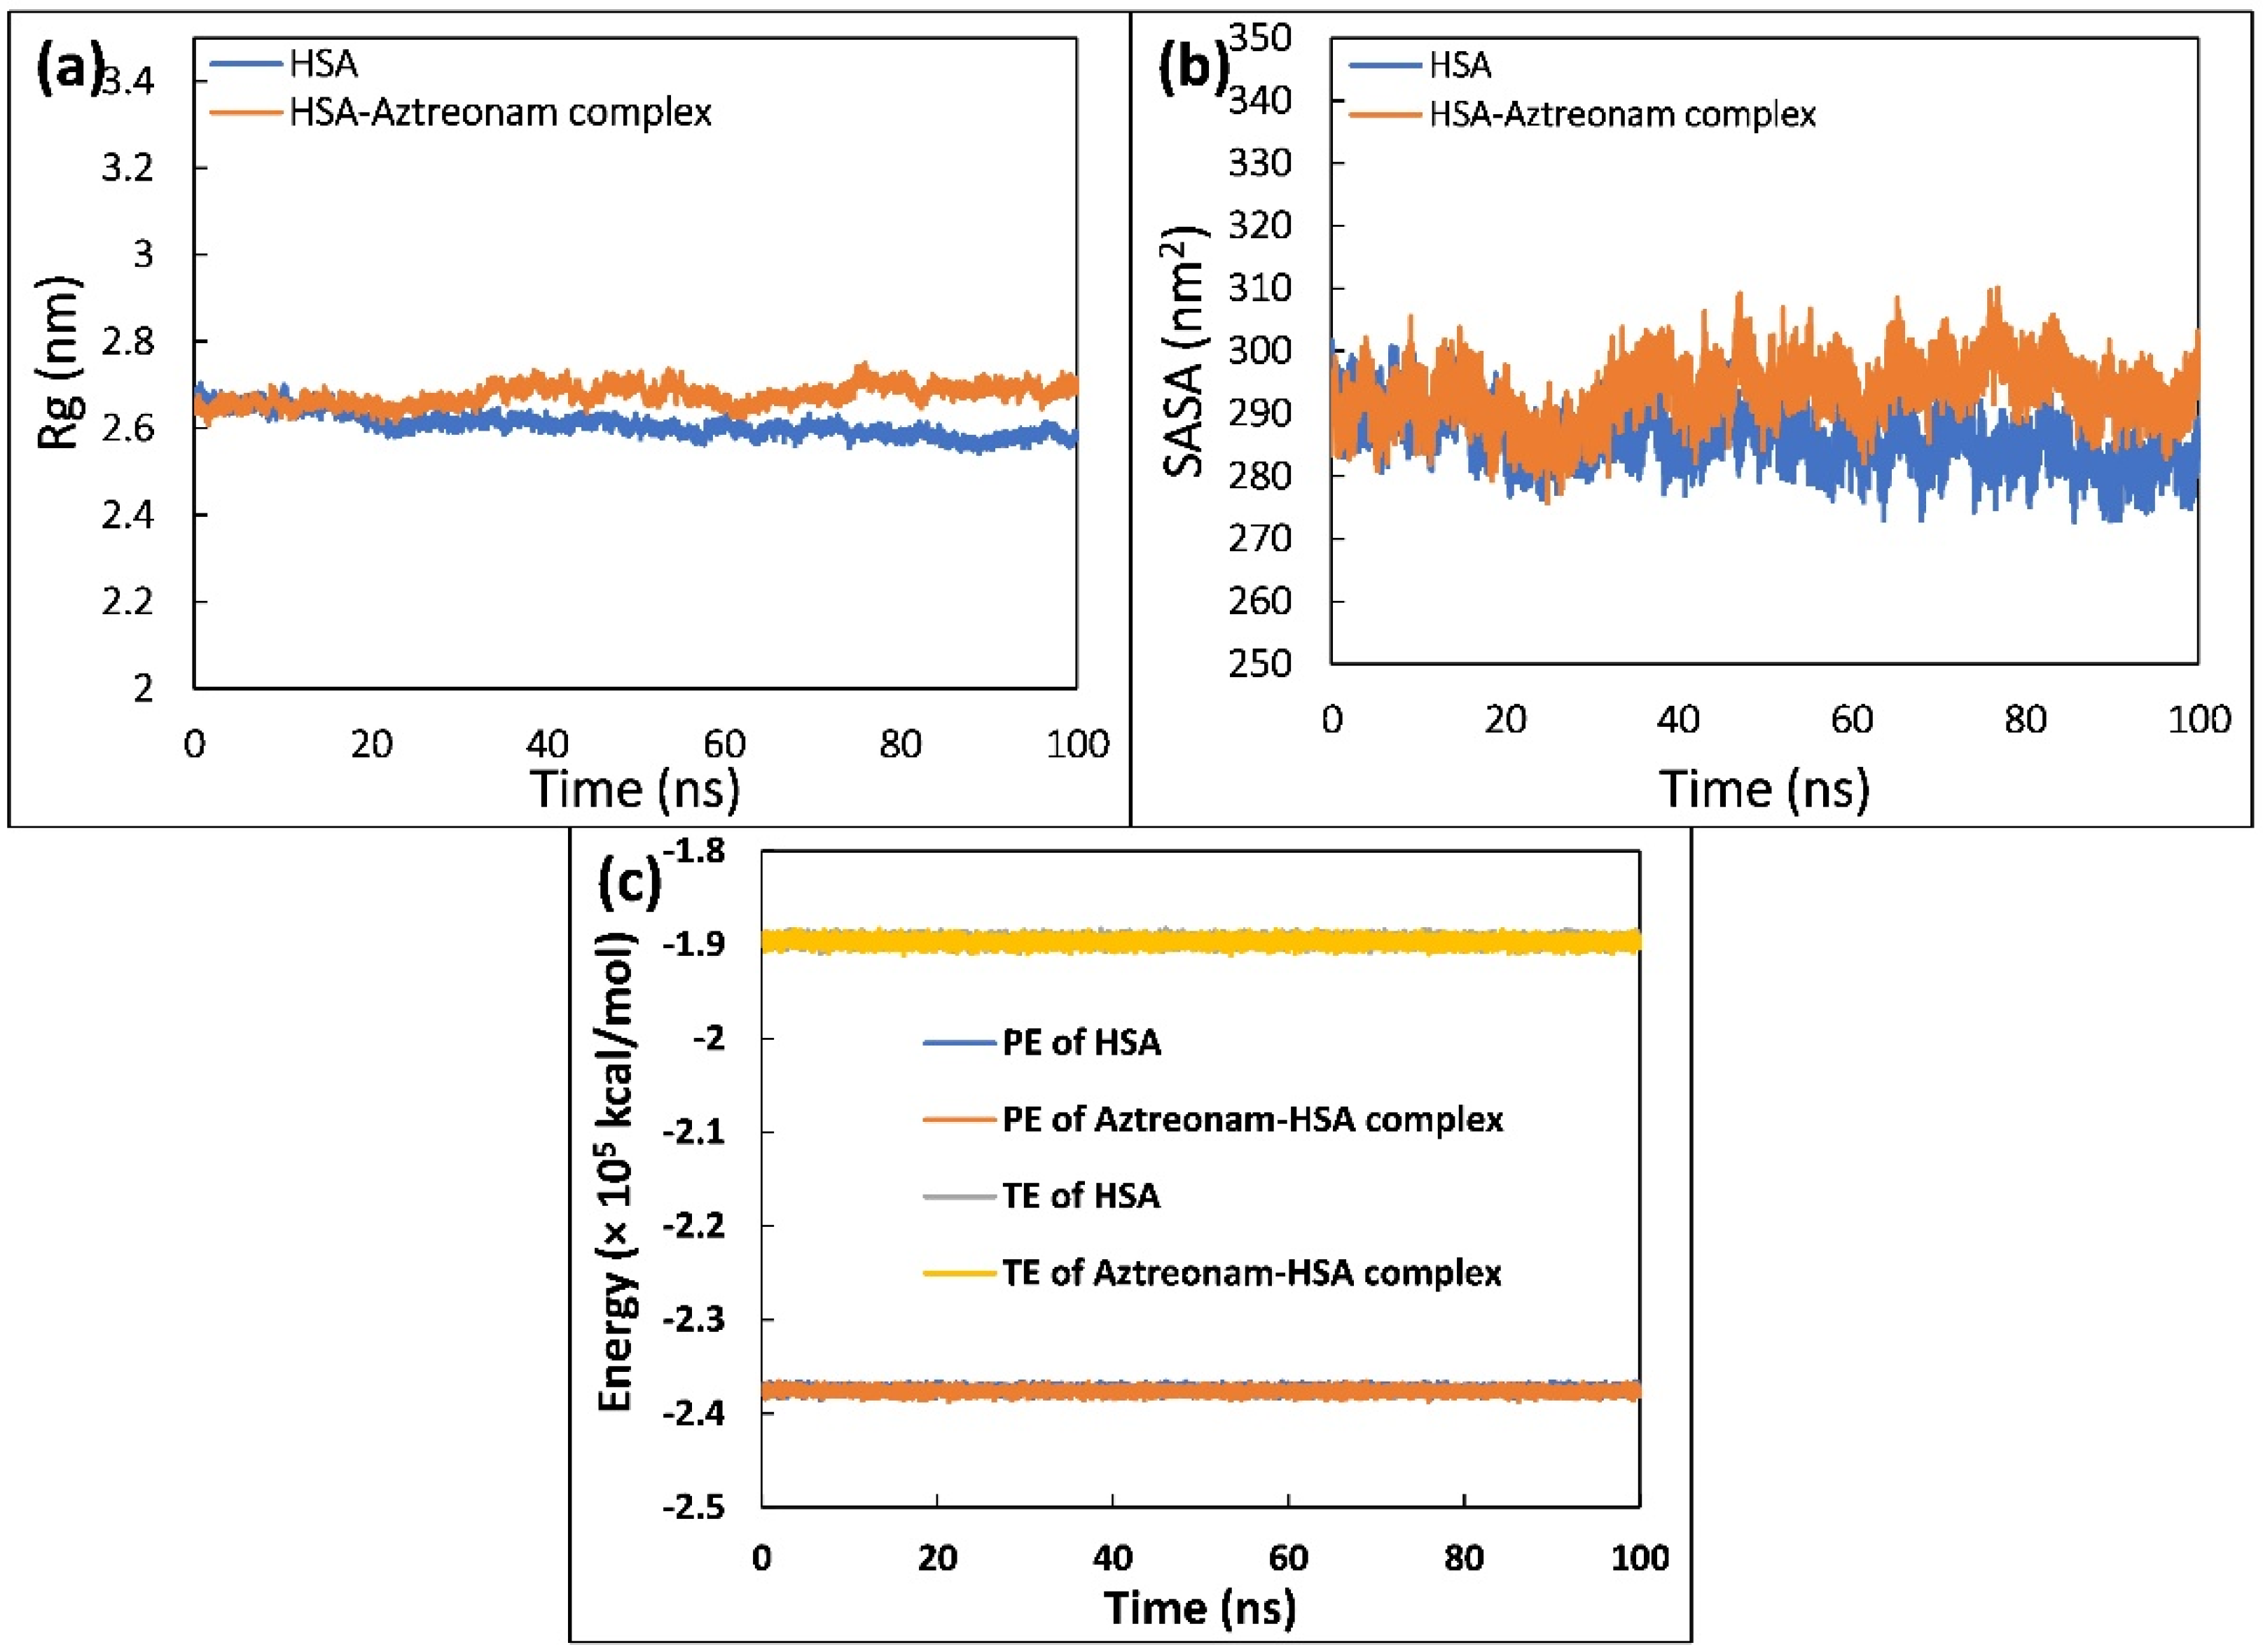
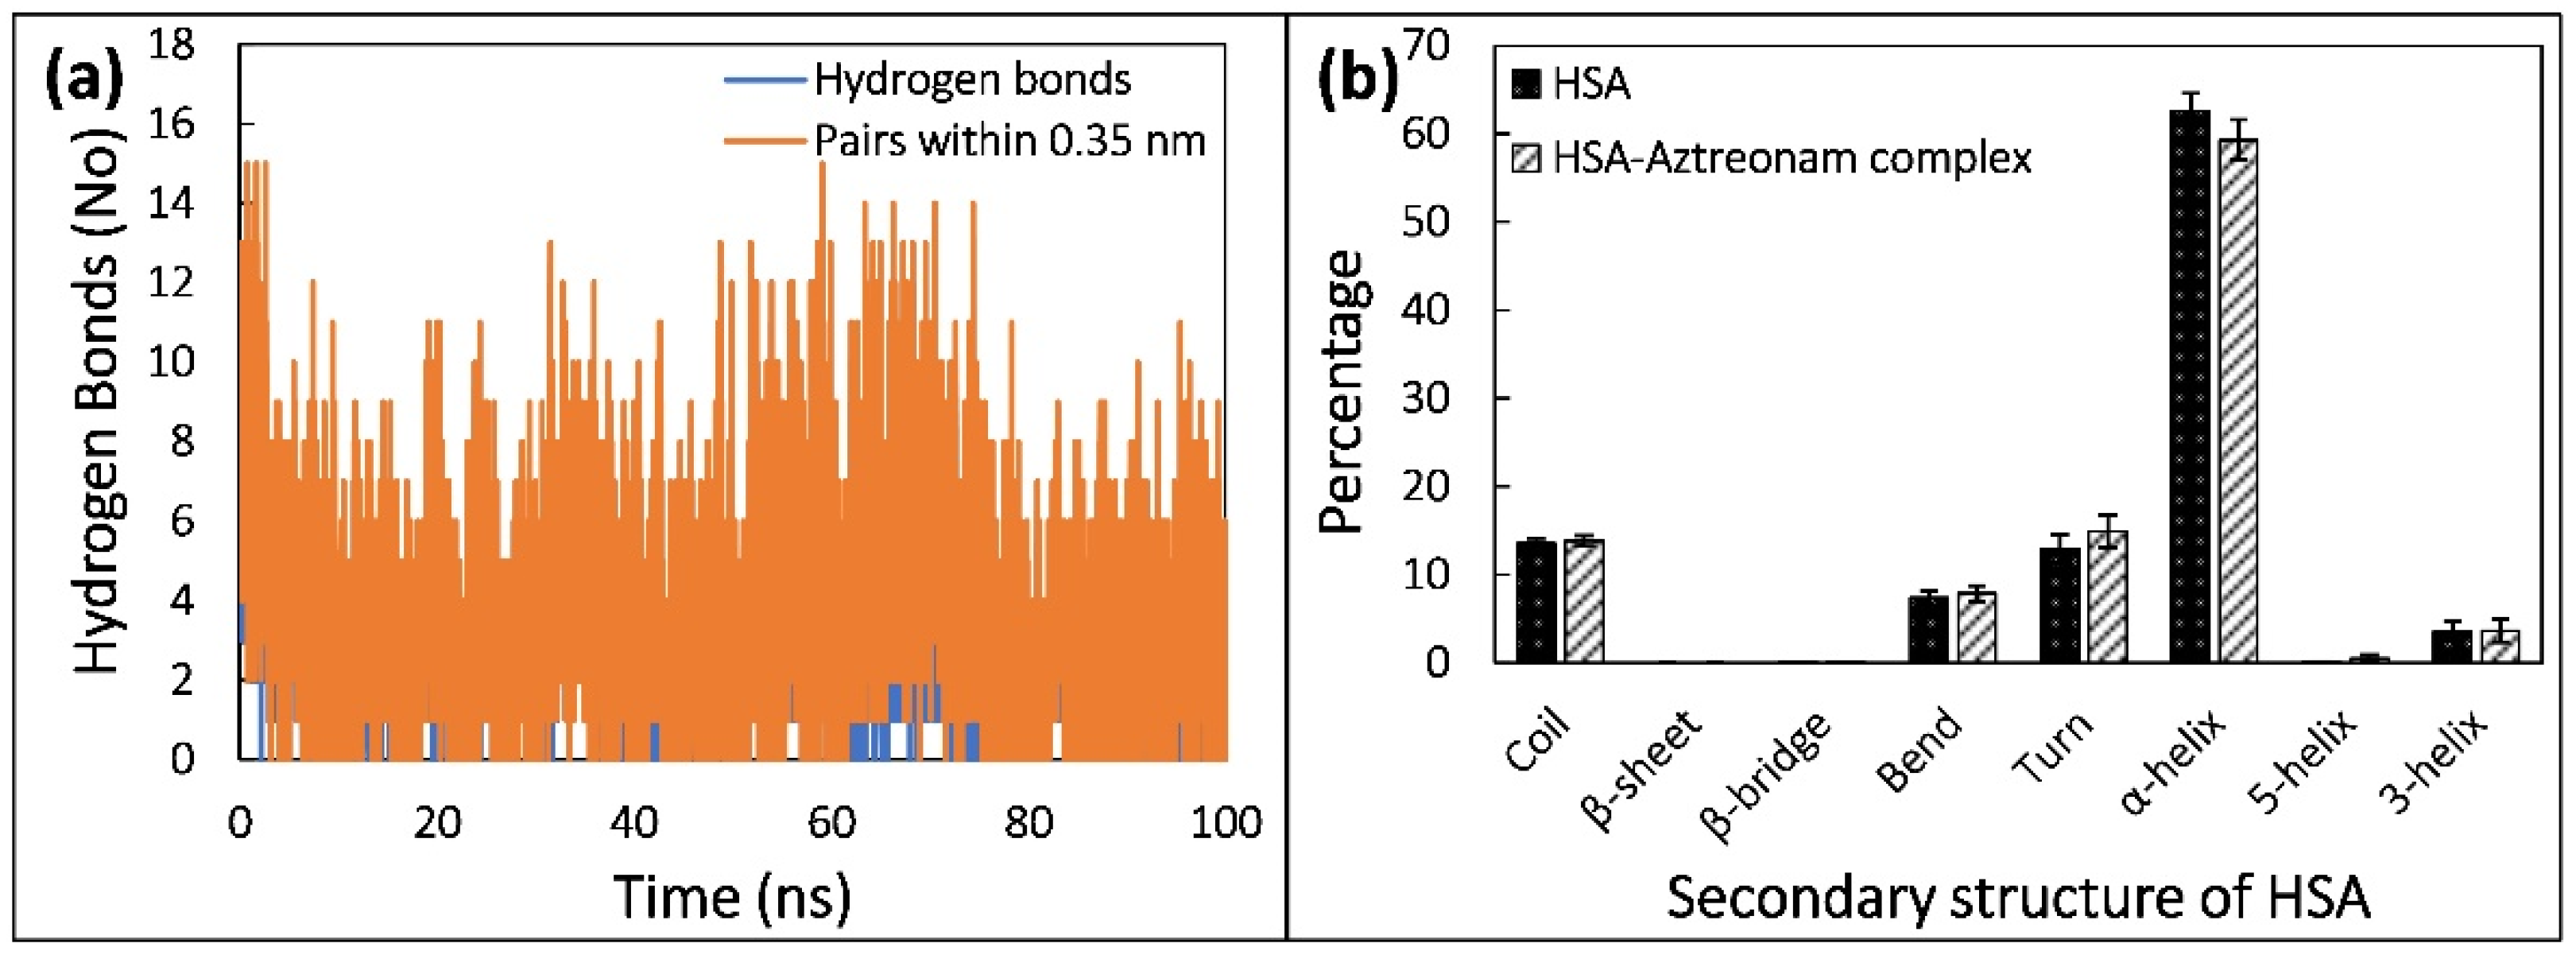
2.9. Molecular Dynamic Simulation
3. Materials and Methodology
3.1. Material
3.2. Methodology
3.2.1. UV-Vis Absorption Spectroscopic Analysis
3.2.2. Steady State Fluorescence Measurements
3.2.3. Site Marker Displacement Assays
3.2.4. 3D Fluorescence Spectroscopic Measurement
3.2.5. Circular Dichroism Spectroscopy
3.2.6. FRET (Fluorescence Resonance Energy Transfer) Measurements
3.2.7. Molecular Docking
3.2.8. Molecular Simulation
3.3. Statistical Analysis
4. Conclusions
Author Contributions
Funding
Institutional Review Board Statement
Informed Consent Statement
Data Availability Statement
Acknowledgments
Conflicts of Interest
References
- Brogden, R.N.; Heel, R.C. Aztreonam. Drugs 1986, 31, 96–130. [Google Scholar] [CrossRef] [PubMed]
- Cunha, B.A. Aztreonam. Urology 1993, 41, 249–258. [Google Scholar] [CrossRef]
- Johnson, D.H.; Cunha, B.A. Aztreonam. Med. Clin. N. Am. 1995, 79, 733–743. [Google Scholar] [CrossRef]
- Naik, K.M.; Kolli, D.B.; Nandibewoor, S.T. Elucidation of Binding Mechanism of Hydroxyurea on Serum Albumins by Different Spectroscopic Studies. Springerplus 2014, 3, 360. [Google Scholar] [CrossRef] [Green Version]
- Kragh-Hansen, U. Effects of Aliphatic Fatty Acids on the Binding of Phenol Red to Human Serum Albumin. Biochem. J. 1981, 195, 603–613. [Google Scholar] [CrossRef] [Green Version]
- Kurono, M.; Fujii, A.; Murata, M.; Fujitani, B.; Negoro, T. Stereospecific Recognition of a Spirosuccinimide Type Aldose Reductase Inhibitor (AS-3201) by Plasma Proteins: A Significant Role of Specific Binding by Serum Albumin in the Improved Potency and Stability. Biochem. Pharmacol. 2006, 71, 338–353. [Google Scholar] [CrossRef]
- Carter, D.C.; Ho, J.X. Structure of Serum Albumin. In Advances in Protein Chemistry; Academic Press: Cambridge, MA, USA, 1994; pp. 153–203. [Google Scholar]
- Shen, Q.; Wang, L.; Zhou, H.; Jiang, H.; Yu, L.; Zeng, S. Stereoselective Binding of Chiral Drugs to Plasma Proteins. Acta Pharmacol. Sin. 2013, 34, 998–1006. [Google Scholar] [CrossRef] [Green Version]
- Yamasaki, K.; Chuang, V.T.G.; Maruyama, T.; Otagiri, M. Albumin–Drug Interaction and Its Clinical Implication. Biochim. Biophys. Acta (BBA)-Gen. Subj. 2013, 1830, 5435–5443. [Google Scholar] [CrossRef]
- Jupin, M.; Michiels, P.J.; Girard, F.C.; Spraul, M.; Wijmenga, S.S. NMR Identification of Endogenous Metabolites Interacting with Fatted and Non-Fatted Human Serum Albumin in Blood Plasma: Fatty Acids Influence the HSA–Metabolite Interaction. J. Magn. Reson. 2013, 228, 81–94. [Google Scholar] [CrossRef]
- Rabbani, G.; Ahn, S.N. Structure, Enzymatic Activities, Glycation and Therapeutic Potential of Human Serum Albumin: A Natural Cargo. Int. J. Biol. Macromol. 2019, 123, 979–990. [Google Scholar] [CrossRef]
- He, X.M.; Carter, D.C. Atomic Structure and Chemistry of Human Serum Albumin. Nature 1992, 358, 209–215. [Google Scholar] [CrossRef] [PubMed] [Green Version]
- Sudlow, G.; Birkett, D.J.; Wade, D.N. The Characterization of Two Specific Drug Binding Sites on Human Serum Albumin. Mol. Pharmacol. 1975, 11, 824–832. [Google Scholar] [PubMed]
- Zsila, F. Subdomain IB Is the Third Major Drug Binding Region of Human Serum Albumin: Toward the Three-Sites Model. Mol. Pharm. 2013, 10, 1668–1682. [Google Scholar] [CrossRef]
- Abou-Zied, O.K.; Al-Lawatia, N. Exploring the Drug-Binding Site Sudlow I of Human Serum Albumin: The Role of Water and Trp214 in Molecular Recognition and Ligand Binding. ChemPhysChem 2011, 12, 270–274. [Google Scholar] [CrossRef] [PubMed]
- Trott, O.; Olson, A.J. AutoDock Vina: Improving the Speed and Accuracy of Docking with a New Scoring Function, Efficient Optimization, and Multithreading. J. Comput. Chem. 2009, 31, 455–461. [Google Scholar] [CrossRef] [Green Version]
- Morris, G.M.; Goodsell, D.S.; Halliday, R.S.; Huey, R.; Hart, W.E.; Belew, R.K.; Olson, A.J. Automated Docking Using a Lamarckian Genetic Algorithm and an Empirical Binding Free Energy Function. J. Comput. Chem. 1998, 19, 1639–1662. [Google Scholar] [CrossRef]
- Sousa da Silva, A.W.; Vranken, W.F. ACPYPE—AnteChamber PYthon Parser InterfacE. BMC Res. Notes 2012, 5, 367. [Google Scholar] [CrossRef] [Green Version]
- Kumari, R.; Kumar, R.; Lynn, A. G_mmpbsa—A GROMACS Tool for High-Throughput MM-PBSA Calculations. J. Chem. Inf. Model. 2014, 54, 1951–1962. [Google Scholar] [CrossRef]
- Rabbani, G.; Baig, M.; Jan, A.; Lee, E.; Khan, M. Binding of Erucic Acid with Human Serum Albumin Using a Spectroscopic and Molecular Docking Study. Int. J. 2017, 105, 1572–1580. [Google Scholar] [CrossRef]
- Afrin, S.; Rahman, Y.; Tabish, M. Elucidating the Interaction of Ticlopidine with Serum Albumin and Its Role in Bilirubin Displacement in Vitro. J. Biomol. Struct. Dyn. 2019, 37, 863–876. [Google Scholar] [CrossRef]
- Rahman, Y.; Afrin, S.; Tabish, M. Interaction of Pirenzepine with Bovine Serum Albumin and Effect of β-Cyclodextrin on Binding: A Biophysical and Molecular Docking Approach. Arch. Biochem. Biophys. 2018, 652, 27–37. [Google Scholar] [CrossRef] [PubMed]
- Suryawanshi, V.D.; Walekar, L.S.; Gore, A.H.; Anbhule, P.V.; Kolekar, G.B. Spectroscopic Analysis on the Binding Interaction of Biologically Active Pyrimidine Derivative with Bovine Serum Albumin. J. Pharm. Anal. 2016, 6, 56–63. [Google Scholar] [CrossRef] [PubMed] [Green Version]
- Kandagal, P.B.B.; Ashoka, S.; Seetharamappa, J.; Shaikh, S.M.T.M.T.; Jadegoud, Y.; Ijare, O.B.B. Study of the Interaction of an Anticancer Drug with Human and Bovine Serum Albumin: Spectroscopic Approach. J. Pharm. Biomed. Anal. 2006, 41, 393–399. [Google Scholar] [CrossRef]
- Wang, Y.-Q.; Zhang, H.-M.; Zhang, G.-C.; Tao, W.-H.; Tang, S.-H. Binding of Brucine to Human Serum Albumin. J. Mol. Struct. 2007, 830, 40–45. [Google Scholar] [CrossRef]
- Lakowicz, J.R. (Ed.) Principles of Fluorescence Spectroscopy; Springer: Boston, MA, USA, 2006; ISBN 978-0-387-31278-1. [Google Scholar]
- Ibrahim, N.; Ibrahim, H.; Kim, S.; Nallet, J.-P.; Nepveu, F. Interactions between Antimalarial Indolone-N-Oxide Derivatives and Human Serum Albumin. Biomacromolecules 2010, 11, 3341–3351. [Google Scholar] [CrossRef] [PubMed]
- Singh, B.; Bansal, S. In Vitro Protein Binding Studies on Aztreonam: Temperature Effects and Thermodynamics. Indian J. Pharm. Sci. 1998, 60, 270–274. [Google Scholar]
- Dockal, M.; Carter, D.C.; Rüker, F. The Three Recombinant Domains of Human Serum Albumin. J. Biol. Chem. 1999, 274, 29303–29310. [Google Scholar] [CrossRef] [Green Version]
- Trynda-Lemiesz, L. Paclitaxel–HSA Interaction. Binding Sites on HSA Molecule. Bioorg. Med. Chem. 2004, 12, 3269–3275. [Google Scholar] [CrossRef]
- Ni, Y.; Zhang, X.; Kokot, S. Spectrometric and Voltammetric Studies of the Interaction between Quercetin and Bovine Serum Albumin Using Warfarin as Site Marker with the Aid of Chemometrics. Spectrochim. Acta Part A Mol. Biomol. Spectrosc. 2009, 71, 1865–1872. [Google Scholar] [CrossRef]
- Siddiqui, S.; Mujeeb, A.; Ameen, F.; Ishqi, H.M.; Rehman, S.U.; Tabish, M. Investigating the Mechanism of Binding of Nalidixic Acid with Deoxyribonucleic Acid and Serum Albumin: A Biophysical and Molecular Docking Approaches. J. Biomol. Struct. Dyn. 2021, 39, 570–585. [Google Scholar] [CrossRef]
- Chen, Y.-C.; Wang, H.-M.; Niu, Q.-X.; Ye, D.-Y.; Liang, G.-W. Binding between Saikosaponin C and Human Serum Albumin by Fluorescence Spectroscopy and Molecular Docking. Molecules 2016, 21, 153. [Google Scholar] [CrossRef] [PubMed]
- Jing, J.; Qu, X.; Tu, Z.; Zheng, C.; Zheng, Z. Spectroscopic Investigations of the Interaction of the Anti-Hypertension Drug Valsartan with Human Serum Albumin. Mol. Med. Rep. 2014, 9, 2191–2196. [Google Scholar] [CrossRef] [PubMed] [Green Version]
- Grigoryan, K.R.; Aznauryan, M.G.; Bagramyan, N.A.; Gevorkyan, L.G.; Markaryan, S.A. Spectroscopic Determination of Binding between Human Serum Albumin and a Platinum(II) Dimethylsulfoxide Complex. J. Appl. Spectrosc. 2008, 75, 593–596. [Google Scholar] [CrossRef]
- Siddiqui, S.; Ameen, F.; Kausar, T.; Nayeem, S.M.; Ur Rehman, S.; Tabish, M. Biophysical Insight into the Binding Mechanism of Doxofylline to Bovine Serum Albumin: An in Vitro and in Silico Approach. Spectrochim. Acta Part A Mol. Biomol. Spectrosc. 2021, 249, 119296. [Google Scholar] [CrossRef]
- Qureshi, M.A.; Javed, S. Aflatoxin B 1 Induced Structural and Conformational Changes in Bovine Serum Albumin: A Multispectroscopic and Circular Dichroism-Based Study. ACS Omega 2021, 6, 18054–18064. [Google Scholar] [CrossRef]
- Yang, H.; Huang, Y.; Liu, J.; Tang, P.; Sun, Q.; Xiong, X.; Tang, B.; He, J.; Li, H. Binding Modes of Environmental Endocrine Disruptors to Human Serum Albumin: Insights from STD-NMR, ITC, Spectroscopic and Molecular Docking Studies. Sci. Rep. 2017, 7, 11126. [Google Scholar] [CrossRef] [Green Version]
- Huang, S.; Qiu, H.; Lu, S.; Zhu, F.; Xiao, Q. Study on the Molecular Interaction of Graphene Quantum Dots with Human Serum Albumin: Combined Spectroscopic and Electrochemical Approaches. J. Hazard. Mater. 2015, 285, 18–26. [Google Scholar] [CrossRef]
- Salem, A.A.; Lotfy, M.; Amin, A.; Ghattas, M.A. Characterization of Human Serum Albumin’s Interactions with Safranal and Crocin Using Multi-Spectroscopic and Molecular Docking Techniques. Biochem. Biophys. Rep. 2019, 20, 100670. [Google Scholar] [CrossRef]
- Zhang, Y.; Yue, Y.; Li, J.; Chen, X. Studies on the Interaction of Caffeic Acid with Human Serum Albumin in Membrane Mimetic Environments. J. Photochem. Photobiol. B Biol. 2008, 90, 141–151. [Google Scholar] [CrossRef]
- Alam, M.M.; Qais, F.A.; Ahmad, I.; Alam, P.; Hasan Khan, R.; Naseem, I. Multi-Spectroscopic and Molecular Modelling Approach to Investigate the Interaction of Riboflavin with Human Serum Albumin. J. Biomol. Struct. Dyn. 2018, 36, 795–809. [Google Scholar] [CrossRef]
- Baig, M.; Rahman, S.; Rabbani, G.; Imran, M.; Ahmad, K.; Choi, I. Multi-Spectroscopic Characterization of Human Serum Albumin Binding with Cyclobenzaprine Hydrochloride: Insights from Biophysical and In Silico Approaches. Int. J. Mol. Sci. 2019, 20, 662. [Google Scholar] [CrossRef]
- Micsonai, A.; Wien, F.; Bulyáki, É.; Kun, J.; Moussong, É.; Lee, Y.-H.; Goto, Y.; Réfrégiers, M.; Kardos, J. BeStSel: A Web Server for Accurate Protein Secondary Structure Prediction and Fold Recognition from the Circular Dichroism Spectra. Nucleic Acids Res. 2018, 46, W315–W322. [Google Scholar] [CrossRef] [PubMed]
- Seedher, N.; Agarwal, P. Complexation of Fluoroquinolone Antibiotics with Human Serum Albumin: A Fluorescence Quenching Study. J. Lumin. 2010, 130, 1841–1848. [Google Scholar] [CrossRef]
- Rohs, R. Molecular Flexibility in Ab Initio Drug Docking to DNA: Binding-Site and Binding-Mode Transitions in All-Atom Monte Carlo Simulations. Nucleic Acids Res. 2005, 33, 7048–7057. [Google Scholar] [CrossRef] [PubMed] [Green Version]
- Elokely, K.M.; Doerksen, R.J. Docking Challenge: Protein Sampling and Molecular Docking Performance. J. Chem. Inf. Model. 2013, 53, 1934–1945. [Google Scholar] [CrossRef] [Green Version]
- Narwal, M.; Kumar, D.; Mukherjee, T.K.; Bhattacharyya, R.; Banerjee, D. Molecular Dynamics Simulation as a Tool for Assessment of Drug Binding Property of Human Serum Albumin. Mol. Biol. Rep. 2018, 45, 1647–1652. [Google Scholar] [CrossRef]
- Saeed, A.; Ejaz, S.A.; Sarfraz, M.; Tamam, N.; Siddique, F.; Riaz, N.; Qais, F.A.; Chtita, S.; Iqbal, J. Discovery of Phenylcarbamoylazinane-1,2,4-Triazole Amides Derivatives as the Potential Inhibitors of Aldo-Keto Reductases (AKR1B1 & AKRB10): Potential Lead Molecules for Treatment of Colon Cancer. Molecules 2022, 27, 3981. [Google Scholar] [CrossRef]
- Rath, B.; Abul Qais, F.; Patro, R.; Mohapatra, S.; Sharma, T. Design, Synthesis and Molecular Modeling Studies of Novel Mesalamine Linked Coumarin for Treatment of Inflammatory Bowel Disease. Bioorg. Med. Chem. Lett. 2021, 41, 128029. [Google Scholar] [CrossRef]
- Nabi, F.; Ahmad, O.; Khan, Y.A.; Nabi, A.; Md Amiruddin, H.; Abul Qais, F.; Masroor, A.; Hisamuddin, M.; Uversky, V.N.; Khan, R.H. Computational Studies on Phylogeny and Drug Designing Using Molecular Simulations for COVID-19. J. Biomol. Struct. Dyn. 2021, 1–10. [Google Scholar] [CrossRef]
- Khan, M.S.; Qais, F.A.; Rehman, M.T.; Ismail, M.H.; Alokail, M.S.; Altwaijry, N.; Alafaleq, N.O.; AlAjmi, M.F.; Salem, N.; Alqhatani, R. Mechanistic Inhibition of Non-Enzymatic Glycation and Aldose Reductase Activity by Naringenin: Binding, Enzyme Kinetics and Molecular Docking Analysis. Int. J. Biol. Macromol. 2020, 159, 87–97. [Google Scholar] [CrossRef]
- Alhumaydhi, F.A.; Aljasir, M.A.; Aljohani, A.S.M.; Alsagaby, S.A.; Alwashmi, A.S.S.; Shahwan, M.; Hassan, M.I.; Islam, A.; Shamsi, A. Probing the Interaction of Memantine, an Important Alzheimer’s Drug, with Human Serum Albumin: In Silico and in Vitro Approach. J. Mol. Liq. 2021, 340, 116888. [Google Scholar] [CrossRef]
- Siddiqui, S.; Ameen, F.; Jahan, I.; Nayeem, S.M.; Tabish, M. A Comprehensive Spectroscopic and Computational Investigation on the Binding of the Anti-Asthmatic Drug Triamcinolone with Serum Albumin. New J. Chem. 2019, 43, 4137–4151. [Google Scholar] [CrossRef]
- Ding, F.; Diao, J.-X.; Sun, Y.; Sun, Y. Bioevaluation of Human Serum Albumin–Hesperidin Bioconjugate: Insight into Protein Vector Function and Conformation. J. Agric. Food Chem. 2012, 60, 7218–7228. [Google Scholar] [CrossRef]
- Chtita, S.; Belaidi, S.; Qais, F.A.; Ouassaf, M.; AlMogren, M.M.; Al-Zahrani, A.A.; Bakhouch, M.; Belhassan, A.; Zaki, H.; Bouachrine, M.; et al. Unsymmetrical Aromatic Disulfides as SARS-CoV-2 Mpro Inhibitors: Molecular Docking, Molecular Dynamics, and ADME Scoring Investigations. J. King Saud Univ.-Sci. 2022, 34, 102226. [Google Scholar] [CrossRef] [PubMed]
- Arcon, J.P.; Defelipe, L.A.; Modenutti, C.P.; López, E.D.; Alvarez-Garcia, D.; Barril, X.; Turjanski, A.G.; Martí, M.A. Molecular Dynamics in Mixed Solvents Reveals Protein–Ligand Interactions, Improves Docking, and Allows Accurate Binding Free Energy Predictions. J. Chem. Inf. Model. 2017, 57, 846–863. [Google Scholar] [CrossRef] [PubMed]
- Abchir, O.; Daoui, O.; Belaidi, S.; Ouassaf, M.; Qais, F.A.; ElKhattabi, S.; Belaaouad, S.; Chtita, S. Design of Novel Benzimidazole Derivatives as Potential α-Amylase Inhibitors Using QSAR, Pharmacokinetics, Molecular Docking, and Molecular Dynamics Simulation Studies. J. Mol. Model. 2022, 28, 106. [Google Scholar] [CrossRef] [PubMed]


| Peak Name | Peak Position (nm) (λex = λem) | Stokes Shift (Δλ) | HSA Alone | HSA:Aztreonam (1:6) | F/F0 |
|---|---|---|---|---|---|
| Peak ‘a’ | 280/280 | --------- | 901,452.3 | 410,424.5 | 0.455 |
| Peak ‘b’ | 280/540 | --------- | 34,550.4 | 8556.4 | 0.248 |
| Peak ‘1′ | 280/340 | 60 | 135,692.1 | 119,887.8 | 0.884 |
| Peak ‘2′ | 225/345 | 120 | 72,526.4 | 37,189.7 | 0.513 |
| Type of Energy | Energy |
|---|---|
| ΔEvdW | −31.69 ± 0.56 |
| ΔEele | −18.58 ± 0.82 |
| ΔEPSE | 44.40 ± 1.18 |
| ΔESSASA | −3.86 ± 0.05 |
| ΔEBE | −9.73 ± 0.48 |
| Residues | Epolar | EApolar | Etotal |
|---|---|---|---|
| Arg-117 | 0.15 ± 0.24 | −0.13 ± 0.01 | −1.17 ± 0.14 |
| Pro-118 | 0.13 ± 0.04 | −0.16 ± 0.00 | −1.12 ± 0.07 |
| Arg-145 | 0.98 ± 0.28 | −0.03 ± 0.00 | −0.44 ± 0.08 |
| Leu-179 | 1.63 ± 0.05 | −0.20 ± 0.00 | −1.14 ± 0.10 |
| Pro-180 | 0.31 ± 0.01 | −0.07 ± 0.00 | −0.55 ± 0.05 |
| Leu-182 | 0.00 ± 0.02 | −0.06 ± 0.00 | −0.81 ± 0.02 |
| Arg-186 | 1.47 ± 0.22 | −0.34 ± 0.00 | −2.75 ± 0.18 |
| Lys-190 | 0.59 ± 0.19 | −0.01 ± 0.00 | −0.46 ± 0.08 |
| Ile-523 | 0.00 ± 0.00 | −0.06 ± 0.00 | −0.44 ± 0.04 |
Publisher’s Note: MDPI stays neutral with regard to jurisdictional claims in published maps and institutional affiliations. |
© 2022 by the authors. Licensee MDPI, Basel, Switzerland. This article is an open access article distributed under the terms and conditions of the Creative Commons Attribution (CC BY) license (https://creativecommons.org/licenses/by/4.0/).
Share and Cite
Sabour, A.A.; Khan, A.; Alhuzani, M.R. Insight into the Interaction Mechanism of HSA with Aztreonam: A Multispectroscopic and Computational Approach. Molecules 2022, 27, 7858. https://doi.org/10.3390/molecules27227858
Sabour AA, Khan A, Alhuzani MR. Insight into the Interaction Mechanism of HSA with Aztreonam: A Multispectroscopic and Computational Approach. Molecules. 2022; 27(22):7858. https://doi.org/10.3390/molecules27227858
Chicago/Turabian StyleSabour, Amal A., Altaf Khan, and Mohammed R. Alhuzani. 2022. "Insight into the Interaction Mechanism of HSA with Aztreonam: A Multispectroscopic and Computational Approach" Molecules 27, no. 22: 7858. https://doi.org/10.3390/molecules27227858