
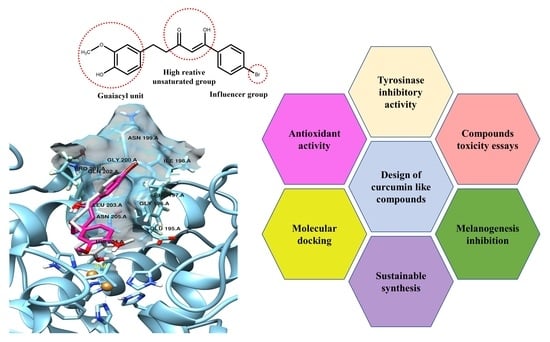
Inhibitory Effect of Curcumin-Inspired Derivatives on Tyrosinase Activity and Melanogenesis

 , , , , , , ,
  ,
, 
Abstract
:
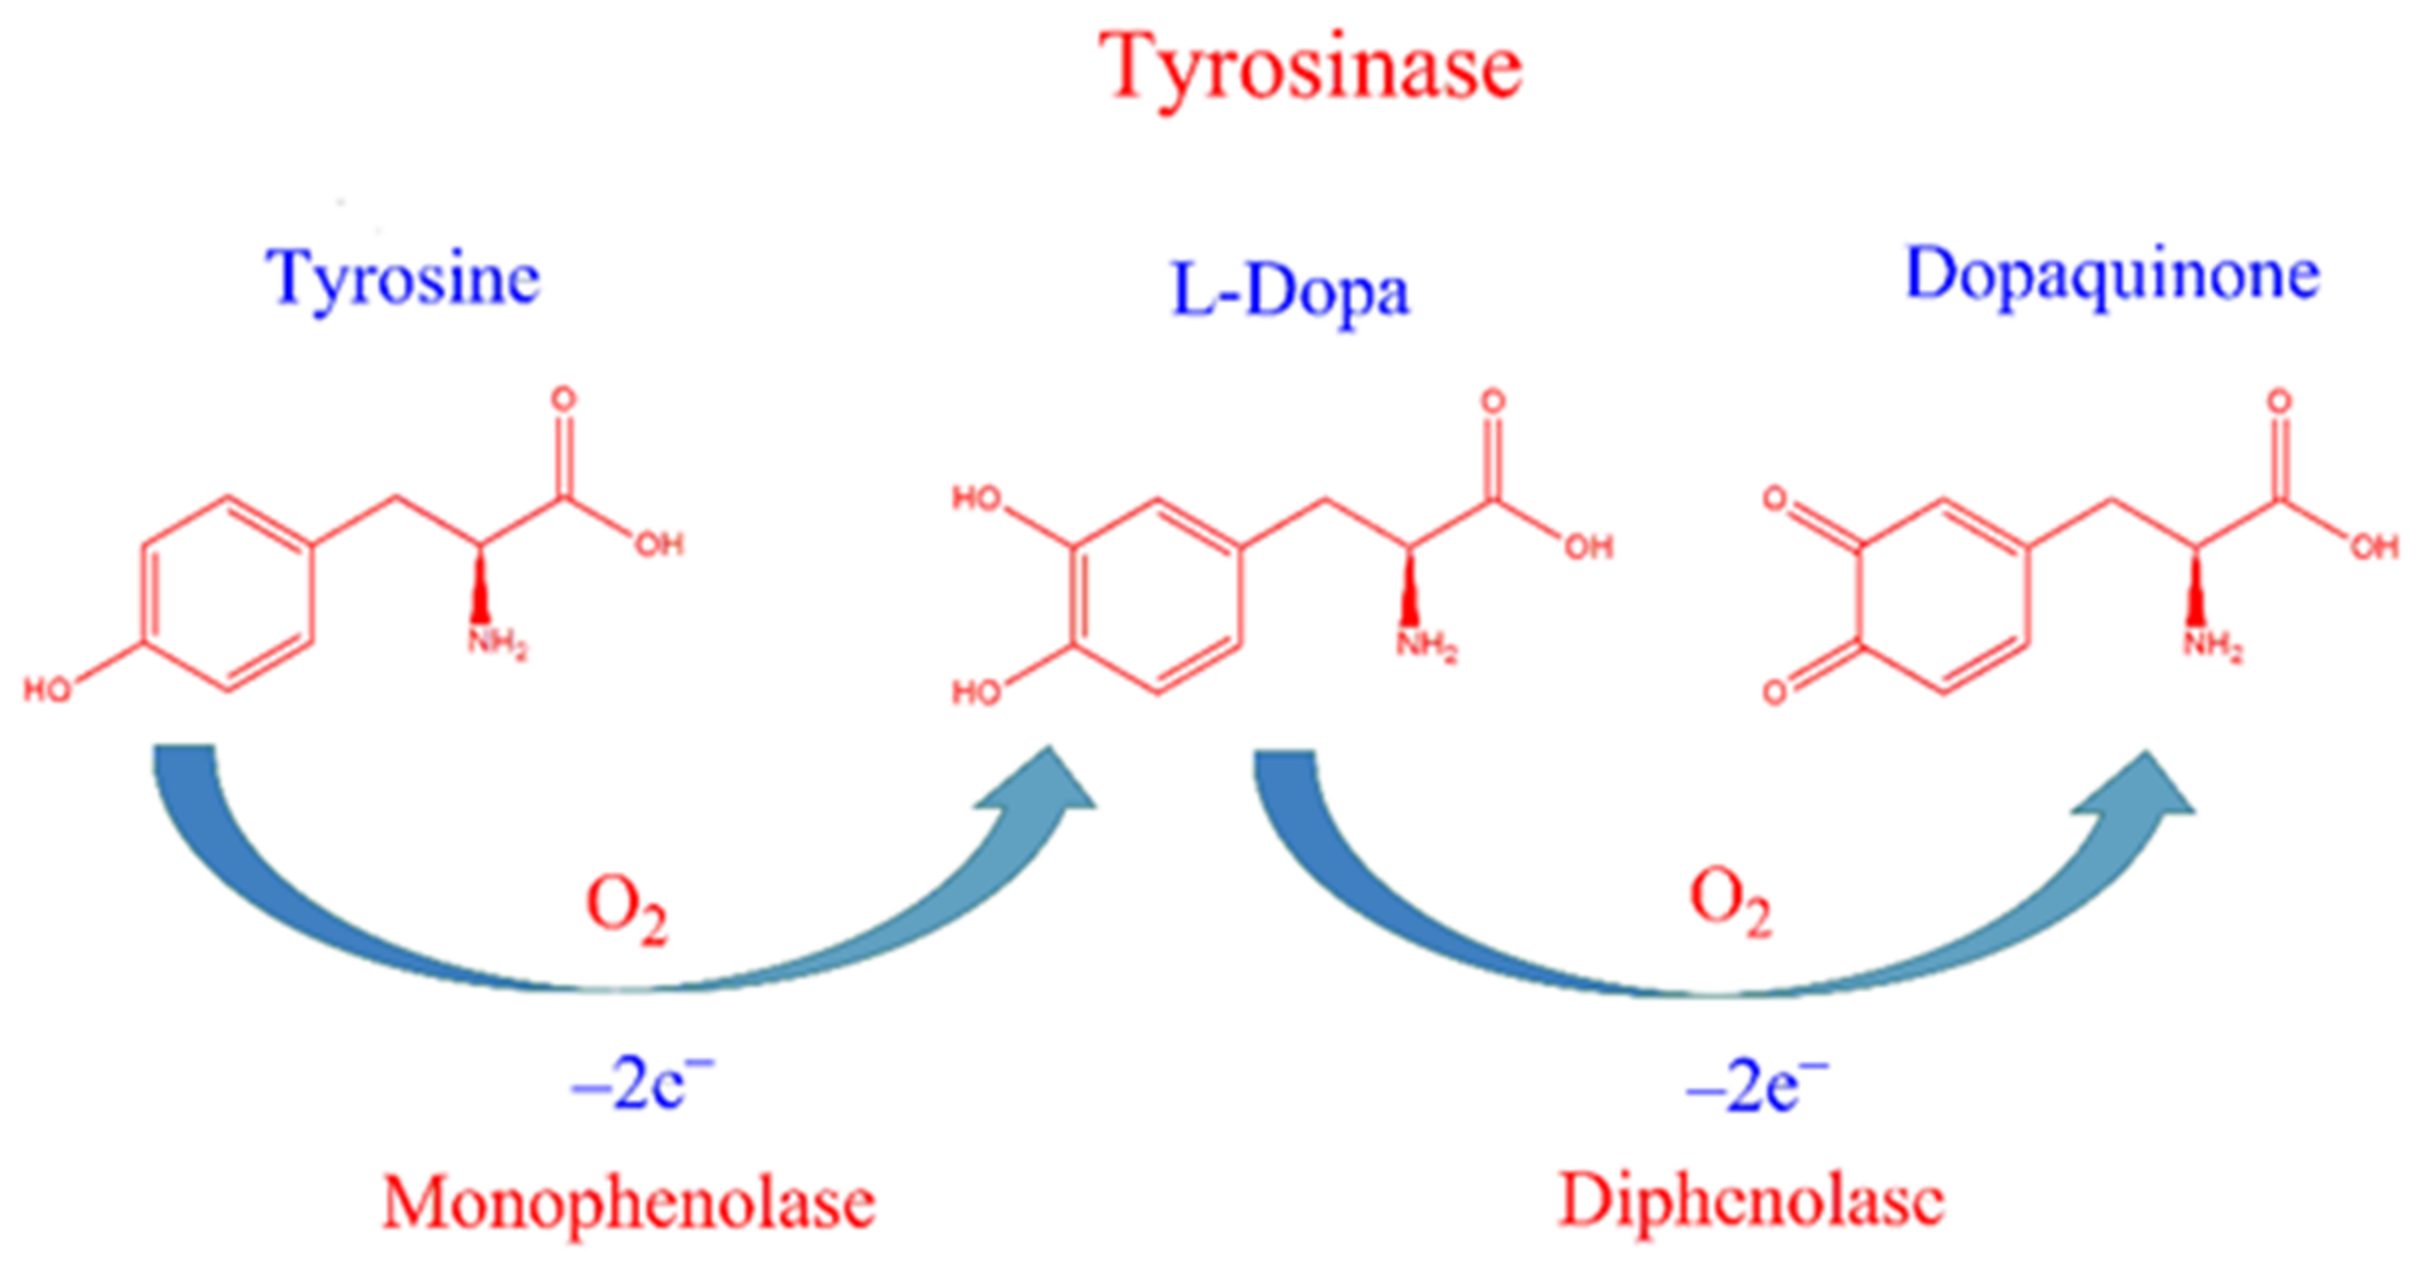
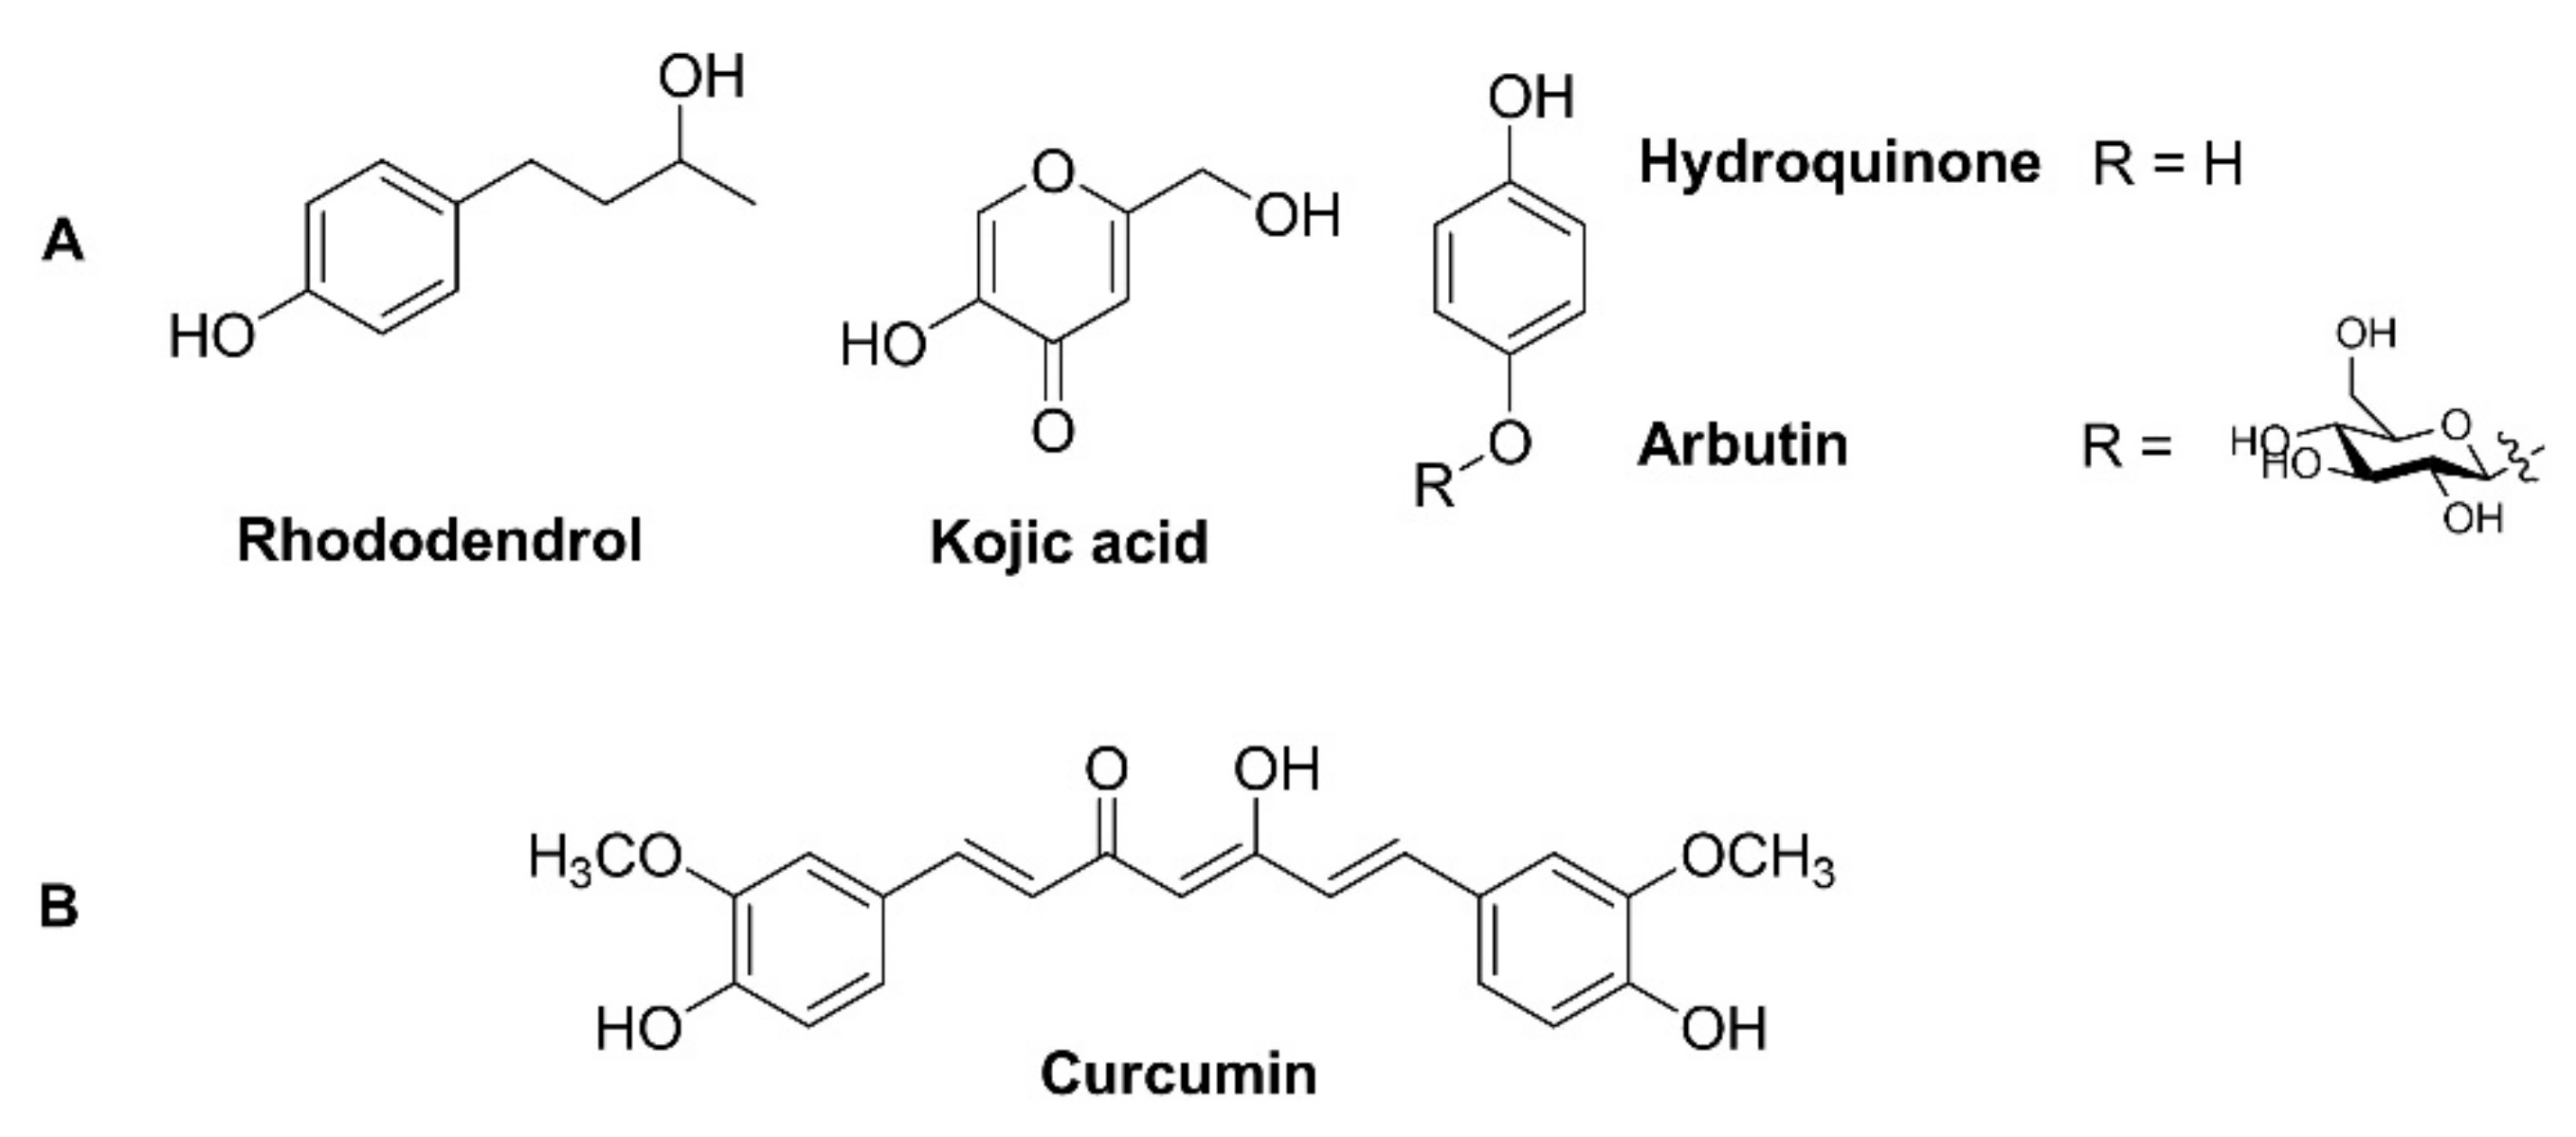
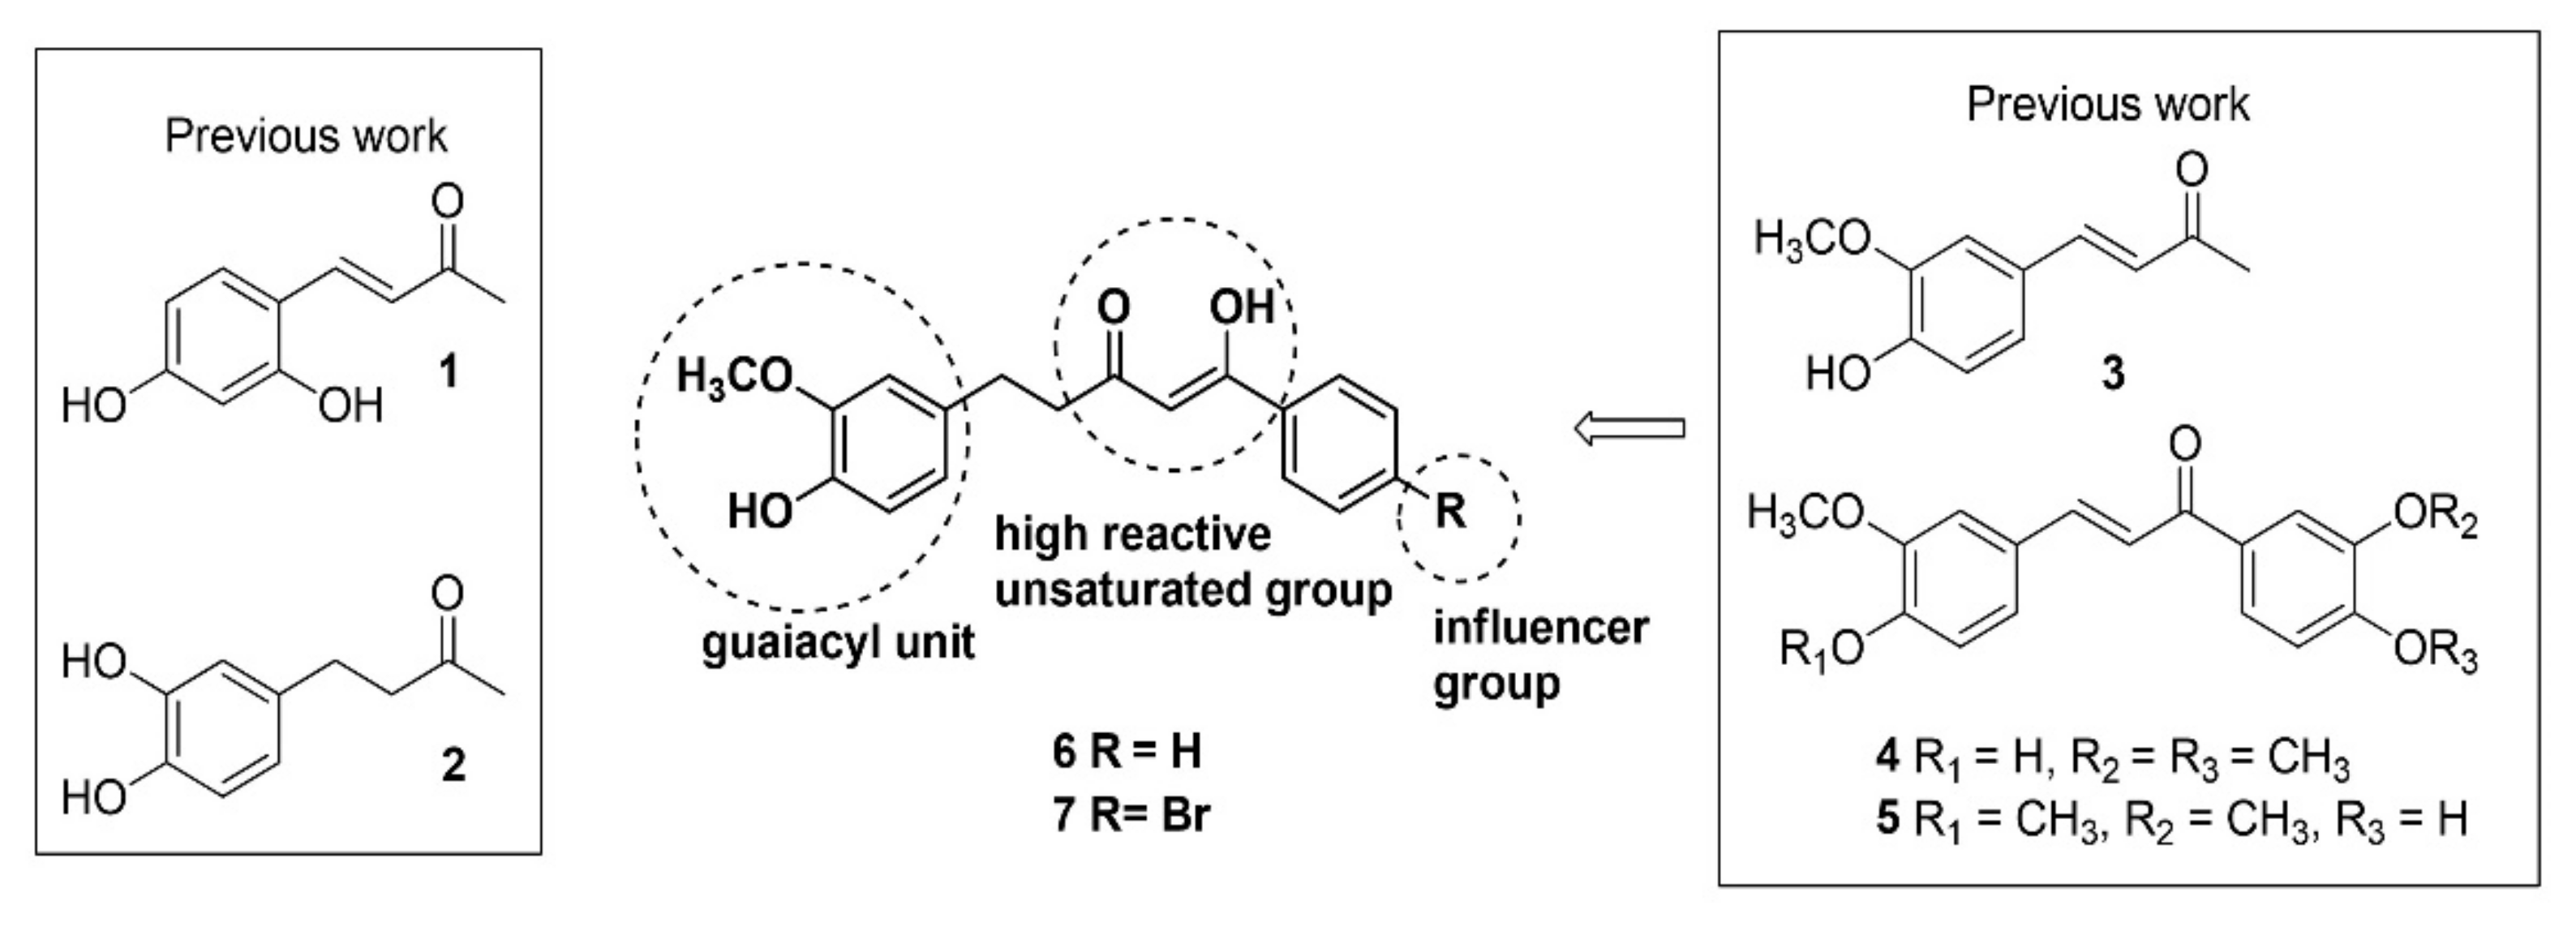
1. Introduction
2. Results
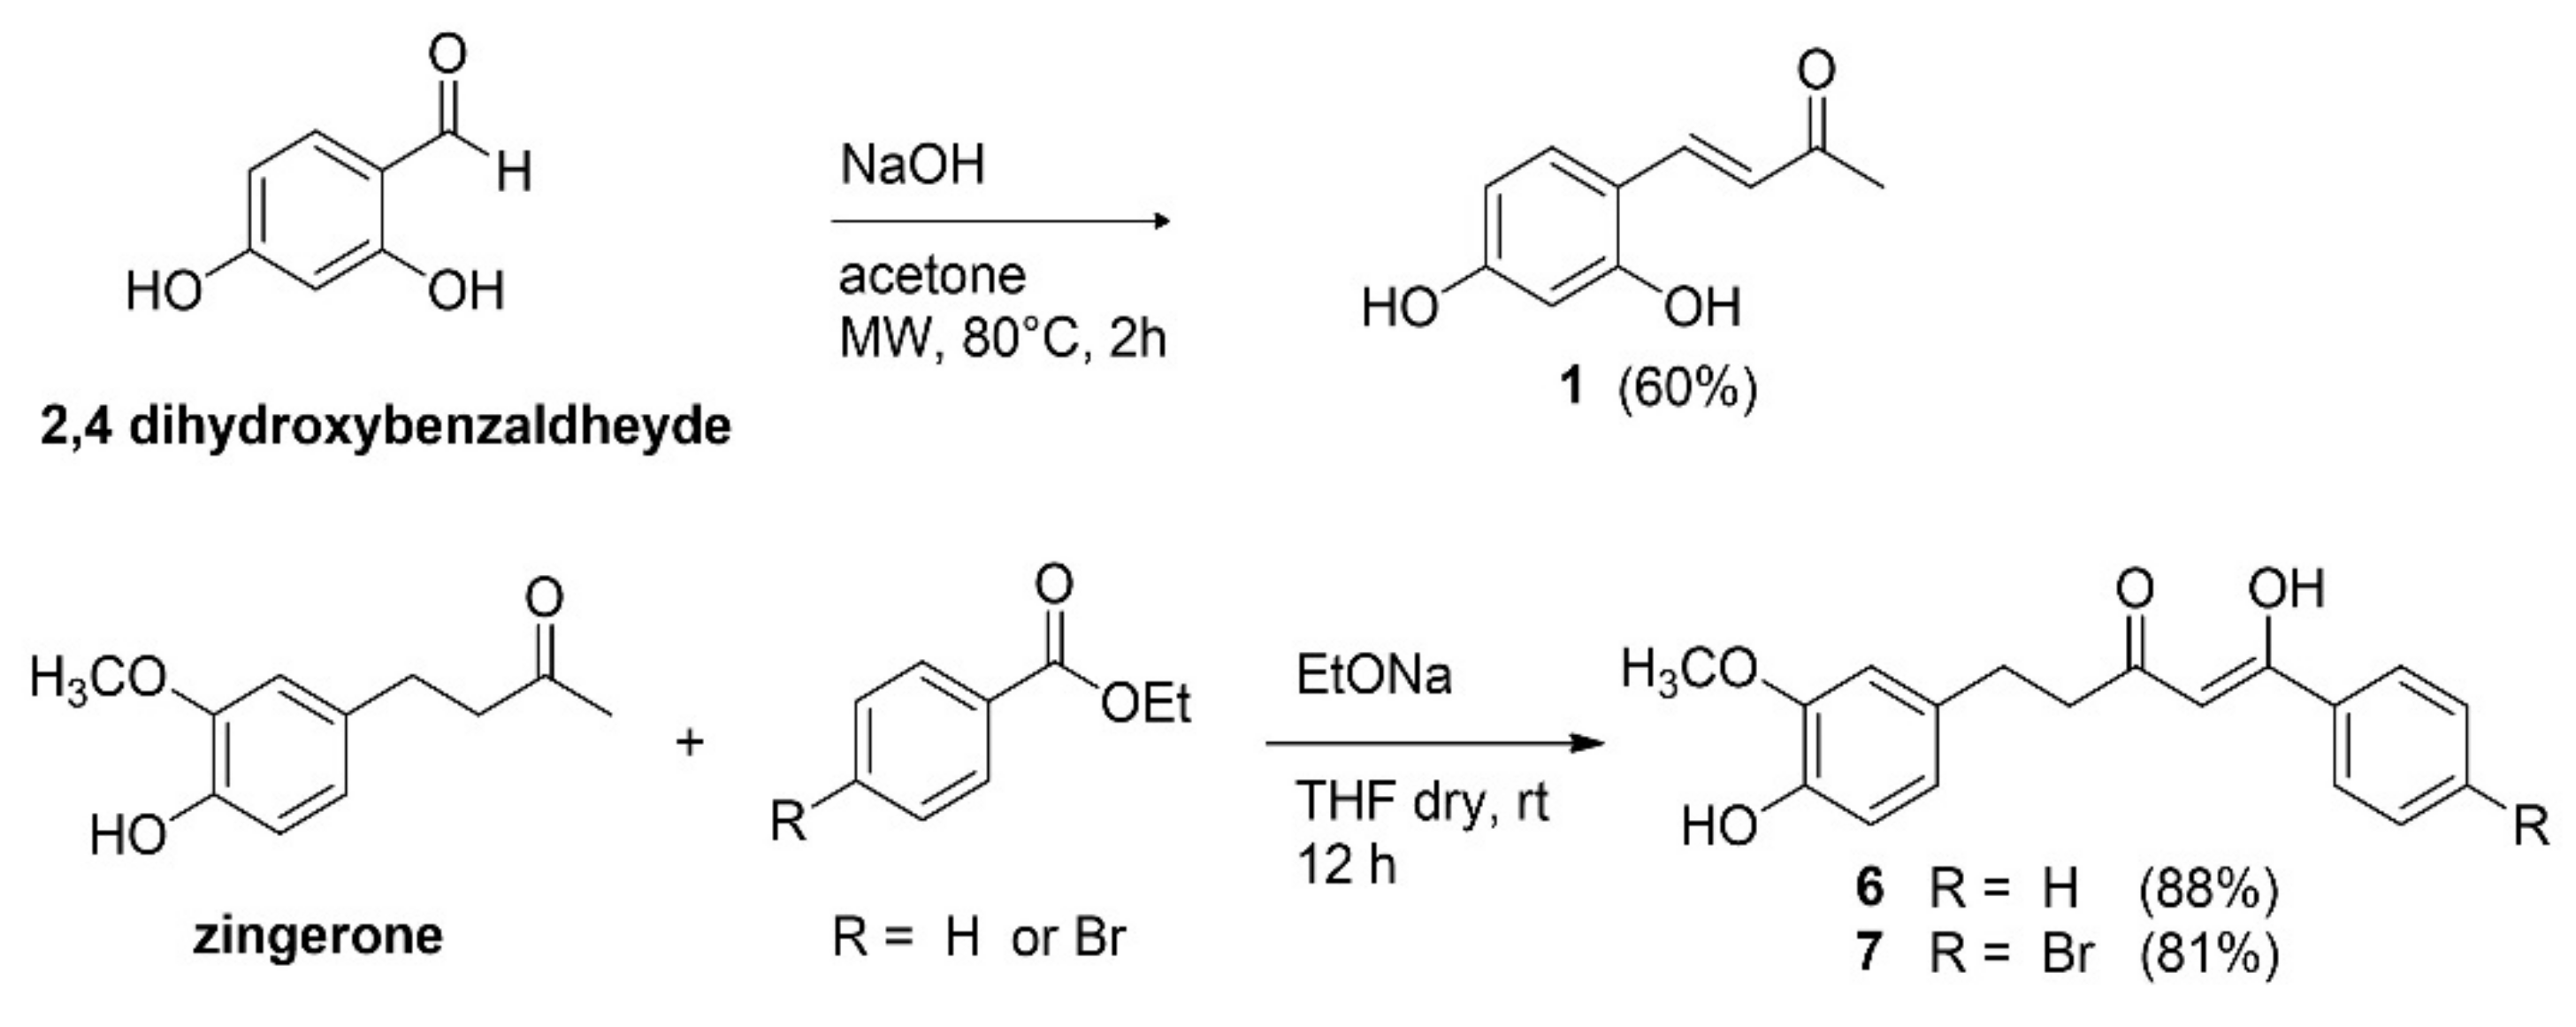
2.1. Synthesis of Inhibitors
2.2. Measurement of Tyrosinase Inhibitory Activity
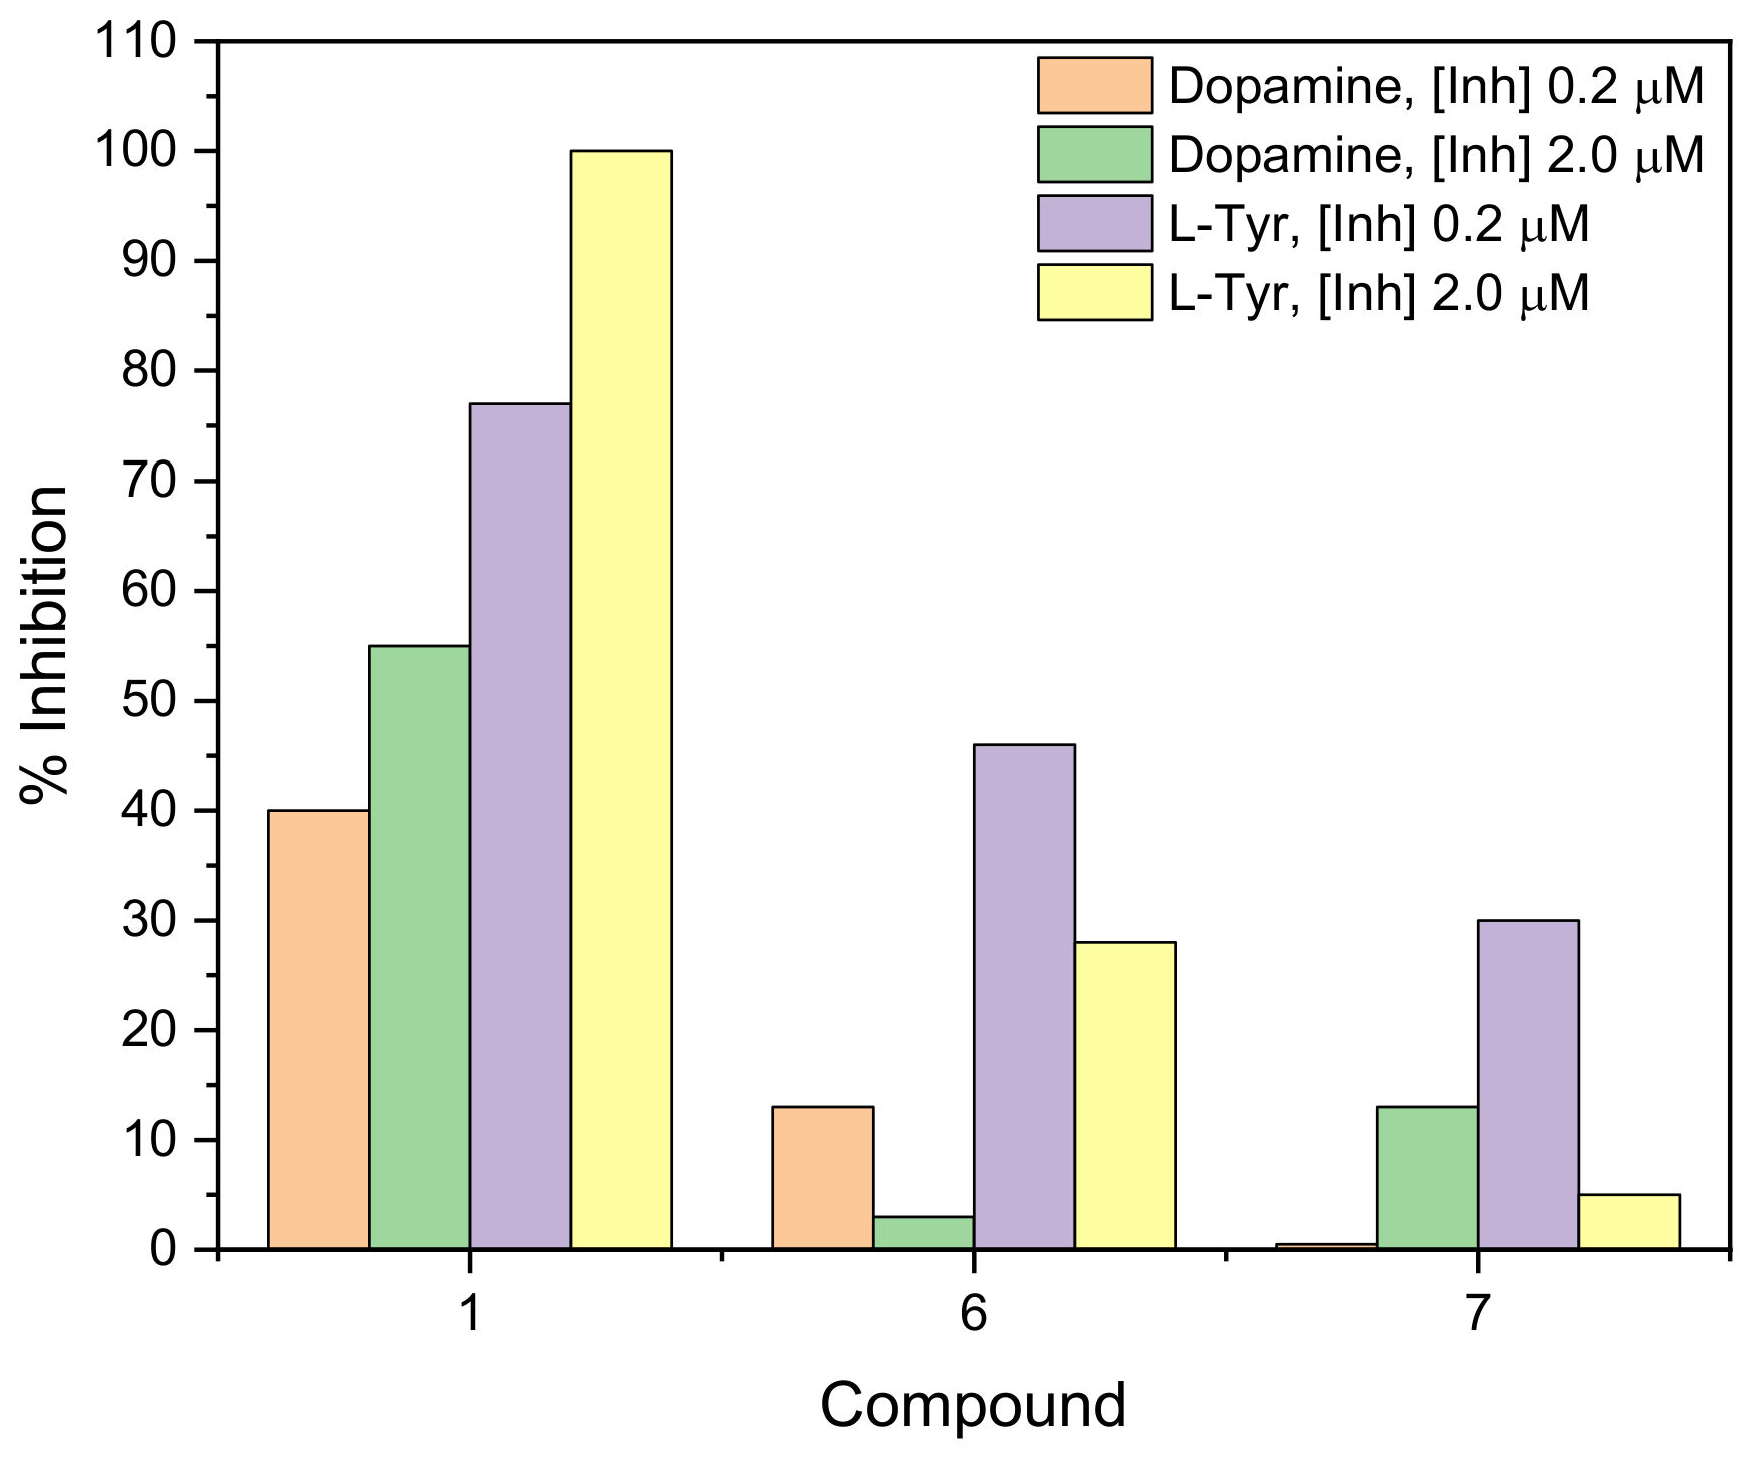
2.2.1. Mushroom Tyrosinase Spectrophotometric Assay
2.2.2. Mushroom Tyrosinase Biosensor Assay
2.3. Antioxidant Activity of the Compounds via Amperometric Assay
2.4. Cell Culture
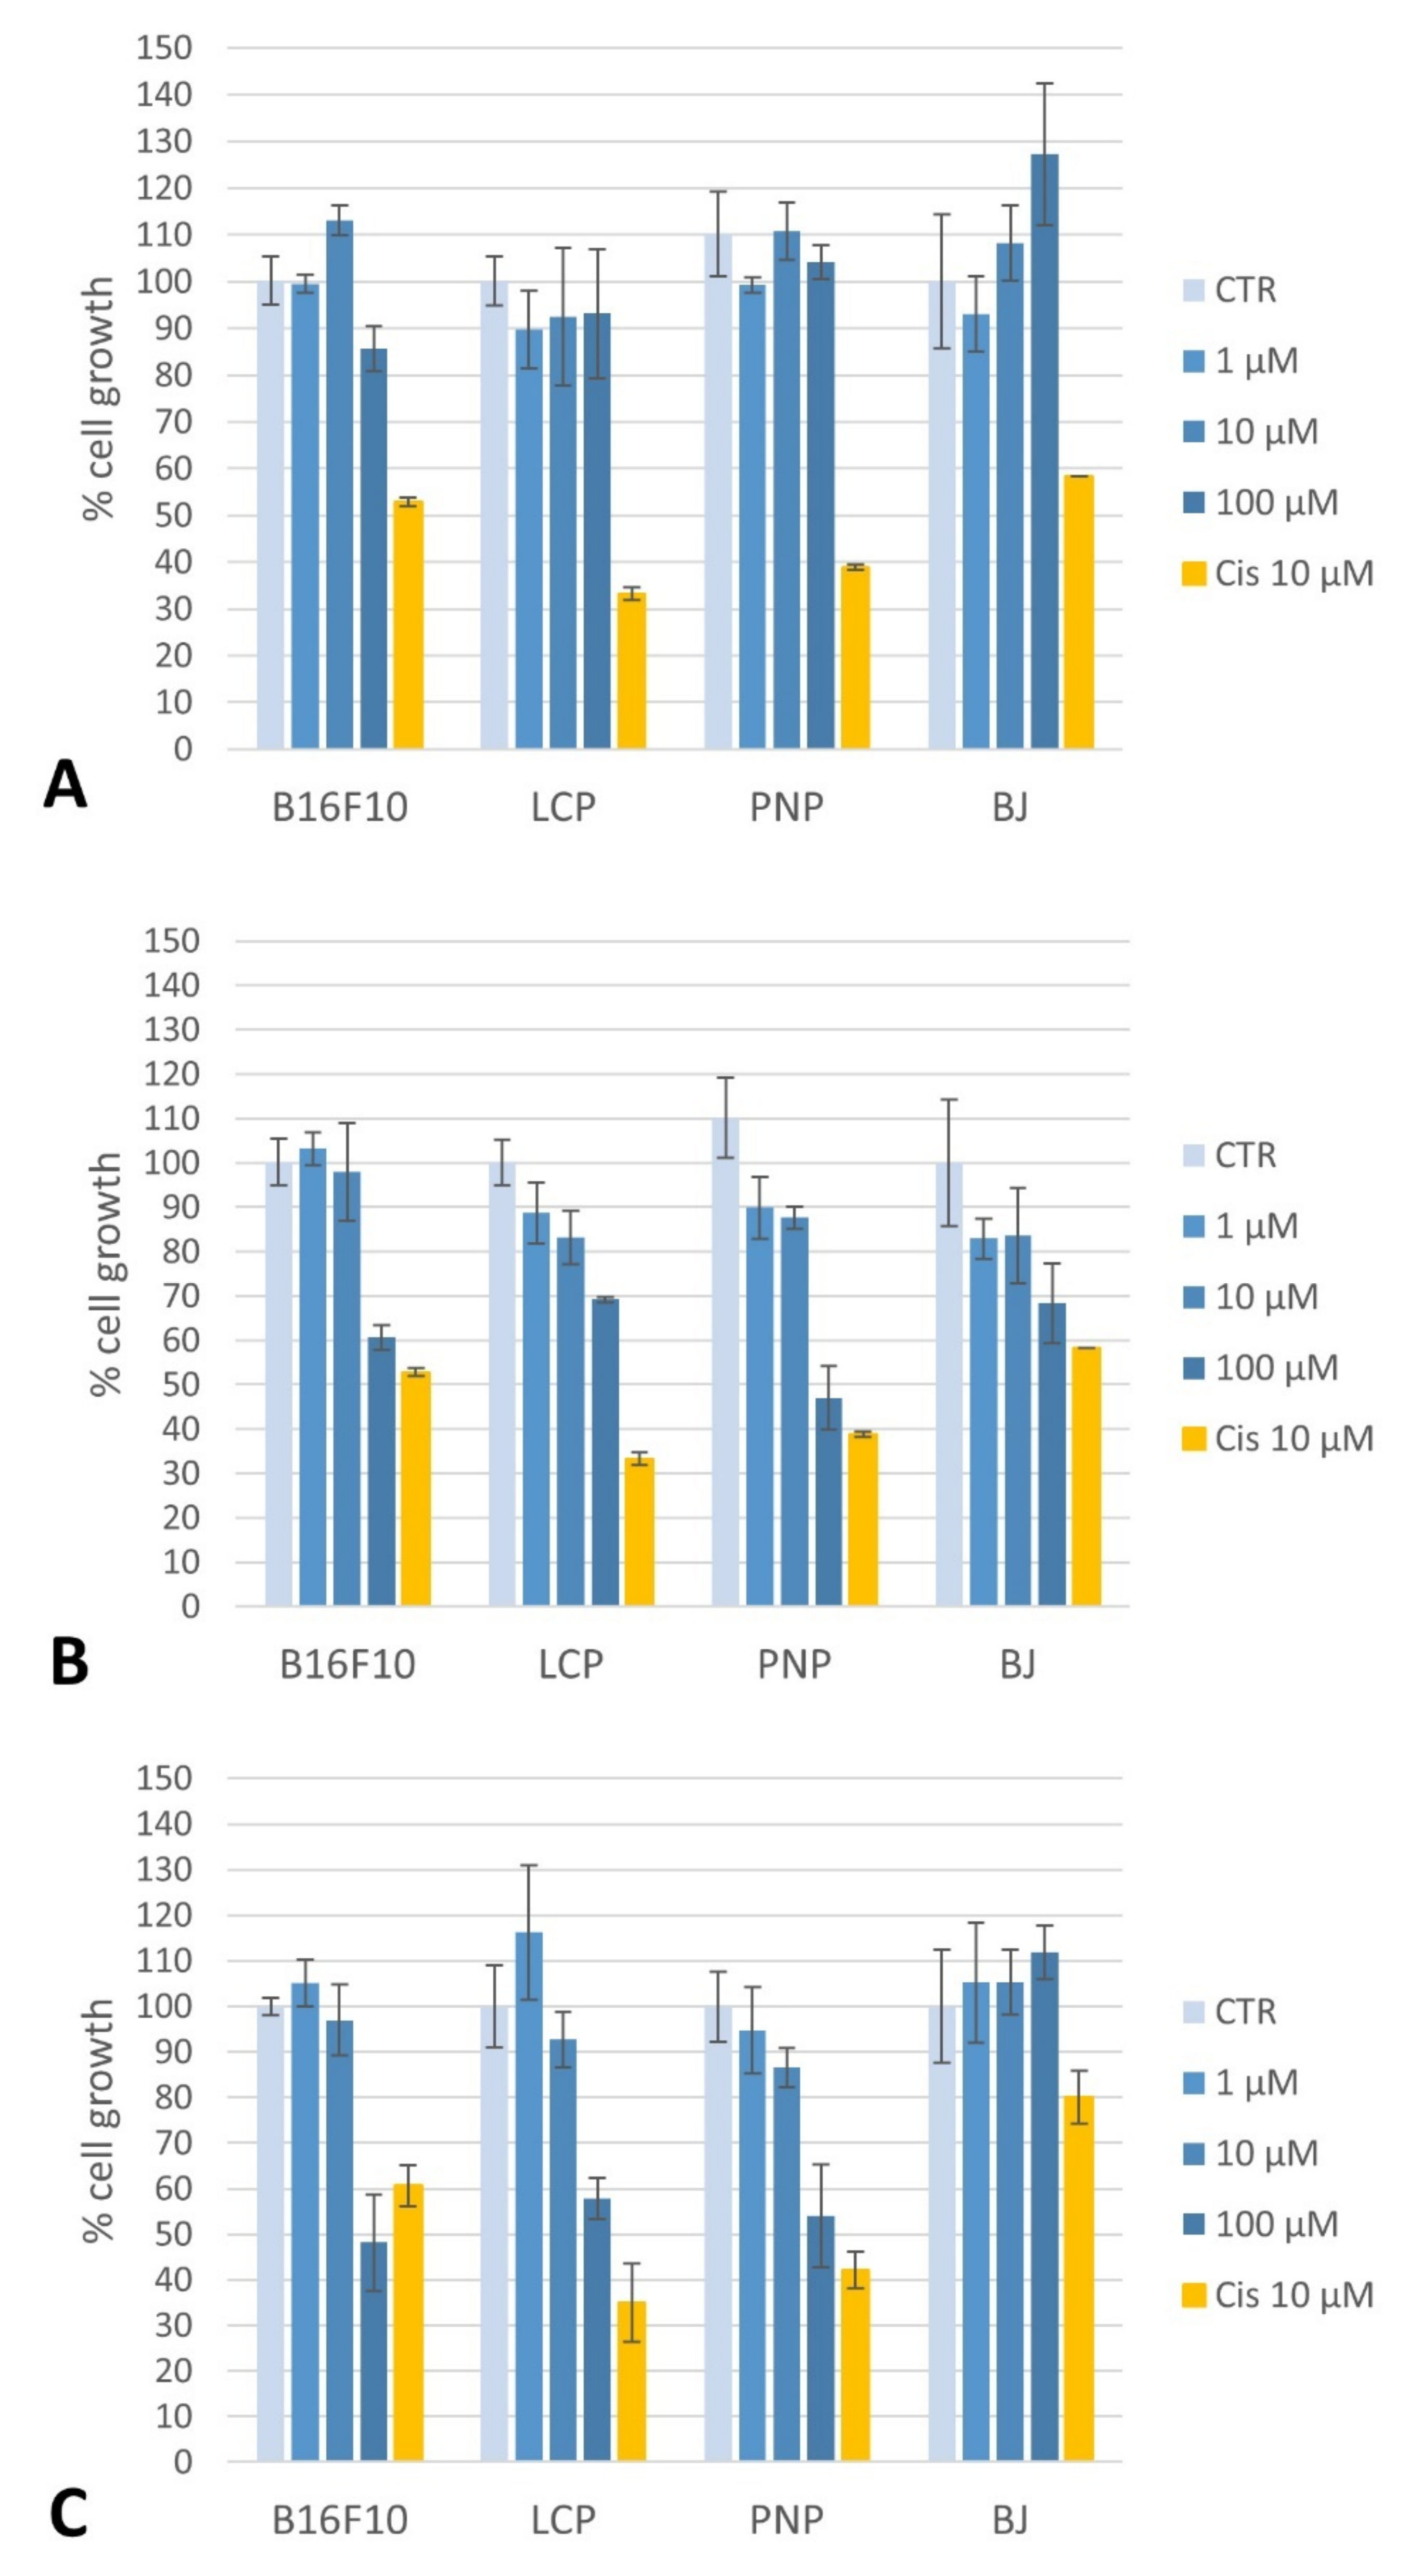
2.4.1. Toxicity of Compounds on Melanoma Cells and Fibroblasts
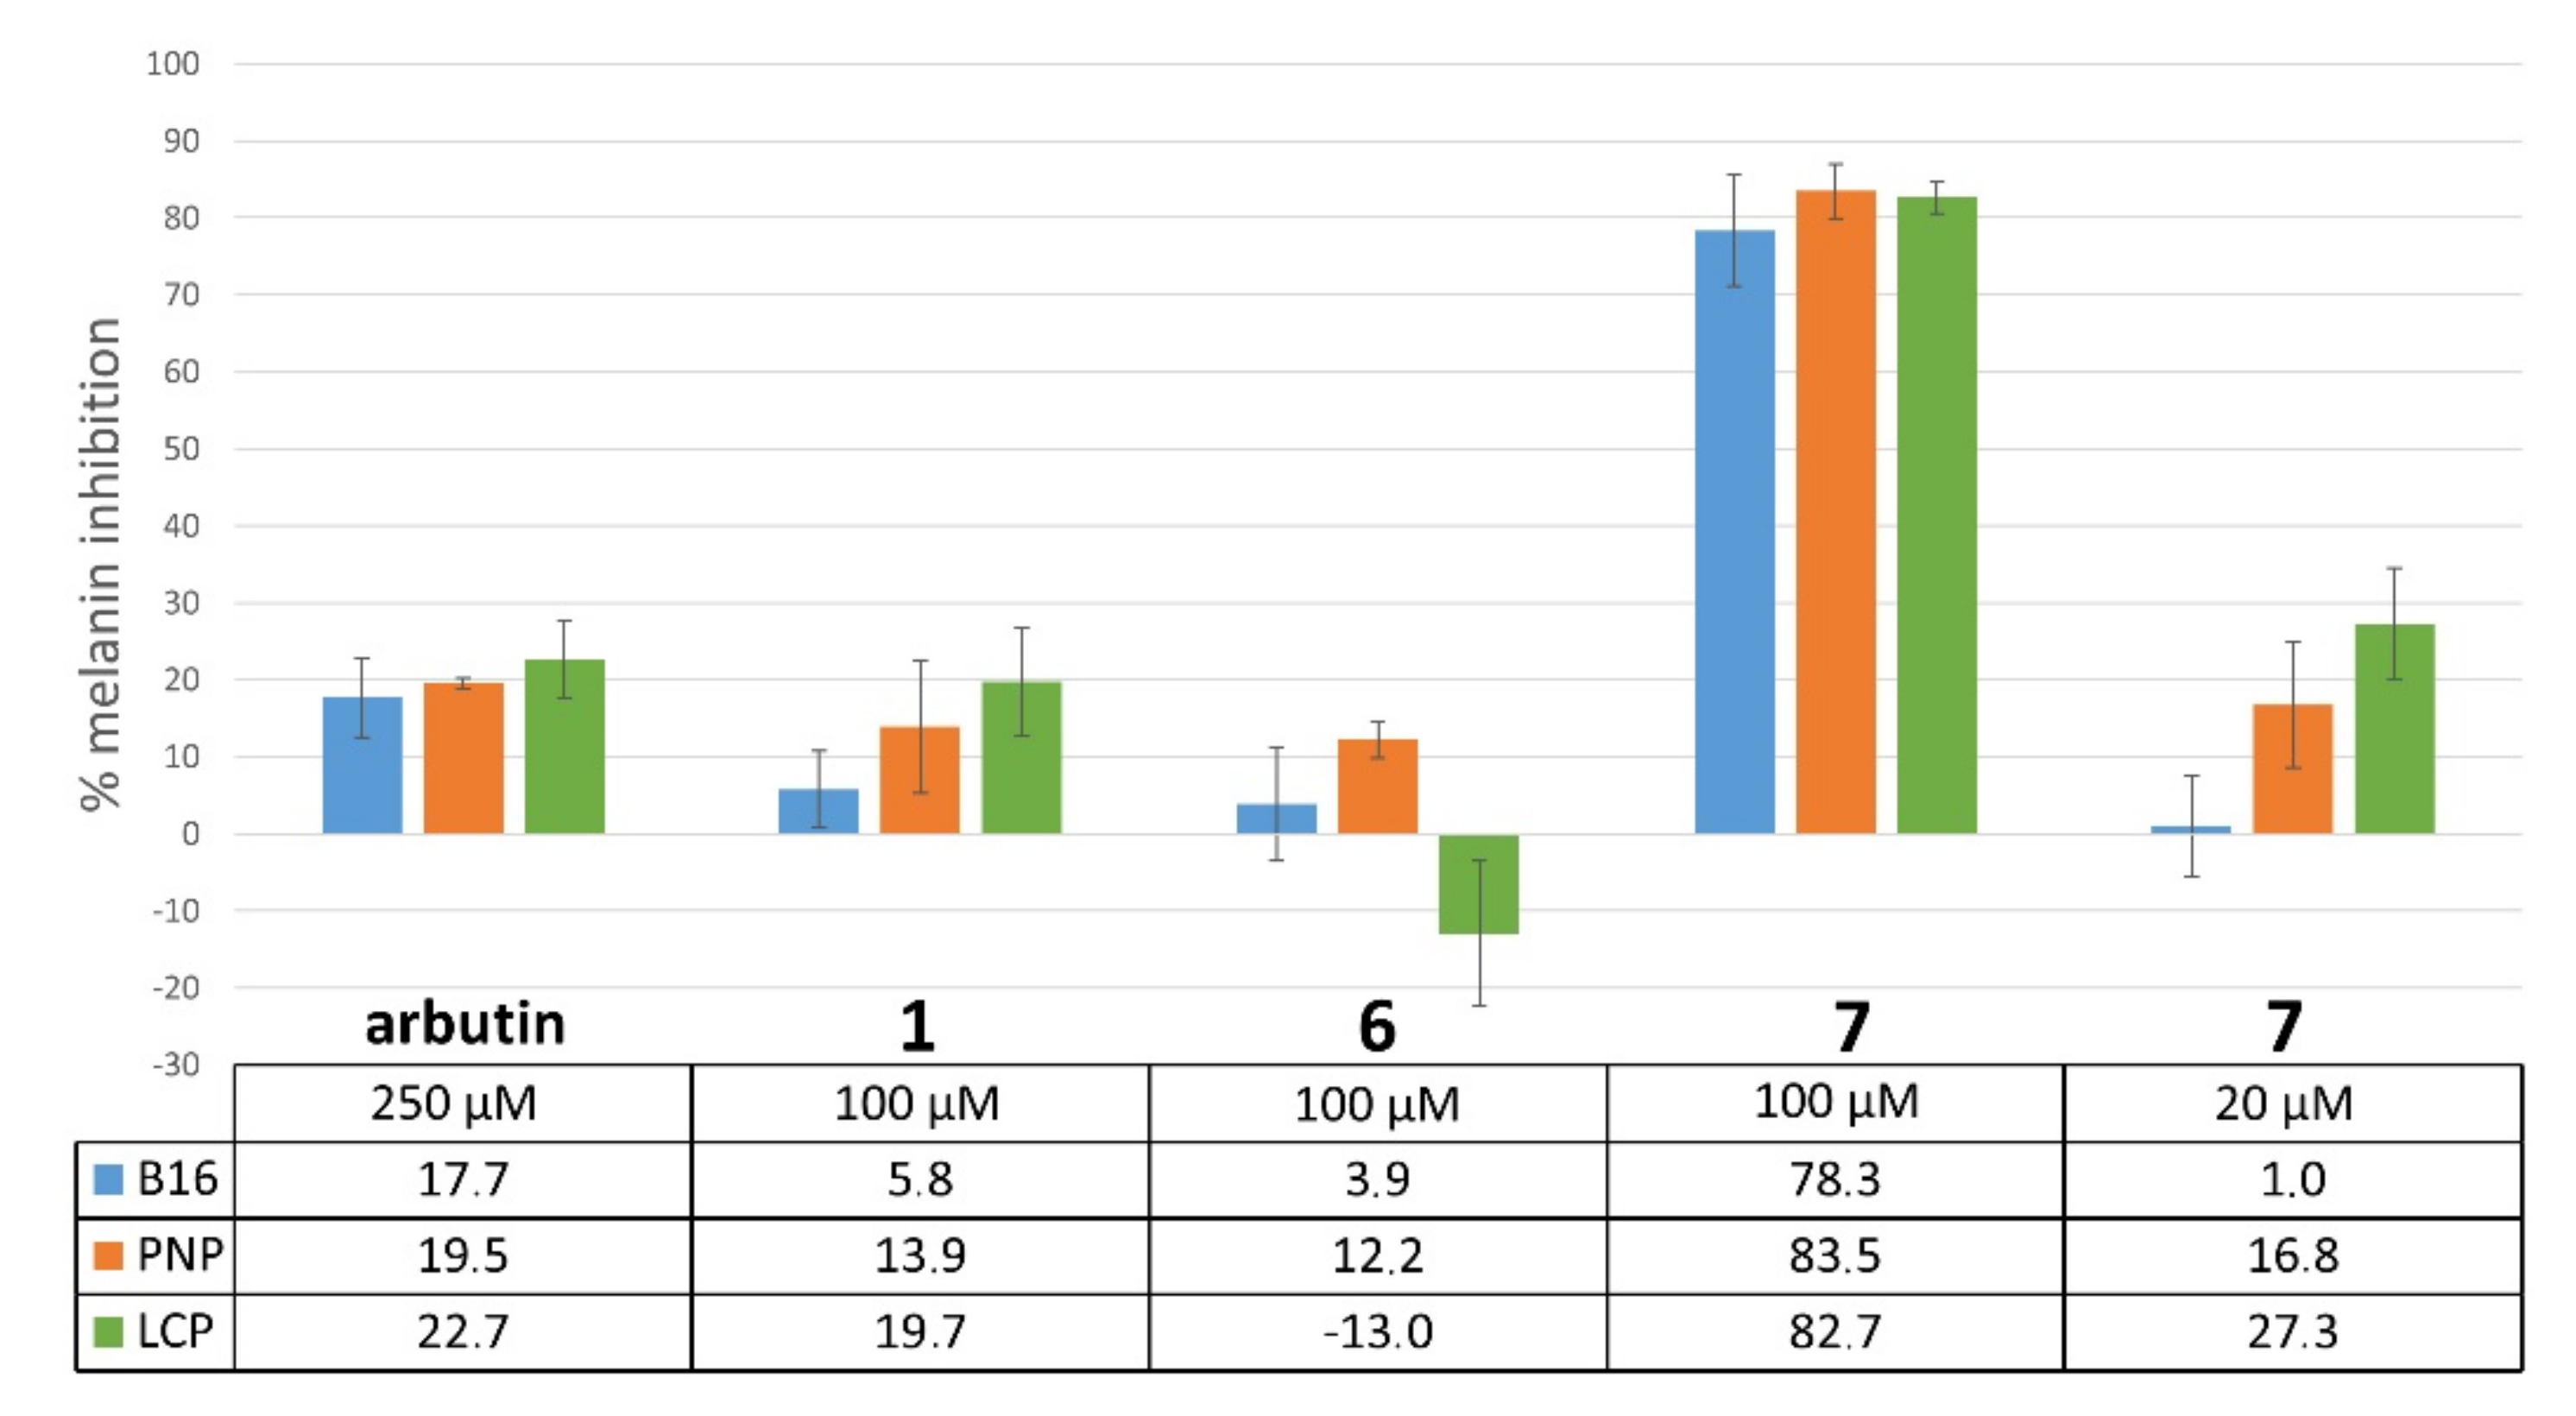
2.4.2. Inhibition of Melanogenesis
2.4.3. Toxicity of Compounds on PC12 Cells and Protective Activity against Oxidative Stress
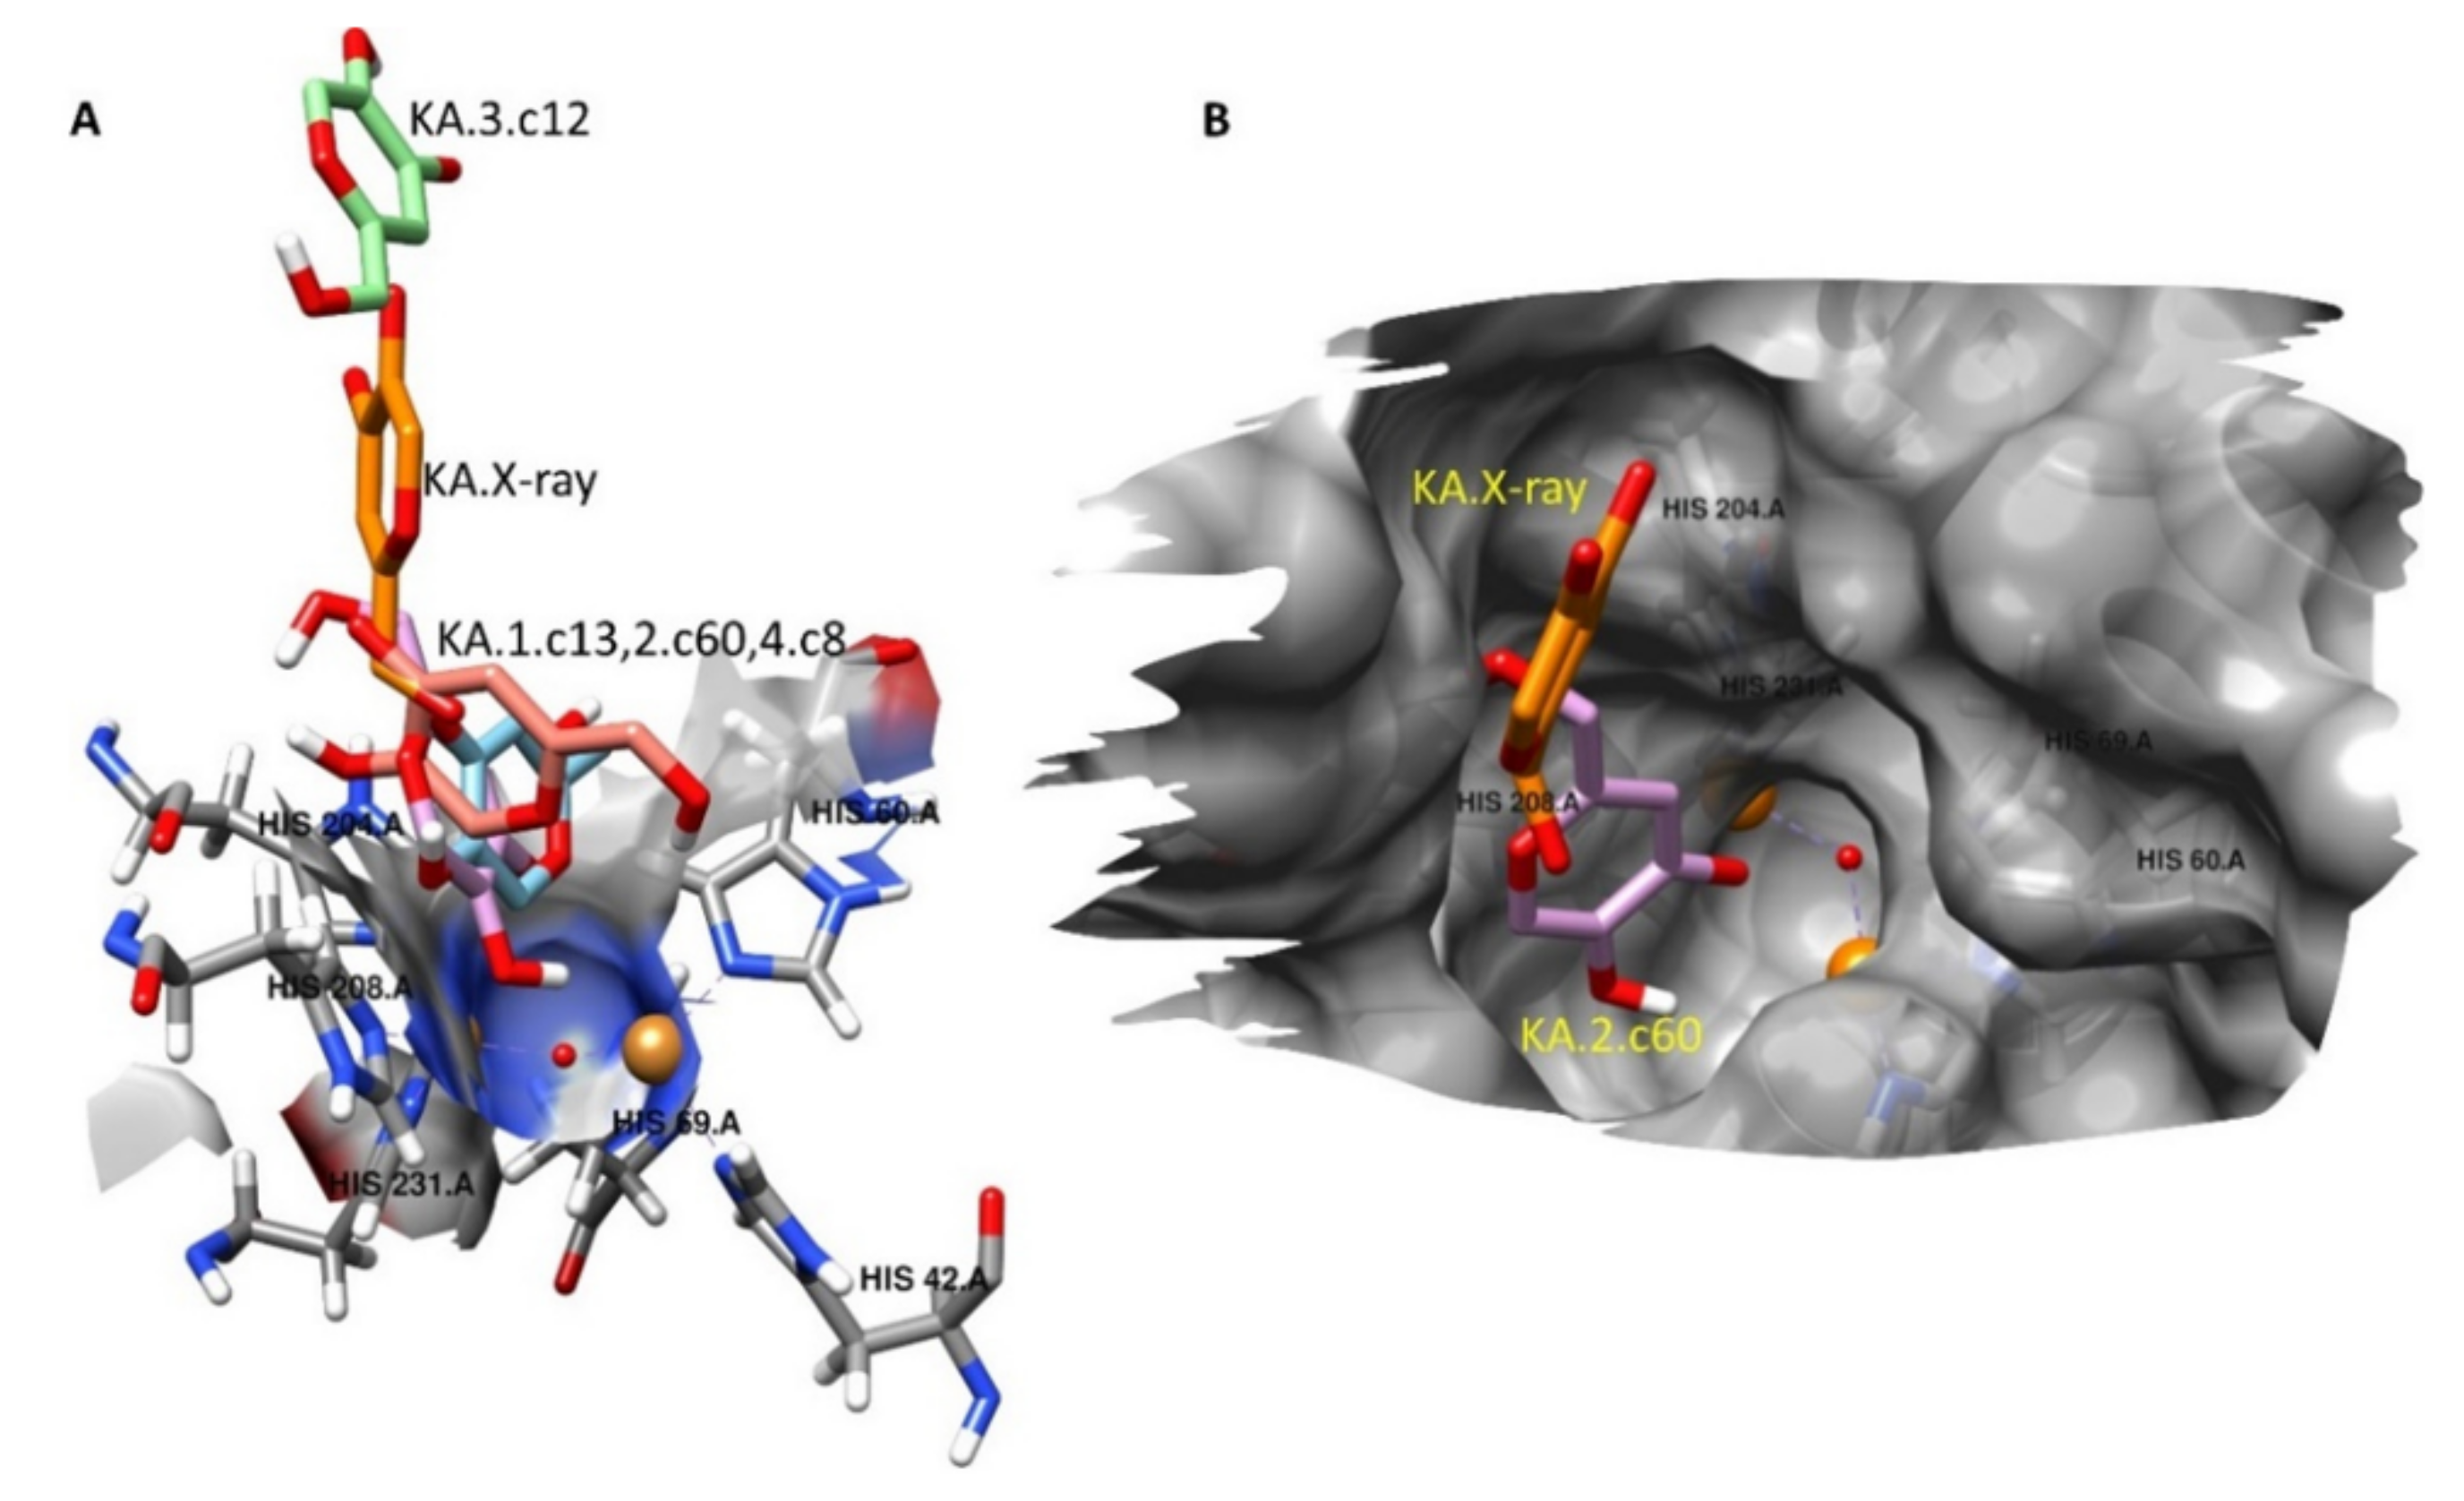
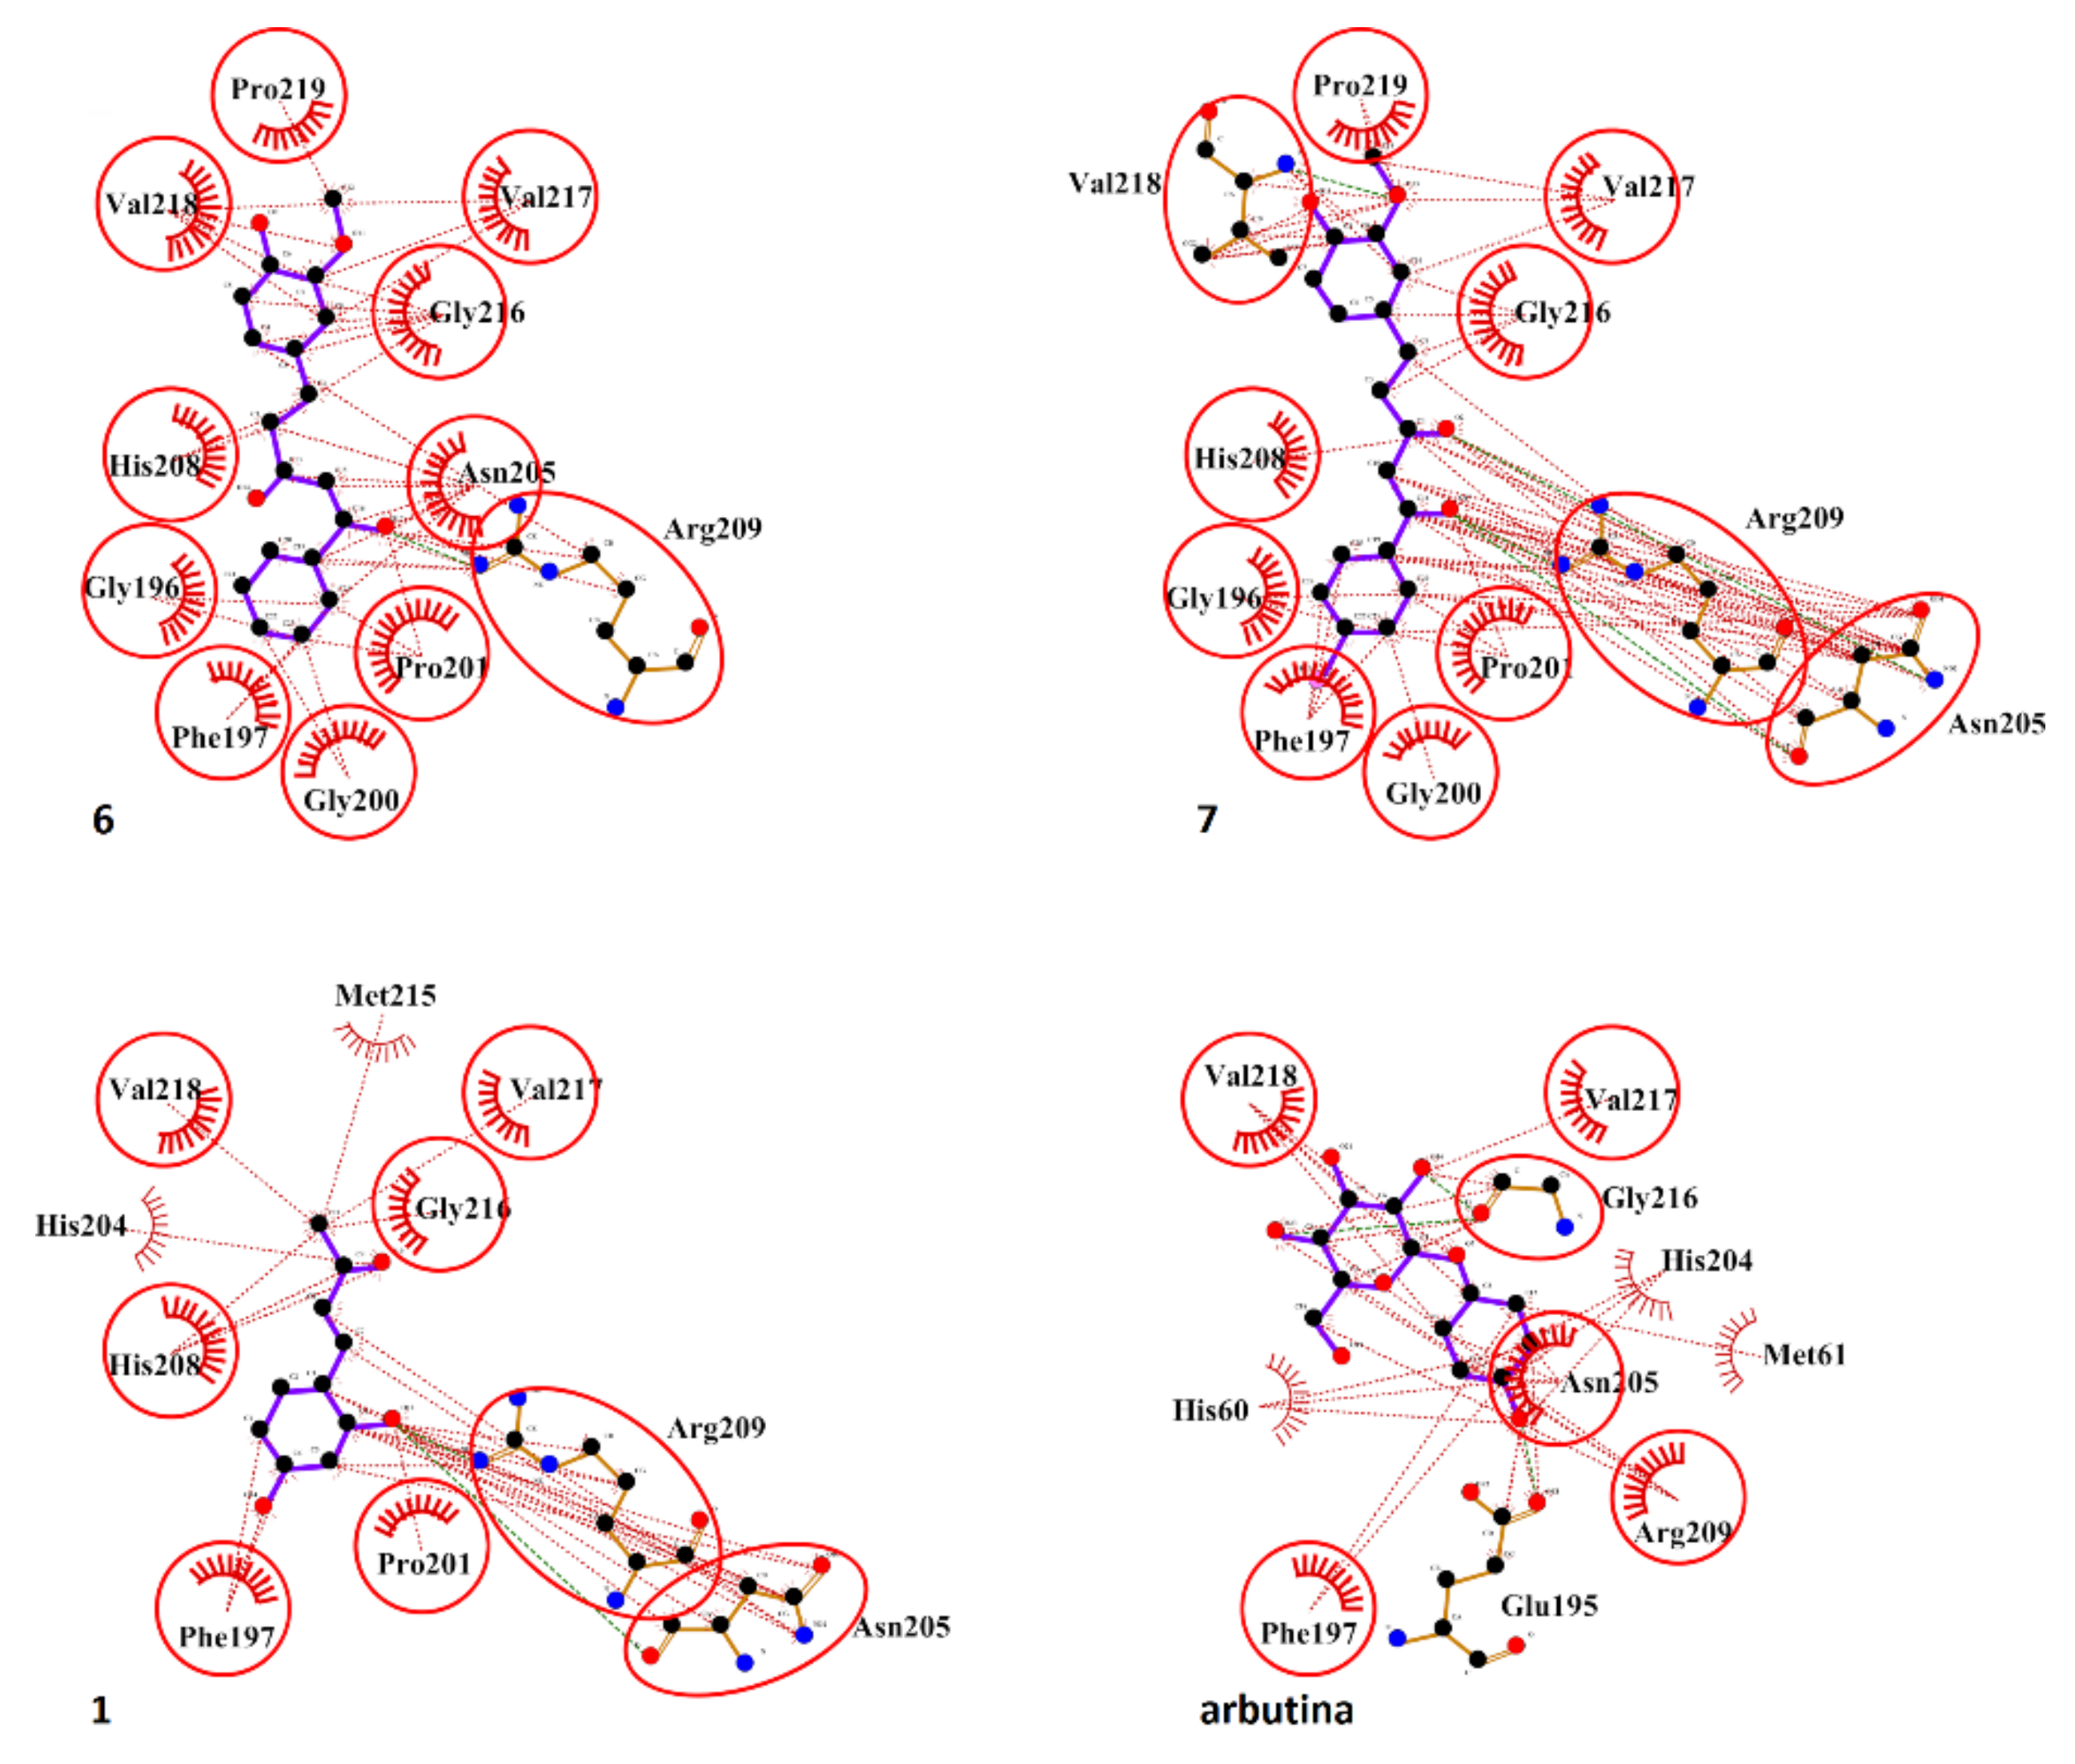
2.5. Molecular Docking Studies
3. Discussion
4. Materials and Methods
4.1. General Methods and Reagents
4.1.1. Synthesis of Inhibitors
4.1.2. General Procedure for the Synthesis of Compounds 6 and 7
4.2. Measurement of Tyrosinase Inhibitory Activity
4.2.1. Mushroom Tyrosinase Spectrophotometric Assay
4.2.2. Preparation of Tyrosinase Biosensors
4.2.3. Biosensor Calibration Protocol
4.2.4. Biosensor Inhibition Protocols
4.2.5. Kinetic Analyses of the Compounds
4.3. Antioxidant Activity of the Compounds via Amperometric Assay
4.4. Cell Culture
4.4.1. Cell Lines
4.4.2. Toxicity of Compounds and Their Protective Activity on PC12 Cells
4.4.3. Toxicity of Compounds: Cell Proliferation Assays on Melanoma Cells
4.4.4. Inhibition of Melanin Synthesis: Melanin Quantification Assay
4.5. Molecular Modelling and Molecular Docking Procedures
4.5.1. Ligand Preparation
4.5.2. Computational Docking Procedures
4.6. Statistical Analysis
5. Conclusions
Supplementary Materials
Author Contributions
Funding
Institutional Review Board Statement
Informed Consent Statement
Data Availability Statement
Conflicts of Interest
Sample Availability
References
- Gillbro, M.; Olsson, M.J. The melanogenesis and mechanisms of skin-lightening agents-existing and new approaches. Int. J. Cosmet. Sci. 2011, 33, 210–221. [Google Scholar] [CrossRef] [PubMed]
- Kim, K.; Huh, Y.; Lim, K.M. Anti-pigmentary natural compounds and their mode of action. Int. J. Mol. Sci. 2021, 22, 6206. [Google Scholar] [CrossRef] [PubMed]
- Solomon, E.J.; Sundaram, U.M.; Machonkin, T.E. Multicopper oxidases and oxygenases. Chem. Rev. 1996, 96, 2563–2605. [Google Scholar] [CrossRef] [PubMed]
- Vavrocla, C.J.; Han, Q.; Mehere, P.; Ding, H.; Christensen, B.M.; Li, J. Tyrosine metabolic enzymes from insects and mammals: A comparative perspective. Insect Sci. 2014, 21, 13–19. [Google Scholar] [CrossRef]
- Nasti, T.H.; Timares, L. MC1R, eumelanin and pheomelanin: Their role in determining the susceptibility to skin cancer. Photochem. Photobiol. 2015, 9, 188–200. [Google Scholar] [CrossRef] [Green Version]
- Manap, A.S.A.; Lum, Y.K.; Ong, L.H.; Tang, Y.Q.; Gew, L.T.; Chia, A.Y.Y. Perspective approaches on melanogenesis inhibition. Dermatol. Sin. 2021, 39, 1–12. [Google Scholar] [CrossRef]
- Burnett, C.L.; Bergfeld, W.F.; Belsito, D.V.; Hill, R.A.; Klaassen, C.D.; Liebler, D.C.; Marks, J.G.; Shank, R.C.; Slaga, T.J.; Snyder, T.W.; et al. Final report of the safety assessment of Kojic acid as used in cosmetics. Int. J. Toxicol. 2010, 29, 244S–273S. [Google Scholar] [CrossRef]
- Draelo, Z.D. Skin lightening preparations and the hydroquinone controversy. Dermatol. Ther. 2007, 20, 308–313. [Google Scholar] [CrossRef]
- Garcia-Jimenez, A.; Teruel-Puche, J.A.; Garcia-Ruiz, P.A.; Saura-Sanmartin, A.; Berna, J.; Rodríguez-López, J.N.; Garcia-Canovas, F. Action of tyrosinase on caffeic acid and its n-nonyl ester. Catalysis and suicide inactivation. Int. J. Biol. Macromol. 2018, 107, 2650–2659. [Google Scholar] [CrossRef]
- Prabhu, D.; Ravikumar, P. Novel user-friendly night care spray to manage skin darkening. J. Cosmet. Dermatol. 2020, 19, 1439–1446. [Google Scholar] [CrossRef]
- Ebanks, J.P.; Wickett, R.R.; Boissy, R.E. Mechanisms regulating skin pigmentation: The rise and fall of complexion coloration Int. J. Mol. Sci. 2009, 10, 4066–4087. [Google Scholar] [CrossRef] [Green Version]
- Choi, M.-H.; Yang, S.-H.; Kim, D.-S.; Kim, N.-D.; Shin, H.-J.; Liu, K. Novel quercetin derivative of 3,7-dioleylquercetin shows less toxicity and highly potent tyrosinase inhibition activity. Int. J. Mol. Sci. 2021, 8, 4264. [Google Scholar] [CrossRef]
- Micillo, R.; Sirés-Campos, J.; García-Borrón, J.C.; Panzella, L.; Napolitano, A.; Olivares, C. Conjugation with dihydrolipoic acid imparts caffeic acid ester potent inhibitory effect on dopa oxidase activity of human tyrosinase. Int. J. Mol. Sci. 2018, 8, 2156. [Google Scholar] [CrossRef] [Green Version]
- Romagnoli, R.; Oliva, P.; Prencipe, F.; Manfredini, S.; Germano, M.P.; De Luca, L.; Ricci, F.; Corallo, D.; Aveic, S.; Mariotto, E.; et al. Cinnamic acid derivatives linked to arylpiperazines as novel potent inhibitors of tyrosinase activity and melanin synthesis. Eur. J. Med. Chem. 2022, 231, 114147. [Google Scholar] [CrossRef]
- Li, J.; Feng, L.; Liu, L.; Wang, F.; Ouyang, L.; Zhang, L.; Hu, X.; Wang, W. Recent advances in the design and discovery of synthetic tyrosinase inhibitors. Eur. J. Med. Chem. 2021, 224, 113744. [Google Scholar] [CrossRef]
- Lee, S.Y.; Baek, N.; Nam, T.-G. Natural, semisynthetic and synthetic tyrosinase inhibitors. J. Enzym. Inhib. Med. Chem. 2016, 31, 1–13. [Google Scholar] [CrossRef]
- Sendovski, M.; Kanteev, M.; Ben-Yosef, V.S.; Adir, N.; Fishmanghjj, A. First structures of an active bacterial tyrosinase reveal copper plasticity. J. Mol. Biol. 2011, 405, 227–237. [Google Scholar] [CrossRef]
- Deri, B.; Kanteev, M.; Goldfeder, M.; Lecina, D.; Guallar, V.; Adir, N.; Fishman, A. The unravelling of the complex pattern of tyrosinase inhibition. Sci. Rep. 2016, 6, 34993. [Google Scholar] [CrossRef] [Green Version]
- Goldfeder, M.; Kanteev, M.; Ovdat, S.I.; Adir, N.; Fishman, A. Determination of tyrosinase substrate-binding modes reveals mechanistic differences between type-3 copper proteins. Nat. Commun. 2014, 5, 4505. [Google Scholar] [CrossRef] [Green Version]
- Tian, X.; Cui, Z.; Liu, S.; Zhou, J.; Cui, R. Melanosome transport and regulation in development and disease. Pharmacol. Ther. 2021, 219, 107707. [Google Scholar] [CrossRef]
- Aggarwal, B.B.; Harikumar, K.B. Potential therapeutic effects of curcumin, the anti-inflammatory agent, against neurodegenerative, cardiovascular, pulmonary metabolic, autoimmune and neoplastic diseases. Int. J. Biochem. Cell Biol. 2009, 41, 40–59. [Google Scholar] [CrossRef] [PubMed] [Green Version]
- Yongfu, J.; Zhiyun, D.; Guihua, X.; Qian, C.; Yujing, L.; Xi, Z.; Conney, A.H.; Kun, Z. Synthesis and biological evaluation of unsymmetrical. Molecules 2013, 18, 3948–3961. [Google Scholar] [CrossRef] [Green Version]
- Oglah, M.K.; Mustafa, Y.F. Curcumin analogs: Synthesis and biological activities. Med. Chem. Res. 2020, 29, 479–486. [Google Scholar] [CrossRef]
- Hussain, H.; Ahmad, S.; Shah, S.W.A.; Ullah, A.; Ali, N.; Almehmadi, M.; Ahmad, M.; Khalil, A.A.K.; Jamal, S.B.; Ahmad, H.; et al. Attenuation of Scopolamine-induced amnesia via cholinergic modulation in mice by synthetic curcumin analogs. Molecules 2022, 27, 2468. [Google Scholar] [CrossRef] [PubMed]
- Hussain, H.; Ahmad, S.; Shah, S.W.A.; Ghias, M.; Ullah, A.; Rahman, S.U.; Kamal, Z.; Khan, F.A.; Khan, N.M.; Muhammad, J.; et al. Neuroprotective potential of synthetic mono-carbonyl curcumin analogs assessed by molecular docking studies. Molecules 2021, 26, 7168. [Google Scholar] [CrossRef]
- Kuo, P.C.; Damu, A.G.; Cherng, C.Y.; Jeng, J.F.; Teng, C.M.; Lee, E.J.; Wu, T.S. Isolation of a natural antioxidant, dehydrozingerone from Zingiber officinale and synthesis of its analogues for recognition of effective antioxidant and antityrosinase agents. Arch. Pharm. Res. 2005, 28, 518–528. [Google Scholar] [CrossRef]
- Dettori, M.A.; Fabbri, D.; Dessì, A.; Dallocchio, R.; Carta, P.; Honisch, C.; Ruzza, P.; Farina, D.; Migheli, R.; Serra, P.A.; et al. Synthesis and studies of the inhibitory effect of hydroxylated phenylpropanoids and biphenols derivatives on tyrosinase and laccase enzymes. Molecules 2020, 25, 2709. [Google Scholar] [CrossRef]
- Slavova-Kazakova, A.; Angelova, S.; Fabbri, D.; Dettori, M.A.; Kancheva, V.D.; Delogu, G. Antioxidant properties of novel curcumin analogues: A combined experimental and computational study. J. Food Biochem. 2021, 45, e13584. [Google Scholar] [CrossRef]
- Rees, D.D.; Gunning, P.J.; Orsi, A.; Howson, P.A.; Barraclough, P.; Callizot., N. Dioxo-Alkanes and Dioxo-Alkenes. Patent WO 2008/003978 A2, 10 January 2008. [Google Scholar]
- Honish, C.; Osto, A.; de Matos, A.D.; Vincenzi, S.; Ruzza, P. Isolation of a tyrosinase inhibitor from unripe grapes juice: A spectrophotometric study. Food Chem. 2020, 305, 125506. [Google Scholar] [CrossRef]
- Lowry, J.P.; O’Neill, R.D. Homogeneous mechanism of ascorbic acid interference in hydrogen peroxide detection at enzyme-modified electrodes. Anal. Chem. 1992, 64, 453–456. [Google Scholar] [CrossRef]
- Pinna, A.; Ricco, R.; Migheli, R.; Rocchitta, G.; Serra, P.A.; Falcaro, P.; Malfatti, L.; Innocenzi, P. A MOF-based carrier for in situ dopamine delivery. RSC Adv. 2018, 8, 25664–25672. [Google Scholar] [CrossRef] [Green Version]
- Honisch, C.; Gazziero, M.; Dallocchio, R.; Dessì, A.; Fabbri, D.; Dettori, M.A.; Delogu, G.; Ruzza, P. Antamanide analogs as potential inhibitors of tyrosinase. Int. J. Mol. Sci. 2022, 23, 6240. [Google Scholar] [CrossRef]
- Laskowski, R.A.; Swindells, M.B. LigPlot+: Multiple ligand-protein interaction diagrams for drug discovery. J. Chem. Inf. Model. 2011, 51, 2778–2786. [Google Scholar] [CrossRef]
- Gerebtzo, G.; Li-Blatter, X.; Fischer, H.; Frentzel, A.; Seelig, A. Halogenation of Drugs Enhances Membrane Binding and Permeation. ChemBioChem 2004, 5, 676–684. [Google Scholar] [CrossRef]
- Hernandes, M.Z.; Cavalcanti, S.M.T.; Moreira, D.R.M.; de Azevedo Junior, W.F.; Leite, A.C.L. Halogen atoms in the modern medicinal chemistry. Drug Des. Curr. Drug Targets 2010, 11, 303–314. [Google Scholar] [CrossRef]
- Politzer, P.; Murray, J.S.; Clark, T. Halogen Bonding: An Electrostatically driven highly directional noncovalent interaction. Phys. Chem. Chem. Phys. 2010, 12, 7748–7757. [Google Scholar] [CrossRef]
- Auffinger, P.; Hays, F.A.; Westhof, E.; Ho, P.S. Halogen bonds in biological molecules. Proc. Natl. Acad. Sci. USA 2004, 101, 16789–16794. [Google Scholar] [CrossRef] [Green Version]
- Solem, E.; Tuczek, F.; Decker, H. Tyrosinase versus catechol oxidase: One asparagine makes the difference. Angew. Chem. Int. Ed. 2016, 55, 2884–2888. [Google Scholar] [CrossRef]
- Chang, T.-S. An updated review of tyrosinase inhibitors. Int. J. Mol. Sci. 2009, 10, 2440–2475. [Google Scholar] [CrossRef] [Green Version]
- Prabhakar, V.; Iqbal, H.; Balasubramanian, R. Antioxidant studies on monosubstituted chalcone derivatives -understanding substituent effects. Pak. J. Pharm. Sci. 2016, 29, 165–171. [Google Scholar]
- Huang, H.-C.; Hsieh, W.-Y.; Niu, Y.-L.; Chang, T.-M. Inhibition of melanogenesis and antioxidant properties of magnolia grandiflora L. flower extract. BMC Complement. Altern. Med. 2012, 12, 72. [Google Scholar] [CrossRef] [PubMed]
- Barberis, A.; Garbetta, A.; Cardinali, A.; Bazzu, G.; D’Antuono, I.; Rocchitta, G.; Fadda, A.; Linsalata, V.; D’Hallewin, G.; Serra, P.A.; et al. Real-time monitoring of glucose and phenols intestinal absorption through an integrated Caco-2TC7cells/biosensors telemetric device: Hypoglycemic effect of fruit phytochemicals. Biosens. Bioelectron. 2017, 88, 159–166. [Google Scholar] [CrossRef] [PubMed]
- Secchi, O.; Zinellu, M.; Spissu, Y.; Pirisinu, M.; Bazzu, G.; Migheli, R.; Desole, M.S.; O’Neill, R.D.; Serra, P.A.; Rocchitta, G. Further In-Vitro characterization of an implantable biosensor for ethanol monitoring in the brain. Sensors 2013, 13, 9522–9535. [Google Scholar] [CrossRef] [PubMed]
- Rocchitta, G.; Secchi, O.; Alvau, M.D.; Migheli, R.; Calia, G.; Bazzu, G.; Farina, D.; Desole, M.S.; O’Neill, R.D.; Serra, P.A. Development and characterization of an implantable biosensor for telemetric monitoring of ethanol in the brain of freely moving rats. Anal. Chem. 2012, 84, 7072–7079. [Google Scholar] [CrossRef] [PubMed]
- Farina, D.; Zinellu, M.; Fanari, M.; Porcu, M.C.; Scognamillo, S.; Puggioni, G.M.G.; Rocchitta, G.; Serra, P.A.; Pretti, L. Devel-opment of a biosensor telemetry system for monitoring fermentation in craft breweries. Food Chem. 2017, 218, 479–486. [Google Scholar] [CrossRef]
- Migheli, R.; Lostia, G.; Galleri, G.; Rocchitta, G.; Serra, P.A.; Bassareo, V.; Acquas, E.; Peana, A.T. Neuroprotective effect of (R)-(-)-linalool on oxidative stress in PC12 cells. Phytomed. Plus 2021, 1, 100073. [Google Scholar] [CrossRef]
- Casula, M.; Muggiano, A.; Cossu, A.; Budroni, M.; Caracò, C.; Ascierto, P.A.; Pagani, E.; Stanganelli, I.; Canzanella, S.; Sini, M.; et al. Role of key-regulator genes in melanoma susceptibility and pathogenesis among patients from South Italy. BMC Cancer 2009, 9, 352. [Google Scholar] [CrossRef] [Green Version]
- Pisano, M.; Pagnan, G.; Dettori, M.A.; Cossu, S.; Caffa, I.; Sassu, I.; Emionite, L.; Fabbri, D.; Cilli, M.; Pastorino, F.; et al. Enhanced anti-tumor activity of a new curcumin-related compound against melano-ma and neuroblastoma cells. Mol. Cancer 2010, 9, 137. [Google Scholar] [CrossRef] [Green Version]
- Kumar, P.; Nagarajan, A.; Uchil, P.D. Analysis of cell viability by the MTT assay. Cold Spring Harb. Protoc. 2018, 6. [Google Scholar] [CrossRef]
- Wang, H.M.; Chen, C.Y.; Wen, Z.H. Identifying melanogenesis inhibitors from Cinnamomum subavenium with in vitro and in vivo screening systems by targeting the human tyrosinase. Exp. Dermatol. 2011, 20, 242–248. [Google Scholar] [CrossRef]
- Dennington, R.; Keith, T.A.; Millam, J.M. GaussView, Version 6; Semichem Inc.: Shawnee Mission, KS, USA, 2016. [Google Scholar]
- Frisch, M.J.; Trucks, G.W.; Schlegel, H.B.; Scuseria, G.E.; Robb, M.A.; Cheeseman, J.R.; Scalmani, G.; Barone, V.; Petersson, G.A.; Nakatsuji, H.; et al. Gaussian 16, Revision C.01; Gaussian, Inc.: Wallingford, CT, USA, 2016. [Google Scholar]
- Sendovski, M.; Kanteev, M.; Adir, N.; Fishman, A. Crystal Structure of Tyrosinase from Bacillus Megaterium. PDB Protein Data Bank. Available online: https://www.rcsb.org/structure/3nm8 (accessed on 17 November 2010). [CrossRef]
- Sendovski, M.; Kanteev, M.; Ben-Yosef, V.S.; Adir, N.; Fishman, A. Crystallization and preliminary X-ray crystallographic analysis of a bacterial tyrosinase from Bacillus megaterium. Acta Crystallogr. Sect. F Struct. Biol. Cryst. Commun. 2010, 66, 1101–1103. [Google Scholar] [CrossRef] [Green Version]
- Pettersen, E.F.; Goddard, T.D.; Huang, C.C.; Couch, G.S.; Greenblatt, D.M.; Meng, E.C.; Ferrin, T.E. UCSF Chimera—A visualization system for exploratory research and analysis. J. Comput. Chem. 2004, 25, 1605–1612. [Google Scholar] [CrossRef] [Green Version]
- Gasteiger, J.; Marsili, M. Iterative partial equalization of orbital electronegativity-a rapid access to atomic charges. Tetrahedron 1980, 36, 3219–3228. [Google Scholar] [CrossRef]
- Morris, G.M.; Huey, R.; Lindstrom, W.; Sanner, M.F.; Belew, R.K.; Goodsell, D.S.; Olson, A.J. AutoDock4 and AutoDockTools4: Automated docking with selective receptor flexibility. J. Comput. Chem. 2009, 30, 2785–2791. [Google Scholar] [CrossRef]


| Compound | Dopamine | Inhibitor + Dopamine | ||||
|---|---|---|---|---|---|---|
| VMAX (nA) | KM (mM) | VMAX (nA) | KM (mM) | Type of Inhibition | IC50 (nM) | |
| 1 | 157.4 ± 17.7 | 0.453 ± 0.221 | 143.6 ± 18.7 | 19.910 ± 7.610 * | COMPETITIVE | 24 |
| 6 | 47.71 ± 1.6 | 1.348 ± 0.217 | 30.33 ± 2.8 | 10.320 ± 3.338 * | COMPETITIVE | 11 |
| 7 | 256.7 ± 16.2 | 4.727 ± 1.074 | 185.9 ± 13.6 * | 12.131 ± 2.763 * | MIXED | 12 |
Publisher’s Note: MDPI stays neutral with regard to jurisdictional claims in published maps and institutional affiliations. |
© 2022 by the authors. Licensee MDPI, Basel, Switzerland. This article is an open access article distributed under the terms and conditions of the Creative Commons Attribution (CC BY) license (https://creativecommons.org/licenses/by/4.0/).
Share and Cite
Rocchitta, G.; Rozzo, C.; Pisano, M.; Fabbri, D.; Dettori, M.A.; Ruzza, P.; Honisch, C.; Dallocchio, R.; Dessì, A.; Migheli, R.; et al. Inhibitory Effect of Curcumin-Inspired Derivatives on Tyrosinase Activity and Melanogenesis. Molecules 2022, 27, 7942. https://doi.org/10.3390/molecules27227942
Rocchitta G, Rozzo C, Pisano M, Fabbri D, Dettori MA, Ruzza P, Honisch C, Dallocchio R, Dessì A, Migheli R, et al. Inhibitory Effect of Curcumin-Inspired Derivatives on Tyrosinase Activity and Melanogenesis. Molecules. 2022; 27(22):7942. https://doi.org/10.3390/molecules27227942
Chicago/Turabian StyleRocchitta, Gaia, Carla Rozzo, Marina Pisano, Davide Fabbri, Maria Antonietta Dettori, Paolo Ruzza, Claudia Honisch, Roberto Dallocchio, Alessandro Dessì, Rossana Migheli, and et al. 2022. "Inhibitory Effect of Curcumin-Inspired Derivatives on Tyrosinase Activity and Melanogenesis" Molecules 27, no. 22: 7942. https://doi.org/10.3390/molecules27227942
APA StyleRocchitta, G., Rozzo, C., Pisano, M., Fabbri, D., Dettori, M. A., Ruzza, P., Honisch, C., Dallocchio, R., Dessì, A., Migheli, R., Serra, P., & Delogu, G. (2022). Inhibitory Effect of Curcumin-Inspired Derivatives on Tyrosinase Activity and Melanogenesis. Molecules, 27(22), 7942. https://doi.org/10.3390/molecules27227942