Article

3DG Functionalized Magnetic Solid Phase Extraction Materials for the Efficient Enrichment of Hexamethylenetetramine in Vermicelli

1
Key Laboratory of Guangxi Colleges and Universities for Food Safety and Pharmaceutical Analytical Chemistry, Guangxi Key Laboratory of Chemistry and Engineering of Forest Products, School of Chemistry and Chemical Engineering, Guangxi University for Nationalities, Nanning 530008, China
2
Guangxi Key Laboratory of Utilization of Microbial and Botanical Resources, School of Marine Sciences and Biotechnology, Guangxi University for Nationalities, Nanning 530008, China
*
Authors to whom correspondence should be addressed.
Molecules 2022, 27(5), 1548; https://doi.org/10.3390/molecules27051548
Submission received: 15 January 2022 / Revised: 19 February 2022 / Accepted: 22 February 2022 / Published: 25 February 2022

Abstract

:
Solid phase extraction (SPE) is regarded as the most effective purification method for complex matrix samples owing to its simplicity of operator, time-saving, high accuracy, and environmental friendliness. SPE technology is still affected by the high cost of commercial SPE columns and poor adsorption selectivity. Hence, the development of low-cost and highly selective adsorbents is quite challenging and demanding in SPE. In this study, a novel 3DG functionalized magnetic solid phase extraction materials was prepared based on “thiol-ene” click chemistry. The structure, morphology, thermal stability, and magnetic properties of the magnetic composites were studied by Fourier transform infrared spectroscopy (FT-IR), scanning electron microscopy (SEM), energy dispersive spectroscopy (EDS), thermogravimetric analysis (TGA), and vibrating sample magnetometer (VSM). Then the adsorption performance of composite was determined by static adsorption experiments, which showed fast binding kinetics (100 min) and good adsorption performance (Qe = 65.34 mg/g). Moreover, these magnetic nanoparticles were used as adsorbents for magnetic solid phase extraction (MSPE) and coupled with high-performance liquid chromatography (HPLC) for separation and detection of illegally added hexamethylenetetramine in vermicelli. As for practical application, the recoveries for the spiked samples in the concentration range of 8–40 μg/g were between 83.24–92.69%, and the RSD was between 0.20–2.07%.

Graphical Abstract

1. Introduction

Hexamethylenetetramine (HMT) is an industrially important raw material and common drug, often used as a curing agent for resins and for the treatment of livestock diseases [1,2,3]. It is sometimes illegally added to food, such as in bean vermicelli and dried beancurd sticks, to increase profits. HMT not only improves the taste of food, but also releases formaldehyde and ammonia under acidic conditions [4], and hence improves the whitening and anti-corrosion properties [5]. However, formaldehyde released by HMT are carcinogenic and toxic, endangering human health [6]. Therefore, the National Health Commission of China promulgated a list of non-edible and food additives that may be added illegally to food; the list includes 151 illegal or regulated substances, such as sulfa antibiotics and HMT, that have been found in food and feed over the past few years [7]. Other countries such as the United States and Australia have limited or forbidden the addition of HMT in food manufacturing [8,9]. There is also an urgent need to develop a proper separation and detection method to crack down on the illegal addition of HMT in food.
Presently, the commonly used methods for detection of HMT include spectrophotometry [10], chromatography [11], Raman spectroscopy [12], and high-performance liquid chromatography/tandem mass spectrometry method (HPLC-MS/MS) [13]. However, detection of trace components directly from a complex matrix by these methods is difficult. Hence, these methods of analysis require suitable sample pretreatments, such as the QuEChERS method [13] and SPE method [14,15]. These methods are often time-consuming, complicated, and usually coupled with expensive mass spectrometric techniques requiring isotopic labeling. Therefore, in order to properly develop these detection techniques, it is necessary to explore a more economical and practical sample pretreatment technique for the separation and enrichment of HMT in complex food.
Magnetic solid phase extraction (MSPE) is an important sample pretreatment technique [16], which is developing rapidly and has been widely applied for testing of food, medicine, and the environment. Novel 3DG was chosen for the fabrication of magnetic functional materials employing “click chemistry”. 3DG is a kind of graphene material with a specific three-dimensional spatial micro/nanostructure structure assembled from graphene sheets [17]. This structure combines the intrinsic properties of graphene with the three-dimensional porous structure having a larger specific surface area and a greater number of active sites [18]. Therefore, it has been widely used in composite materials recently [19,20]. “Click chemistry” is a new synthetic approach for drugs and polymer proposed by Sharpless, which has characteristics of high efficiency, reliability, selectivity, and non-metal catalysis [21]. The “thiol-ene” click reaction is one of the simplest reactions in click chemistry because of its high reaction efficiency extensive applications [22].
In this study, a novel composite for MSPE was developed and coupled with HPLC to efficiently extract and determine the amount of HMT, in order to overcome the shortcomings of the traditional methods. The performance of this novel composite was improved due to the 3D graphene structure, which endowed it with a more specific surface area, ease of modification, and functionalization [23,24]. Meanwhile, “thiol-ene” click reaction has made the synthesis process of composite more efficient and environmentally friendly [21,22]. Then, the nanocomposite was characterized and the thermodynamic and kinetic studies of adsorption were carried out. The obtained composite was applied as magnetic solid phase extraction material for separation and enrichment of HMT, and then combined with HPLC to detect HMT in actual samples.

2. Results and Discussion

In this study, Fe3O4 nanoparticles were synthesized by the chemical coprecipitation method. Then, 3DG was used to wrap up the surface of the Fe3O4 nanoparticles to afford Fe3O4@3DG with a high specific surface area. The surface fixed vinyl groups of silanized Fe3O4@3DG@VTMOS coated on Fe3O4@3DG were prepared by the sol-gel method; this surface modification effectively improved the dispersion magnetite nanoparticles in liquid media and enhanced the stability of the compound. Fe3O4@3DG@VTMOS were further reacted with TMA to introduce sulfhydryl groups through “thiol-ene” click chemistry under milder conditions to obtain Fe3O4@3DG@VTMOS@TMA. The methodology of preparation of Fe3O4@3DG@VTMOS@TMA is presented in Scheme 1.

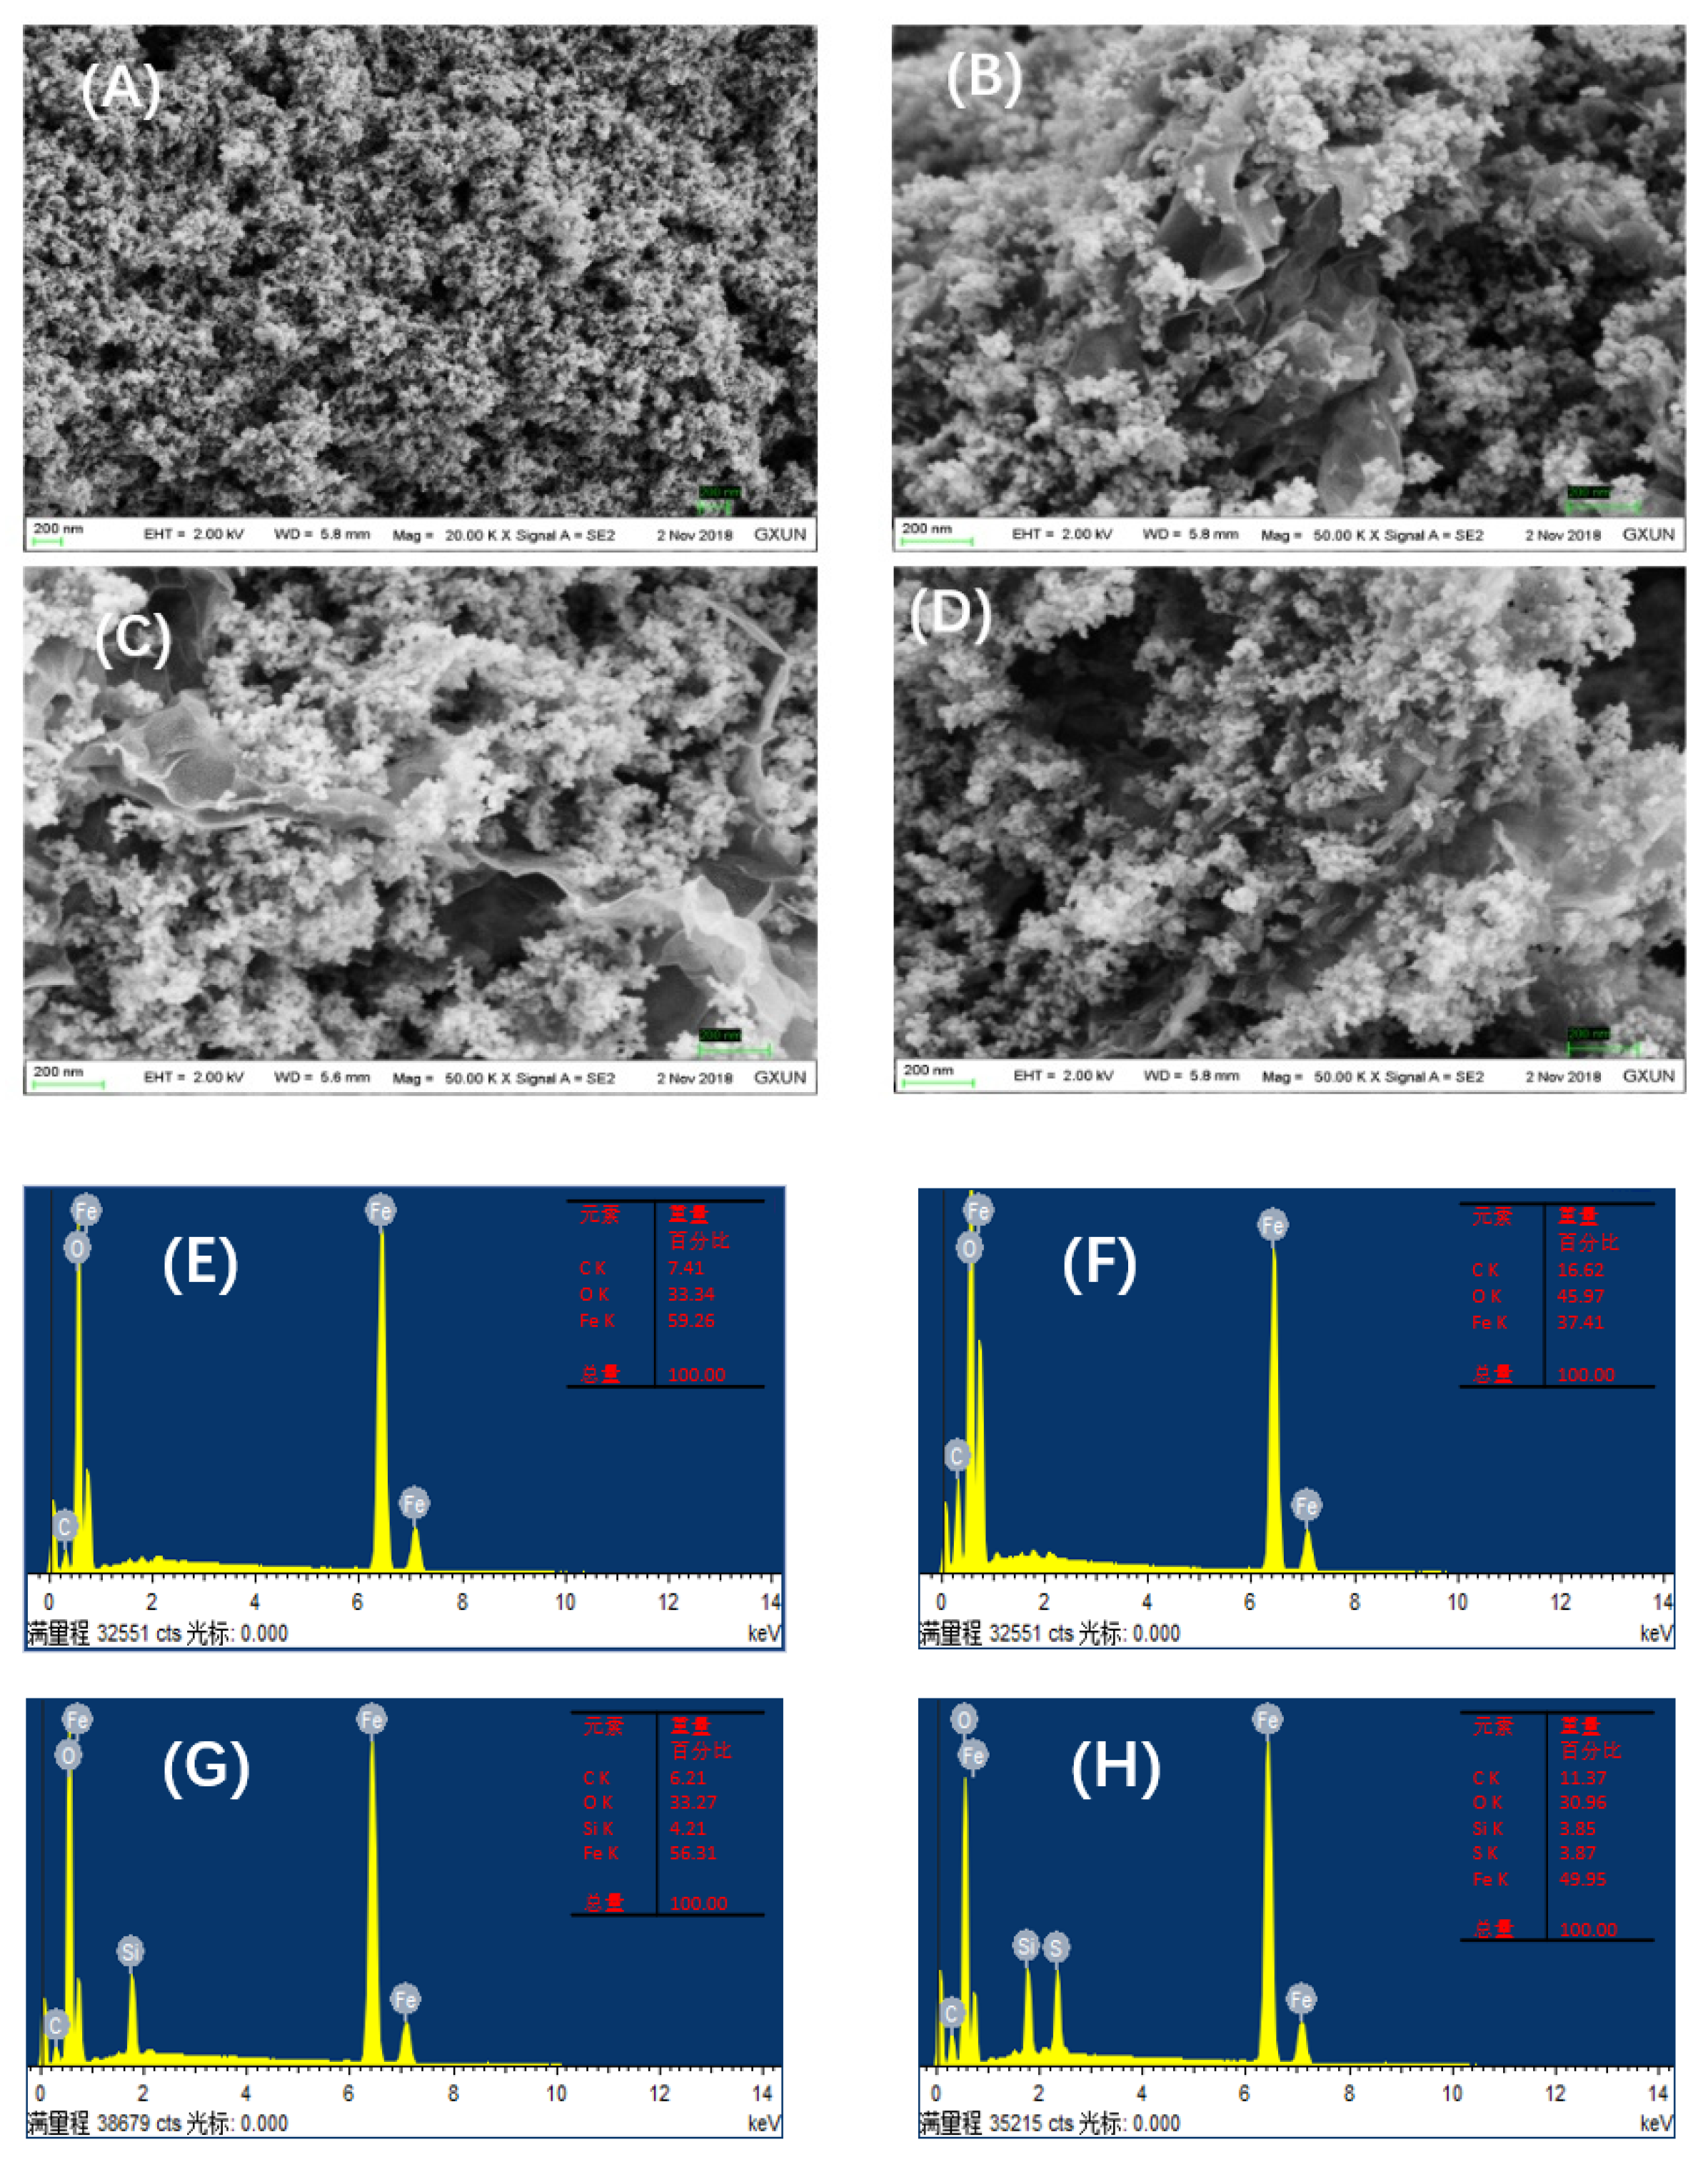
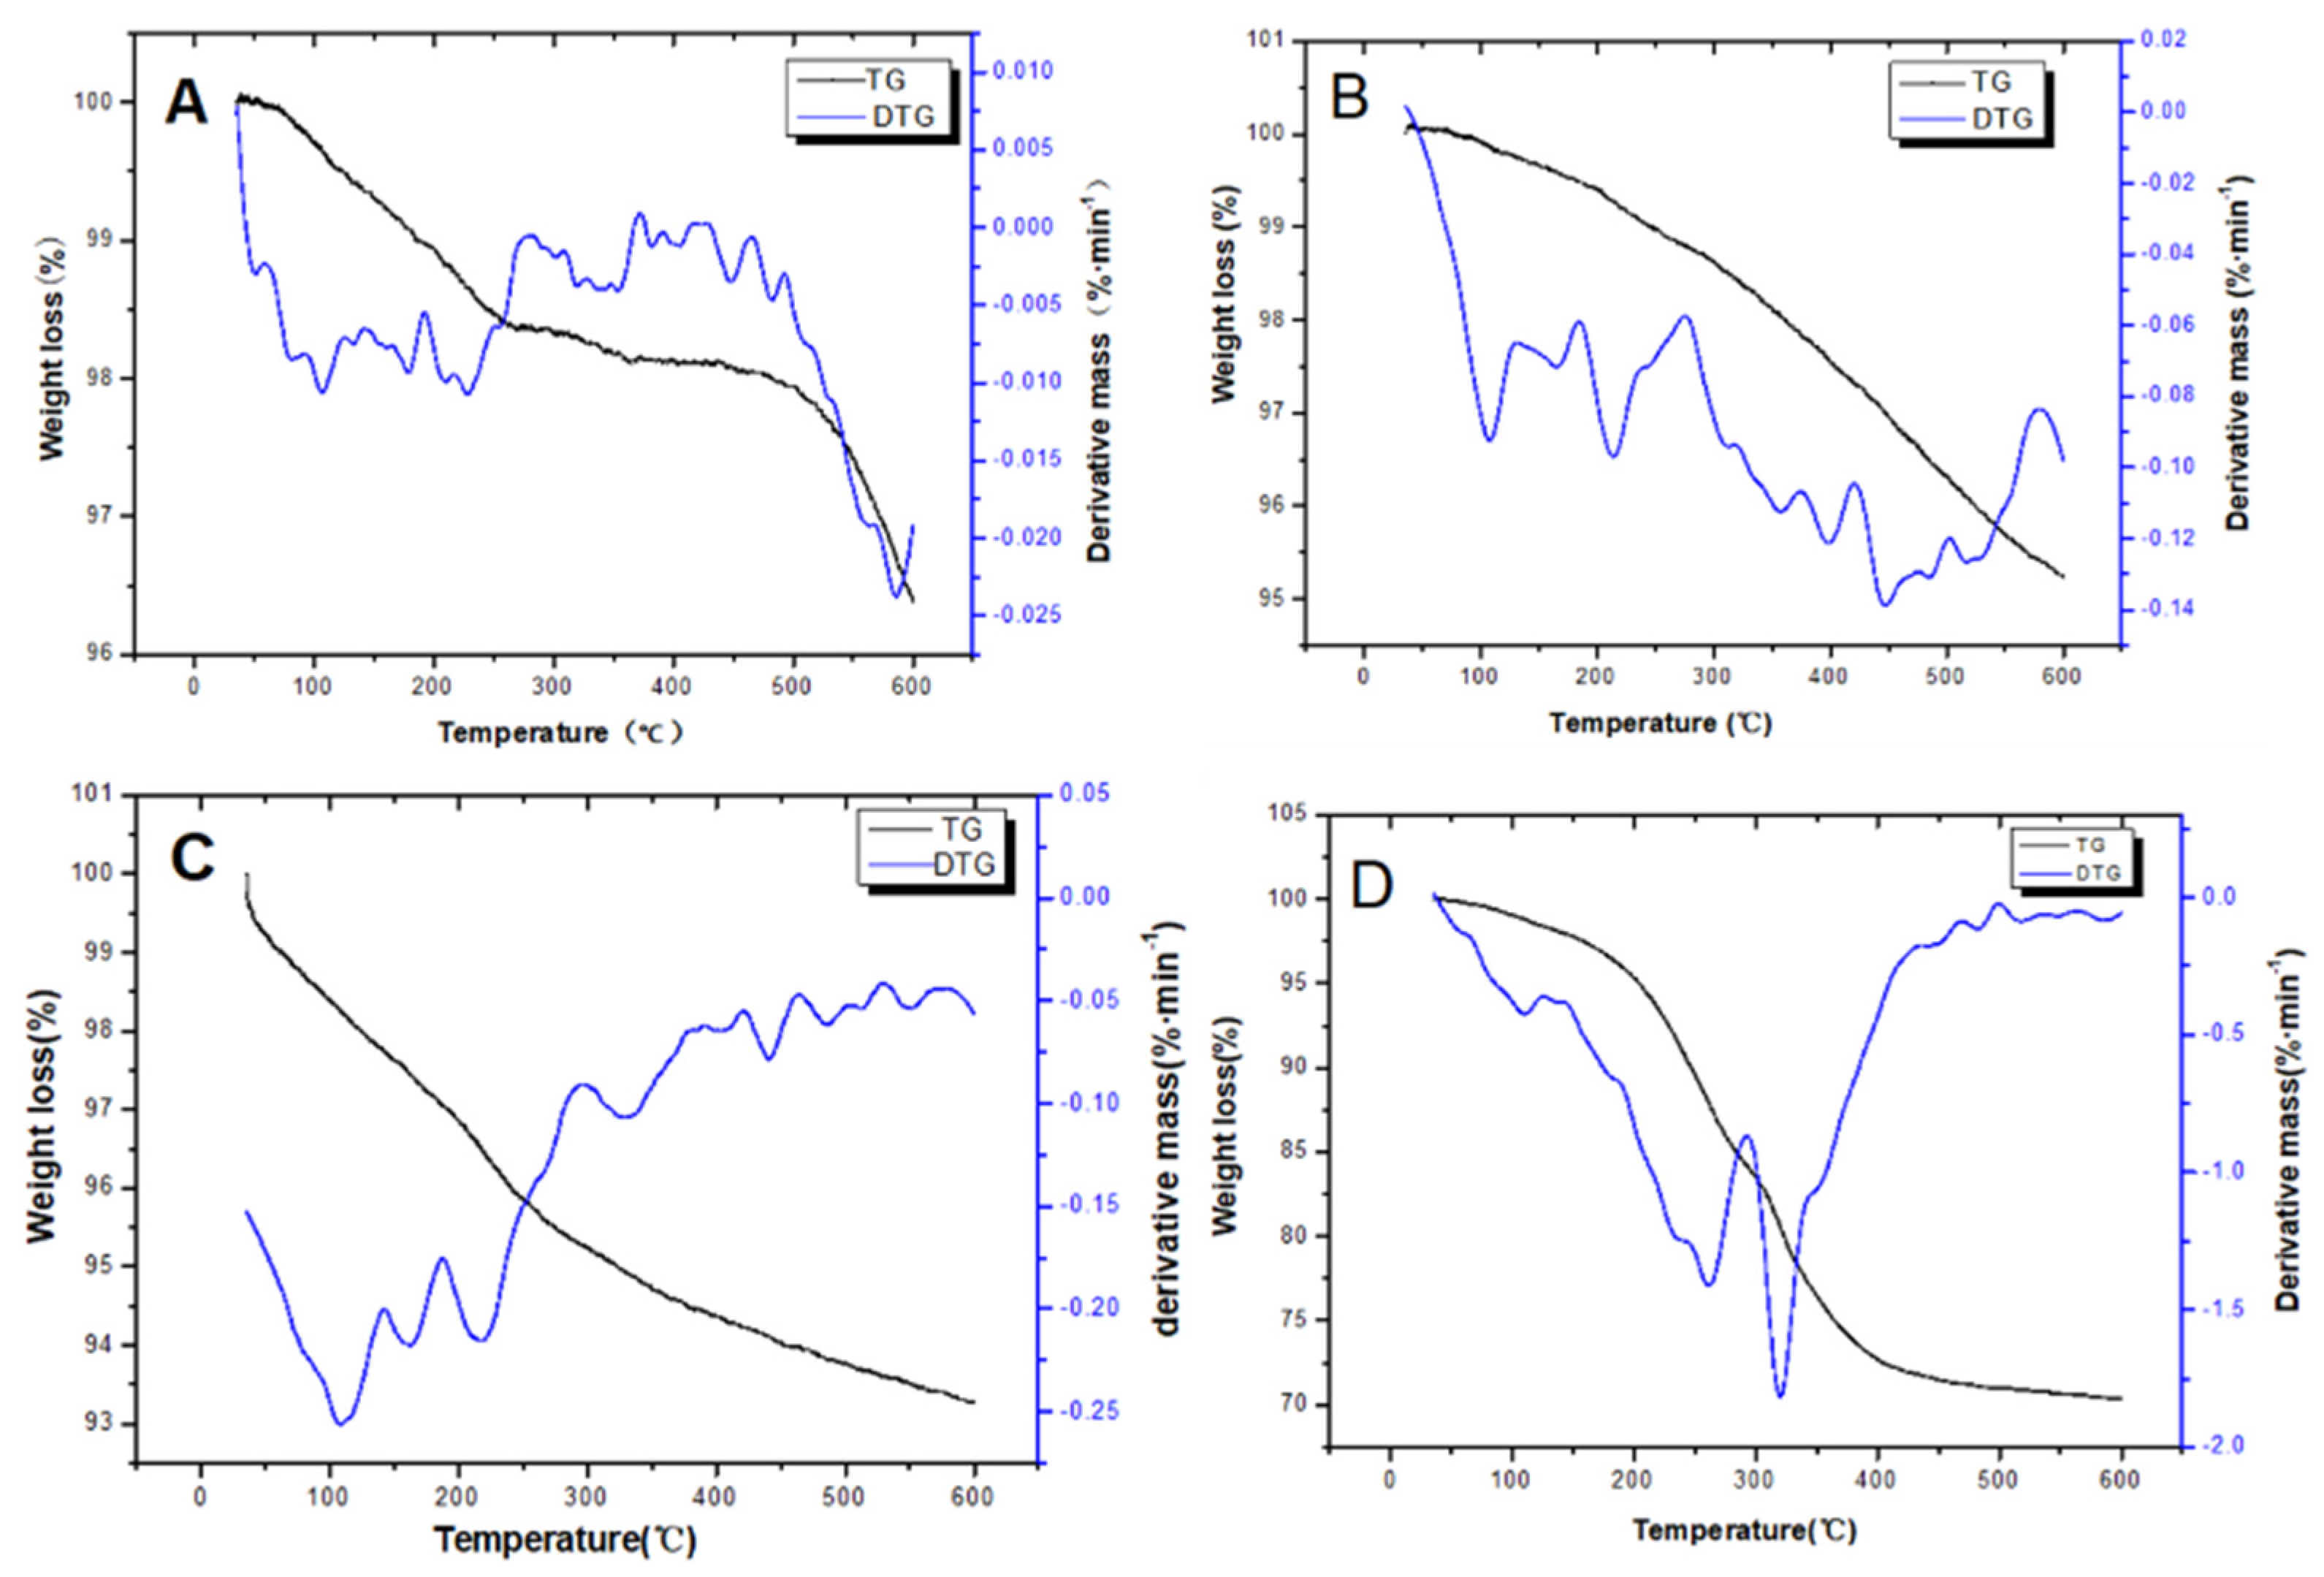
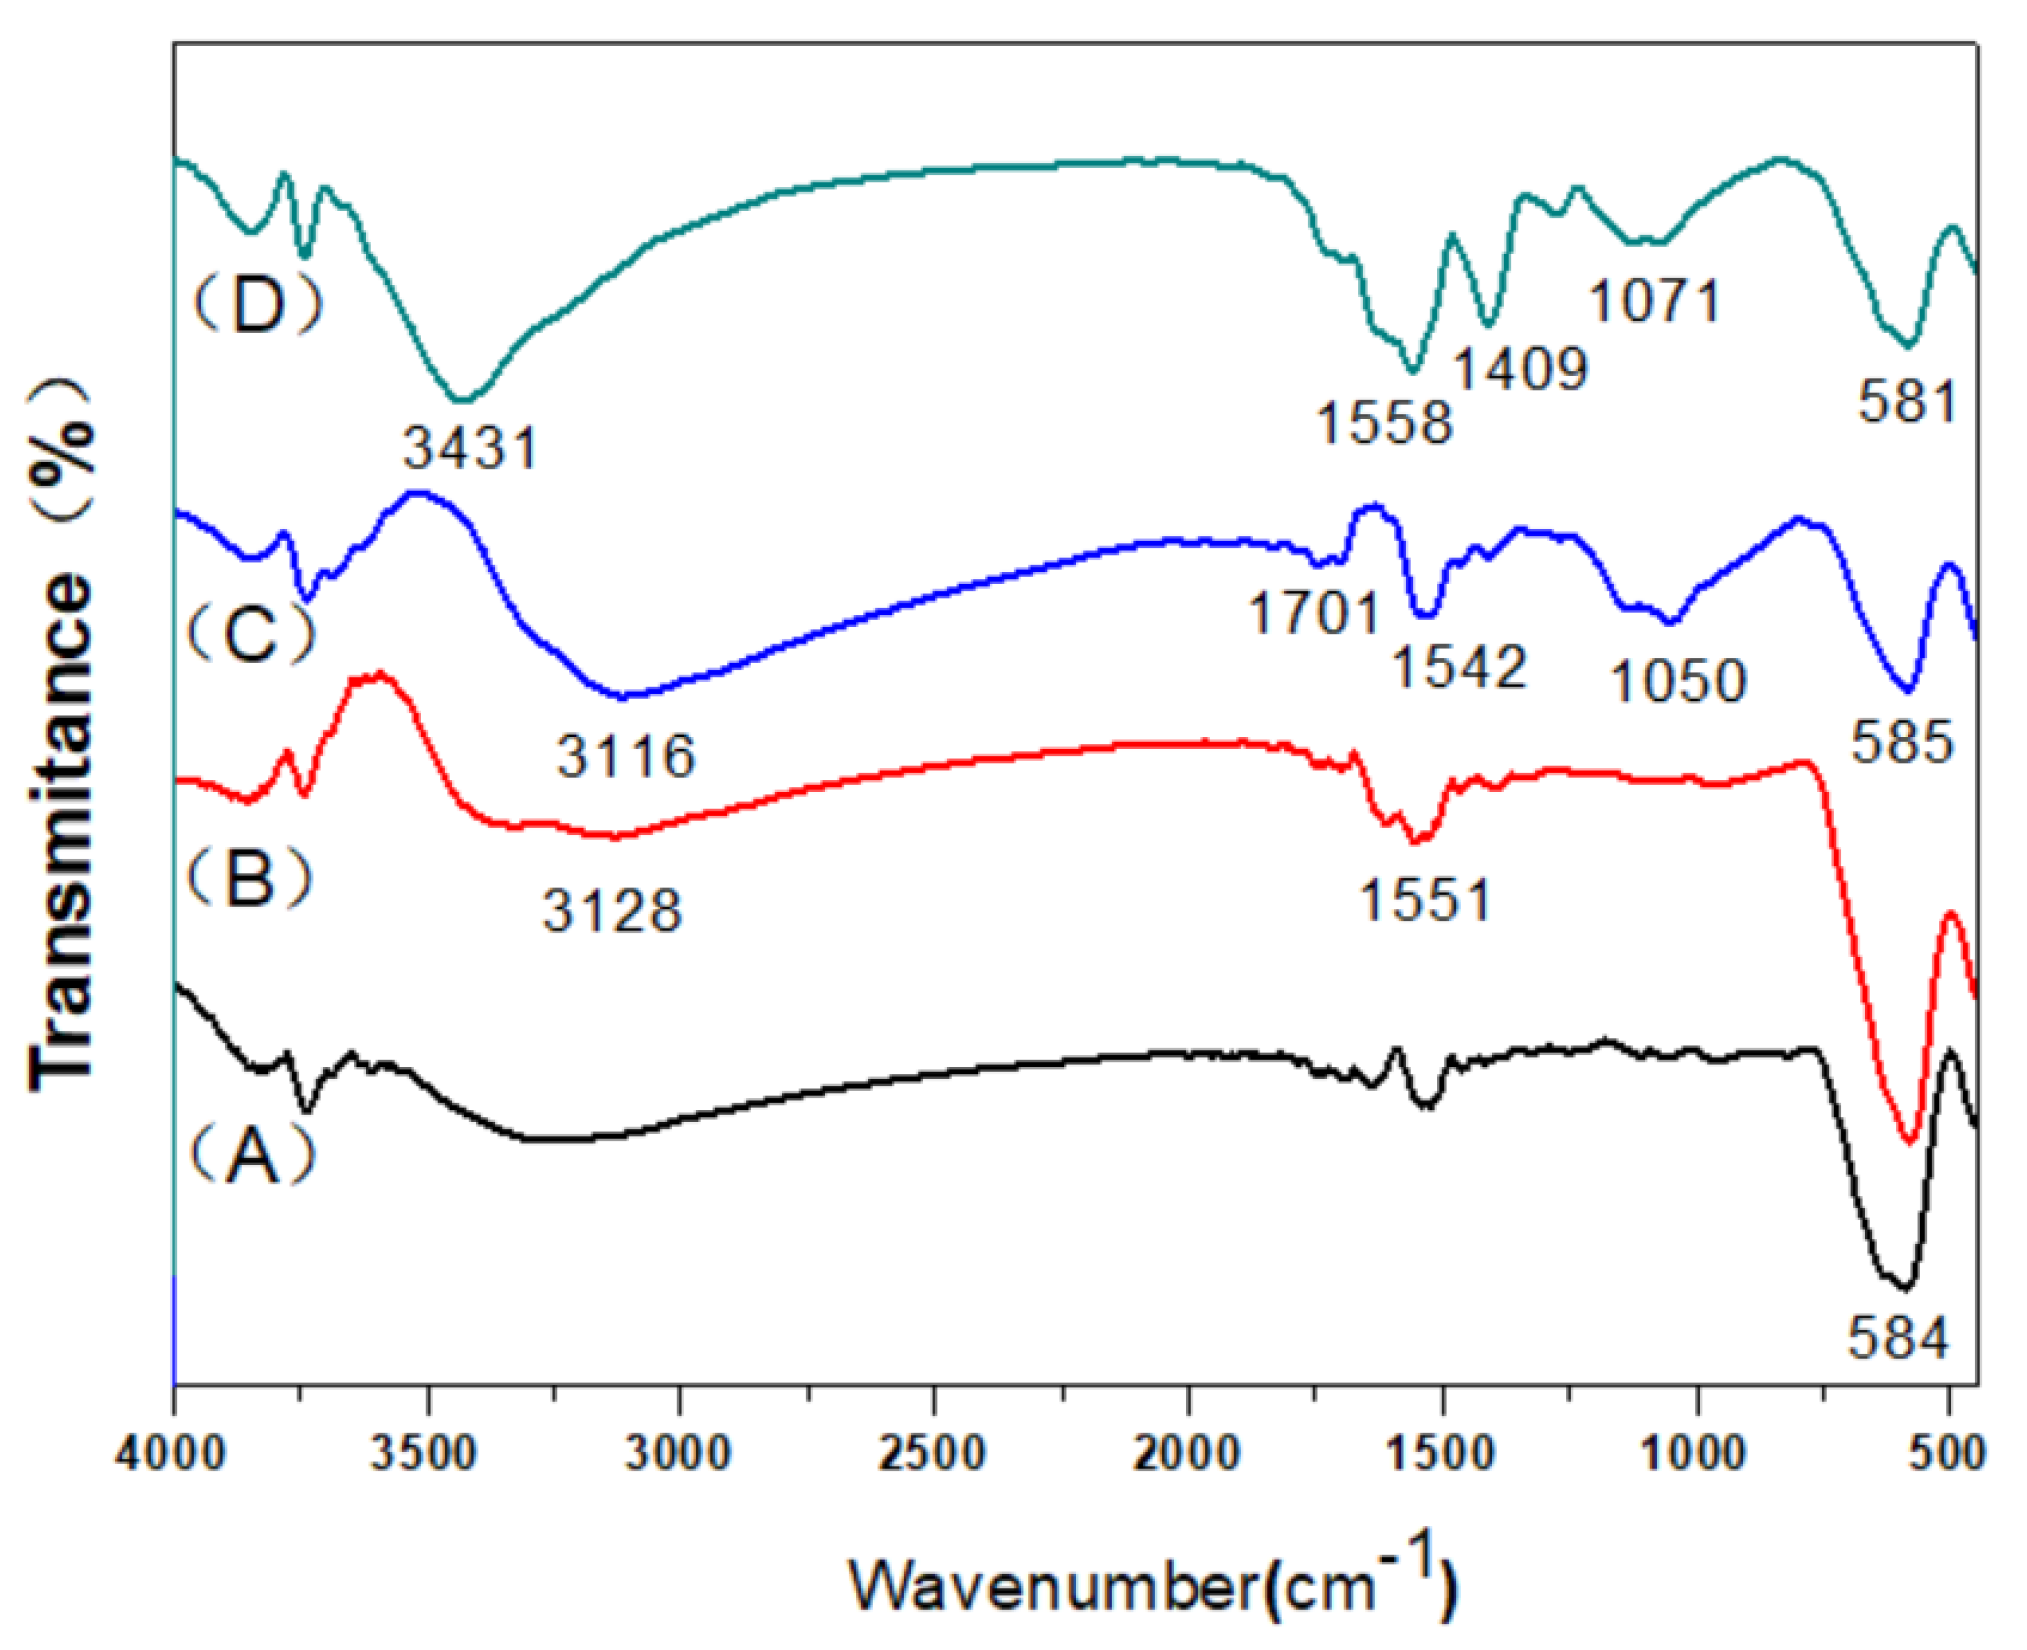
2.1. Characterizations

Fe3O4, Fe3O4@3DG, Fe3O4@3DG@VTMOS, and Fe3O4@3DG@VTMOS@TMA composites were characterized by SEM, EDS, FT-IR, TGA, and VSM.
The morphologies and elemental analysis of Fe3O4, Fe3O4@3DG, Fe3O4@3DG@VTMOS, and Fe3O4@3DG@VTMOS@TMA were examined by SEM and EDS spectra (Figure 1A–H). Figure 1A showed that Fe3O4 nanoparticles were regularly spherical in shape with a uniform size distribution, The average size of the Fe3O4 nanoparticles was found to be in the range of 20–30 nm by Nano Measurer software. As seen in Figure 1E, Fe3O4 nanoparticles were composed of the elements iron and oxygen. Trace carbon elements may be introduced by sample preparation with the electric conductive tapes. In Figure 1B, the surface of Fe3O4@3DG nanoparticles has a fluffy fold structure, wherein the specific surface area of the composite was increased. From Figure 1F, the weight percentage of carbon elements increased compared to Fe3O4 nanoparticles. It proves that 3DG was loaded on the surface of Fe3O4 successfully and homogeneously. Figure 1C,D showed that the particle sizes of Fe3O4@3DG@VTMOS and Fe3O4@3DG@VTMOS@TMA nanoparticles became bigger with the increase of surface modification layers of Fe3O4 nanoparticles. The presence of silicon and sulfur suggested that VTMOS and TMA were sufficiently polymerized on the surface of the composite (Figure 1G,H). Moreover, the appearance of 3DG is still visible on the surface of the composite also indicates the successful polymerization of the composite.
The TG and DTG analysis of Fe3O4 (Figure 2A), Fe3O4@3DG (Figure 2B), Fe3O4@3DG@VTMOS (Figure 2C), Fe3O4@3DG@VTMOS@TMA (Figure 2D) are shown in Figure 2. The weight losses of Fe3O4, Fe3O4@3DG, Fe3O4@3DG@VTMOS (Figure 2C), Fe3O4@3DG@VTMOS@TMA (Figure 2D) were 1.60, 1.20, 3.16, 4.65% from 35 °C to 200 °C, respectively, the weight loss was caused by the evaporation of residual solvents. As seen in Figure 2A, there is no obvious change in weight loss (0.4%) from 200 to 480 °C. The weight loss was about 1.64% after 480 °C, which was mainly attributed to Fe3O4 loses weight [25]. The TG and DTG curves of Fe3O4@3DG and Fe3O4@3DG@VTMOS exhibited weight loss peaks at 448.26 °C and 331.84 °C, respectively. The weight loss peak was caused by the decomposition of 3DG and sialylation coated on the surface of Fe3O4. The DTG curves of Fe3O4@3DG@VTMOS@TMA in Figure 2D contained two obvious weight loss peaks. The TG curves ranged from 200 °C to 280 °C. The weight losses were 10.05%. The weight loss peak at 262.28 °C was caused by the breaking of the bond between Fe304 and TMA, from 280 °C to 400 °C. The weight loss was 13.63%, with the weight loss peak at 319.92 °C. The other weight loss peak was caused by the burning of depolymerization between TMA units [26]. The weight losses of Fe3O4@3DG, Fe3O4@3DG@VTMOS, and Fe3O4@3DG@VTMOS composites were 5.0, 7.0, and 29.0%, respectively, between 35–600 °C.; this makes it evident that as Fe3O4 was modified to Fe3O4@3DG@VTMOS, it became more and more prone to thermal degradation.
FT-IR determines the structure of molecules or functional groups with infrared radiant energy. The FT-IR spectra of Fe3O4 (Figure 3A), Fe3O4@3DG (Figure 3B), Fe3O4@3DG@VTMOS (Figure 3C), and Fe3O4@3DG@VTMOS@TMA (Figure 3D) are shown in Figure 3. The peak at 580 cm−1 in the spectrum of Fe3O4 could be attributed to the Fe-O stretching vibrations (Figure 3A) [27]. In the spectrum of Fe3O4@3DG (Figure 3B), peaks at 1551 cm−1 and 3128 cm−1 could be ascribed to C=C stretching and C-H stretching vibrations of CH=CH2 group of 3DG, respectively [28]. This indicated that 3DG was successfully coated on the surface of Fe3O4 particles. Peaks at 1542 cm−1, 1701 cm−1, and 3116 cm−1 in the spectrum of Fe3O4@3DG@VTMOS (Figure 3C) were assigned to C=C, C=O, and C-H of CH=CH2, respectively. Moreover, stretching vibrations of Si-O-Si groups were observed at 1050 cm−1 [29]. Furthermore, peaks at 1409 cm−1 and 3431 cm−1 in the spectrum of Fe3O4@3DG@VTMOS@TMA, corresponding to C-C and -OH stretching vibrations of carboxyl groups (Figure 3D), confirmed the formation of the product.
The VSM curves of Fe3O4 (Figure 4A), Fe3O4@3DG (Figure 4B), Fe3O4@3DG@VTMOS (Figure 4C), and Fe3O4@3DG@VTMOS@TMA (Figure 4D) are shown in Figure 4. Results showed that all the composites possessed superparamagnetism and their saturation magnetization values were 69.33, 66.65, 58.86, and 38.04 emu/g, respectively. The magnetization values decreased as the Fe3O4 surface was modified. It was also clear that the Fe3O4@3DG@VTMOS@TMA could be simply separated using an external magnetic field.

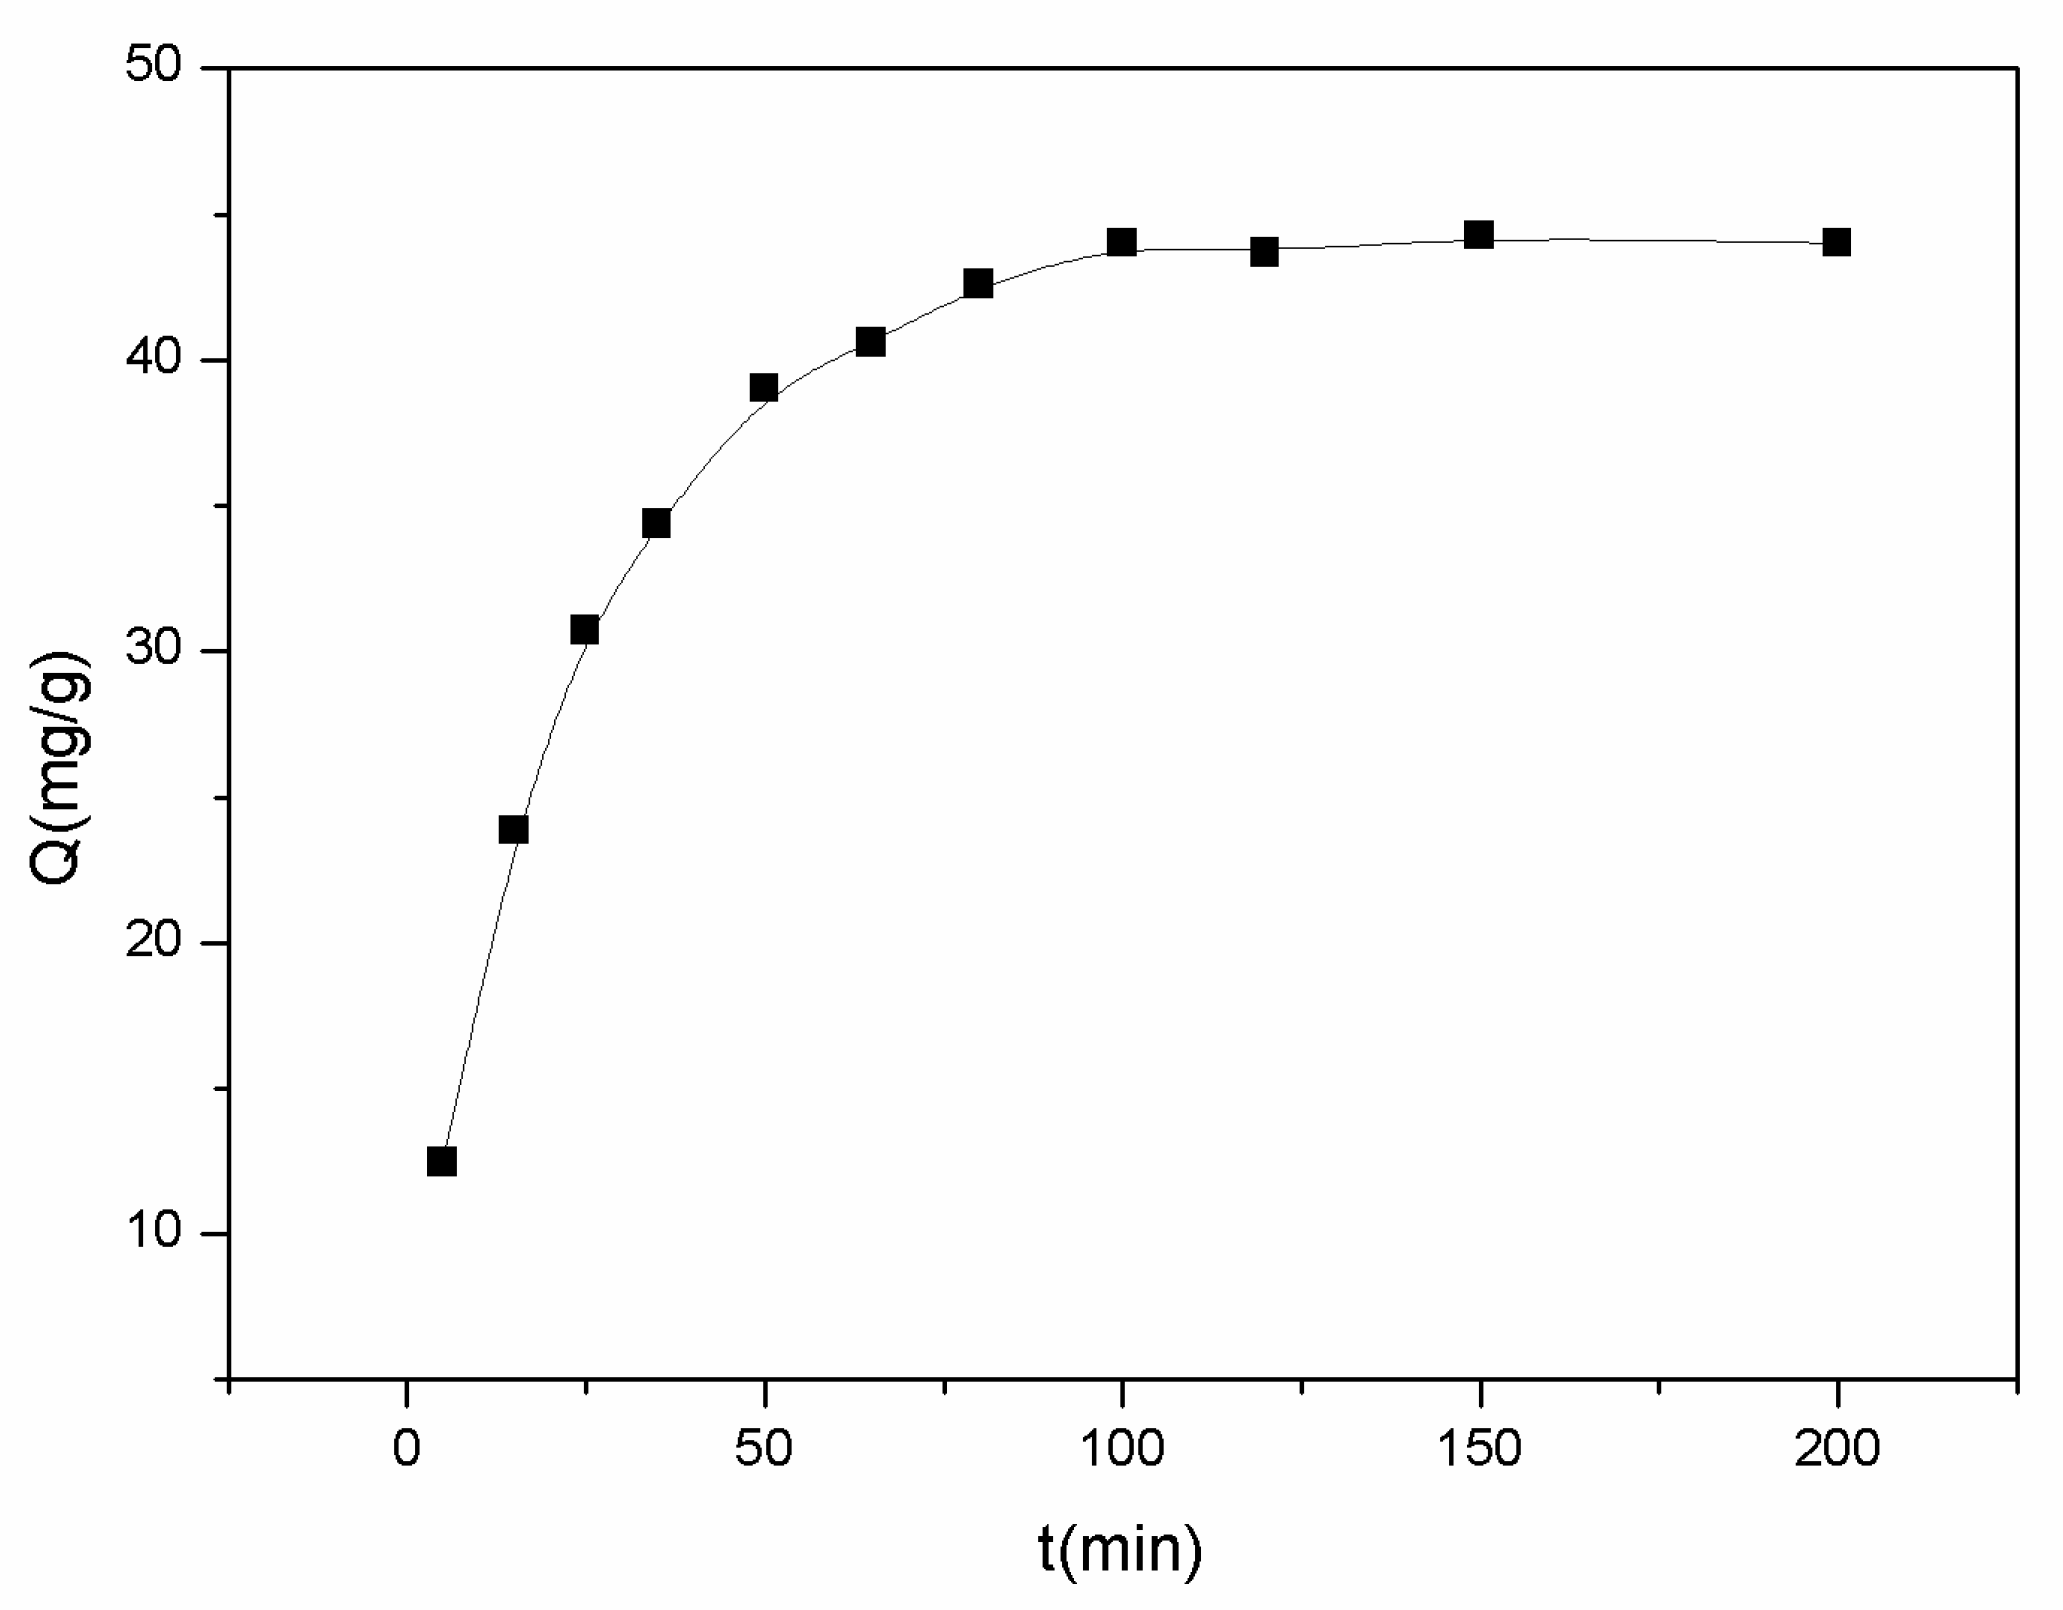
2.2. Study of Adsorption Properties

The kinetics and thermodynamics of adsorption of Fe3O4@3DG@VTMOS@TMA on HMT were investigated experimentally. Figure 5 shows the adsorption capacities of Fe3O4@3DG@VTMOS@TMA for HMT with a concentration of 1.0 mg/mL. It can be seen that the adsorption capacities of Fe3O4@3DG@VTMOS@TMA for HMT increased with time and remained basically unaltered from 100 to 300 min, and hence it can be inferred that the adsorption equilibrium was attained at 100 min.
To further study the kinetic mechanisms of the adsorption process, the pseudo-first-order and pseudo-second-order kinetic models were applied to fit the kinetic data according to the following equations [30,31,32]:
ln Q e Q t = ln Q e   k 1 t
t / Q t = t / Q e + 1 / k 2 Q e 2
where k1 and k2 are the rate constants of pseudo-first-order and pseudo-second-order kinetic models; Qe and Qt are the adsorption capacities (mg/g) at equilibrium and at time t (min); Qe and k can be calculated from the plots of ln(QeQt) versus t and t/Qt versus t, respectively.
From the data in Table 1, the adsorption kinetics of Fe3O4@3DG@VTMOS@TMA conformed well to the pseudo-second-order model (R2 = 0.9982), which could be expressed as t / Q t = 0.02094 t + 0.2617 .
Thermodynamic parameters of adsorption of HMT on Fe3O4@3DG@VTMOS@TMA were evaluated from the adsorptivities. This data was used to plot the adsorption isotherm of Fe3O4@3DG@VTMOS@TMA for different initial concentrations range of HMT from 0.2 to 2.0 mg/mL. As shown in Figure 6, the amount of HMT bound to Fe3O4@3DG@VTMOS@TMA increased rapidly with an increase in initial concentration up to 1.5 mg/mL. Binding saturation was attained above 1.5 mg/mL concentration between 20–40 °C. Furthermore, adsorptivity increased gradually with increased in adsorption temperature.
Thermodynamic parameters such as enthalpy change (ΔHθ), entropy change (ΔSθ), and the Gibb’s free energy change (ΔGθ) for Fe3O4@3DG@VTMOS@TMA were calculated from the following equations [33]:
Δ G θ = R T ln K d
ln K d = Δ H θ / R T + Δ S θ / R
K d = C p / C s
where R is the gas constant (8.314 J/mol·K) and T is the reaction temperature (K).
Plotting lnKd versus 1/T, the fitting equation is ln K d = 2260.01 / T + 11.31 (R2 = 0.9972). ΔHθ and ΔSθ were obtained from the plots. The thermodynamic parameters for the adsorption of HMT on Fe3O4@3DG@VTMOS@TMA, shown in Table 2, were calculated from the intercept and slope of the equation.
The negative values of ΔGθ suggested that the spontaneity of the adsorption process increased with increasing temperature. Additionally, the positive values of ΔHθ indicated that the adsorption process was endothermic, whereas the positive ΔSθ value suggested that the randomness increased in the adsorption system.
In order to further investigate the adsorption performance of Fe3O4@3DG@VTMOS@TMA for HMT, the adsorption isotherms and parameters were described by the Langmuir equation [34] and Freundlich equation [35], respectively:
1 / Q e = 1 / Q m a x K L C e + 1 / Q m a x
where Qmax is the maximum adsorptivity at adsorption equilibrium (mg/g); KL represents the equilibrium adsorption constant.
ln Q e = ln C e / n + ln K F
where KF represents the adsorption capacity and n is the adsorption intensity. Equilibrium adsorption data were modeled by plotting 1/Qe versus 1/Ce and lnQe versus lnCe to fit the Langmuir and Freundlich equations, respectively.
As shown in Table 3, the adsorption of HMT on Fe3O4@3DG@VTMOS@TMA was well consistent with the Langmuir adsorption model (0.9891 < R2 < 0.9942), which suggested a monolayer of adsorption. Besides, Qmax and KL increased with an increase in temperature. The values of Qmax obtained by the Langmuir equation were higher than the actual measured values, indicating that the synthesis conditions can be continuously optimized to improve the adsorptivity of the Fe3O4@3DG@VTMOS@TMA. The adsorption of HMT on Fe3O4@3DG@VTMOS@TMA was mainly controlled by chemical adsorption in nature.

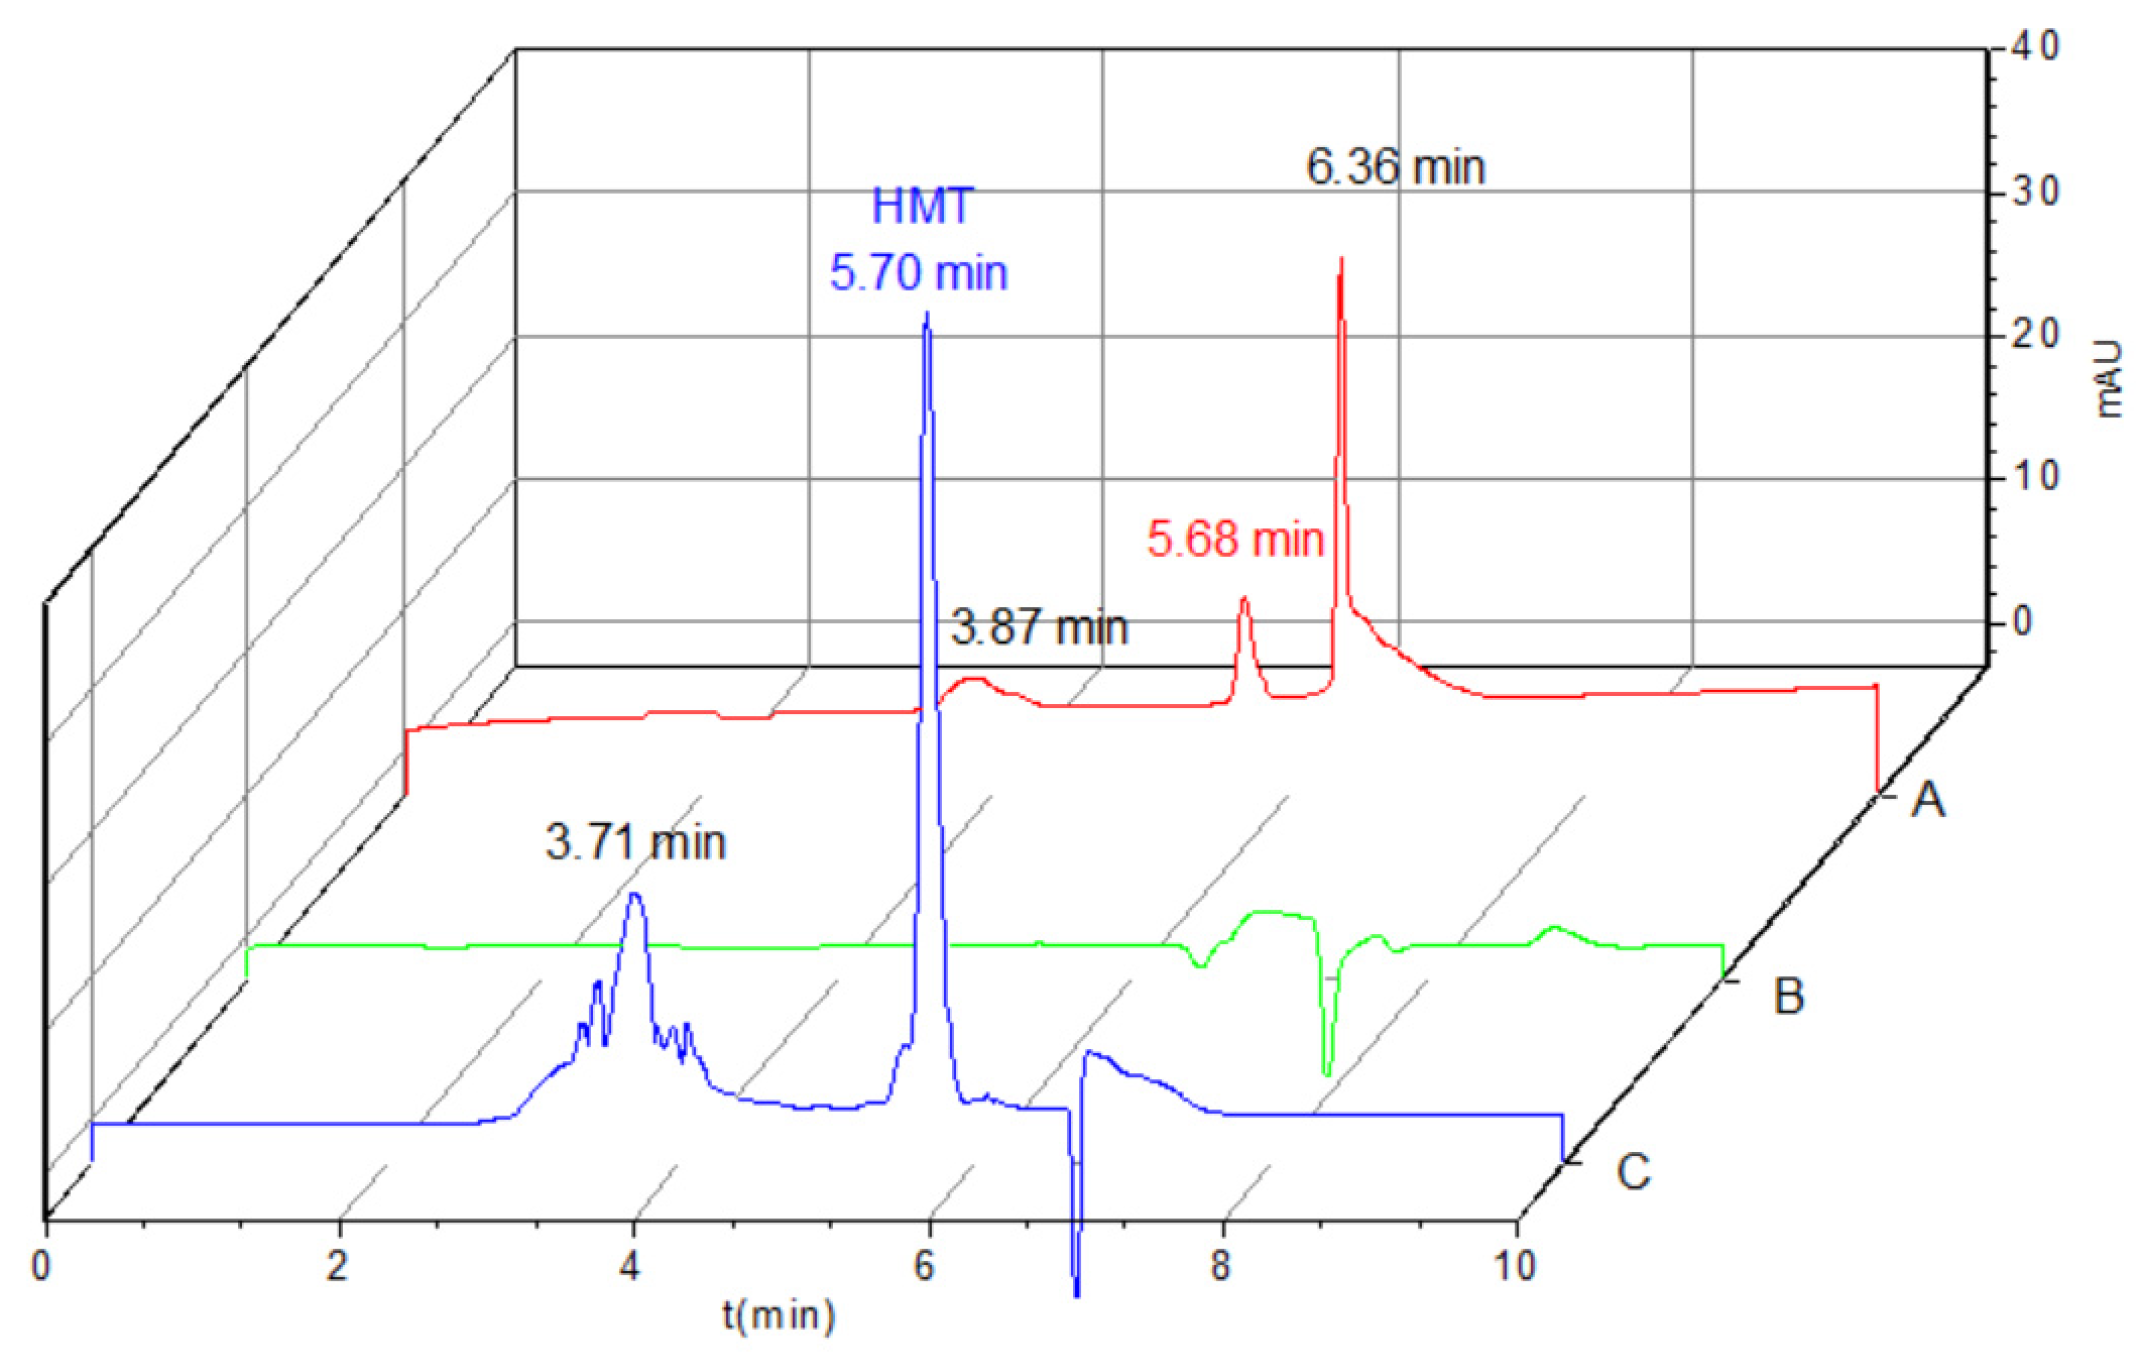
2.3. Validation of Method

The method was validated by plotting the standard calibration curve using solutions of HMT in the concentration range from 1.0 to 10.0 µg/mL. The linear regression equations for HMT was expressed as S = 51.7850 C 0.3372 (R2 = 0.9997), which was obtained from the plot of peak areas versus mass concentration for HMT. The limit of detection (LOD, S/N = 3) and the limit of quantification (LOQ, S/N = 10) measured for HMT were 0.25 and 0.60 µg/mL, respectively.

2.4. Analysis of the Real Samples

In order to validate the practical application of the MSPE-HPLC method, spike and recovery experiments for the analysis of HMT in vermicelli samples with spike levels of 8, 20, and 40 µg/g (Table 4) were carried out. These samples were randomly purchased from different manufacturers and markets. No HMT was detected in these samples above the levels examined. The recovery and the RSD were in the ranges of 83.24–92.69% and 0.20–2.07%, respectively.
Figure 7 shows the chromatograms of a spiked vermicelli sample before MSPE (Figure 7A), of raffinate (Figure 7B), and after MSPE (Figure 7C) (40 µg/g). After MSPE of spiked vermicelli samples using Fe3O4@3DG@VTMOS@TMA, the peak of HMT (5.70 min) was more intense than that before MSPE (5.68 min) without interference. These results indicate that the novel 3DG synergistic composite can not only adsorb the illegally added HMT, but also enrich it in the vermicelli samples.
Compared with other methods (Table 5), although the recovery of the proposed method was lower, the LOD and LOQ were better. Furthermore, the RSD values were also significantly smaller. Results showed that the MSPE-HPLC method established in this experiment had good accuracy and precision.

3. Materials and Methods

3.1. Reagents

All chemicals used were of analytical reagent grade unless otherwise specified. Hexamethylenetetramine (HMT) and mercaptosuccinic acid (TMA) were obtained from Sigma-Aldrich (St. Louis, MO, USA). Vinyltrimethoxysilane (VTMOS) was purchased from Fluorochem (Derbyshire, UK). Tetraethoxysilane (TEOS) was obtained from Tianjin Kemiou Chemical Reagent (Tianjin, China). Iron dichloride (FeCl2·4H2O) and iron chloride (FeCl3·6H2O) were acquired from Chron Chemicals (Chengdu, Sichuan, China). 2,2′-Azobisisobutyronitrile (AIBN) was obtained from J&K Chemical (Beijing, China). HPLC-grade acetonitrile was purchased from Fisher Scientific (Fairlawn, NJ, USA). Deionized water was obtained using a Milli-Q water purification system (Merck, Saint-Quentin, France).

3.2. Apparatus

Scanning electron microscopy (SEM) was performed using a SUPRA 55 Sapphire field emission scanning electron microscope equipped with OXFORD X-MaxN51-XMX1004 (Carl Zeiss, Jena, Germany). The samples were prepared by spreading the powder onto double sided carbon tape, mounted onto microscope holder, the gold was supported on the surface of the material by the sputter coating of the sample preparation technique. SEM images were captured at 20.00–50.00 K magnification and varying voltages of 2.00 kV. The Fourier-transform infrared (FT-IR) spectra were recorded on a Magna IR550 (II) type spectrophotometer (Nicolet, Waltham, MA, USA) using a KBr disc with a scanning range of 4000 to 400 cm−1 and wavenumber resolution was 4cm−1. Thermogravimetric analysis (TGA) was performed by the TG209F1 thermogravimetric analyzer (Netzsch, Selb, Germany) under nitrogen atmosphere in the temperature range of ambient temperature to 600 °C, at a heating rate of 10 °C/min. Magnetic properties of the samples were determined using a vibrating sample magnetometer (VSM) of Quantum Design PPMS DynaCool model (San Diego, CA, USA). The ultraviolet–visible (UV-vis) absorption spectra were recorded using a UV-1800 spectrophotometer from Suzhou Shimadzu Corporation (Suzhou, Jiangsu, China).

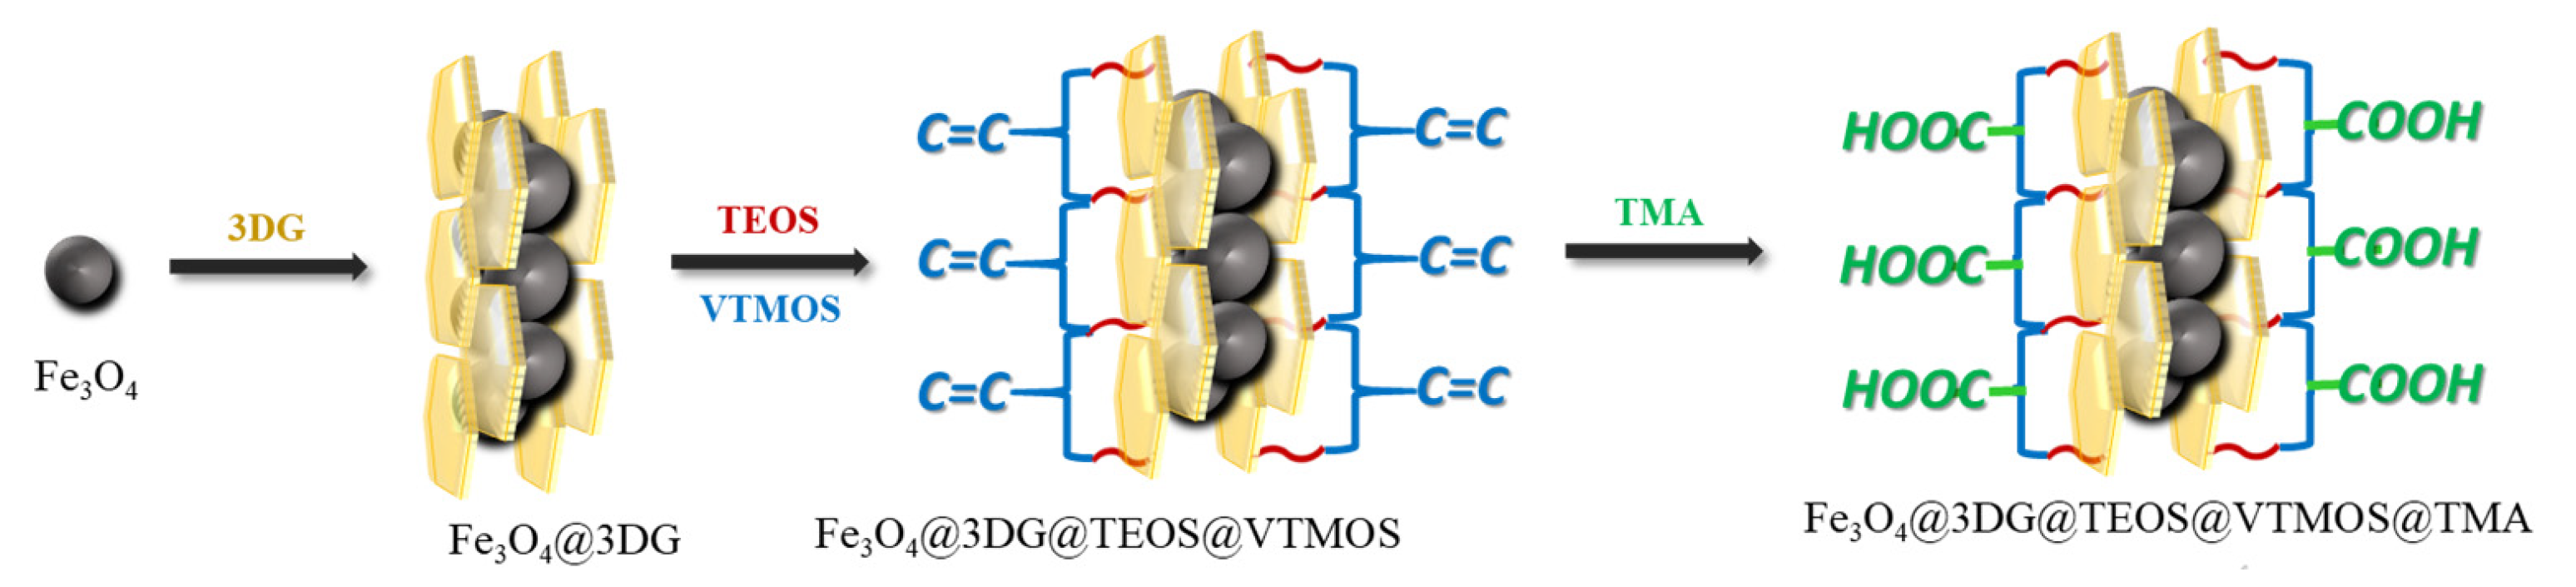
3.3. Preparation of Fe3O4@3DG@VTMOS@TMA

Fe3O4 nanoparticles were prepared by the coprecipitation method. Graphene (GO) was synthesized by a modified Hummers method, after which the 3D graphene (3DG) was wrapped onto the surface of Fe3O4 to obtain black Fe3O4@3DG. A mixture of TEOS (2 mmol) and Fe3O4@3DG (300 mg) was dissolved in 50 mL of ethanol ultrasonically for 5 min then transferred to a three-necked flask. VTMOS (2 mmol) dissolved in 50 mL of ethanol was added dropwise to the above solution. Aqueous ammonia was used to adjust the pH to 10 and stirred at 55 °C for 3 h in a nitrogen atmosphere. After completion of the reaction, the product was washed thoroughly with deionized water till neutral pH value to obtain silanized Fe3O4@3DG@VTMOS, containing the vinyl groups. Solution of Fe3O4@3DG@VTMOS (300 mg) in ethanol/water (50 mL, 25:25, v/v) was transferred to a three-necked flask. Finally, TMA (3 mmol) and AIBN (0.1 g) dissolved in 50 mL of ethanol were added in turn. The reaction mixture was stirred for 3 h at 75 °C in a nitrogen atmosphere. After polymerization, the product was washed with ethanol. Thus, Fe3O4@3DG@VTMOS@TMA composite was obtained after drying overnight in a vacuum oven at 55 °C.
The reaction of thiols with enes was defined as a free radical polymerization with thiol–ene free-radical addition to electron-rich/electron-poor carbon–carbon double bonds under mild conditions [39]. The thiols-enes click reaction possesses the characteristics of a simple procedure, mild reaction conditions, and high purity product, and is popular in the surface modification of materials. In this study, vinyl functional groups of VTMOS were coated on the surface of Fe3O4@3DG by sol-gel method, then TMA grafted to the surface of Fe3O4@3DG@VTMOS by the thiols-enes click reaction. The material was prepared by this method with high yield and minimal side reactions.

3.4. Adsorption Experiments

Static adsorption tests were carried out to investigate the adsorptivity of the Fe3O4@3DG@VTMOS@TMA. In a typical procedure, Fe3O4@3DG@VTMOS@TMA (25 mg) was put into a wide-mouth bottle containing 10 mL of HMT solution. The mixture was incubated for a certain time. Then Fe3O4@3DG@VTMOS@TMA was separated from the above solution using an external magnetic field. The concentration of HMT in the supernatant was determined at 241 nm, and the adsorptivity was calculated by the following equation:
Q e = ( C o C e ) V / w
where Qe (mg/g) is the binding quantity for the composite at equilibrium; Co and Ce (mg/mL) are the initial and equilibrium solution concentrations of the solution, respectively; V (mL) is the volume of the solution and w (g) is the weight of the composite.

3.5. MSPE-HPLC Analysis of HMT in Vermicelli Samples

Random samples of vermicelli were purchased from local markets. Powder of commercially available vermicelli (5 g) and a certain volume of 1.0 mg/mL standard acetonitrile solution of HMT were mixed together to obtain spiked sample mixtures at the spiking level of 8–40 μg/g. The above sample mixtures were ultrasonically dispersed in an ice-water bath for 10 min and mixed well before centrifugation at 6000 rpm for 5 min. Then, the supernatant (15 mL) was separated and evaporated to dryness. The residue was extracted into trichloromethane (15 mL). Thereafter, accurately 10 mL of the above solution was added to Fe3O4@3DG@VTMOS@TMA (50 mg) and shaken at 40 °C for 100 min. After adsorption, Fe3O4@3DG@VTMOS@TMA was separated using an external magnetic field. Then, HMT was eluted with 3 × 1.0 mL of ammonia/acetonitrile (5:95, v/v) and the obtained eluent was evaporated to dryness under a stream of nitrogen. Ultimately, the residue was enriched, extracted with acetonitrile (1.0 mL), and filtered through a 0.22 μm nylon membrane for HPLC analysis. HPLC analysis was performed using an Agilent 1260 HPLC equipped with DAD detector. A Phenomenex Gemini C18 analytical column (250 mm × 4.6 mm, 5 μm particle size) was used for the separation of analytes with a mobile phase consisting of acetonitrile/water (5:95, v/v) as the mobile phase at a flow rate of 0.5 mL/min (35 °C). The injection volume was 20 μL, and the wavelength of the detector was monitored at 210 nm.

4. Conclusions

In this study, a novel 3DG synergistic composite, Fe3O4@3DG@VTMOS@TMA, was prepared employing “thiol-ene” click chemistry. The composite product had a fast adsorption rate and high adsorptivity for HMT. Moreover, the experimental results of recovery showed that the proposed MSPE-HPLC method could be successfully applied for the extraction and determination of HMT in vermicelli samples. Therefore, it is a promising method for the rapid separation and determination of illegally added HMT using Fe3O4@3DG@VTMOS@TMA coupled with HPLC.

Author Contributions

Conceptualization, M.L. and X.L.; methodology, C.Z., M.L. and X.L.; software, M.L. and C.Z.; validation, M.L., C.Z., and X.L.; formal analysis, M.L., C.Z., F.W. and X.L.; investigation, M.L., C.Z. and X.L.; resources, M.L., C.Z., F.W. and X.L.; data curation, M.L. and X.L.; writing—original draft preparation, M.L. and C.Z.; writing—review and editing, M.L. and X.L.; visualization, M.L. and C.Z.; supervision, F.W. and X.L; project administration, M.L. and X.L.; funding acquisition, M.L. and X.L. All authors have read and agreed to the published version of the manuscript.

Funding

This work was funded by the National Natural Science Foundation of China (Nos.21545011, 21165003), the Guangxi Natural Science Foundation Project (2016GXNSFAA380141), the Specific Research Project of Guangxi for Research Bases and Talents (AD18126005), the Scientific Research Fund of Guangxi Education Department (2018KY0169), the Guangxi University for Nationalities Graduate Scientific Research In-novation Project (No.gxun-chxzs2017126), The High-Level-Innovation Team and Outstanding Scholar Project of Guangxi Higher Education Institutes (guijiaoren[2020]6), and the Guangxi University for Nationalities Natural Science Foundation (No.2017MDQN002).

Institutional Review Board Statement

Not applicable.

Informed Consent Statement

Not applicable.

Data Availability Statement

Not applicable.

Conflicts of Interest

The authors declare no conflict of interest.

Sample Availability

Samples of the compounds are available from the authors.

References

  1. Caulfield, M.J.; Solomon, D.H. Studies on polyimides: Part 3. Interactions between hexamethylenetetramine and models for polyimides and novolacs. Polymer 1999, 40, 3041–3050. [Google Scholar] [CrossRef]
  2. Gao, X.; Li, X.; Yu, W. Flowerlike ZnO nanostructures via hexamethylenetetramine-assisted thermolysis of zinc-ethylenediamine complex. J. Phys. Chem. B 2005, 109, 1155–1161. [Google Scholar] [CrossRef] [PubMed]
  3. Shin-Ichiro, M.; Keizo, T.; Jun, N.; Masami, W.; Genro, K.; Akihisa, T.; Hiroki, T.; Minoru, S.; Ken, O.; Yuko, K. Usefulness of Hexamethylenetetramine as an Adjuvant to Radiation and Cisplatin in the Treatment of Solid Tumors: Its Independency of p53 Status. J. Radiat. Res. 2010, 51, 27–35. [Google Scholar]
  4. Musher, D.M.; Griffith, D.P. Generation of Formaldehyde from Methenamine: Effect of pH and Concentration, and Antibacterial Effect. Antimicrob. Agents Chemother. 1974, 6, 708–711. [Google Scholar] [CrossRef] [PubMed] [Green Version]
  5. Paranjape, S.G.; Turankar, A.V.; Sontakke, S.D. Eradication of Helicobacter pylori. Can methenamine, an antimicrobial designed to be effective at an acidic pH, meet this challenge? Med. Hypotheses 2013, 80, 507. [Google Scholar] [CrossRef]
  6. Papich, M.G. Saunders Handbook of Veterinary Drugs||Methenamine; Elsevier: Saint Louis, MO, USA, 2016; pp. 505–506. [Google Scholar]
  7. National Health Commission of the People’s Republic of China. List of food additives that may be illegally added in food and misusable food additives. Modern J. Anim. Husb. Vet. Med. 2011, 5, 78–79. [Google Scholar]
  8. Commonwealth of Australia. Australia New Zealand Food Standards Code—Standard 1.2.4—Labelling of Ingredients. 2021. Available online: https://www.legislation.gov.au/Details/F2021C00290 (accessed on 15 March 2021).
  9. Xu, X.; Duhoranimana, E.; Zhang, X. Preparation and characterization of magnetic molecularly imprinted polymers for the extraction of hexamethylenetetramine in milk samples. Talanta 2017, 163, 31–38. [Google Scholar] [CrossRef]
  10. British Standards Institution. Materials and Articles in Contact with foodstuffs—Plastics Substances Subject to Limitation—Part 23: Determination of Formaldehyde and Hexamethylenetetramine in Food Simulants. 2005. Available online: https://shop.bsigroup.com/products/materials-and-articles-in-contact-with-foodstuffs-plastics-substances-subject-to-limitation-determination-of-formaldehyde-and-hexamethylenetetramine-in-food-simulants/standard/preview (accessed on 16 March 2021).
  11. Peng, M.J.; Song, A.H.; Liu, D.H.; Huang, Q.T.; Qi, Y.Q.; Huang, R.Q. Determination of thiourea dioxide in rice, flour and their products by hydrophilic chromatographic column high performance liquid chromatography. J. Food Saf. Qual. 2018, 9, 3434–3440. [Google Scholar]
  12. Li, W.; Fan, X.G.; Wang, X.; Tang, M.; Zuo, Y. Design of Rapid Detection System for Urotropine in Food Based on SERS. Spectrosc. Spectr. Anal. 2017, 37, 1778–1783. [Google Scholar]
  13. Xu, X.; Zhang, X.; Duhoranimana, E.; Zhang, Y.; Shu, P. Determination of methenamine residues in edible animal tissues by HPLC-MS/MS using a modified QuEChERS method: Validation and pilot survey in actual samples. Food Control 2016, 61, 99–104. [Google Scholar] [CrossRef]
  14. Wu, Y.; Zhang, H.; Cui, F.; Jiang, J. Determination of urotropine in dried beancurd sticks by ultra performance liquid chromatography-tandem mass spectrometry. Sci. Technol. Food Ind. 2014, 35, 298–300. [Google Scholar]
  15. Preiner, D. Optimization of SPME-Arrow-GC/MS Method for Determination of Free and Bound Volatile Organic Compounds from Grape Skins. Molecules 2021, 26, 7409. [Google Scholar]
  16. Fan, H.; Deng, Z.; Zhong, H.; Yao, Q. Development of new solid phase extraction techniques in the last ten years. J. Chin. Pharm. Sci. 2013, 22, 293–302. [Google Scholar] [CrossRef]
  17. Xu, Y.; Sheng, K.; Li, C.; Shi, G. Self-Assembled Graphene Hydrogel via a One-Step Hydrothermal Process. Acs Nano 2010, 4, 4324–4330. [Google Scholar] [CrossRef]
  18. Li, Z.; Song, B.; Wu, Z.; Lin, Z.; Yao, Y.; Moon, K.S.; Wong, C.P. 3D porous graphene with ultrahigh surface area for microscale capacitive deionization. Nano Energy 2015, 11, 711–718. [Google Scholar] [CrossRef]
  19. Mateos, R.; Vera, S.; Díez-Pascual, A.; Andrés, M. Graphene solid phase extraction (SPE) of synthetic antioxidants in complex food matrices. J. Food Compos. Anal. 2017, 62, 223–230. [Google Scholar] [CrossRef]
  20. Yan, Z.; Yao, W.; Hu, L.; Liu, D.; Wang, C.; Lee, C.S. Progress in the preparation and application of three-dimensional graphene-based porous nanocomposites. Nanoscale 2015, 7, 5563–5577. [Google Scholar] [CrossRef] [Green Version]
  21. Kolb, H.C.; Finn, M.G.; Sharpless, K.B. Click Chemistry: Diverse Chemical Function from a Few Good Reactions. Angew. Chem. Int. Ed. 2001, 40, 2004–2021. [Google Scholar] [CrossRef]
  22. Xu, Y.; Xiong, X.; Cai, L.; Tang, Z.; Ye, Z. Thiol-Ene Click Chemistry. Prog. Chem. 2012, 24, 385–394. [Google Scholar]
  23. Gao, S.; Guo, Y.; Li, X.; Wang, X.; Wang, J.; Qian, F.; Gu, H.; Zhang, Z. Magnetic solid phase extraction of sulfonamides based on carboxylated magnetic graphene oxide nanoparticles in environmental waters. J. Chromatogr. A 2018, 1575, 1–10. [Google Scholar] [CrossRef]
  24. Li, N.; Jiang, H.L.; Wang, X.L.; Wang, X.; Xu, G.J.; Zhang, B.B.; Wang, L.J.; Zhao, R.S.; Lin, J.M. Recent advances in graphene-based magnetic composites for magnetic solid-phase extraction. TrAC Trends Anal. Chem. 2018, 102, 60–74. [Google Scholar] [CrossRef]
  25. Liu, X.Y.; Li, J.J.; Wu, Z.Y.; Wang, F.; Tan, X.C.; Lei, F.H. Selective separation and determination of glucocorticoids in cosmetics using dual-template magnetic molecularly imprinted polymers and HPLC. J. Colloid Interf. Sci. 2017, 504, 124–133. [Google Scholar] [CrossRef] [PubMed]
  26. Wang, H.; Tian, Y.; Chen, X.; Li, J. Kinetic and Synergetic Effect Analysis of the Co-Combustion of Coal Blended with Polyurethane Materials. ACS Omega 2020, 5, 26005–26014. [Google Scholar] [CrossRef] [PubMed]
  27. Qin, L.; Liang, S.; Tang, Y.; Tan, X.; Zhou, J. Influence of PVP on Solvothermal Synthesized Fe3O4/Graphene Composites as Anodes for Lithium-ion Batteries. Electrochemistry 2015, 83, 619–623. [Google Scholar] [CrossRef] [Green Version]
  28. Krishnamoorthy, K.; Veerapandian, M.; Zhang, L.H.; Yun, K.; Kim, S.J. Antibacterial Efficiency of Graphene Nanosheets against Pathogenic Bacteria via Lipid Peroxidation. J. Phys. Chem. C 2012, 116, 17280–17287. [Google Scholar] [CrossRef]
  29. Hui, Z.; Ma, Y.; Fan, Y.; Shen, J. Fourier transform infrared spectroscopy and oxygen luminescence probing combined study of modified sol-gel derived film. Thin Solid Film. 2001, 397, 95–101. [Google Scholar]
  30. Azizian, S. Kinetic models of sorption: A theoretical analysis. J. Colloid Interface 2004, 276, 47–52. [Google Scholar] [CrossRef]
  31. Ho, Y.S.; Mckay, G. Pseudo-second order model for sorption processes. Process Biochem. 1999, 34, 451–465. [Google Scholar] [CrossRef]
  32. Sweileh, J.A.; Misef, K.Y.; El-Sheikh, A.H.; Sunjuk, M.S. Development of a new method for determination of aluminum (Al) in Jordanian foods and drinks: Solid phase extraction and adsorption of Al3+-D-mannitol on carbon nanotubes. J. Food Compos. Anal. 2014, 33, 6–13. [Google Scholar] [CrossRef]
  33. Wang, F.; Li, X.; Li, J.; Zhu, C.; Liu, M.; Wu, Z.; Liu, L.; Tan, X.; Lei, F. Preparation and application of a molecular capture for safety detection of cosmetics based on surface imprinting and multi-walled carbon nanotubes. J. Colloid Interface Sci. 2018, 527, 124–131. [Google Scholar] [CrossRef]
  34. Liu, M.; Li, X.Y.; Li, J.J.; Su, X.M.; Wu, Z.Y.; Li, P.F.; Lei, F.H.; Tan, X.C.; Shi, Z.W. Synthesis of magnetic molecularly imprinted polymers for the selective separation and determination of metronidazole in cosmetic samples. Anal. Bioanal. Chem. 2015, 407, 3875–3880. [Google Scholar] [CrossRef]
  35. Xu, X.; Ma, W.; An, B.; Zhou, K.; Huang, L. Adsorption/desorption and degradation of doxycycline in three agricultural soils. Ecotoxicol. Environ. Saf. 2021, 224, 112675. [Google Scholar] [CrossRef] [PubMed]
  36. Peng, M.; Song, A.; Huang, R.Q.; Wu, J.W.; Zeng, H.W.; Cao, X.F. Determination of methenamine in rice, flour and their products by hydrophilic chromatographic column high performance liquid chromatography. J. Food Saf. Qual. 2018, 9, 3733–3739. [Google Scholar]
  37. Lim, H.S.; Kim, J.I.; Ko, K.Y.; Kim, M. Determination of hexamethylenetetramine in foods by high-performance liquid chromatography (HPLC). Food Addit. Contam. Part A Chem. Anal. Control. Expo. Risk Assess. 2014, 31, 1489–1495. [Google Scholar] [CrossRef] [PubMed]
  38. Molognoni, L.; Daguer, H.; De, L.A.; De, D. A multi-purpose tool for food inspection: Simultaneous determination of various classes of preservatives and biogenic amines in meat and fish products by LC-MS. Talanta 2018, 178, 1053–1066. [Google Scholar] [CrossRef]
  39. Hoyle, C.E.; Bowman, C.N. Polymer Chemistry Thiol—Ene Click Chemistry. Angewandte 2010, 49, 1540–1573. [Google Scholar] [CrossRef]
Scheme 1. Graphic illustration preparation of Fe3O4@3DG@VTMOS@TMA.
Molecules 27 01548 sch001
Figure 1. SEM and EDS images of Fe3O4 (A,E), Fe3O4@3DG (B,F), Fe3O4@3DG@VTMOS (C,G), and Fe3O4@3DG@VTMOS@TMA (D,H).
Molecules 27 01548 g001
Figure 2. The TG and DTG curves of Fe3O4 (A), Fe3O4@3DG (B), Fe3O4@3DG@VTMOS (C), and Fe3O4@3DG@VTMOS@TMA (D).
Molecules 27 01548 g002
Figure 3. The FT-IR spectra of Fe3O4 (A), Fe3O4@3DG (B), Fe3O4@3DG@VTMOS (C), and Fe3O4@3DG@VTMOS@TMA (D).
Molecules 27 01548 g003
Figure 4. Magnetization curves of Fe3O4 (A), Fe3O4@3DG (B), Fe3O4@3DG@VTMOS (C), and Fe3O4@3DG@VTMOS@TMA (D).
Molecules 27 01548 g004
Figure 5. The adsorption kinetics of Fe3O4@3DG@VTMOS@TMA.
Molecules 27 01548 g005
Figure 6. Adsorption isotherms of Fe3O4@3DG@VTMOS@TMA.
Molecules 27 01548 g006
Figure 7. Chromatograms of spiked vermicelli sample before MSPE (A), of raffinate (B), and after MSPE (C) (40 µg/g).
Molecules 27 01548 g007
Table 1. Regression parameters of the pseudo-first-order and pseudo-second-order equations.
Kinetic ModelAdsorption EquationR2Qe (mg/g)
pseudo-first-order ln ( Q e Q t ) = 0.04590 t + 3.6310 0.469337.75
pseudo-second-order t / Q t = 0.02094 t + 0.2617 0.998247.76
Table 2. Thermodynamic parameters for adsorption of hexamethylenetetramine by Fe3O4@3DG@VTMOS@TMA.
ΔHθΔSθΔGθ (KJ/mol)R2
(KJ/mol)(J/mol·K)293.15 K303.15 K313.15 K
18.7990.03−8.80−9.38−10.680.9972
Table 3. Regression of Langmuir and Freundlich isotherm equations.
Temperature (K)Adsorption Isotherm
Freundlich Isotherm Parameters
Regression EquationsQmax (mg/g)KLR2
293.151/Qe = 0.02520/Ce + 0.006767147.780.270.9942
303.151/Qe = 0.02026/Ce + 0.006184161.710.310.9903
313.151/Qe = 0.01602/Ce + 0.005773173.220.360.9891
Freundlich Isotherm Parameters
Regression EquationsKF (mg/g)nR2
293.15lnQe = 0.7794lnCe + 3.380929.401.280.9595
303.15lnQe = 0.7999lnCe + 3.596736.481.250.9606
313.15lnQe = 0.8019lnCe + 3.806044.971.250.9654
Table 4. Recoveries of HMT bound to composite in spiked vermicelli samples (n = 5).
SamplesSpiked Level
Vermicelli8 μg/g20 μg/g40 μg/g
Recovery (%)RSD (%)Recovery (%)RSD (%)Recovery (%)RSD (%)
189.461.9585.932.0791.420.70
287.441.0986.431.1592.690.20
386.241.6483.240.5691.190.43
Table 5. Comparison of proposed MEPS-HPLC method to determine HMT with other analytical methods reported in the literature.
MethodLODLOQSpiked LevelRecoveryRSDReferences
(µg/mL)(µg/mL)(μg/g)(%)(%)
HPLC1-4–4093.5–98.71.5–4.2[36]
HPLC51010–10091.6–100.90.9–8.7[37]
SERS0.5-0.5–5.0-0.30–3.83[12]
LC-MS0.61.025–20020.9–106.9-[38]
MSPE-HPLC0.250.68–4083.24–92.690.20–2.07This work
Publisher’s Note: MDPI stays neutral with regard to jurisdictional claims in published maps and institutional affiliations.

