
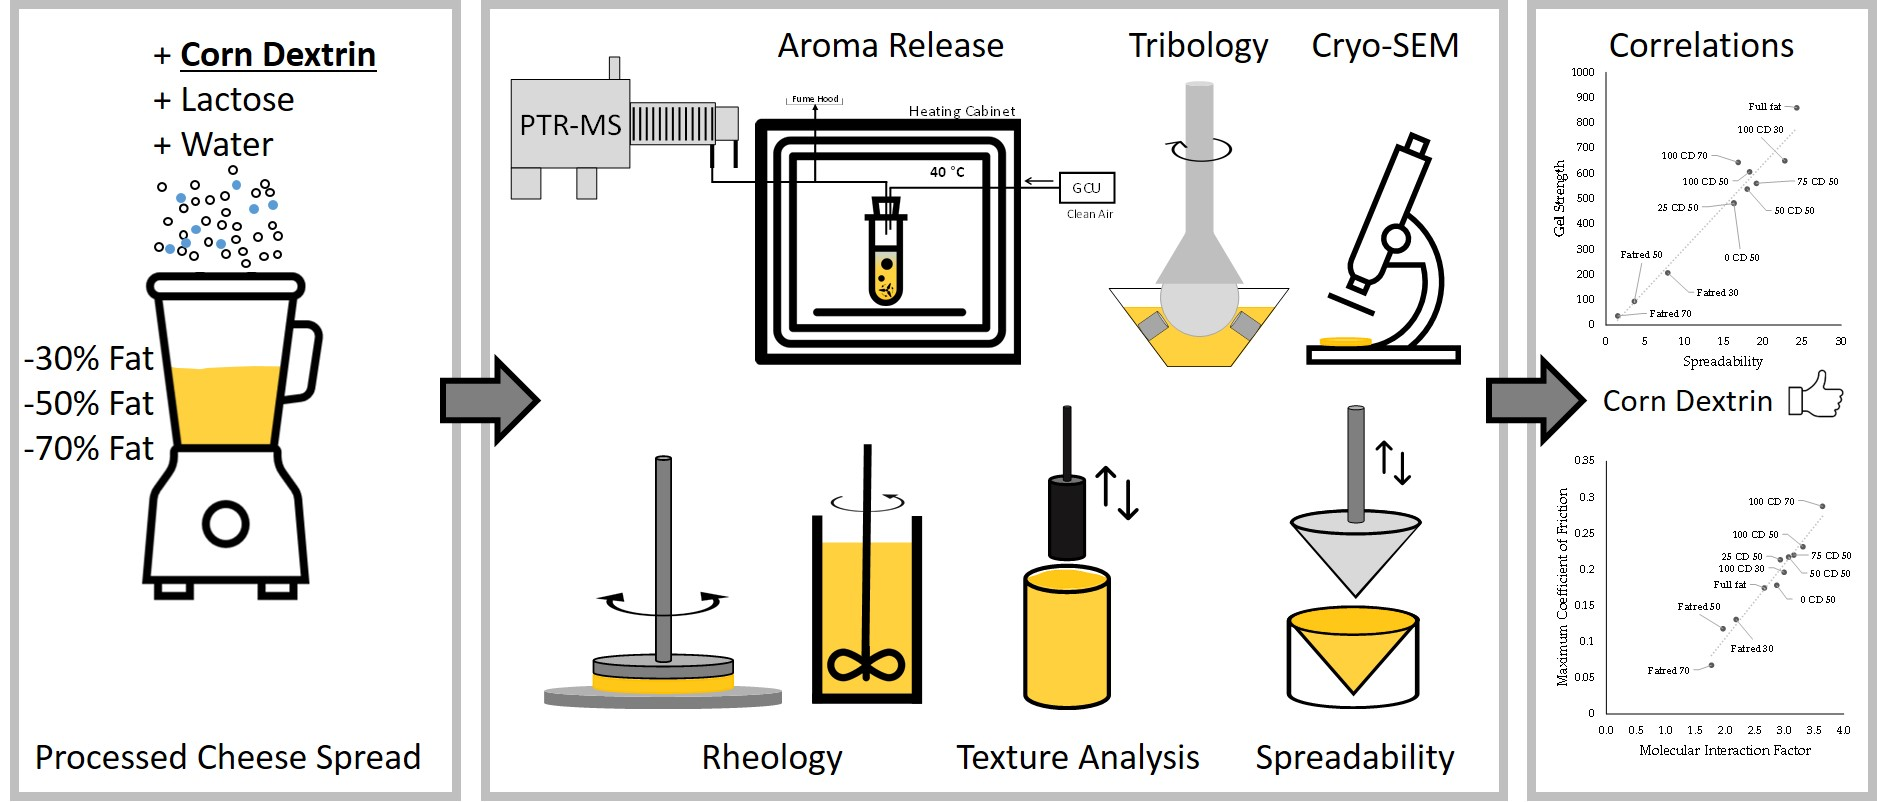
The Effect of Corn Dextrin on the Rheological, Tribological, and Aroma Release Properties of a Reduced-Fat Model of Processed Cheese Spread


Abstract
:
1. Introduction
2. Results and Discussion
2.1. Composition
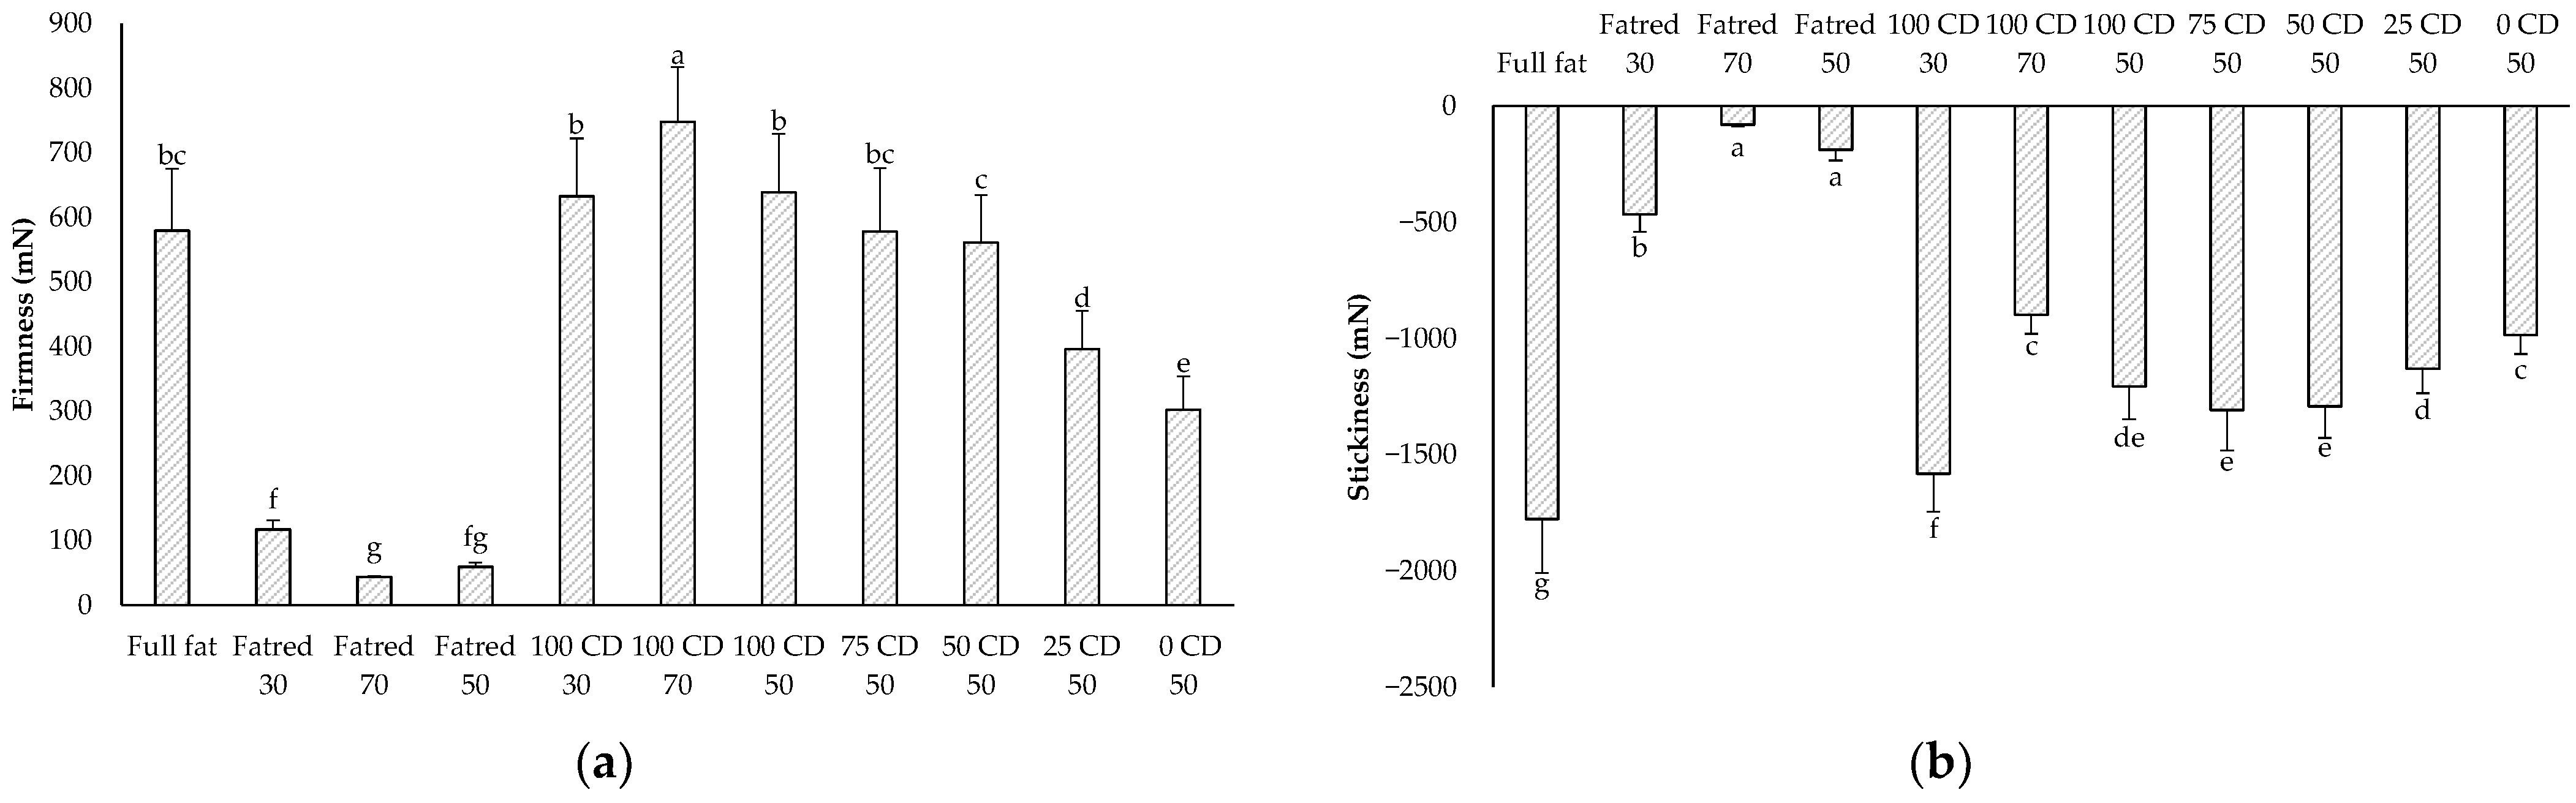
2.2. Texture Analysis
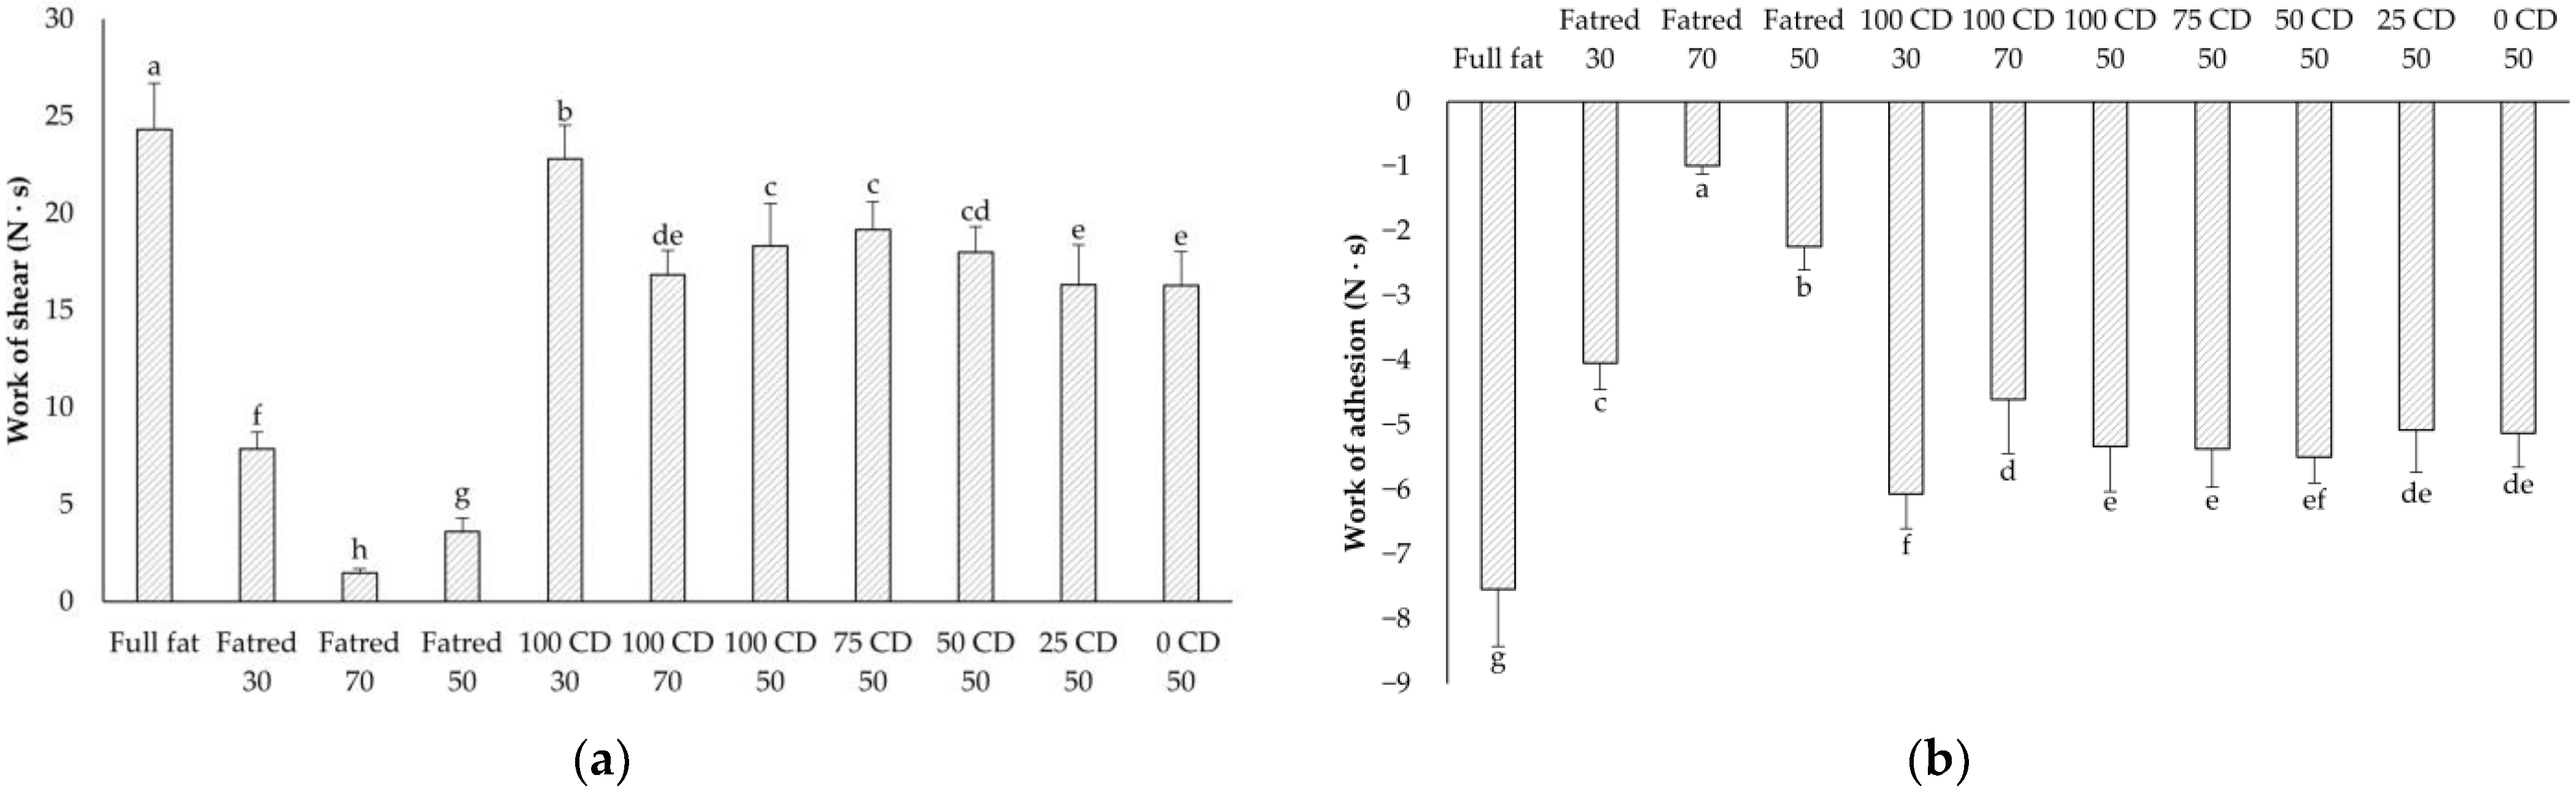
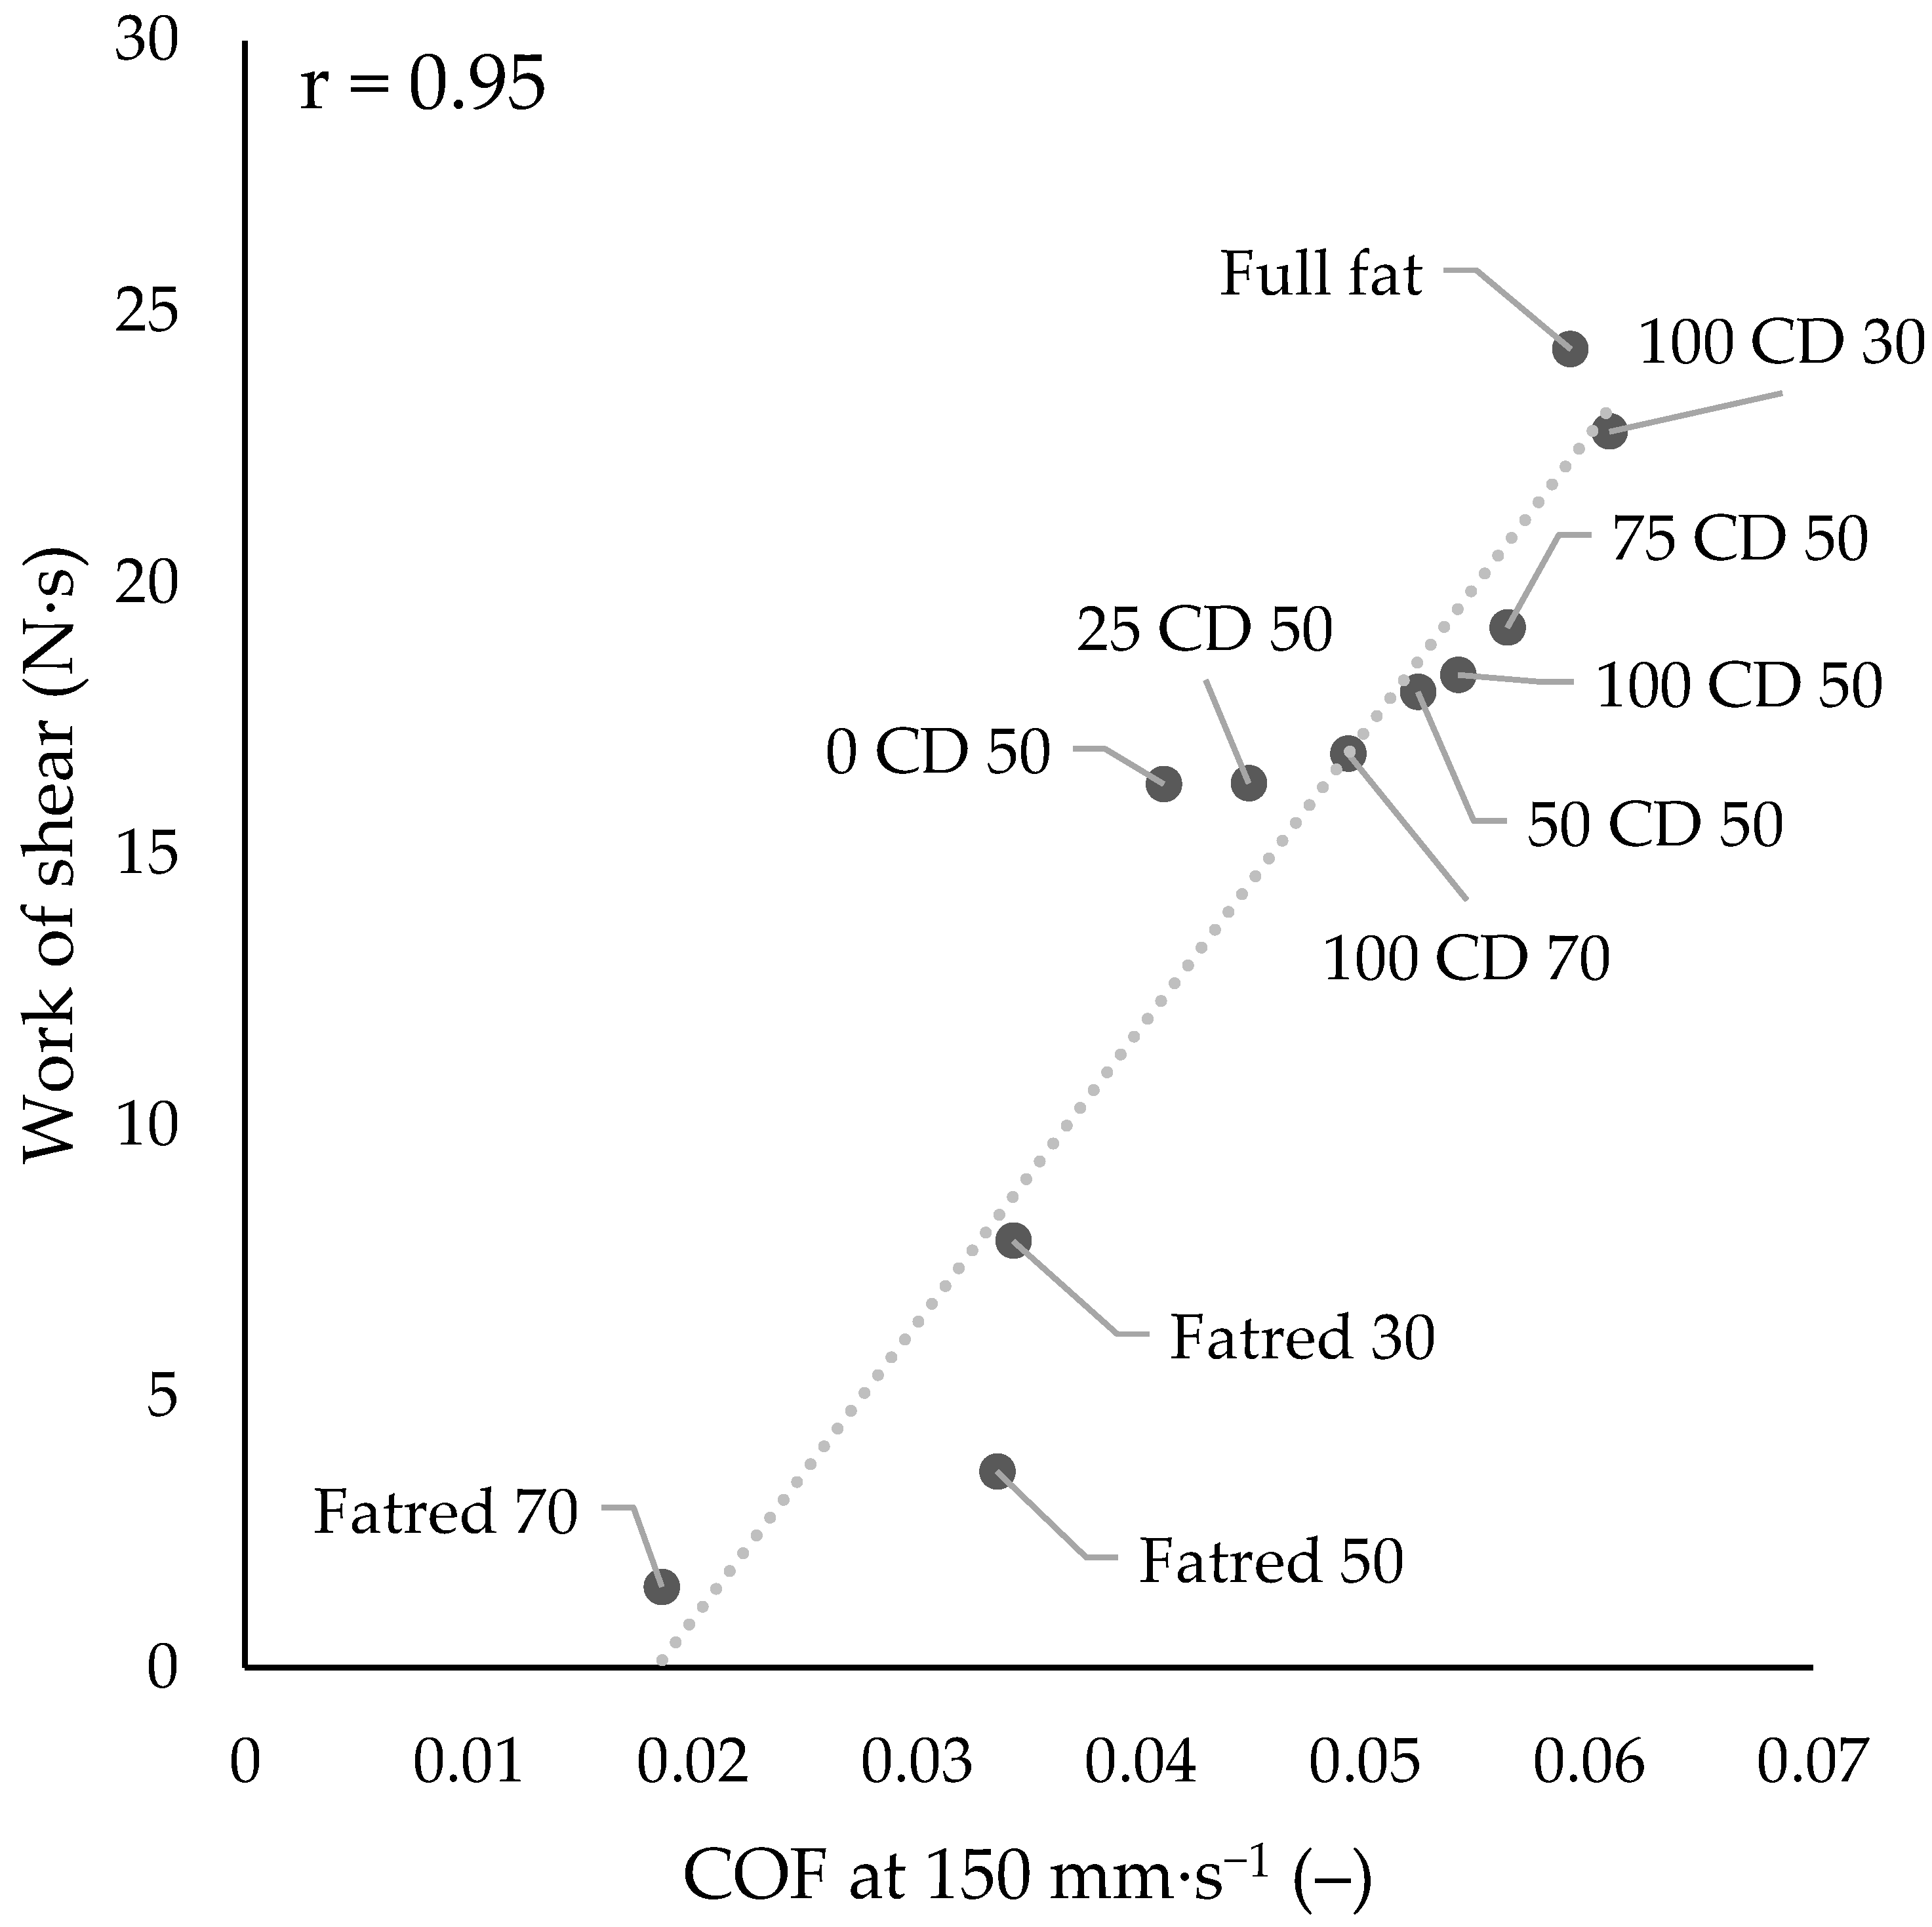
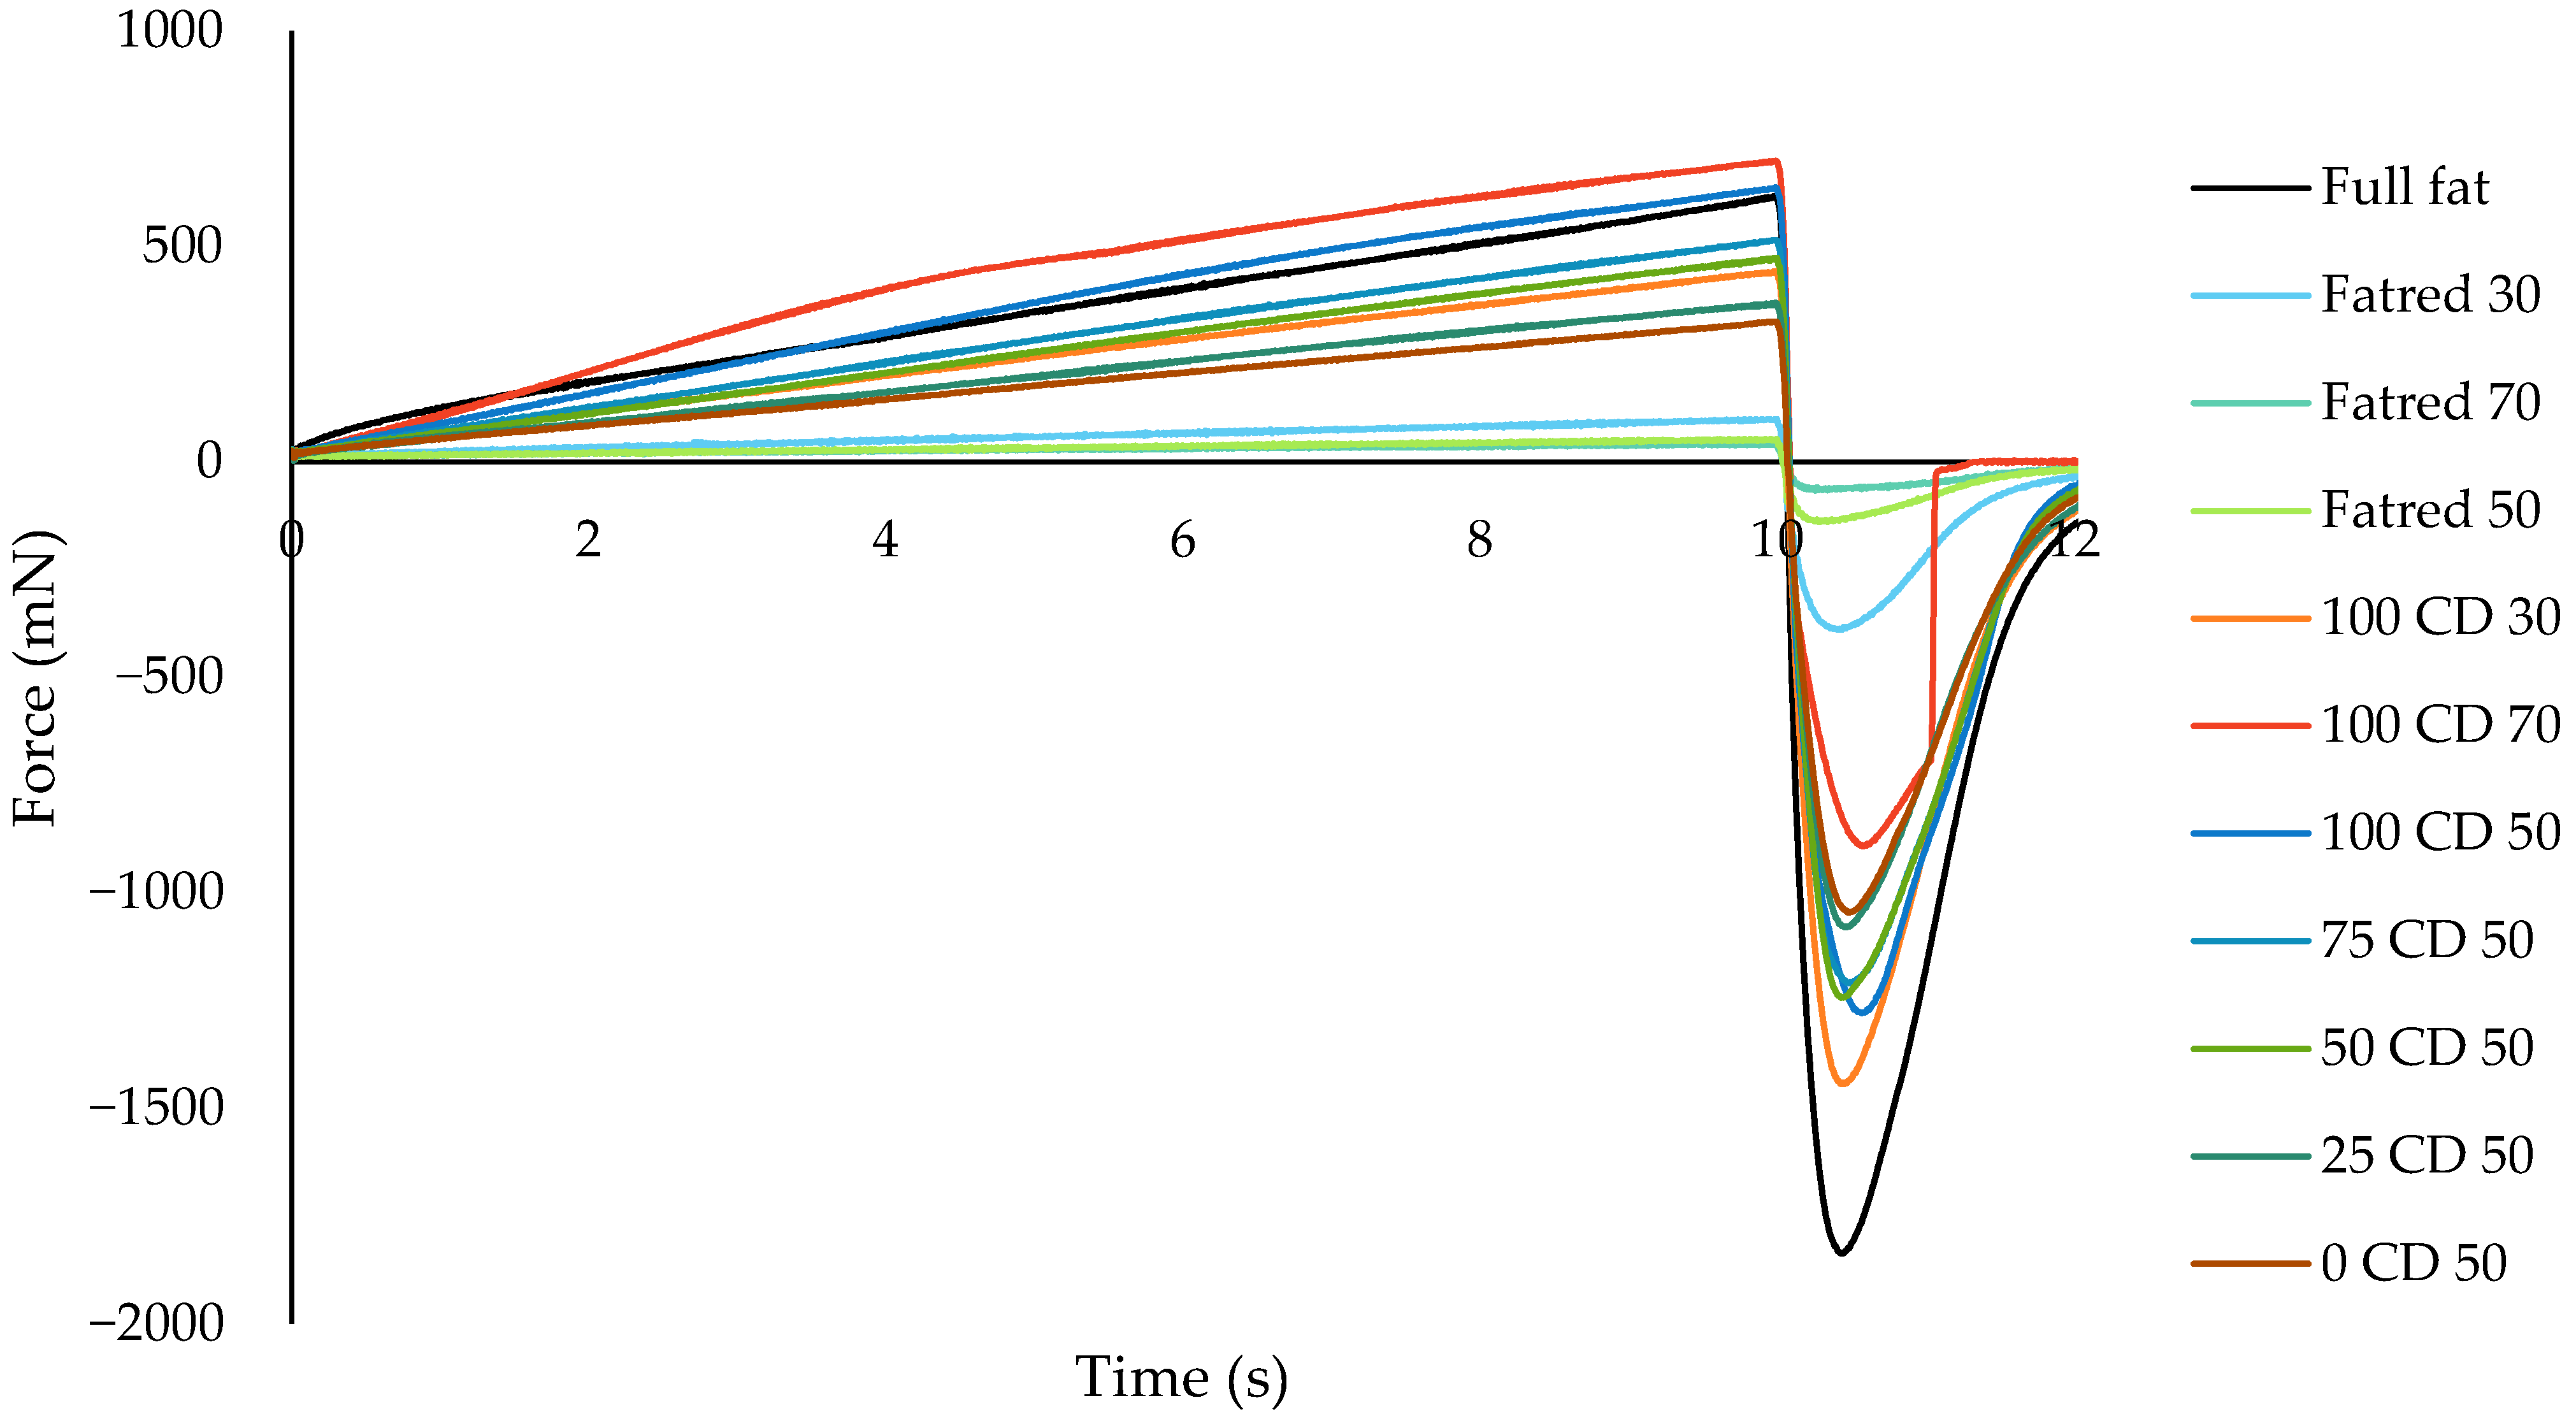
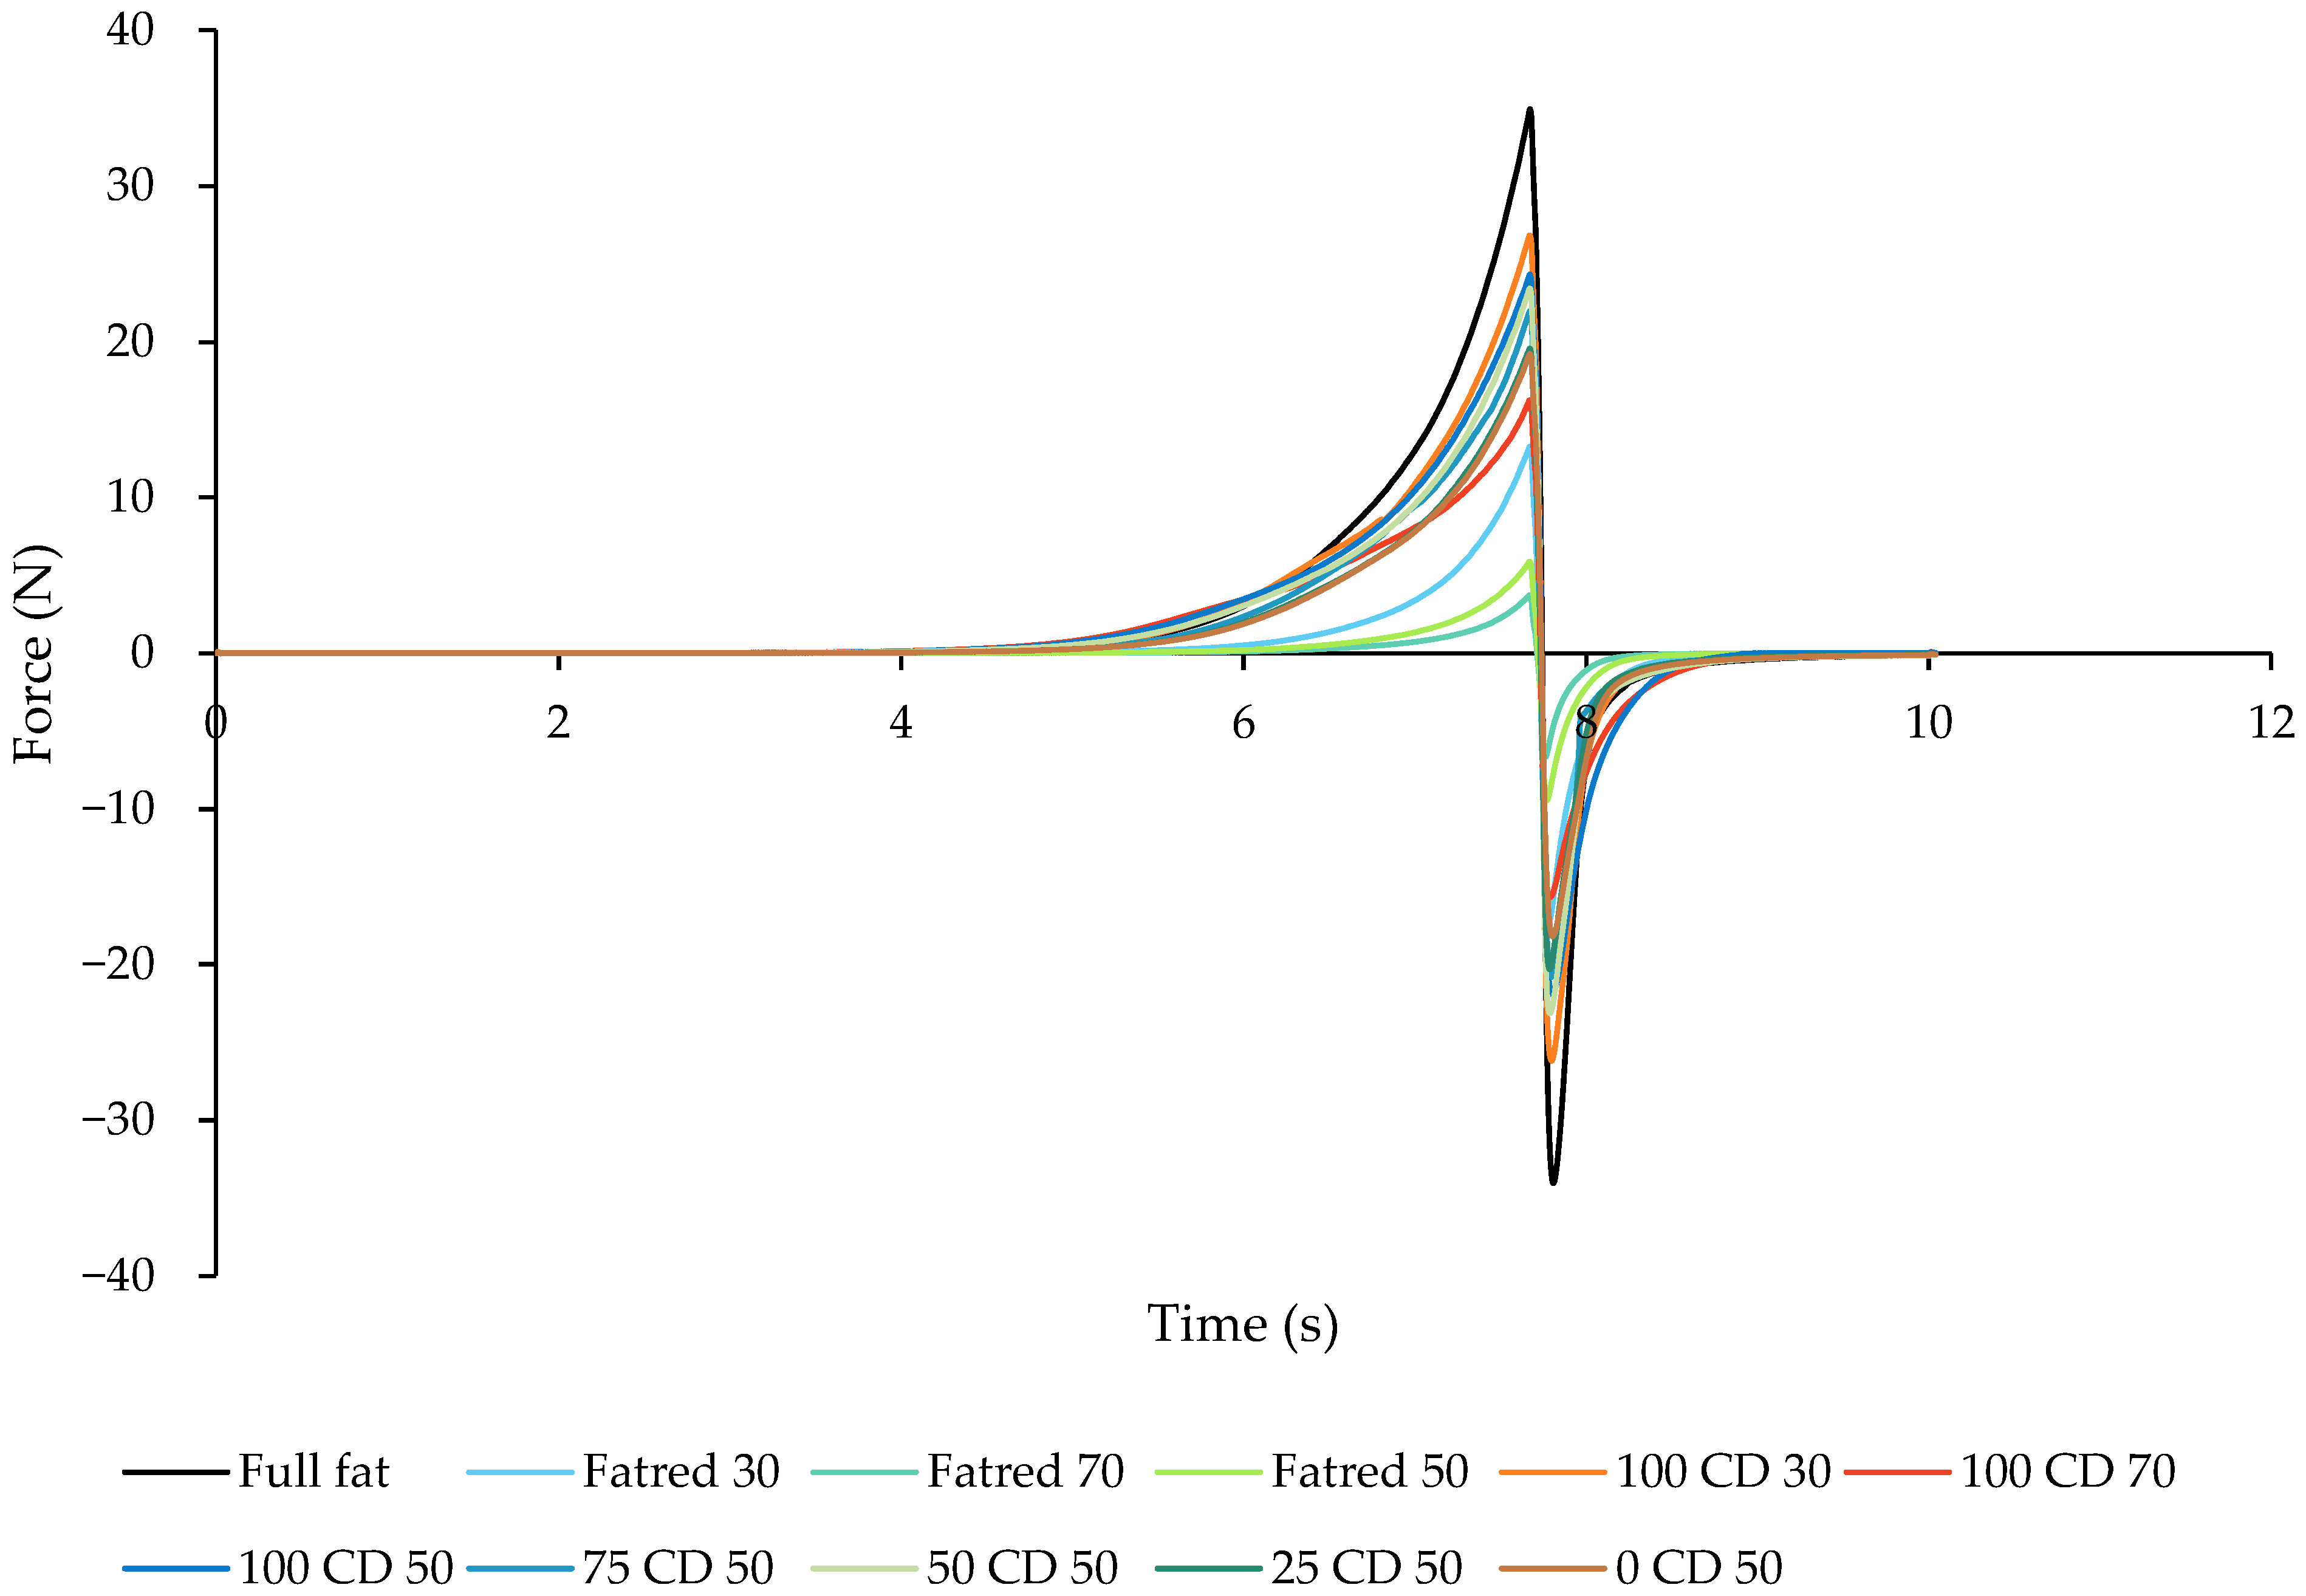
2.3. Spreadability
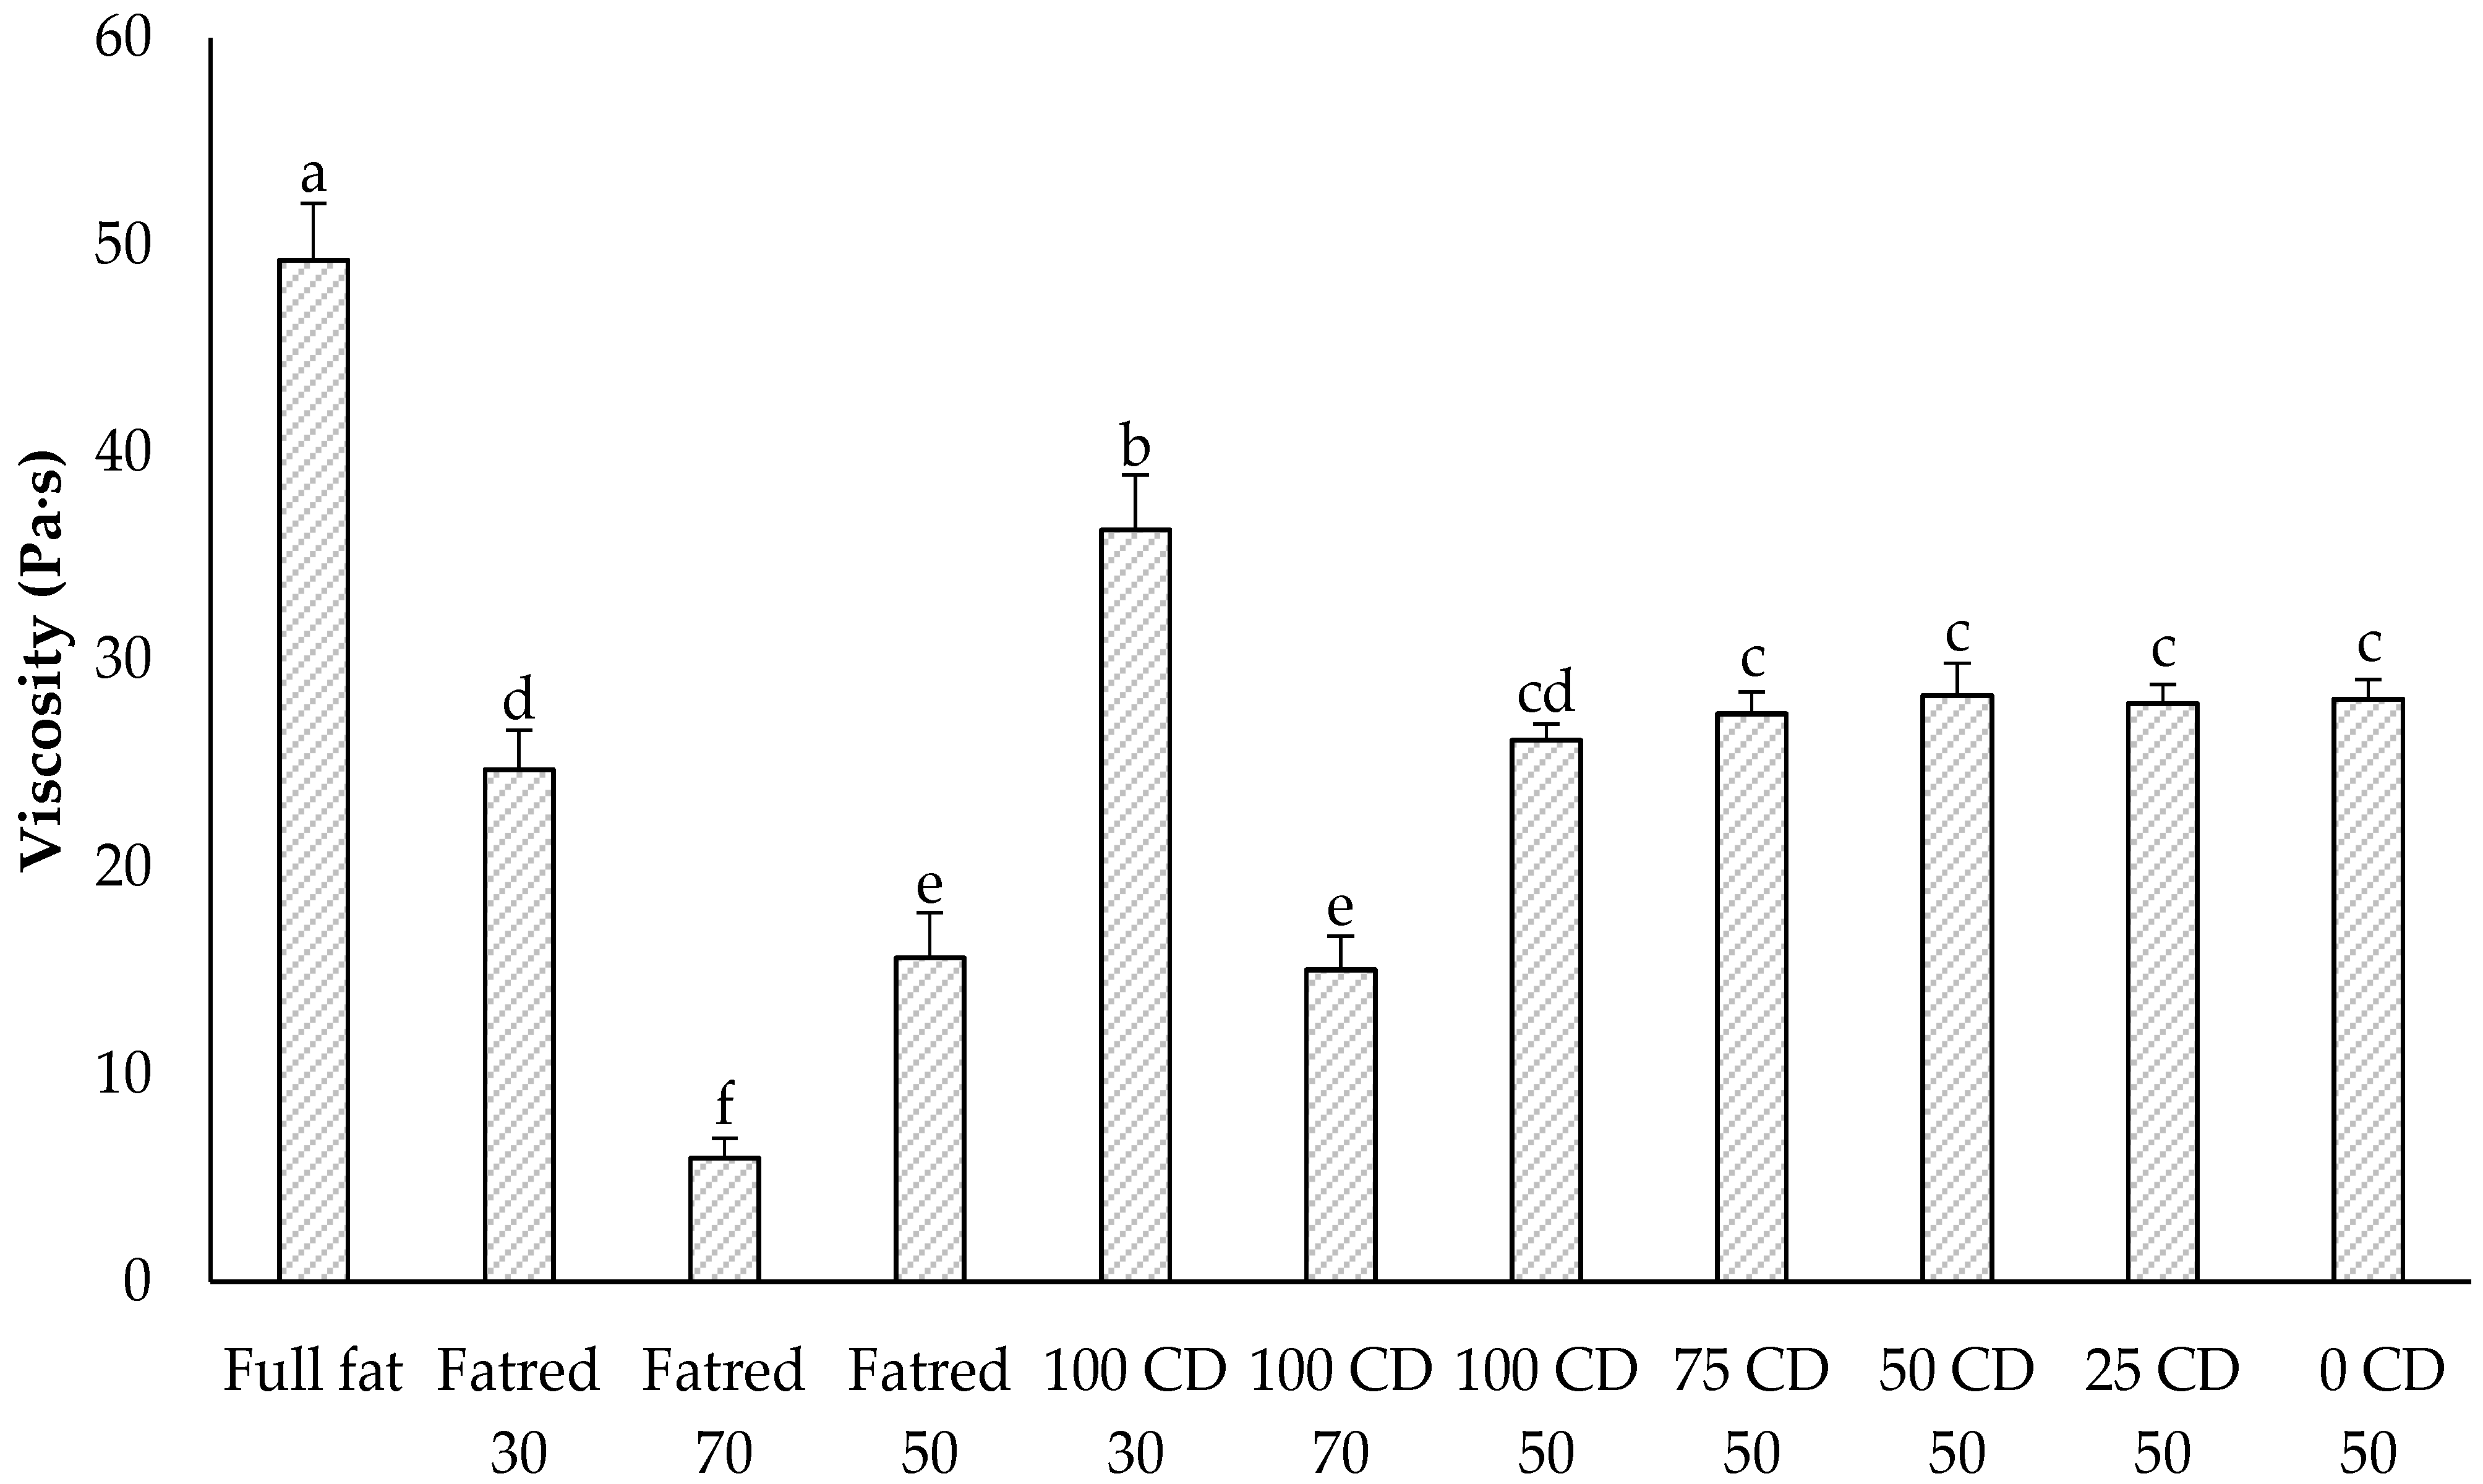
2.4. Flow Behavior
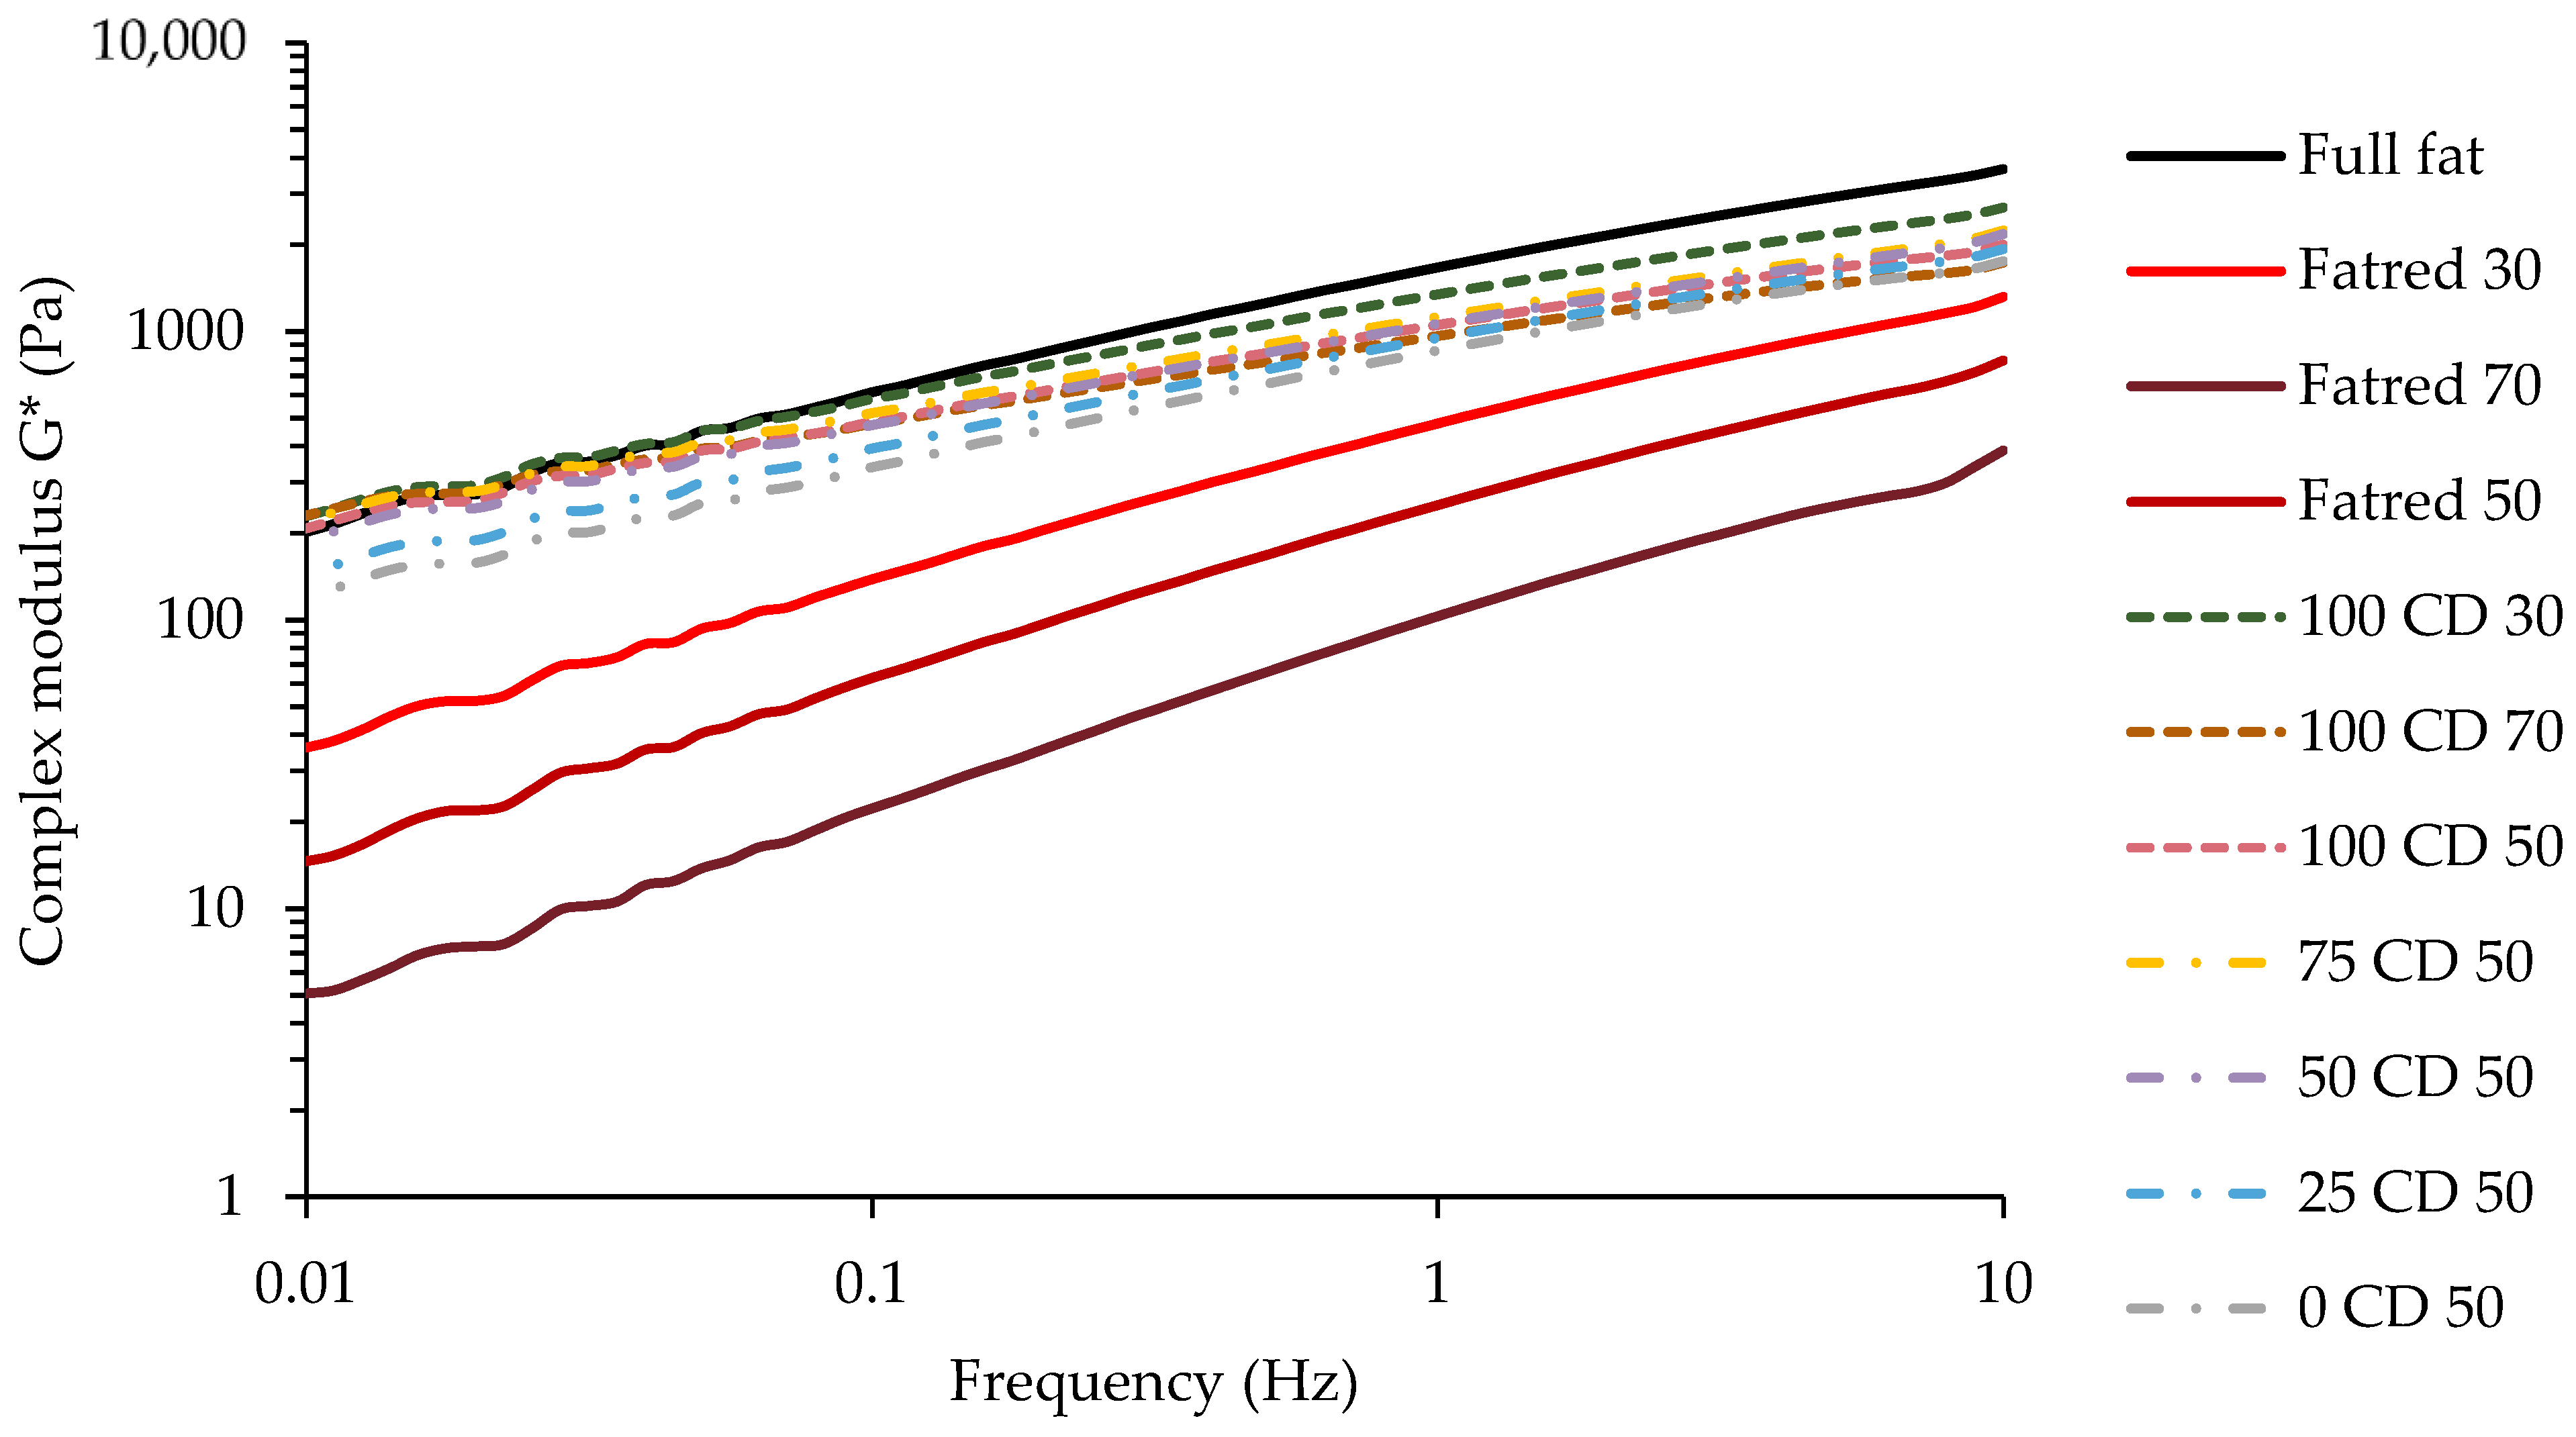
2.5. Dynamic Oscillatory Rheology—Frequency Sweep
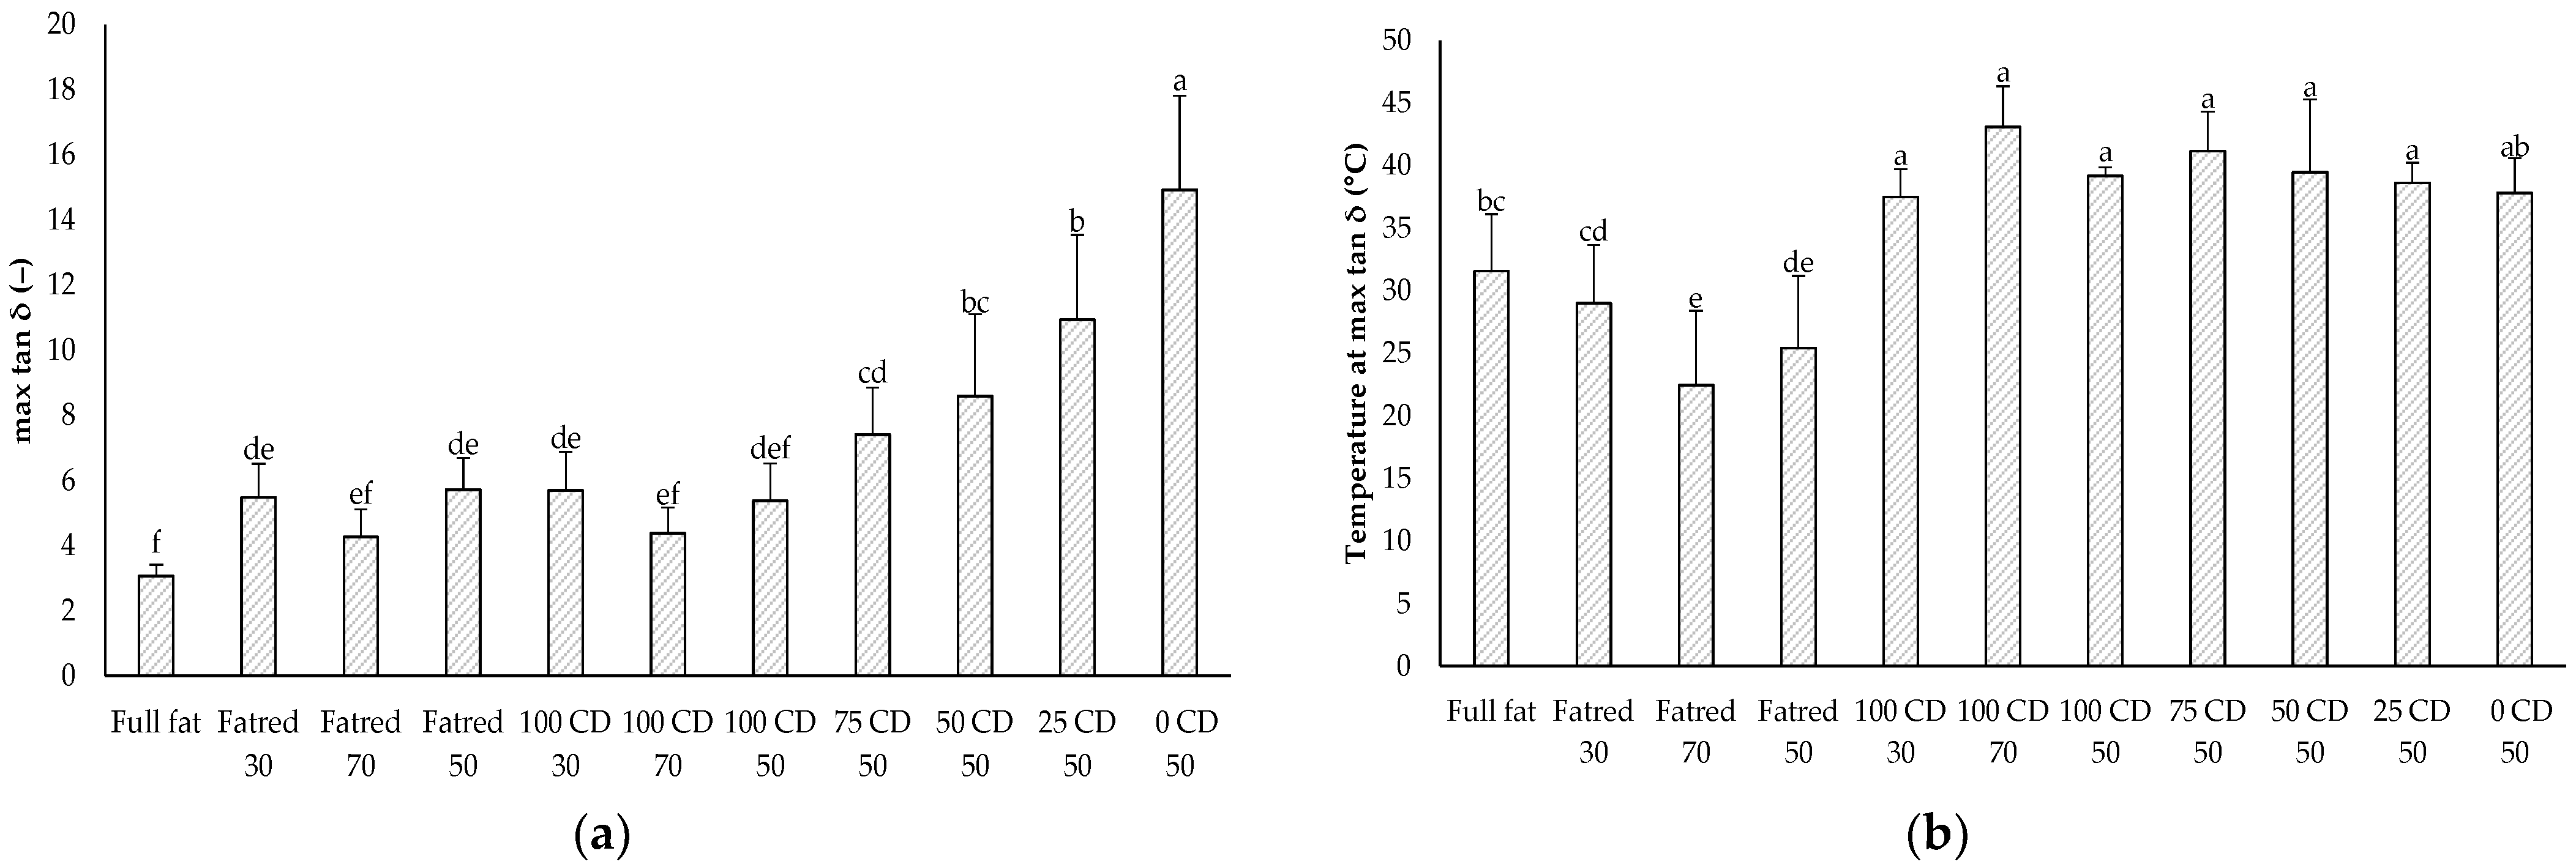
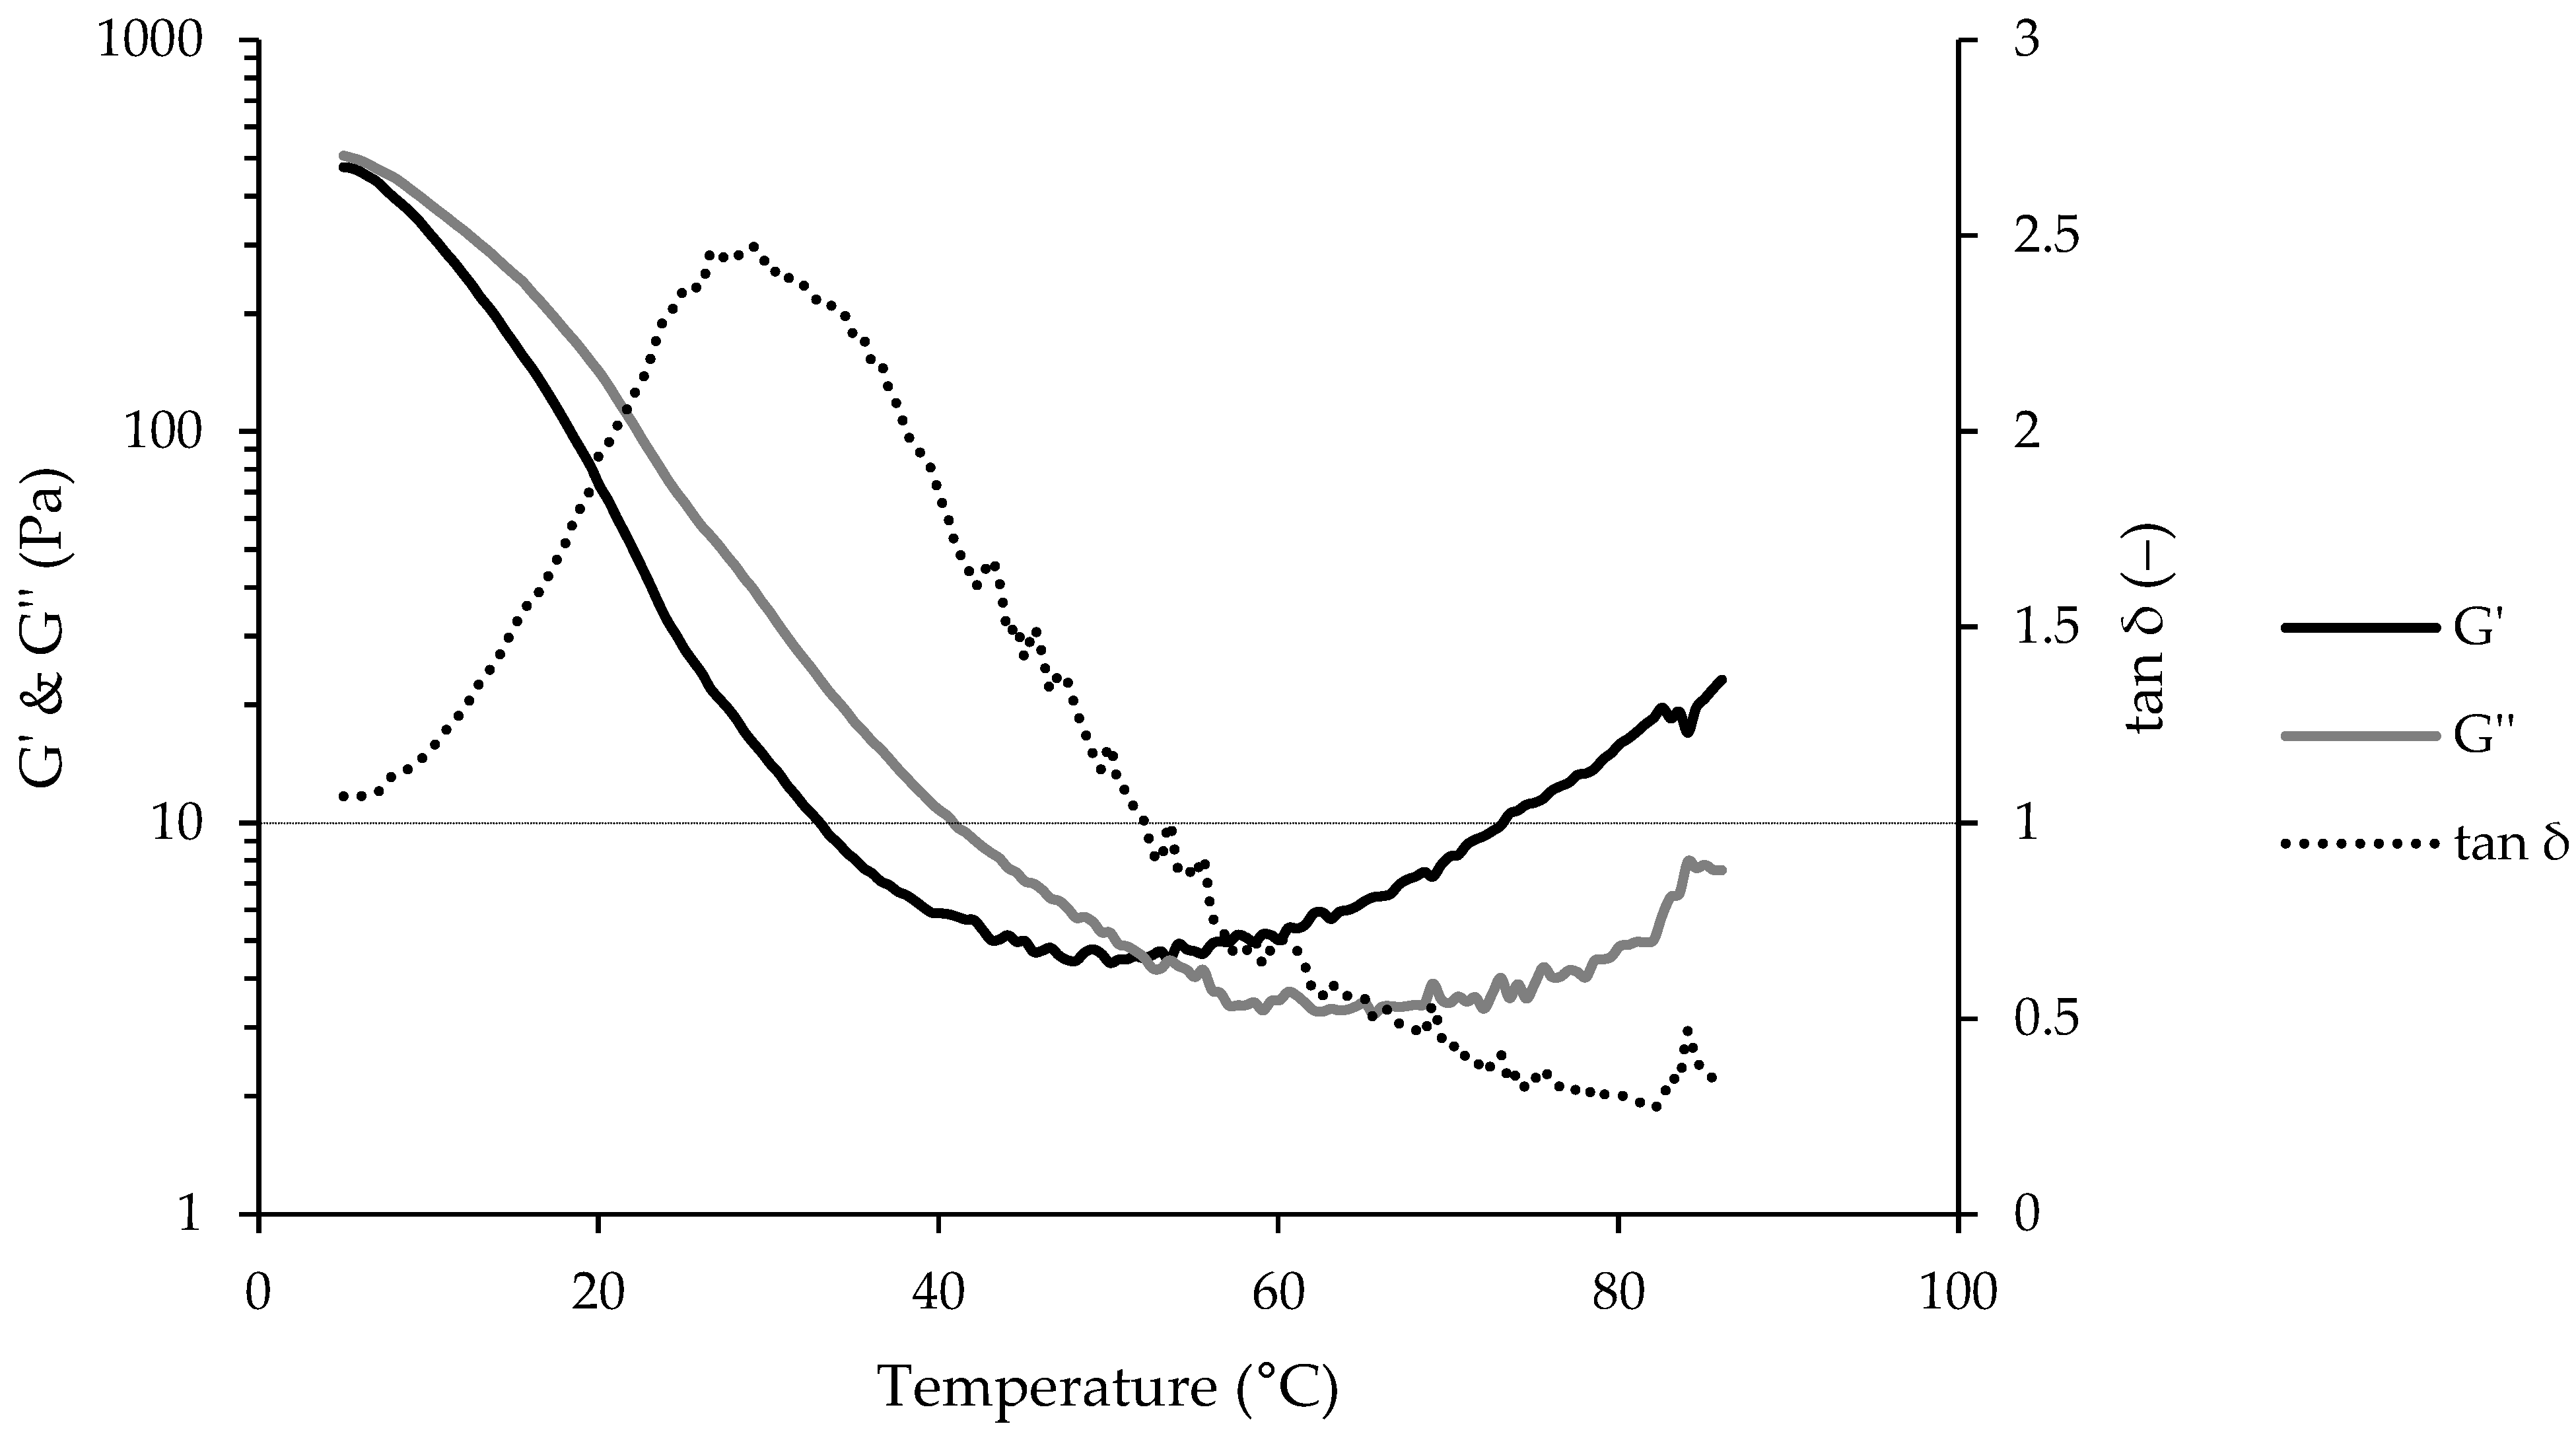
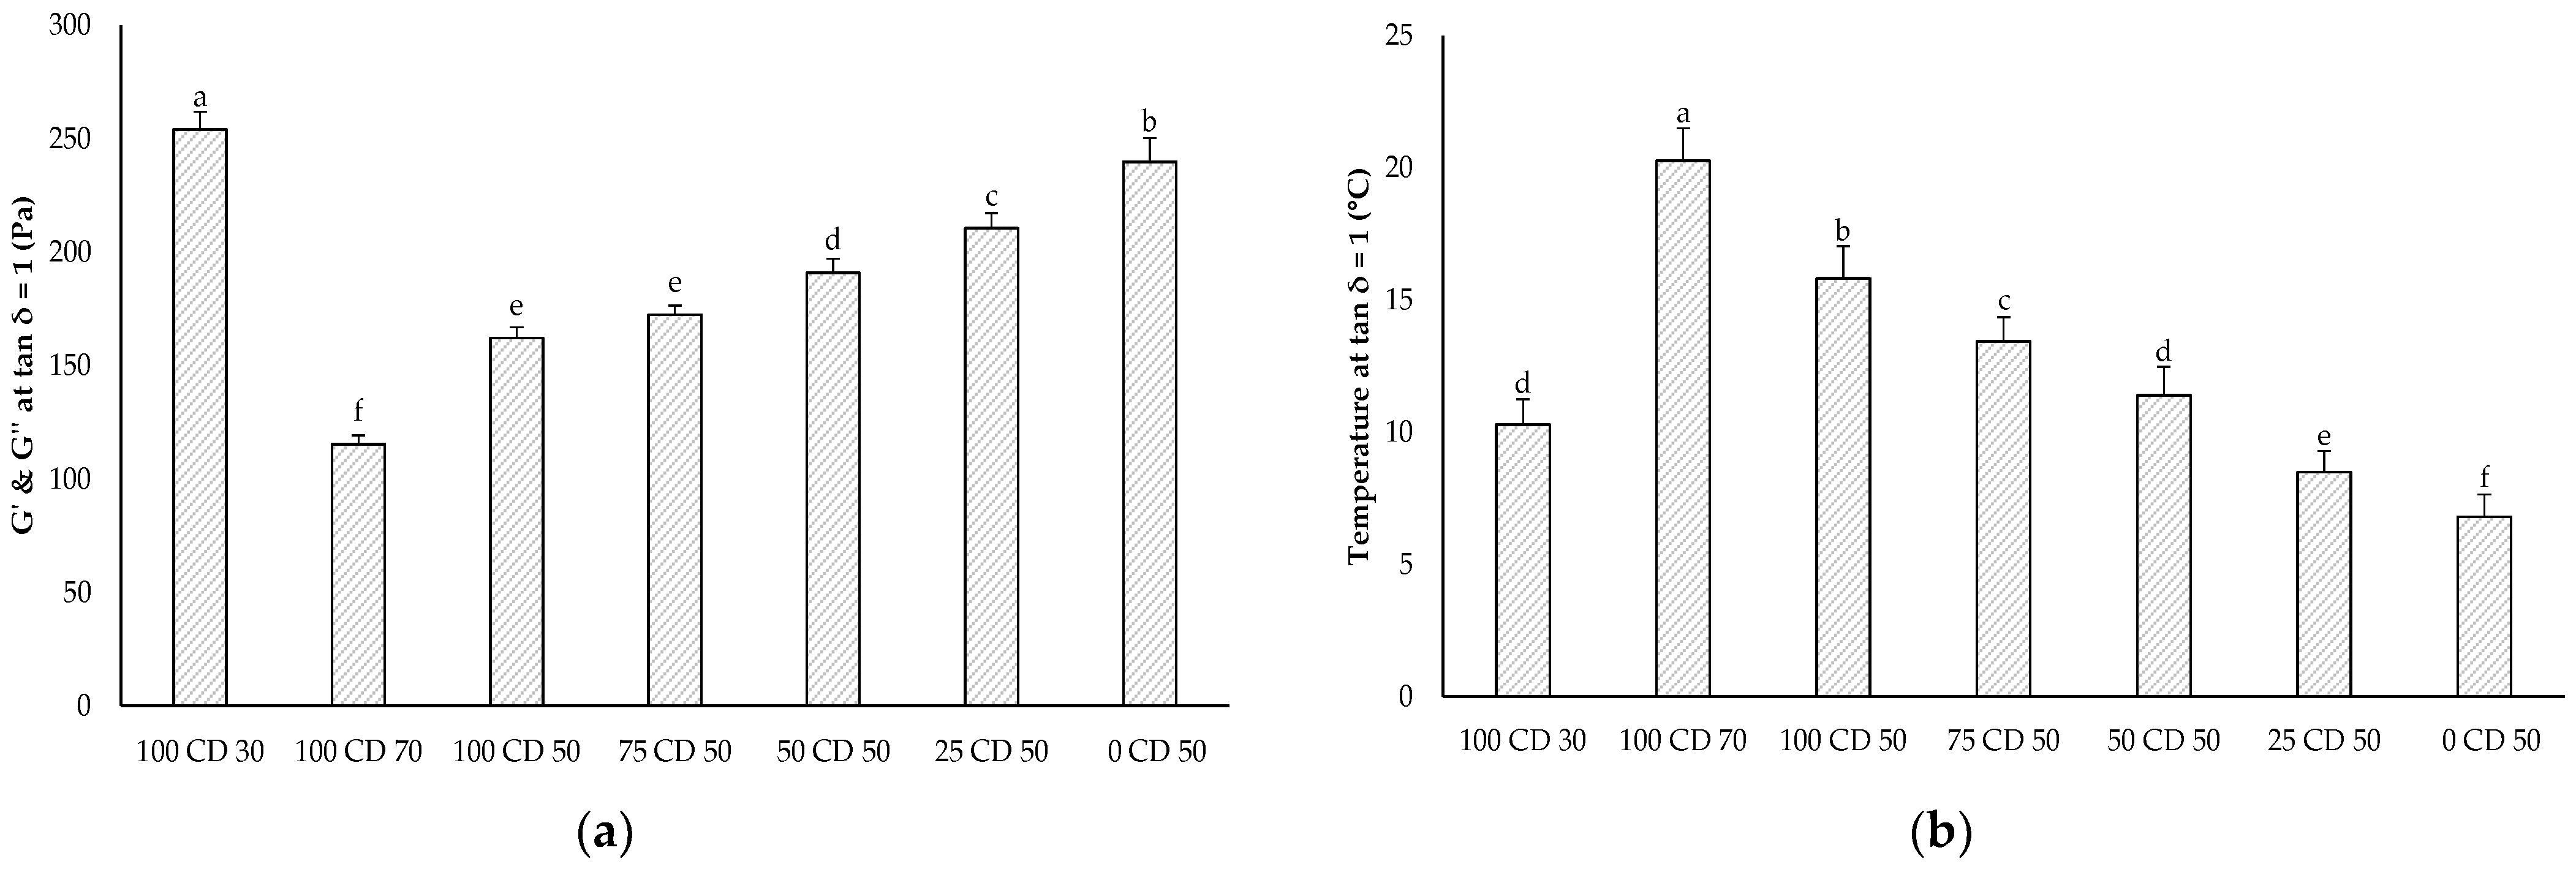
2.6. Dynamic Oscillatory Rheology—Temperature Sweep
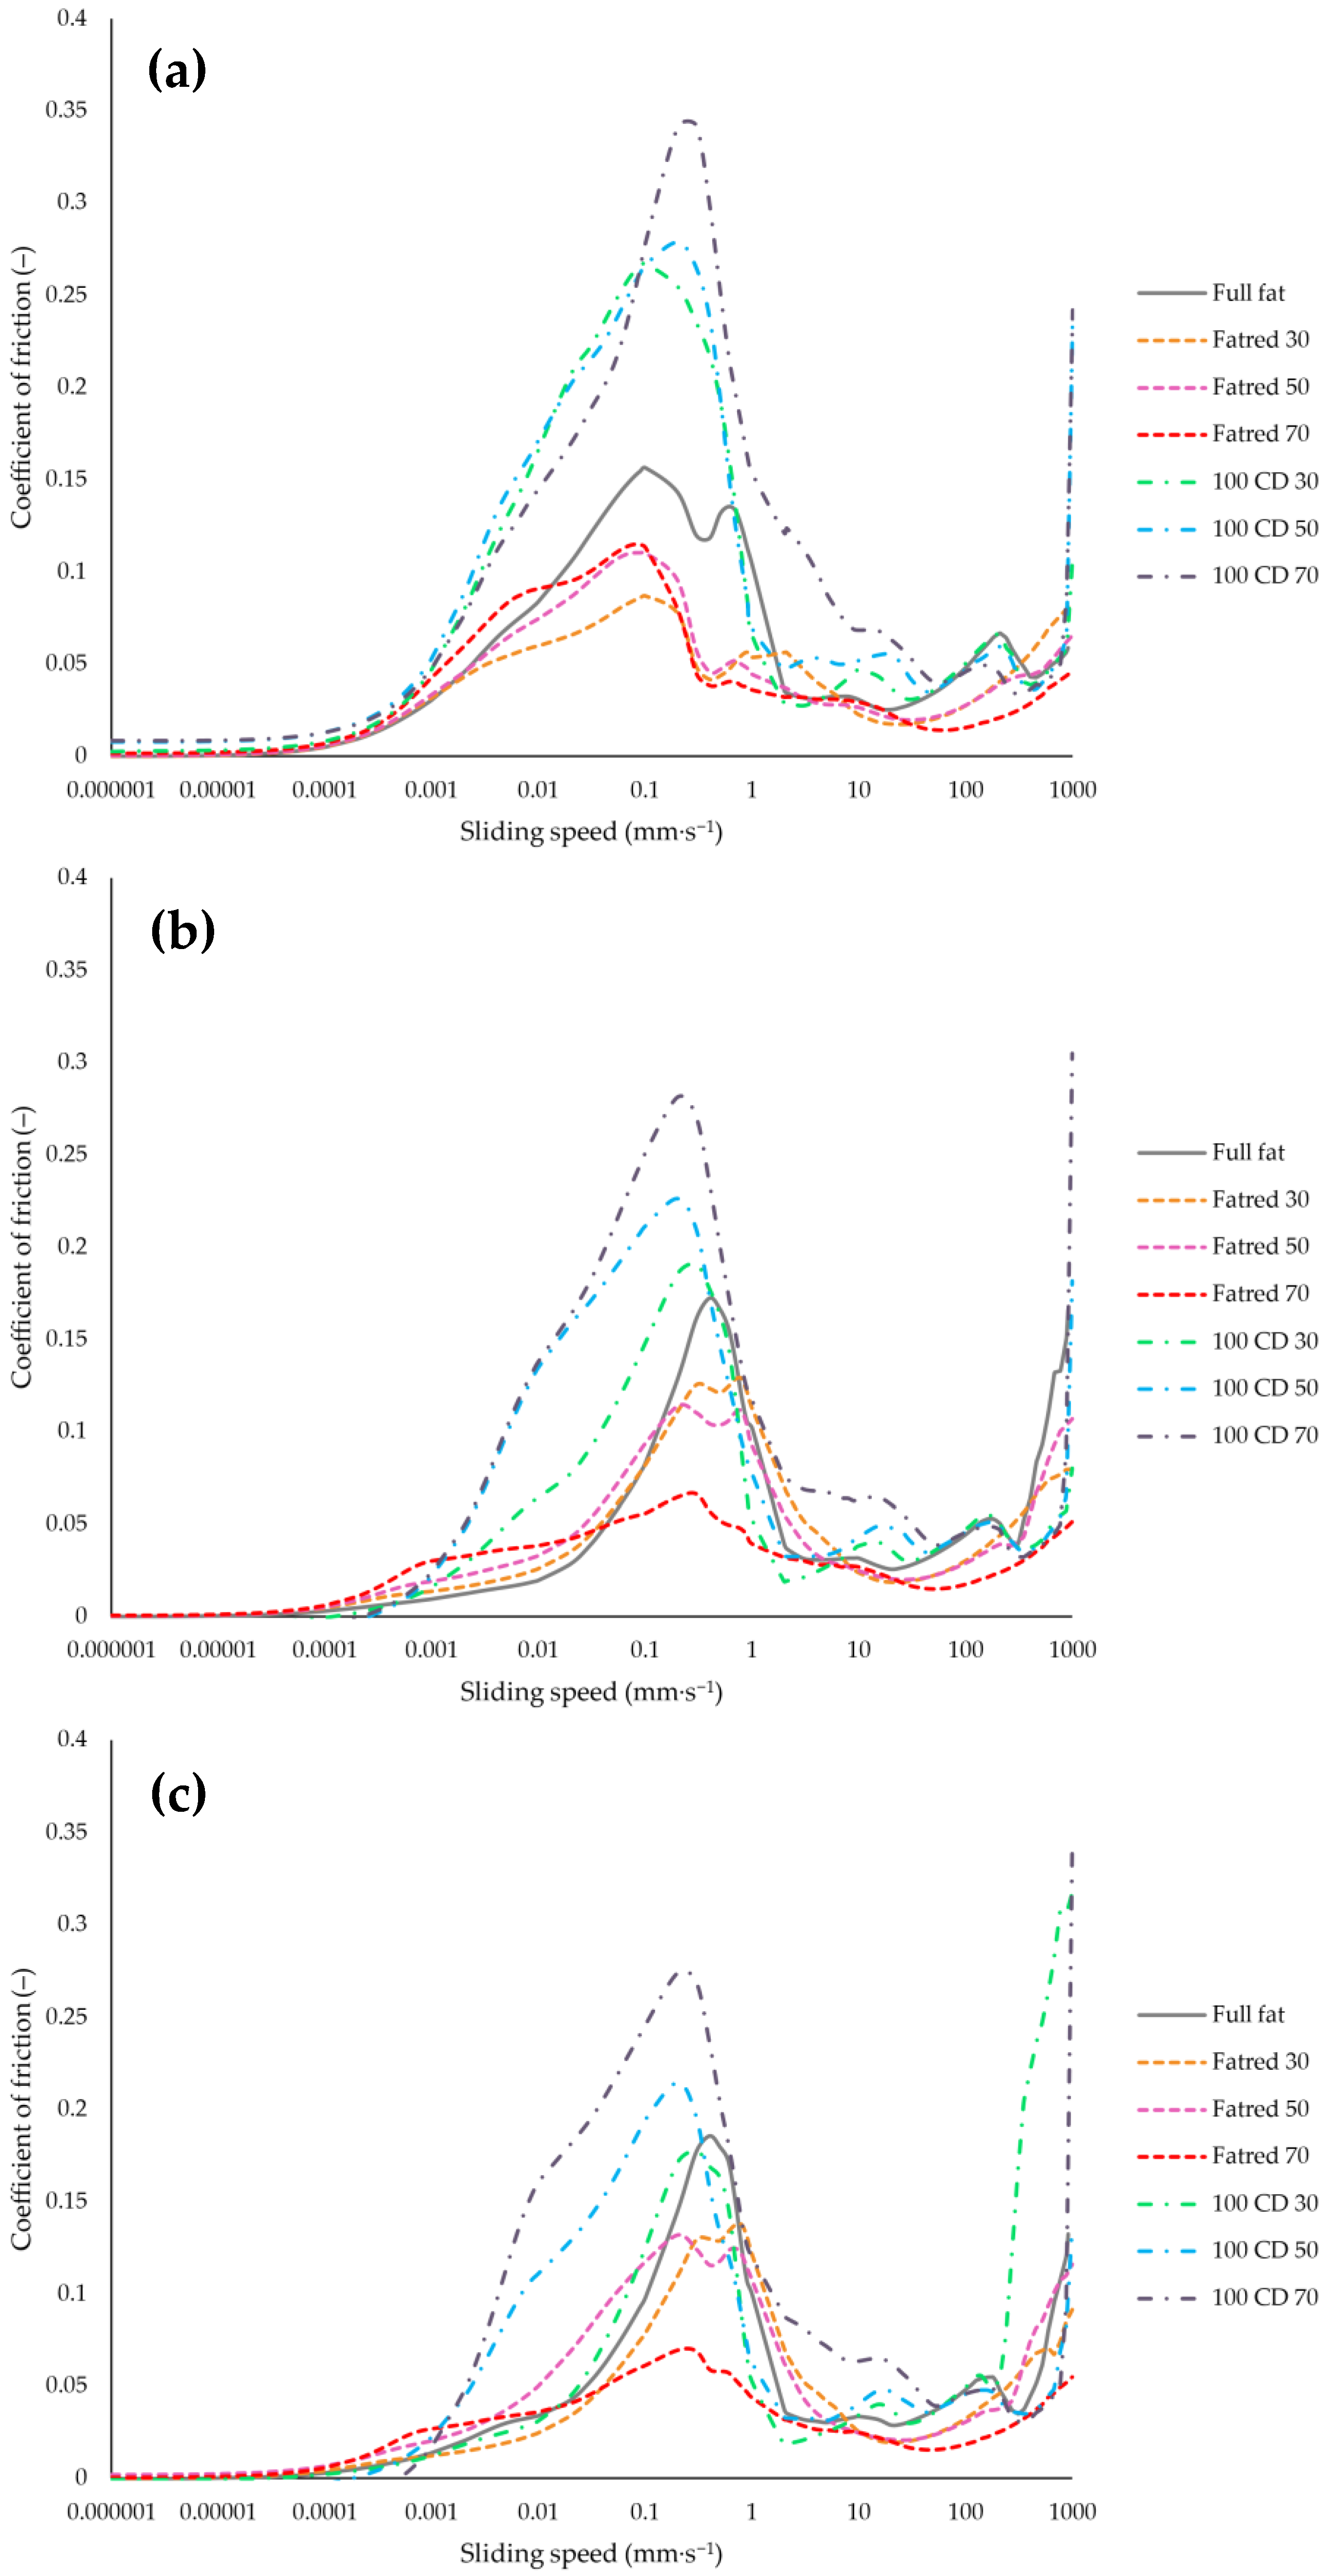
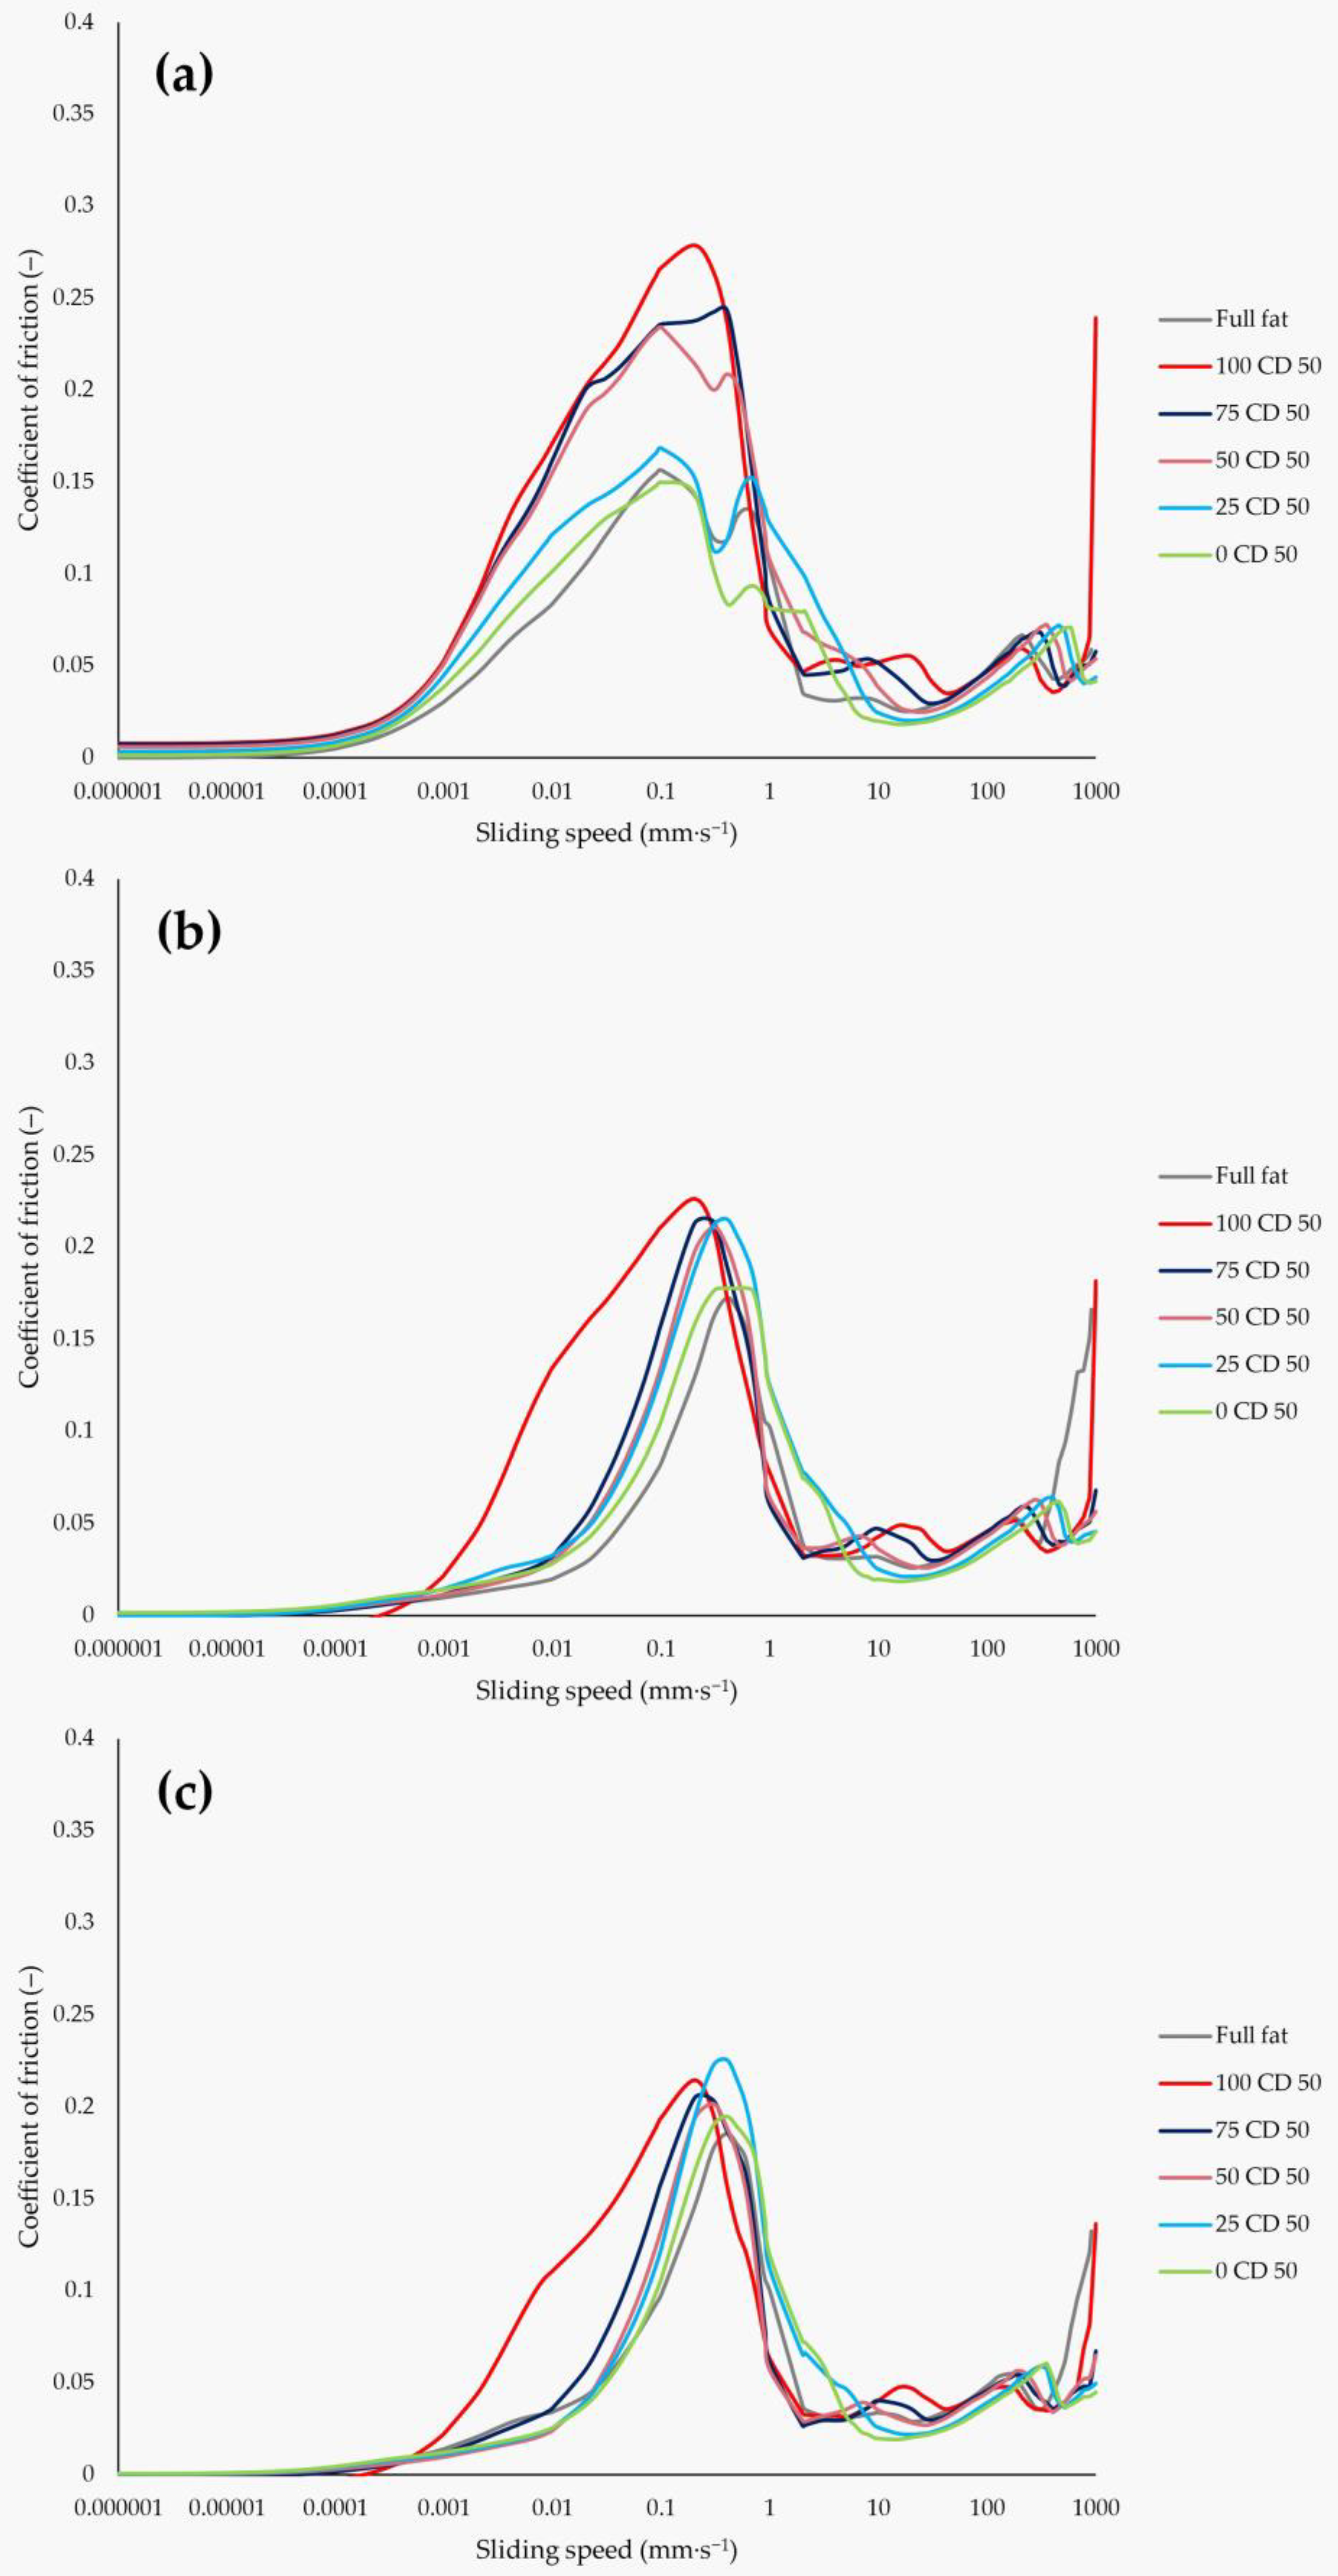
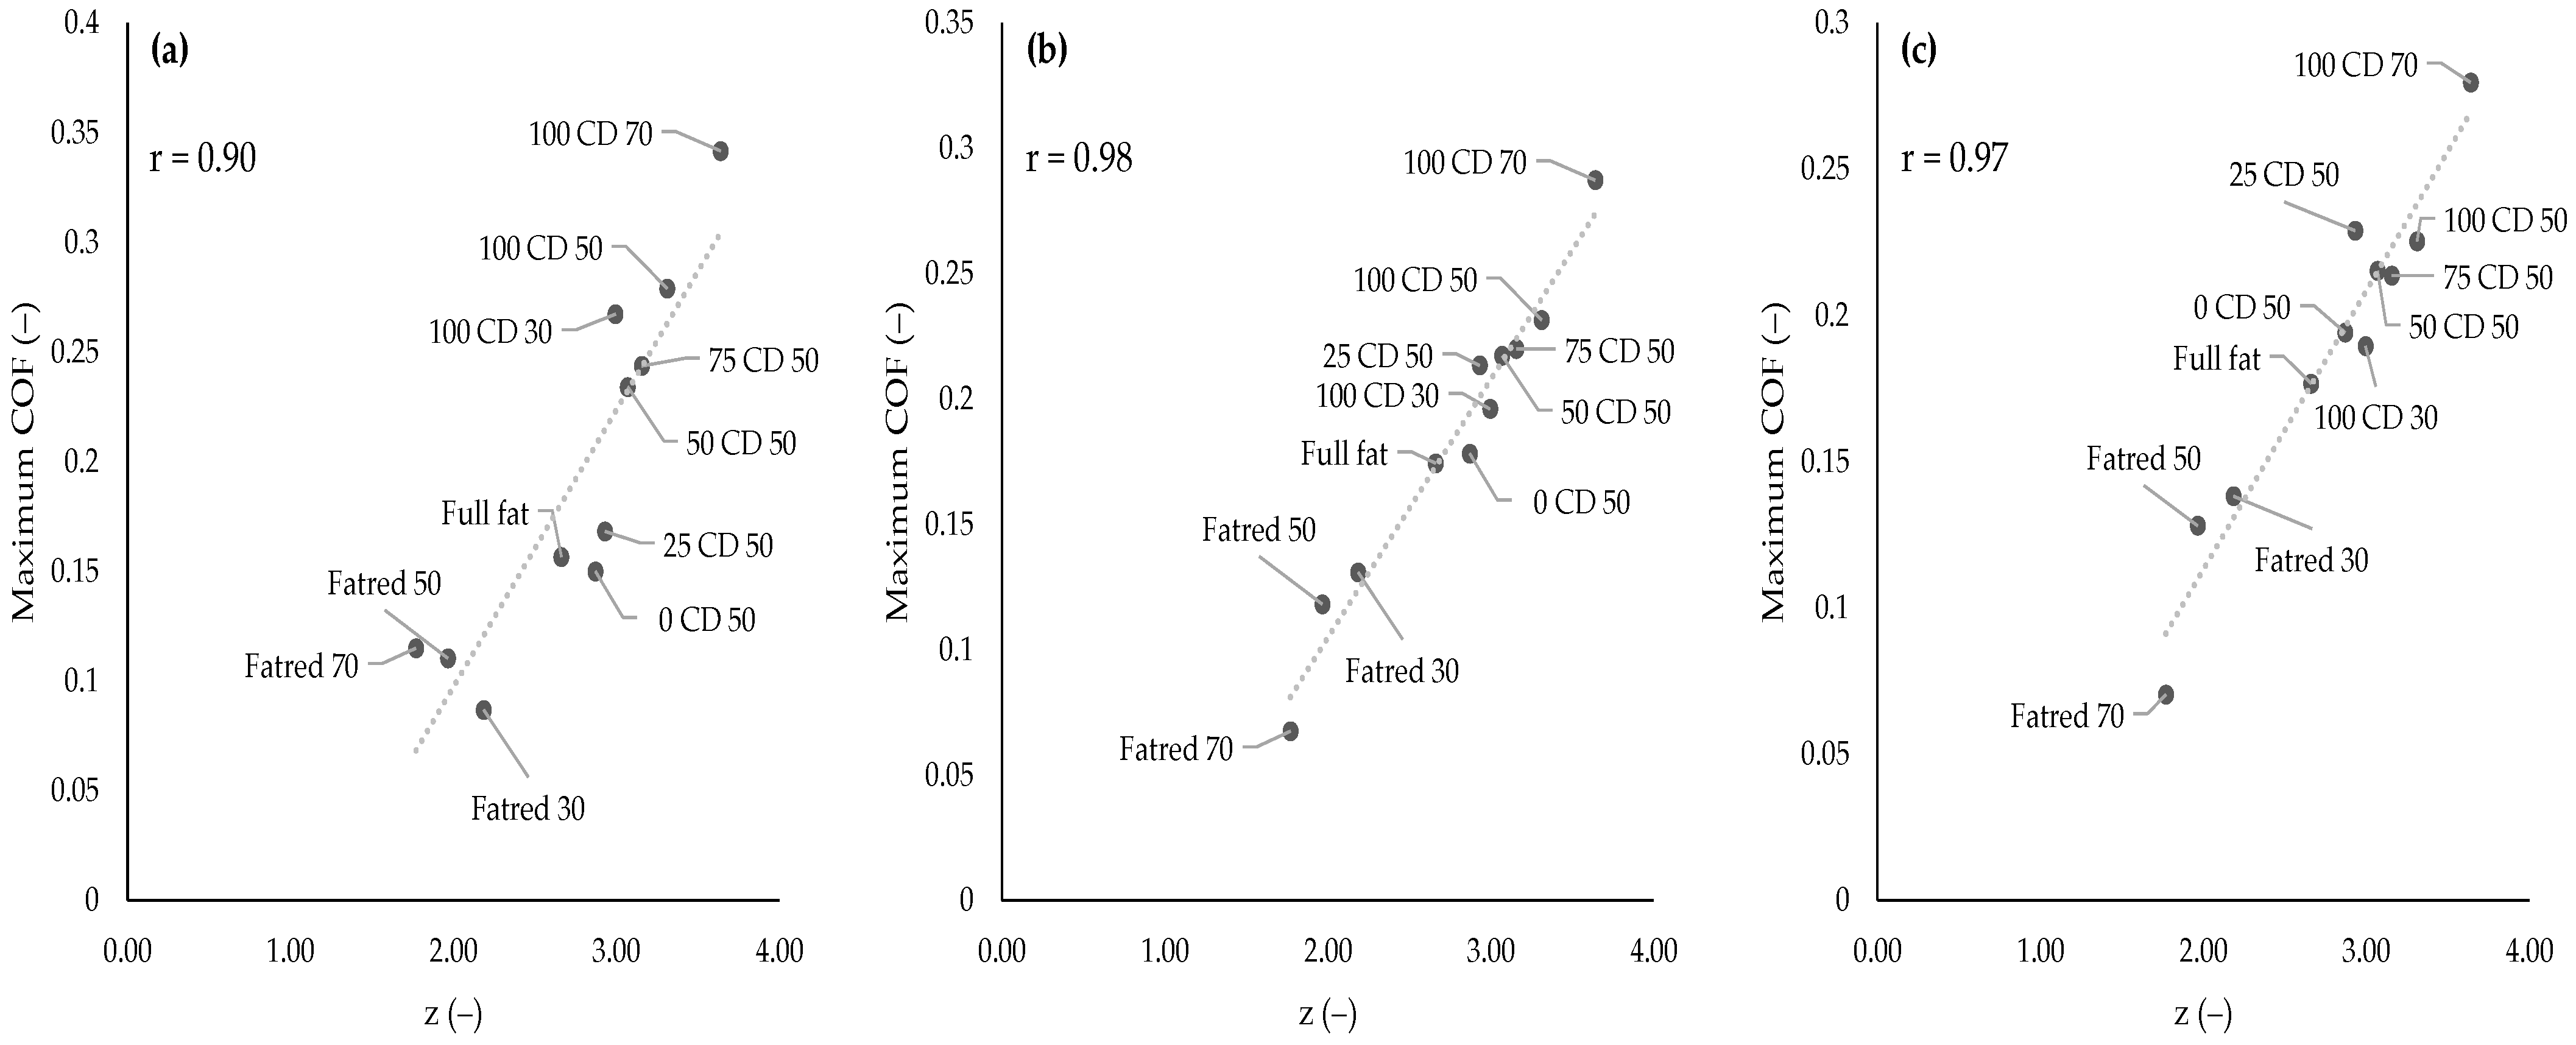
2.7. Tribological Properties
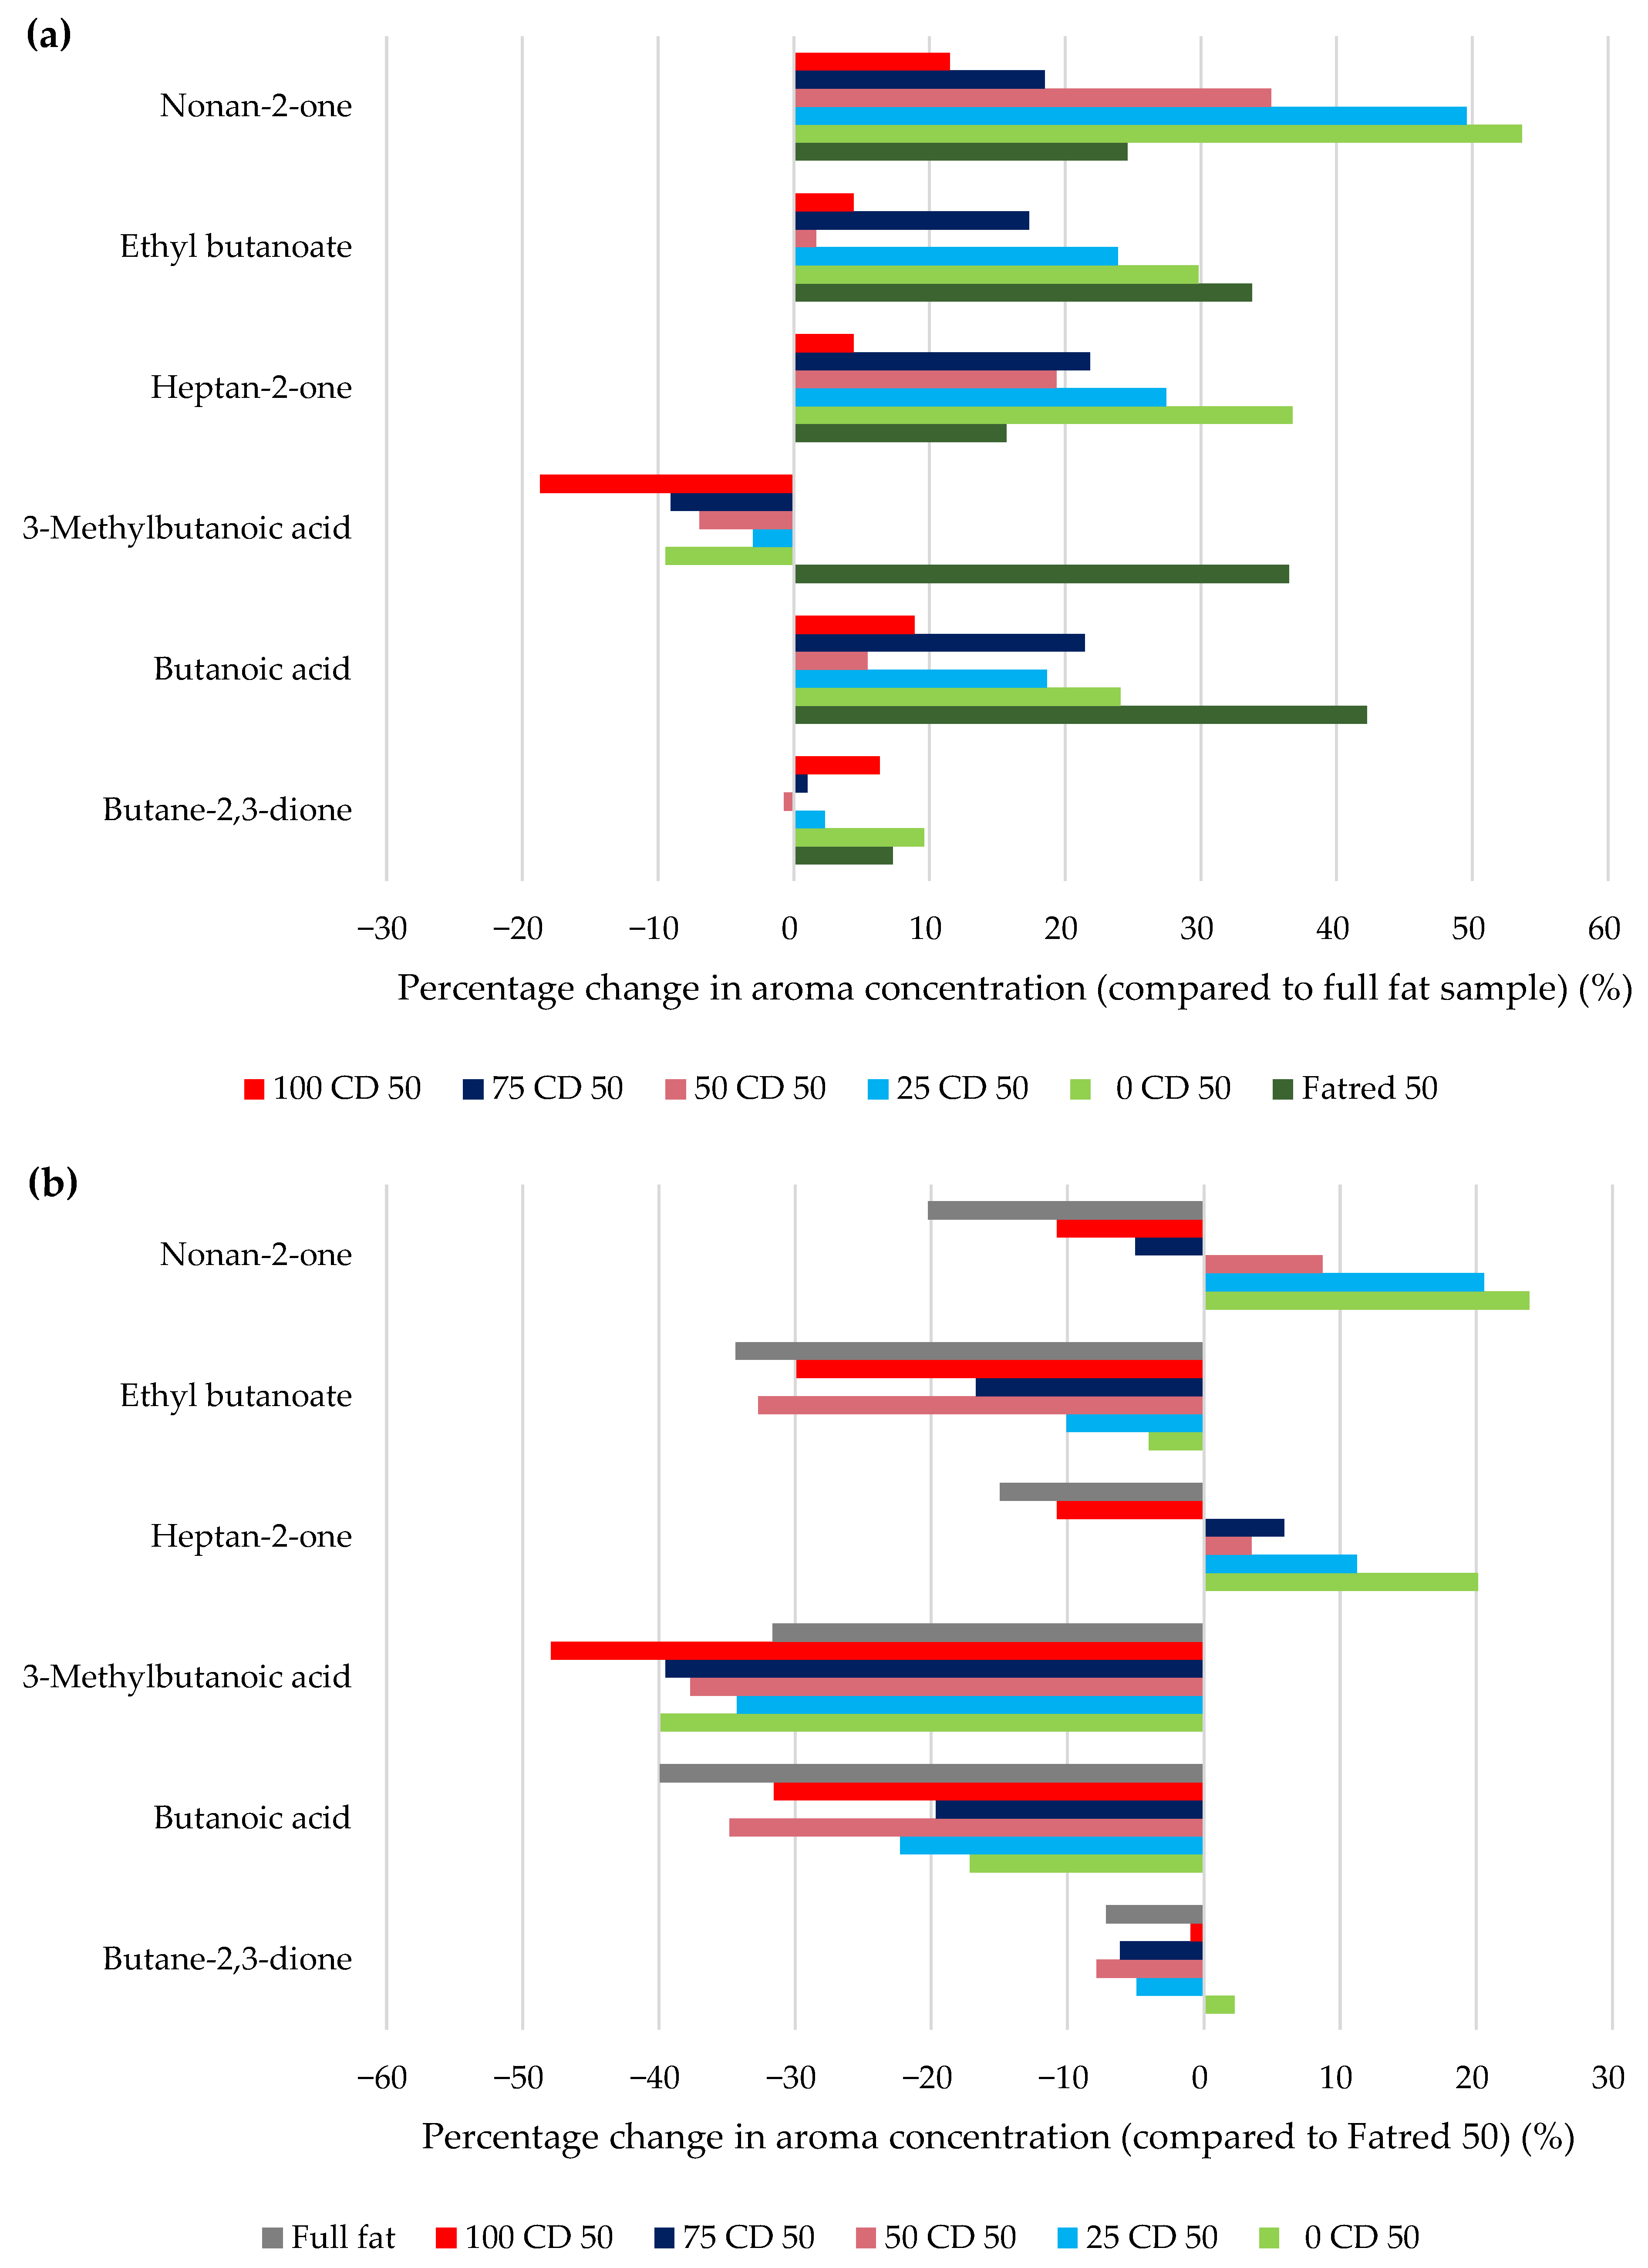
2.8. Aroma Release
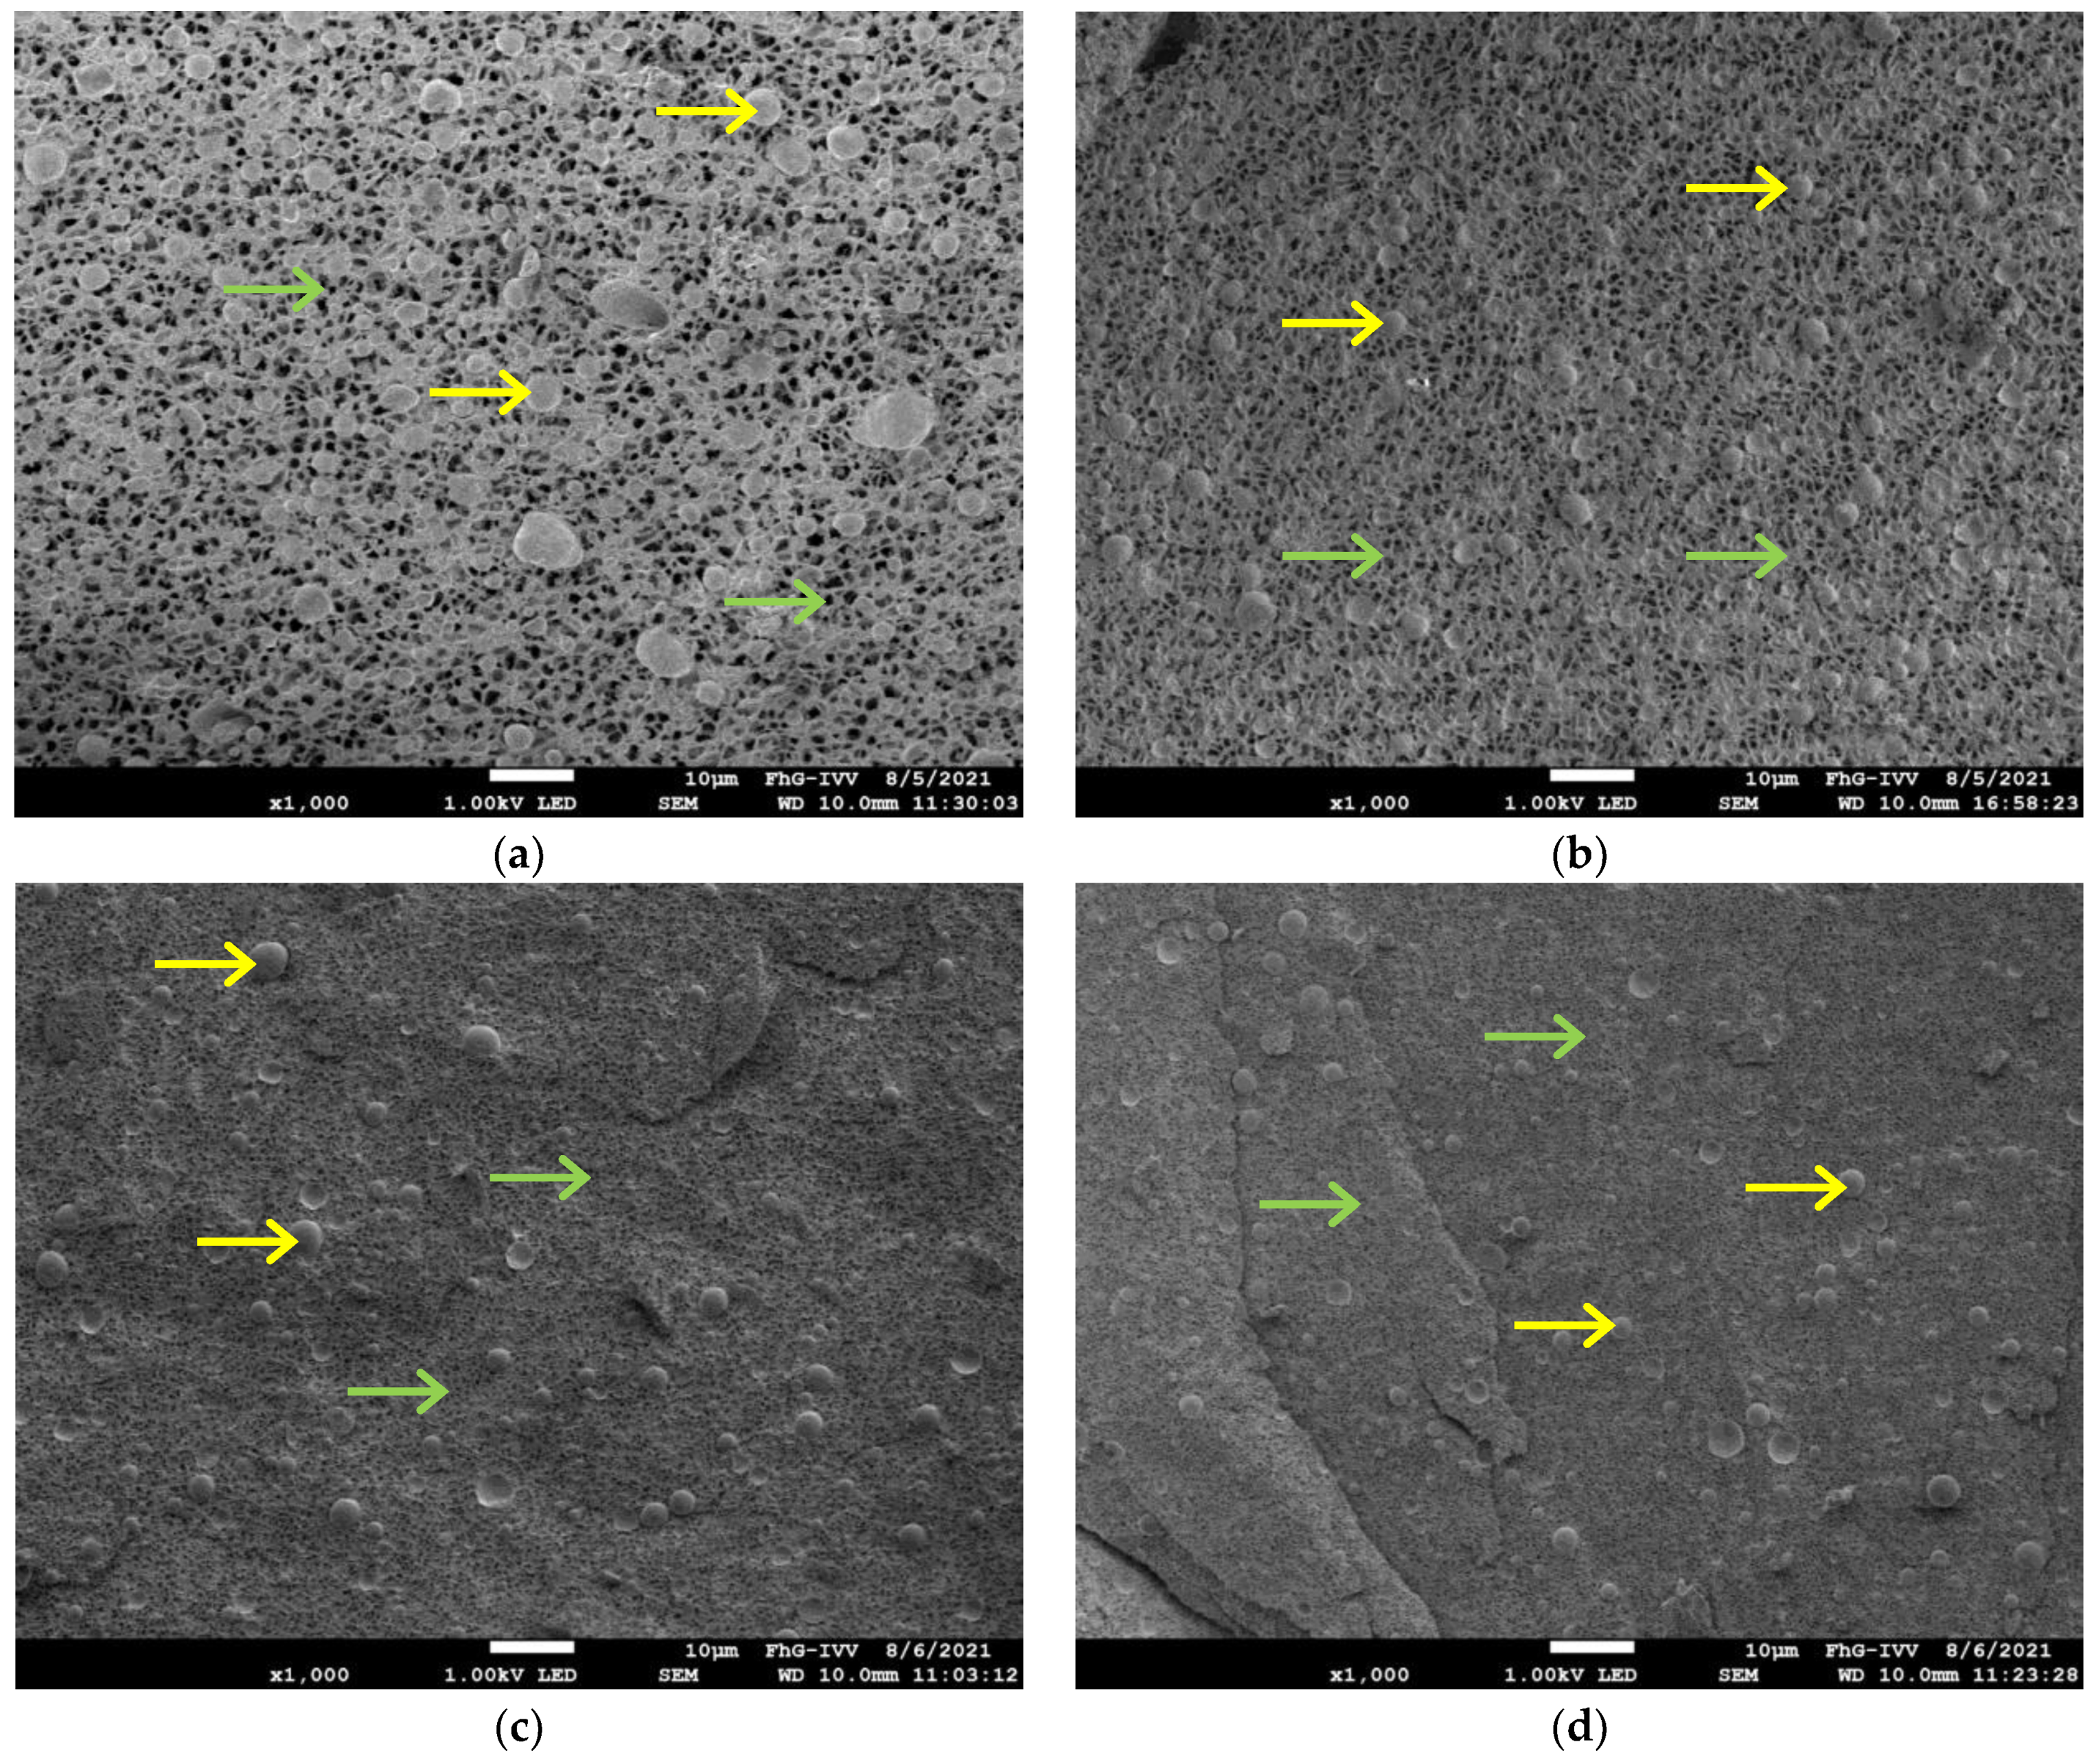
2.9. Cryo-Scanning Electron Microscope (Cyro-SEM)
3. Materials and Methods
3.1. Materials
3.2. Preparation of the Model Processed Cheese Spread
3.3. Preparation of the Aroma Solutions
3.4. Preparation of Artificial Saliva
3.5. Compositional Analysis and pH Measurements
3.6. Texture Analysis
3.7. Spreadability
3.8. Flow Behavior
3.9. Dynamic Oscillatory Rheology
3.10. Tribological Properties
3.11. Aroma Release Analysis by Proton-Transfer-Reaction Mass Spectrometry (PTR-MS)
3.12. Cryo-Scanning Electron Microscope (Cyro-SEM)
3.13. Statistical Analysis
4. Conclusions
Author Contributions
Funding
Institutional Review Board Statement
Informed Consent Statement
Data Availability Statement
Acknowledgments
Conflicts of Interest
Abbreviations
| CD | Corn dextrin |
| Full fat | 100% fat sample |
| Fatred X | All samples where fat is replaced 100% by water |
| Fatred 30 | 30% fat is replaced 100% by water |
| Fatred 70 | 70% fat is replaced 100% by water |
| Fatred 50 | 50% fat is replaced 100% by water |
| 100 CD X | All samples where fat is replaced 100% by CD |
| 100 CD 30 | 30% fat is replaced 100% by CD |
| 100 CD 70 | 70% fat is replaced 100% by CD |
| 100 CD 50 | 50% fat is replaced 100% by CD |
| 75 CD 50 | 50% fat is replaced 75% by CD and 25% by lactose |
| 50 CD 50 | 50% fat is replaced 50% by CD and 50% by lactose |
| 25 CD 50 | 50% fat is replaced 25% by CD and 75% by lactose |
| 0 CD 50 | 50% fat is replaced 0% by CD and 100% by lactose |
| Y CD 50 | All samples with 50% fat replacement |
| PCS | Processed cheese spread |
Appendix A

| Formulation | DM | Fat (abs) | Fat (in DM) | Protein (abs) | Protein (in DM) | Energy Density 1 | Energy Density 1 |
|---|---|---|---|---|---|---|---|
| Per 100 g | (g) | (g) | (g) | (g) | (g) | (kJ) | (kcal) |
| Full fat | 37.0 ± 1.5 a | 20.9 ± 0.5 a | 56.5 ± 2.6 a | 8.9 ± 0.1 a | 24.0 ± 0.8 d | 942 | 228 |
| Fatred 30 | 30.4 ± 0.8 b | 14.8 ± 0.3 b | 48.7 ± 1.7 b | 8.7 ± 0.3 a | 28.5 ± 0.7 bc | 720 | 174 |
| Fatred 70 | 23.9 ± 3.1 c | 6.5 ± 0.3 d | 27.4 ± 3.4 d | 8.9 ± 0.1 a | 37.5 ± 4.0 a | 424 | 102 |
| Fatred 50 | 26.8 ± 1.0 bc | 9.8 ± 0.5 c | 36.8 ± 3.2 c | 8.8 ± 0.1 a | 32.8 ± 1.0 b | 572 | 138 |
| 100 CD 30 | 36.3 ± 1.3 a | 14.5 ± 0.3 b | 40.0 ± 2.0 c | 8.9 ± 0.1 a | 24.5 ± 1.0 cd | 770 | 186 |
| 100 CD 70 | 37.2 ± 1.4 a | 6.4 ± 0.0 d | 17.6 ± 0.3 e | 8.9 ± 0.4 a | 24.0 ± 1.5 cd | 541 | 130 |
| 100 CD 50 | 37.1 ± 1.7 a | 10.2 ± 0.2 c | 27.5 ± 1.1 d | 8.5 ± 0.2 a | 23.0 ± 1.7 d | 656 | 158 |
| 75 CD 50 | 35.9 ± 0.8 a | 10.4 ± 0.2 c | 28.9 ± 0.4 d | 8.8 ± 0.1 a | 24.4 ± 0.6 cd | 675 | 163 |
| 50 CD 50 | 36.6 ± 0.8 a | 10.5 ± 0.3 c | 28.8 ± 0.8 d | 8.9 ± 0.1 a | 24.3 ± 0.9 cd | 694 | 167 |
| 25 CD 50 | 35.9 ± 1.4 a | 10.1 ± 0.1 c | 28.1 ± 1.4 d | 8.9 ± 0.1 a | 24.8 ± 1.2 cd | 714 | 172 |
| 0 CD 50 | 36.6 ± 2.2 a | 10.3 ± 0.4 c | 28.3 ± 2.7 d | 8.9 ± 0.2 a | 24.4 ± 1.0 cd | 733 | 176 |
| Formulation | Butane-2,3-dione (ppbv) | Butanoic Acid (ppbv) | 3-Methylbutanoic Acid (ppbv) | Heptan-2-one (ppbv) | Ethyl Butanoate (ppbv) | Nonan-2-one (ppbv) |
|---|---|---|---|---|---|---|
| Full fat | 114.0 ± 5.0 a | 93.8 ± 6.2 a | 37.7 ± 19.8 a | 82.6 ± 13.0 c | 130.4 ± 19.0 a | 119.9 ± 28.7 b |
| 100 CD 50 | 121.3 ± 16.6 a | 102.1 ± 34.2 a | 29.5 ± 5.5 a | 85.9 ± 9.8 bc | 136.3 ± 38.6 a | 131.3 ± 34.5 ab |
| 75 CD 50 | 115.2 ± 7.2 a | 113.8 ± 20.2 a | 32.1 ± 7.8 a | 99.1 ± 14.7 abc | 153.6 ± 29.0 a | 138.3 ± 29.0 ab |
| 50 CD 50 | 113.1 ± 7.1 a | 93.0 ± 28.9 a | 32.7 ± 4.0 a | 97.3 ± 10.4 abc | 132.6 ± 38.9 a | 155.0 ± 22.0 ab |
| 25 CD 50 | 116.6 ± 10.8 a | 111.2 ± 20.7 a | 33.8 ± 7.8 a | 103.4 ± 17.1 ab | 162.3 ± 44.3 a | 169.3 ± 37.2 a |
| 0 CD 50 | 125.1 ± 10.9 a | 116.3 ± 35.7 a | 32.0 ± 7.2 a | 110.4 ± 16.0 a | 170.3 ± 56.7 a | 173.4 ± 33.6 a |
| Fatred 50 | 122.4 ± 11.4 a | 133.2 ± 5.0 a | 44.8 ± 12.8 a | 94.5 ± 6.8 abc | 175.6 ± 15.2 a | 144.4 ± 12.9 ab |


References
- Nielsen, S.J.; Siega-Riz, A.M.; Popkin, B.M. Trends in food locations and sources among adolescents and young adults. Prev. Med. 2002, 35, 107–113. [Google Scholar] [CrossRef]
- WHO. Report of the Commission on Ending Childhood Obesity; World Health Organization: Geneva, Switzerland, 2016; ISBN 9789241510066. [Google Scholar]
- Kent, S.; Fusco, F.; Gray, A.; Jebb, S.A.; Cairns, B.J.; Mihaylova, B. Body mass index and healthcare costs: A systematic literature review of individual participant data studies. Obes. Rev. 2017, 18, 869–879. [Google Scholar] [CrossRef] [PubMed]
- Shahbandeh, M. Projected Market Value of Processed Cheese Worldwide from 2020 to 2029 (in Billion U.S. Dollars). Available online: https://www.statista.com/statistics/827325/global-processed-cheese-market-revenue/ (accessed on 6 January 2022).
- Hennelly, P.J.; Dunne, P.G.; O′Sullivan, M.; O′Riordan, E.D. Increasing the moisture content of imitation cheese: Effects on texture, rheology and microstructure. Eur. Food Res. Technol. 2005, 220, 415–420. [Google Scholar] [CrossRef]
- Hennelly, P.J.; Dunne, P.G.; O′Sullivan, M.; O′Riordan, E.D. Textural, rheological and microstructural properties of imitation cheese containing inulin. J. Food Eng. 2006, 75, 388–395. [Google Scholar] [CrossRef]
- Hosseini-Parvar, S.H.; Matia-Merino, L.; Golding, M. Effect of basil seed gum (BSG) on textural, rheological and microstructural properties of model processed cheese. Food Hydrocoll. 2015, 43, 557–567. [Google Scholar] [CrossRef]
- Johnson, M.E.; Kapoor, R.; McMahon, D.J.; McCoy, D.R.; Narasimmon, R.G. Reduction of sodium and fat levels in natural and processed cheeses: Scientific and technological aspects. Compr. Rev. Food Sci. Food Saf. 2009, 8, 252–268. [Google Scholar] [CrossRef] [PubMed]
- Liu, H.; Xu, X.M.; Guo, S.D. Comparison of full-fat and low-fat cheese analogues with or without pectin gel through microstructure, texture, rheology, thermal and sensory analysis. Int. J. Food Sci. Technol. 2008, 43, 1581–1592. [Google Scholar] [CrossRef]
- Tamime, A.Y. (Ed.) Processed Cheese and Analogues; Wiley-Blackwell: Ames, IA, USA, 2011; ISBN 978-1-4051-8642-1. [Google Scholar]
- Černíková, M.; Salek, R.N.; Kozáčková, D.; Běhalová, H.; Luňáková, L.; Buňka, F. The effect of selected processing parameters on viscoelastic properties of model processed cheese spreads. Int. Dairy J. 2017, 66, 84–90. [Google Scholar] [CrossRef]
- Ferrão, L.L.; Silva, E.B.; Silva, H.L.A.; Silva, R.; Mollakhalili, N.; Granato, D.; Freitas, M.Q.; Silva, M.C.; Raices, R.S.L.; Padilha, M.C.; et al. Strategies to develop healthier processed cheeses: Reduction of sodium and fat contents and use of prebiotics. Food Res. Int. 2016, 86, 93–102. [Google Scholar] [CrossRef]
- Chatziantoniou, S.E.; Thomareis, A.S.; Kontominas, M.G. Effect of chemical composition on physico-chemical, rheological and sensory properties of spreadable processed whey cheese. Eur. Food Res. Technol. 2015, 241, 737–748. [Google Scholar] [CrossRef]
- Guinee, T.P.; O′Callaghan, D.J. Effect of increasing the protein-to-fat ratio and reducing fat content on the chemical and physical properties of processed cheese product. J. Dairy Sci. 2013, 96, 6830–6839. [Google Scholar] [CrossRef] [Green Version]
- Lee, S.K.; Klostermeyer, H.; Anema, S.G. Effect of fat and protein-in-water concentrations on the properties of model processed cheese. Int. Dairy J. 2015, 50, 15–23. [Google Scholar] [CrossRef]
- Mistry, V.V. Low fat cheese technology. Int. Dairy J. 2001, 11, 413–422. [Google Scholar] [CrossRef]
- O′Connor, T.P.; O′Brien, N.M. Butter and other milk fat products|Fat replacers. In Encyclopedia of Dairy Sciences, 2nd ed.; Fuquay, J.W., Fox, P.F., McSweeney, P.L.H., Eds.; Elsevier: Amsterdam, The Netherlands, 2011; pp. 528–532. ISBN 9780123744074. [Google Scholar]
- Szafrańska, J.O.; Muszyński, S.; Tomasevic, I.; Sołowiej, B.G. The Influence of Dietary Fibers on Physicochemical Properties of Acid Casein Processed Cheese Sauces Obtained with Whey Proteins and Coconut Oil or Anhydrous Milk Fat. Foods 2021, 10, 759. [Google Scholar] [CrossRef] [PubMed]
- Lefranc-Millot, C.; Wils, D.; Deremaux, L.; Macioce, V.; Saniez-Degrave, M.-H. NUTRIOSE®, more than just a soluble fibre. In Dietary Fibre: New Frontiers for Food and Health; Van Der Kamp, J.W., Jones, J., McCleary, B., Topping, D.J., Eds.; Wageningen Academic Publishers: Wageningen, The Netherlands, 2010; pp. 295–308. ISBN 978-90-8686-128-6. [Google Scholar]
- Schädle, C.N.; Eisner, P.; Bader-Mittermaier, S. The combined effects of different fat replacers and rennet casein on the properties of reduced-fat processed cheese. J. Dairy Sci. 2020, 103, 3980–3993. [Google Scholar] [CrossRef]
- Schädle, C.N.; Bader-Mittermaier, S.; Sanahuja, S. Characterization of Reduced-Fat Mayonnaise and Comparison of Sensory Perception, Rheological, Tribological, and Textural Analyses. Foods 2022, 11, 806. [Google Scholar] [CrossRef]
- Schädle, C.N.; Sanahuja, S.; Bader-Mittermaier, S. Influence of Fat Replacers on the Rheological, Tribological, and Aroma Release Properties of Reduced-Fat Emulsions. Foods 2022, 11, 820. [Google Scholar] [CrossRef]
- Gunasekaran, S.; Ak, M.M. (Eds.) Cheese Rheology and Texture; CRC Press: Boca Raton, FL, USA, 2003; ISBN 9781587160219. [Google Scholar]
- Tunick, M.H. Small-strain dynamic rheology of food protein networks. J. Agric. Food Chem. 2011, 59, 1481–1486. [Google Scholar] [CrossRef]
- Stading, M.; Hermansson, A.-M. Viscoelastic behaviour of β-lactoglobulin gel structures. Food Hydrocoll. 1990, 4, 121–135. [Google Scholar] [CrossRef]
- Zheng, H. Introduction: Measuring Rheological Properties of Foods. In Rheology of Semisolid Foods; Joyner, H.S., Ed.; Springer: Cham, Switzerland, 2019; pp. 3–30. ISBN 9783030271336. [Google Scholar]
- Wang, Q.; Zhu, Y.; Ji, Z.; Chen, J. Lubrication and Sensory Properties of Emulsion Systems and Effects of Droplet Size Distribution. Foods 2021, 10, 3024. [Google Scholar] [CrossRef] [PubMed]
- Ruan, Q.; Yang, X.; Zeng, L.; Qi, J. Physical and tribological properties of high internal phase emulsions based on citrus fibers and corn peptides. Food Hydrocoll. 2019, 95, 53–61. [Google Scholar] [CrossRef]
- Selway, N.; Stokes, J.R. Soft materials deformation, flow, and lubrication between compliant substrates: Impact on flow behavior, mouthfeel, stability, and flavor. Annu. Rev. Food Sci. Technol. 2014, 5, 373–393. [Google Scholar] [CrossRef] [PubMed]
- Pondicherry, K.S.; Rummel, F.; Laeuger, J. Extended stribeck curves for food samples. Biosurf. Biotribol. 2018, 4, 34–37. [Google Scholar] [CrossRef]
- Smit, G.; Smit, B.A.; Engels, W.J.M. Flavour formation by lactic acid bacteria and biochemical flavour profiling of cheese products. FEMS Microbiol. Rev. 2005, 29, 591–610. [Google Scholar] [CrossRef]
- Curioni, P.; Bosset, J.O. Key odorants in various cheese types as determined by gas chromatography-olfactometry. Int. Dairy J. 2002, 12, 959–984. [Google Scholar] [CrossRef]
- Niimi, J.; Eddy, A.I.; Overington, A.R.; Heenan, S.P.; Silcock, P.; Bremer, P.J.; Delahunty, C.M. Aroma–taste interactions between a model cheese aroma and five basic tastes in solution. Food Qual. Prefer. 2014, 31, 1–9. [Google Scholar] [CrossRef]
- Nursten, H.E. The flavour of milk and dairy products: I. Milk of different kinds, milk powder, butter and cream. Int. J. Dairy Technol. 1997, 50, 48–56. [Google Scholar] [CrossRef]
- Kilcawley, K.N. Cheese Flavour. In Fundamentals of Cheese Science, 2nd ed.; Fox, P.F., Guinee, T.P., Cogan, T.M., McSweeney, P.L.H., Eds.; Springer: Boston, MA, USA, 2017; pp. 443–474. ISBN 978-1-4899-7679-6. [Google Scholar]
- Guichard, E. Interaction of aroma compounds with food matrices. In Flavour Development, Analysis and Perception in Food and Beverages; Parker, J.K., Elmore, J.S., Methven, L., Eds.; WP Woodhead Publ./Elsevier: Amsterdam, The Netherlands, 2015; pp. 273–295. ISBN 9781782421030. [Google Scholar]
- Lenze, S.; Wolfschoon-Pombo, A.; Schrader, K.; Kulozik, U. Effect of the compositional factors and processing conditions on the creaming reaction during process cheese manufacturing. Food Bioprocess Technol. 2019, 56, 1224. [Google Scholar] [CrossRef]
- Chang, C.; Li, J.; Li, X.; Wang, C.; Zhou, B.; Su, Y.; Yang, Y. Effect of protein microparticle and pectin on properties of light mayonnaise. Lebensm. Wiss. Technol. 2017, 82, 8–14. [Google Scholar] [CrossRef]
- Liu, H.; Xu, X.M.; Guo, S. Rheological, texture and sensory properties of low-fat mayonnaise with different fat mimetics. Lebensm. Wiss. Technol. 2007, 40, 946–954. [Google Scholar] [CrossRef]
- Ningtyas, D.W.; Bhandari, B.; Bansal, N.; Prakash, S. A tribological analysis of cream cheeses manufactured with different fat content. Int. Dairy J. 2017, 73, 155–165. [Google Scholar] [CrossRef] [Green Version]
- McClements, D.J.; Demetriades, K. An integrated approach to the development of reduced-fat food emulsions. Crit. Rev. Food Sci. Nutr. 1998, 38, 511–536. [Google Scholar] [CrossRef] [PubMed]
- Černíková, M.; Nebesarova, J.; Salek, R.N.; Rihackova, L.; Bunka, F. Microstructure and textural and viscoelastic properties of model processed cheese with different dry matter and fat in dry matter content. J. Dairy Sci. 2017, 100, 4300–4307. [Google Scholar] [CrossRef] [PubMed] [Green Version]
- Piska, I.; Štětina, J. Influence of cheese ripening and rate of cooling of the processed cheese mixture on rheological properties of processed cheese. J. Food Eng. 2004, 61, 551–555. [Google Scholar] [CrossRef]
- Gabriele, D.; de Cindio, B.; D′Antona, P. A weak gel model for foods. Rheol. Acta 2001, 40, 120–127. [Google Scholar] [CrossRef]
- Strohmaier, W.; Klostermeyer, H.; Deuritz, P.; Windhab, E. Comparison of different methods to determine the spreadability and firmness of processed cheese. Z. Lebensm. Unters. Forsch. 1992, 194, 531–535. [Google Scholar] [CrossRef]
- Guinee, T.P.; Auty, M.A.E.; Mullins, C. Observations on the microstructure and heat-induced changes in the viscoelasticity of commercial cheeses. Aust. J. Dairy Technol. 1999, 54, 84–89. [Google Scholar]
- Schenkel, P.; Samudrala, R.; Hinrichs, J. The effect of adding whey protein particles as inert filler on thermophysical properties of fat-reduced semihard cheese type Gouda. Int. J. Dairy Technol. 2013, 66, 220–230. [Google Scholar] [CrossRef]
- Guggisberg, D.; Bütikofer, U.; Albrecht, B. Melting and solidification characteristics of swiss raclette cheese measured by small amplitude oscillatory shear measurements. J. Texture Stud. 2007, 38, 297–323. [Google Scholar] [CrossRef]
- Flamminii, F.; Di Mattia, C.D.; Sacchetti, G.; Neri, L.; Mastrocola, D.; Pittia, P. Physical and Sensory Properties of Mayonnaise Enriched with Encapsulated Olive Leaf Phenolic Extracts. Foods 2020, 9, 997. [Google Scholar] [CrossRef] [PubMed]
- Hiiemae, K.M.; Palmer, J.B. Tongue movements in feeding and speech. Crit. Rev. Oral Biol. Med. 2003, 14, 413–429. [Google Scholar] [CrossRef] [PubMed] [Green Version]
- Pradal, C.; Stokes, J.R. Oral tribology: Bridging the gap between physical measurements and sensory experience. Curr. Opin. Food Sci. 2016, 9, 34–41. [Google Scholar] [CrossRef] [Green Version]
- Shewan, H.M.; Pradal, C.; Stokes, J.R. Tribology and its growing use toward the study of food oral processing and sensory perception. J. Texture Stud. 2020, 51, 7–22. [Google Scholar] [CrossRef] [PubMed] [Green Version]
- Tietz, M.; Buettner, A.; Conde-Petit, B. Interaction between starch and aroma compounds as measured by proton transfer reaction mass spectrometry (PTR-MS). Food Chem. 2008, 108, 1192–1199. [Google Scholar] [CrossRef]
- Piccone, P.; Lonzarich, V.; Navarini, L.; Fusella, G.; Pittia, P. Effect of sugars on liquid-vapour partition of volatile compounds in ready-to-drink coffee beverages. J. Mass Spectrom. 2012, 47, 1120–1131. [Google Scholar] [CrossRef] [PubMed]
- van Ruth, S.M.; King, C.; Giannouli, P. Influence of lipid fraction, emulsifier fraction, and mean particle diameter of oil-in-water emulsions on the release of 20 aroma compounds. J. Agric. Food Chem. 2002, 50, 2365–2371. [Google Scholar] [CrossRef]
- Seuvre, A.-M.; Voilley, A. Physico-Chemical Interactions in the Flavor-Release Process. In Springer Handbook of Odor; Buettner, A., Ed.; Springer International Publishing: Cham, Switzerland, 2017; pp. 35–36. ISBN 978-3-319-26930-6. [Google Scholar]
- Mistry, V.V.; Anderson, D.L. Composition and microstructure of commercial full-fat and low-fat cheeses. Food Struct. 1993, 12, 259–266. [Google Scholar]
- Karimi, R.; Azizi, M.H.; Ghasemlou, M.; Vaziri, M. Application of inulin in cheese as prebiotic, fat replacer and texturizer: A review. Carbohydr. Polym. 2015, 119, 85–100. [Google Scholar] [CrossRef]
- Bryant, A.; Ustunol, Z.; Steffe, J. Texture of Cheddar cheese as influenced by fat reduction. J. Food Sci. 1995, 60, 1216–1219. [Google Scholar] [CrossRef]
- Noronha, N.; O’Riordan, E.D.; O’Sullivan, M. Replacement of fat with functional fibre in imitation cheese. Int. Dairy J. 2007, 17, 1073–1082. [Google Scholar] [CrossRef]
- IFA. GESTIS-Stoffdatenbank. Available online: Gestis.dguv.de (accessed on 10 February 2022).
- Minekus, M.; Alminger, M.; Alvito, P.; Ballance, S.; Bohn, T.; Bourlieu, C.; Carrière, F.; Boutrou, R.; Corredig, M.; Dupont, D.; et al. A standardised static in vitro digestion method suitable for food—An international consensus. Food Funct. 2014, 5, 1113–1124. [Google Scholar] [CrossRef] [PubMed] [Green Version]
- AOAC. Method 925.10. Solids (total) and moisture in flour. In Official Methods of Analysis of the Association of Official Analytical Chemists (AOAC); Latimer, G.W., Horwitz, W., Eds.; AOAC International: Gaithersburg, MD, USA, 2005. [Google Scholar]
- AOAC. Method 968.06. Protein (crude) in animal feed. In Official Methods of Analysis of the Association of Official Analytical Chemists (AOAC); Latimer, G.W., Horwitz, W., Eds.; AOAC: Gaithersburg, MD, USA, 2005. [Google Scholar]
- DGF. Deutsche Einheitsmethoden: Zur Untersuchung von Fetten, Fettprodukten, Tensiden und Verwandten Stoffen; Aktualisierungslieferung zur 2. Aufl. inkl. 23. Akt.lfg; Wissenschaftliche Verlagsgesellschaft: Stuttgart, Germany, 2018; ISBN 978-3-8047-3808-9. [Google Scholar]
- Sádlíková, I.; Buňka, F.; Budinský, P.; Barbora, V.; Pavlínek, V.; Hoza, I. The effect of selected phosphate emulsifying salts on viscoelastic properties of processed cheese. Lebensm. Wiss. Technol. 2010, 43, 1220–1225. [Google Scholar] [CrossRef]
- Winter, H.H.; Chambon, F. Analysis of linear viscoelasticity of a crosslinking polymer at the gel point. J. Rheol. 1986, 30, 367–382. [Google Scholar] [CrossRef]
- Rasband, W.S. ImageJ; U.S. National Institutes of Health: Bethesda, MD, USA, 1997–2018. Available online: https://imagej.nih.gov/ij/ (accessed on 14 February 2022).
- El-Bakry, M.; Duggan, E.; O′Riordan, E.D.; O′Sullivan, M. Effect of chelating salt type on casein hydration and fat emulsification during manufacture and post-manufacture functionality of imitation cheese. J. Food Eng. 2011, 102, 145–153. [Google Scholar] [CrossRef]
- El-Bakry, M.; Sheehan, J. Analysing cheese microstructure: A review of recent developments. J. Food Eng. 2014, 125, 84–96. [Google Scholar] [CrossRef]


| Formulation | AF | z | G′ at 1 Hz | G″ at 1 Hz | G* at 1 Hz | tan δ at 1 Hz |
|---|---|---|---|---|---|---|
| (Pa∙s1/z) | (–) | (Pa) | (Pa) | (Pa) | (–) | |
| Full fat | 859.5 ± 179.6 a | 2.66 ± 0.08 g | 1450.7 ± 298.3 a | 1040.9 ± 170.1 a | 1785.9 ± 340.9 a | 0.72 ± 0.04 d |
| Fatred 30 | 206.6 ± 43.0 e | 2.18 ± 0.07 h | 350.8 ± 72.9 e | 352.4 ± 59.9 d | 497.4 ± 93.8 d | 1.01 ± 0.04 c |
| Fatred 70 | 36.3 ± 6.2 f | 1.77 ± 0.10 j | 57.7 ± 8.9 f | 89.2 ± 10.4 f | 106.2 ± 13.5 e | 1.55 ± 0.06 a |
| Fatred 50 | 93.7 ± 17.6 f | 1.97 ± 0.08 i | 156.0 ± 34.8 f | 192.4 ± 29.6 e | 247.9 ± 44.9 e | 1.25 ± 0.08 b |
| 100 CD 30 | 649.5 ± 56.0 b | 2.99 ± 0.06 de | 1063.1 ± 86.9 b | 648.8 ± 37.8 b | 1245.5 ± 93.7 b | 0.61 ± 0.02 efg |
| 100 CD 70 | 643.6 ± 73.9 bc | 3.64 ± 0.09 a | 983.9 ± 104.9 bc | 461.9 ± 31.6 c | 1087.1 ± 108.4 bc | 0.47 ± 0.02 i |
| 100 CD 50 | 606.1 ± 57.7 bc | 3.31 ± 0.07 b | 955.7 ± 88.5 bcd | 508.1 ± 39.2 c | 1082.4 ± 96.0 bc | 0.53 ± 0.01 h |
| 75 CD 50 | 560.8 ± 43.2 bcd | 3.16 ± 0.06 c | 901.9 ± 65.9 bcd | 508.5 ± 24.7 c | 1035.5 ± 69.4 c | 0.56 ± 0.01 gh |
| 50 CD 50 | 538.3 ± 52.9 cd | 3.07 ± 0.07 cd | 875.2 ± 80.9 cd | 515.3 ± 33.7 c | 1015.7 ± 86.7 c | 0.59 ± 0.02 fg |
| 25 CD 50 | 480.9 ± 36.5 d | 2.93 ± 0.08 ef | 792.8 ± 53.6 d | 503.8 ± 25.0 c | 939.4 ± 58.5 c | 0.64 ± 0.01 ef |
| 0 CD 50 | 483.6 ± 30.0 d | 2.87 ± 0.05 f | 802.0 ± 47.9 d | 527.6 ± 24.2 c | 960.0 ± 53.2 c | 0.66 ± 0.01 e |
| Y CD 50 | |||||||||||
|---|---|---|---|---|---|---|---|---|---|---|---|
| Fatred X | 100 CD X | ||||||||||
| Full Fat | Fatred 30 | Fatred 70 | Fatred 50 | 100 CD 30 | 100 CD 70 | 100 CD 50 | 75 CD 50 | 50 CD 50 | 25 CD 50 | 0 CD 50 | |
| (g/100 g) | (g/100 g) | (g/100 g) | (g/100 g) | (g/100 g) | (g/100 g) | (g/100 g) | (g/100 g) | (g/100 g) | (g/100 g) | (g/100 g) | |
| Water | 61.4 | 67.4 | 75.4 | 71.4 | 61.4 | 61.4 | 61.4 | 61.4 | 61.4 | 61.4 | 61.4 |
| Fat | 20 | 14 | 6 | 10 | 14 | 6 | 10 | 10 | 10 | 10 | 10 |
| CD | 0 | 0 | 0 | 0 | 6 | 14 | 10 | 7.5 | 5 | 2.5 | 0 |
| Lactose | 0 | 0 | 0 | 0 | 0 | 0 | 0 | 2.5 | 5 | 7.5 | 10 |
| Rennet casein | 9.5 | 9.5 | 9.5 | 9.5 | 9.5 | 9.5 | 9.5 | 9.5 | 9.5 | 9.5 | 9.5 |
| Skim milk powder | 3.5 | 3.5 | 3.5 | 3.5 | 3.5 | 3.5 | 3.5 | 3.5 | 3.5 | 3.5 | 3.5 |
| Emulsifying salt | 2.5 | 2.5 | 2.5 | 2.5 | 2.5 | 2.5 | 2.5 | 2.5 | 2.5 | 2.5 | 2.5 |
| Table salt | 2 | 2 | 2 | 2 | 2 | 2 | 2 | 2 | 2 | 2 | 2 |
| Aroma solution 1 | 1 | 1 | 1 | 1 | 1 | 1 | 1 | 1 | 1 | 1 | 1 |
| Aroma solution 2 | 0.1 | 0.1 | 0.1 | 0.1 | 0.1 | 0.1 | 0.1 | 0.1 | 0.1 | 0.1 | 0.1 |
| Aroma Solution | Aroma Compound | Concentration in Aroma Solution (µg∙g−1) | Concentration in PCS (µg∙g−1) | Log P Value [61] |
|---|---|---|---|---|
| 1 | Butane-2,3-dione | 1938 | 19.4 | −1.34 |
| Butanoic acid | 8437 | 84.4 | 0.79 | |
| 3-Methylbutanoic acid | 28,867 | 288.7 | 1.16 | |
| Ethyl butanoate | 1500 | 15.0 | 1.71 | |
| 2 | Heptan-2-one | 5245 | 5.3 | 1.98 |
| Nonan-2-one | 56,404 | 56.4 | 3.16 |
Publisher’s Note: MDPI stays neutral with regard to jurisdictional claims in published maps and institutional affiliations. |
© 2022 by the authors. Licensee MDPI, Basel, Switzerland. This article is an open access article distributed under the terms and conditions of the Creative Commons Attribution (CC BY) license (https://creativecommons.org/licenses/by/4.0/).
Share and Cite
Schädle, C.N.; Bader-Mittermaier, S.; Sanahuja, S. The Effect of Corn Dextrin on the Rheological, Tribological, and Aroma Release Properties of a Reduced-Fat Model of Processed Cheese Spread. Molecules 2022, 27, 1864. https://doi.org/10.3390/molecules27061864
Schädle CN, Bader-Mittermaier S, Sanahuja S. The Effect of Corn Dextrin on the Rheological, Tribological, and Aroma Release Properties of a Reduced-Fat Model of Processed Cheese Spread. Molecules. 2022; 27(6):1864. https://doi.org/10.3390/molecules27061864
Chicago/Turabian StyleSchädle, Christopher N., Stephanie Bader-Mittermaier, and Solange Sanahuja. 2022. "The Effect of Corn Dextrin on the Rheological, Tribological, and Aroma Release Properties of a Reduced-Fat Model of Processed Cheese Spread" Molecules 27, no. 6: 1864. https://doi.org/10.3390/molecules27061864
APA StyleSchädle, C. N., Bader-Mittermaier, S., & Sanahuja, S. (2022). The Effect of Corn Dextrin on the Rheological, Tribological, and Aroma Release Properties of a Reduced-Fat Model of Processed Cheese Spread. Molecules, 27(6), 1864. https://doi.org/10.3390/molecules27061864