Article

Analysis of Proanthocyanidins in Plant Materials Using Hydrophilic Interaction HPLC-QTOF-MS

1
National-Local Joint Engineering Laboratory of Intelligent Food Technology and Equipment, Zhejiang Key Laboratory for Agro-Food Processing, Zhejiang Engineering Laboratory of Food Technology and Equipment, College of Biosystems Engineering and Food Science, Zhejiang University, Hangzhou 310058, China
2
Fuli Institute of Food Science, Zhejiang University, Hangzhou 310058, China
3
Natural Medicine Institute of Zhejiang YangShengTang Co., Ltd., No. 181, Geyazhuang, Xihu District, Hangzhou 310058, China
4
School of Medical Instruments and Food Engineering, University of Shanghai for Science and Technology, Shanghai 200093, China
5
Ningbo Research Institute, Zhejiang University, Ningbo 315100, China
6
Zhongyuan Institute, Zhejiang University, Zhengzhou 450000, China
*
Author to whom correspondence should be addressed.
Molecules 2022, 27(9), 2684; https://doi.org/10.3390/molecules27092684
Submission received: 11 March 2022 / Revised: 14 April 2022 / Accepted: 19 April 2022 / Published: 21 April 2022
(This article belongs to the Topic Applied Sciences in Functional Foods)

Abstract

:
Proanthocyanidins (PACs) have been proven to possess a wide range of biological activities, but complex structures limit their study of structure–function relationships. Therefore, an efficient and general method using hydrophilic interaction high-performance liquid chromatography coupled with high-resolution quadrupole time-of-flight tandem mass spectrometry (HILIC-QTOF-MS) was established to analyze PACs from different plant materials. This method was successfully applied to characterize PACs from Chinese bayberry (Myrica rubra Sieb. et Zucc.) leaves (BLPs), sorghum testa (STPs) and grape seeds (GSPs). BLPs with the degree of polymerization (DP) from 1 to 8 were separated. BLPs are mainly B-type prodelphinidins and A-type BLPs were first found in this study. STPs and GSPs belonging to procyanidins showed DP from 3 to 11 and 2 to 12, respectively. A-type linkages were found for every DP of STPs and GSPs, which were first found. These results showed that HILIC-QTOF-MS can be successfully applied for analyzing PACs from different plant materials, which is necessary for the prediction of their potential health benefits.

1. Introduction

Proanthocyanidins (PACs), also known as condensed tannins, are one of the most abundant dietary polyphenols, second to lignin [1]. They comprise oligomeric or polymeric flavan-3-ol monomeric subunits, resulting in their characteristic of high molecular weight [2]. Monomeric subunits linked through C4–C6 or C4–C8 bonds generate B-type PACs, and an additional linkage of C2–O7 forms A-type ones. Based on flavan-3-ol subunits, PACs are further subdivided into procyanidins, prodelphinidins and propelargonidins, with (epi)catechin (EC), (epi)gallocatechin (EGC) and (epi)afzelechin as subunits [3]. In addition, gallic acid esters of the flavan-3-ols are also found to be monomeric subunits of PACs in nature. The number of monomeric subunits dictates the degree of polymerization (DP), which varies greatly depending on the plant sources.
Numerous studies have revealed the vital role of PAC structure in their beneficial effects on health [4,5,6,7,8]. A-type PACs displayed interesting antibacterial and antiviral properties by inhibiting bacterial adhesion and virus replication [4]. As to DP, only oligomeric procyanidins including dimers, trimers and tetramers were absorbable while polymers exhibited extremely low bioavailability with no detectable PACs present in blood circulation [5,6]. In the case of prodelphinidins, only dimer was absorbable as demonstrated with Caco-2 cell permeability assays [7]. PAC with a mean DP of 9.1 regulated inflammatory cytokine responses in murine macrophages, whereas others were significantly less active [8]. In light of the structure–function relationships of PACs, it is necessary to analyze their structure to predict potential health benefits.
Reverse-phase high-performance liquid chromatography (RP-HPLC) is most commonly used to analyze PACs, but polymers with DP over four are difficult to be identified due to their high polarity and many isomers, which lead to the increase in baseline [9]. Normal-phase HPLC (NP-HPLC) was able to separate polymeric PACs based on the DP [10,11]. However, it uses solvents with low polarity such as hexane and hexamethylene as mobile phases, which have low intermolecular dispersion, resulting in difficult ionization. Recently, hydrophilic interaction chromatography (HILIC), retaining analytes by partitioning between the water layer on the hydrophilic stationary phase and the polar eluent, has attracted increasing attention [12]. HILIC coupled with a fluorescence detector has been established to separate PACs with EC as exclusive subunits based on their DP [13]. However, the HILIC method is not feasible to analyze PACs containing monomeric subunits except EC. In addition, the fluorescence detector limits the popularization of the HILIC method.
Hence, the objective of this study is to establish a widely used method to analyze PACs from different plant materials using HILIC-QTOF-MS, which is appropriate for batch analysis. This method was successfully applied to separate and characterize PACs from Chinese bayberry (Myrica rubra Sieb. et Zucc.) leaves (BLPs), sorghum testa (STPs) and grape seeds (GSPs).

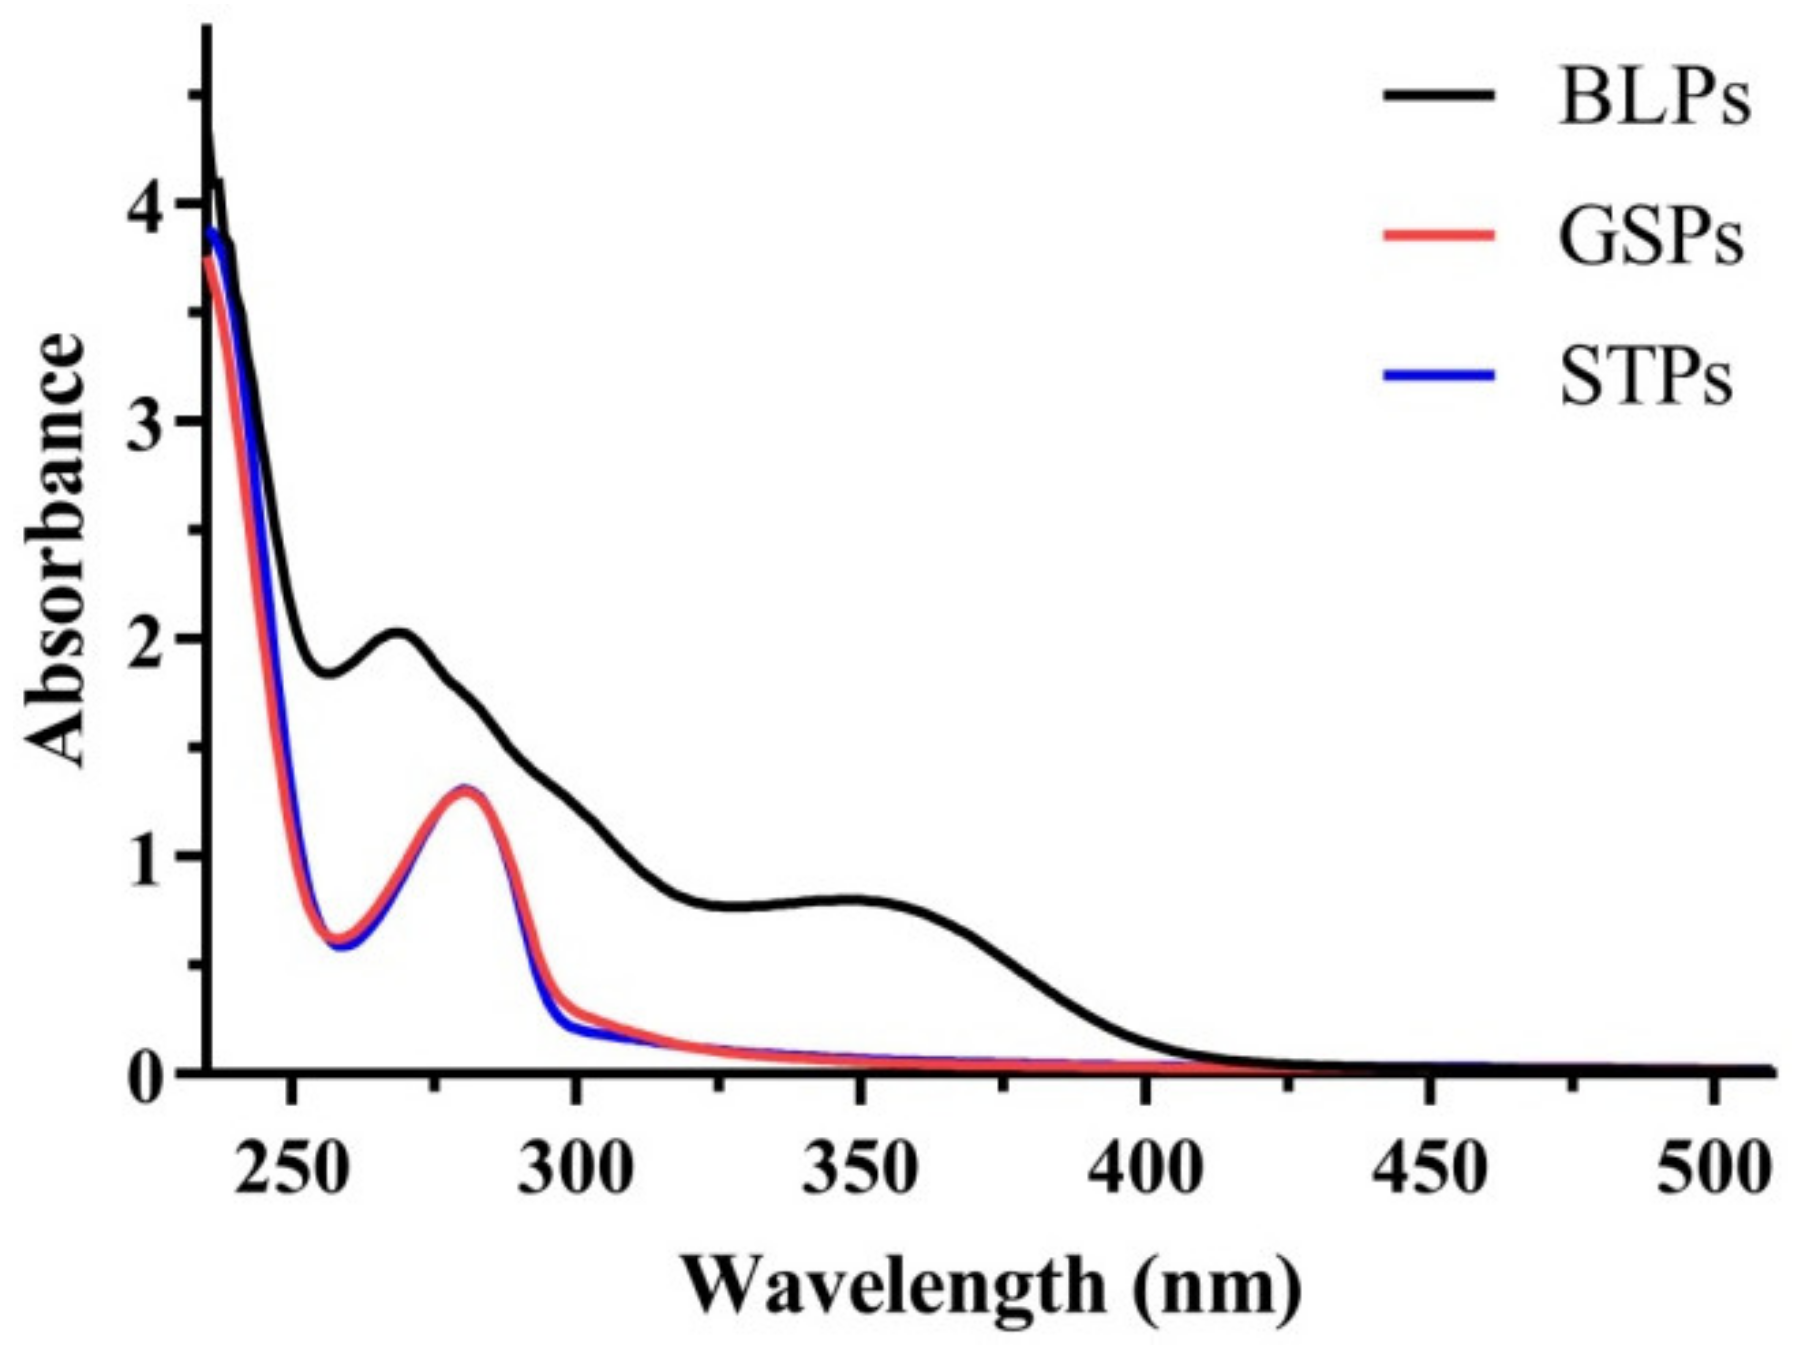
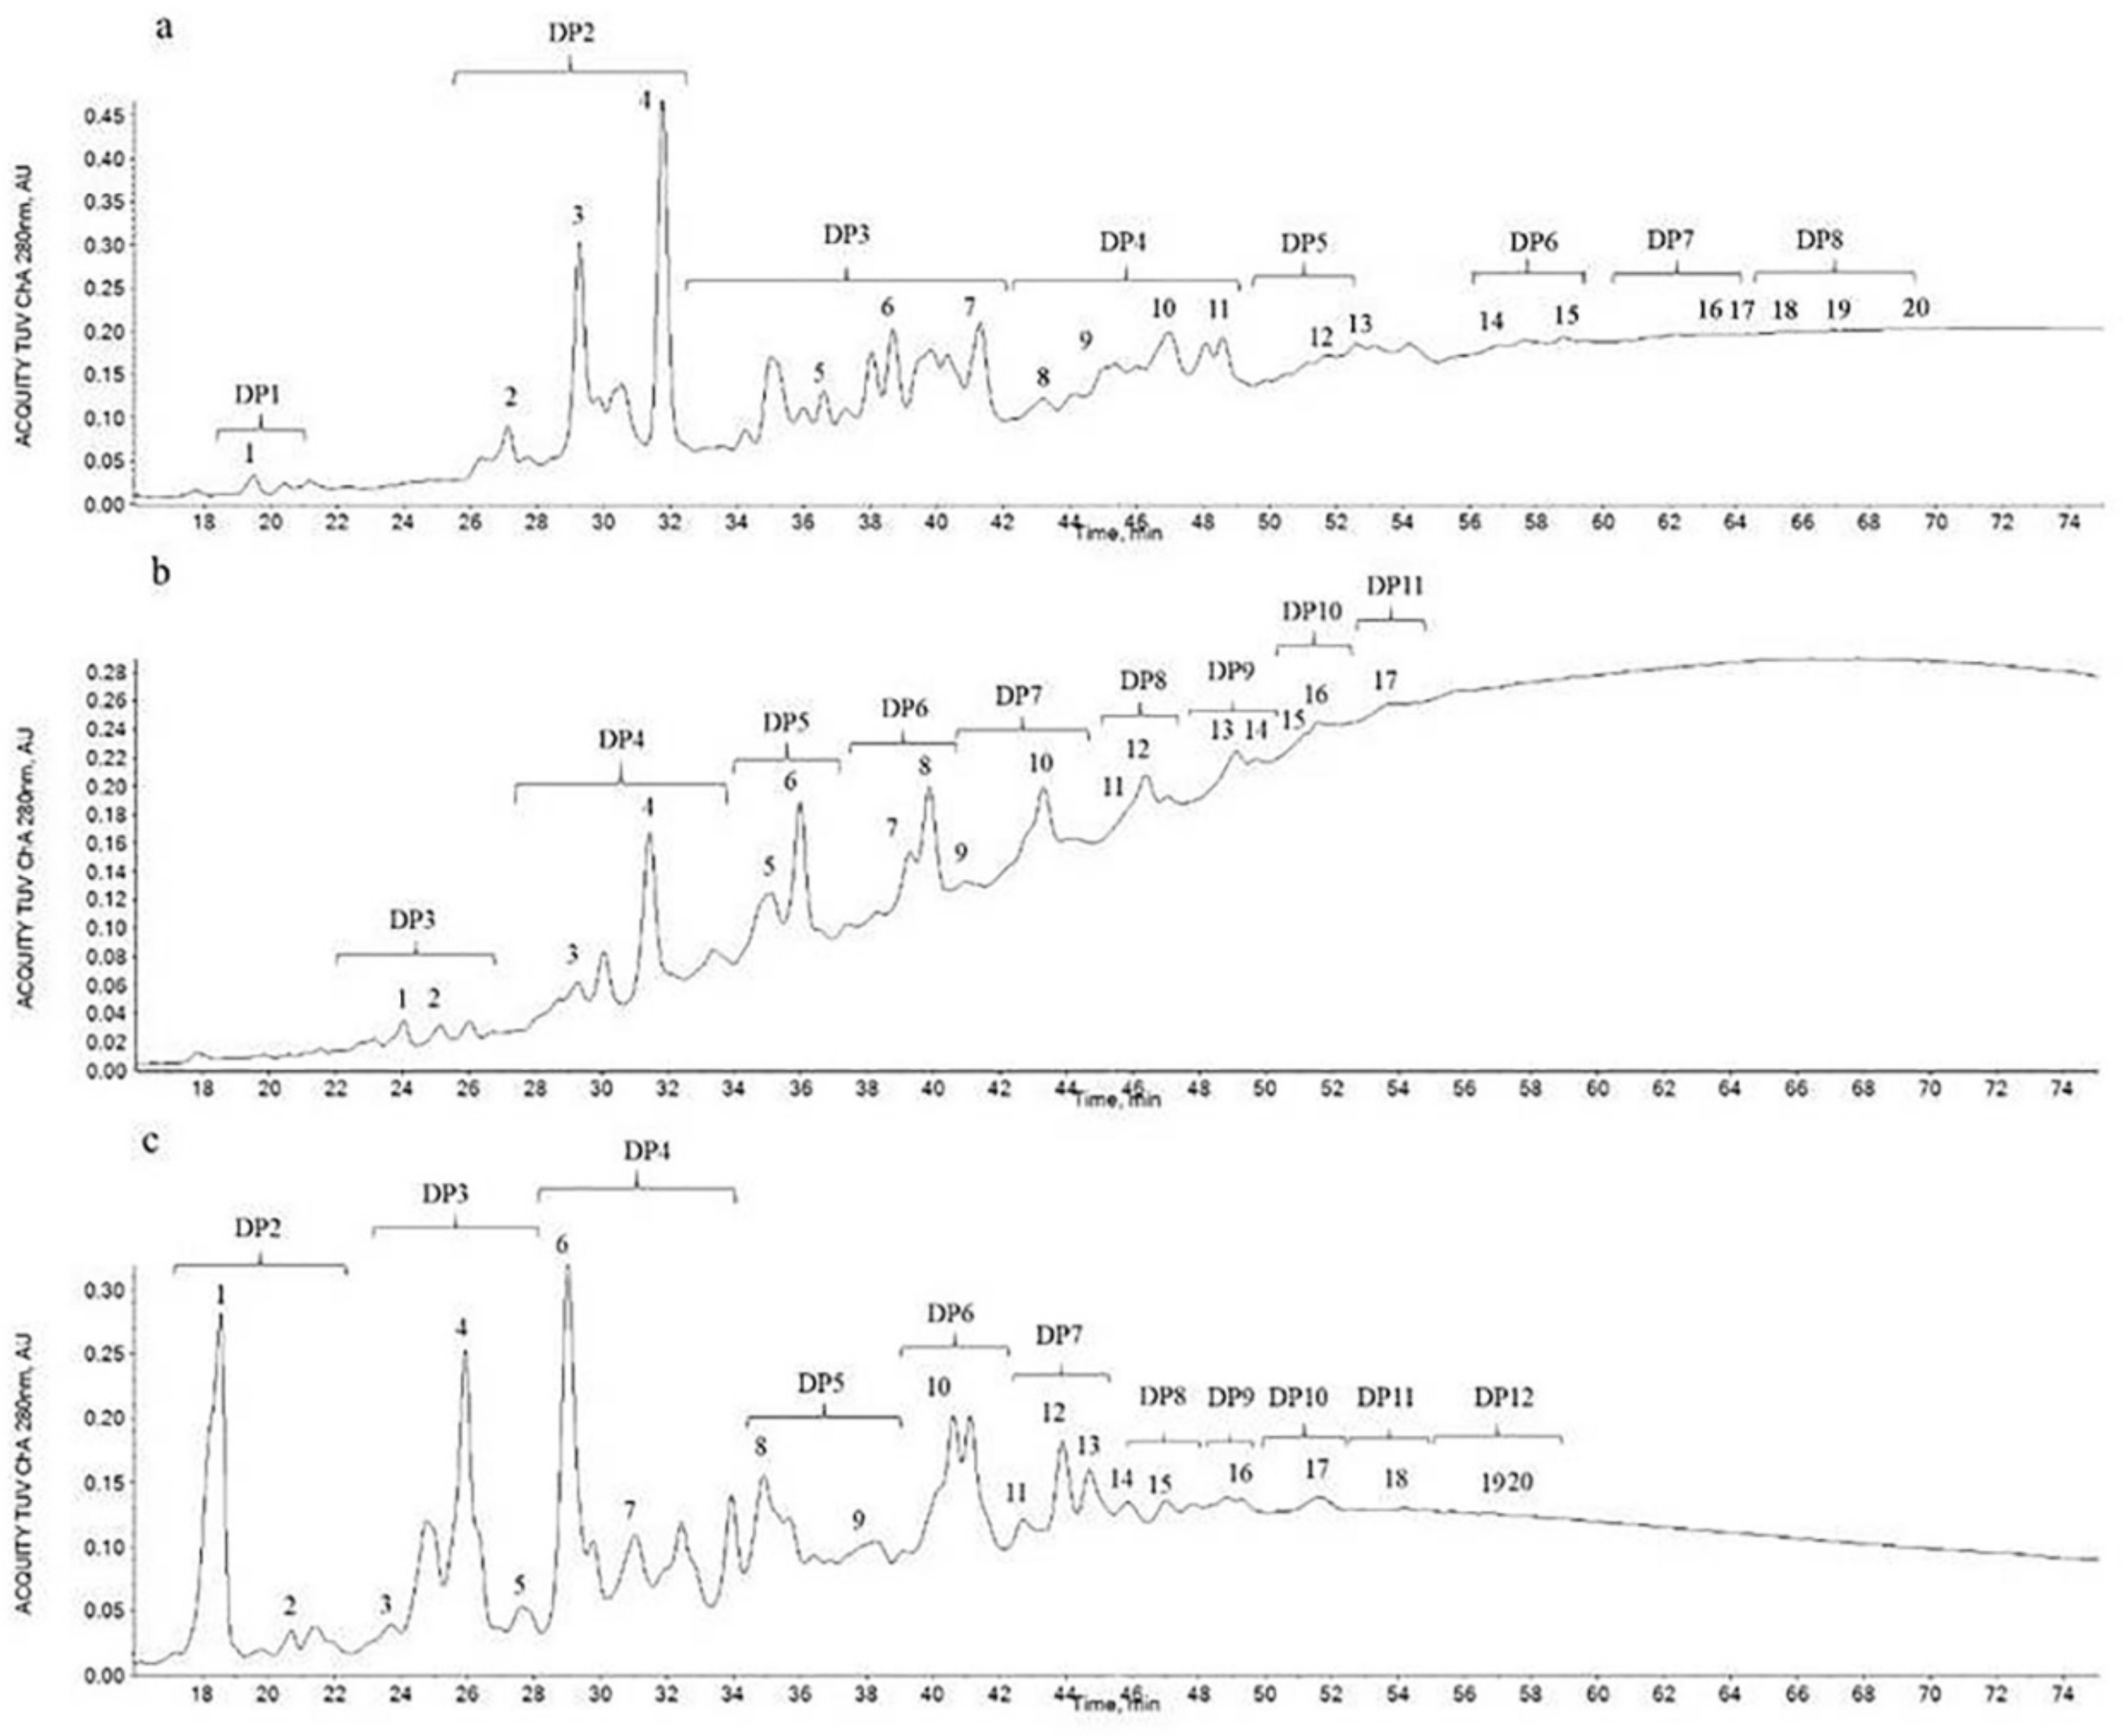
2. Results and Discussion

To reveal the differences in BLPs, GSPs and STPs in molecular structure, UV/Visible spectrum analysis was first carried out. As shown in Figure 1, the UV/Visible spectra of BLPs, GSPs and STPs exhibited a maximum absorption wavelength of 268, 280 and 280 nm, which were in agreement with the main absorption maxima of natural phenolic compounds [14,15]. In addition, a shoulder peak at 328 nm appeared in the UV/Visible spectrum of BLPs, while the peak did not exist in GSPs and STPs. The results of UV/Visible spectrum analysis indicated that GSPs and STPs had the same subunits, which were different from BLPs.
To verify the speculation, HILIC-QTOF-MS/MS was performed to analyze the detailed structures of BLPs, GSPs and STPs. Identification of the PACs depends on analyzing the MS data of the peaks separated by HILIC. The molecular weight of PACs is determined by flavan-3-ol subunits, linkage type and DP. The molecular weight of the flavan-3-ols is definite. Each A-type linkage leads to the loss of four hydrogen atoms, while B-type linkage results in the loss of two hydrogen atoms. In addition, the type of flavan-3-ol subunits is limited, as less than four types of flavan-3-ols usually appear in PACs from individual plant material. According to the description above, identification of the PACs with MS data becomes possible. MS/MS data were used to verify the results of MS data. The MS main ions generated MS/MS product ions with several fragmentation routes, including quinone methide (QM) cleavage, retro-Diels–Alder (RDA) cleavage, heterocyclic ring fission (HRF), gallate loss (GL) and benzofuran formation (BFF) [16,17,18]. In addition, GL combined with GL, HRF, BFF or RDA cleavage generated a series of product ions [19].
The HILIC chromatogram was given in Figure 2. HILIC indeed was able to separate PACs based on their DP, but resolution of the peaks varied with the distribution of their DP and isomers. The baseline had an upward drift along with the retention time, which resulted from the low resolution of PACs with high DPs (Rue et al., 2018) [12]. The detailed MS information of HILIC peaks is shown in Table 1, Table 2 and Table 3. BLPs showed the DP from 2 to 8, STPs showed the DP from 3 to 11 and GSPs showed the DP from 2 to 12. Various isomers of each DP were identified.
As shown in Table 1, BLPs are mainly B-type prodelphinidins with (epi)gallocatechin gallate ((E)GCG) as dominant subunits and (E)GC as minor subunits, which was consistent with the results of our previous article [20]. However, only dimers, trimers and tetramers were identified in the reported article. In the present study, BLPs with higher DP from 5 to 8 corresponding to the peaks from 12 to 20 were first identified. Peaks 12 and 13 were tentatively identified as a B-type pentamer. Peak 12 consisting of two (E)GC units and three (E)GCG units produced fragment ions at m/z 760.1393, 1217.2235 and 1522.2688 by QM fragmentation, while ion at m/z 423.0715 was obtained by RDA fragmentation. Peak 13 consisting of one (E)GC unit, and four (E)GCG units produced a similar fragmentation pattern in the MS/MS spectrum. Peaks 14 and 15 were all presumed as B-type hexamer, the former consisting of two (E)GC units, and four (E)GCG units produced a double charged pseudomolecular ion [M-2H]2− at m/z 1216.1920, the latter consisting of six (E)GCG units produced a double charged pseudomolecular ion [M-2H]2− at m/z 1368.1997. Peaks 16 and 17 were assigned as B-type heptamer with one (E)GC unit and six (E)GCG units, and seven (E)GCG units, respectively. Peaks 18, 19 and 20 were all presumed as octamers with two (E)GC units and six (E)GCG units, one (E)GC unit and seven (E)GCG units, and eight (E)GCG units, respectively. In addition, A-type BLPs including a dimer (peak 2) and a tetramer (peak 8) were found in the present study, which was not reported before. The A-type dimer consisted of one (E)GC unit and one (E)GCG unit. The A-type tetramer comprised two (E)GC units and two (E)GCG units, which seemed to have resulted from the loss of two hydrogens of peak 9.
The composition of STPs and GSPs, which was determined by their retention time, pseudomolecular ion [M-H] and MS/MS information, was given in Table 2 and Table 3. STPs and GSPs were procyanidins with (E)C as only subunits. STPs with the DP from 3 to 11 and GSPs with the DP from 2 to 12 were isolated. STPs were found to contain A-type linkages in this study. Interestingly, GSPs contained many A-type linkages, which is not consistent with previous studies [20]. The reason for it is not clear, and it may be due to the variety of samples.
In the HILIC chromatogram of STPs, Peaks 1 and 2, identified as trimers, produced fragment ions at m/z 407.0767 and 411.0726 by RDA fragmentation and successive loss of water molecules, whereas ion at m/z 289.0709 was obtained by QM fragmentation. In addition, the loss of 2 Da in peak 1 is due to the additional C-O-C linkage. Peak 4 was assigned as a B-type tetramer. It produced fragment ions at m/z 865.2100, 575.1238 and 287.0553 by QM fragmentation and successive loss of water molecules, whereas ion at m/z 739.1748 was obtained by HRF, and ion at m/z 407.0780 was obtained by RDA fragmentation and successive loss of water molecules. Peak 3, with a similar MS/MS pattern, was tentatively identified as an A-type tetramer. Peaks 5 and 6 were tentatively identified as a pentamer, and peak 5 contains one A-type linkage. The produced fragment ion at m/z 407.0780 was obtained by RDA fragmentation and successive loss of water molecules, whereas ion at m/z 289.0703 was obtained by QM fragmentation. Peaks 7 and 8 were tentatively identified as a hexamer, and peak 7 contains one A-type linkage. Peak 10, producing fragment ions at m/z 863.1896, 575.1197 and 287.0539 by QM fragmentation, was identified as a B-type heptamer. Peak 9, with a similar MS/MS pattern, was tentatively identified as an A-type heptamer. Peak 11 was assigned as a B-type octamer. It produced fragment ions at m/z 1728.3798, 1440.3280, 1152.2677 and 865.2083 by QM fragmentation, whereas ion at m/z 693.1234 was obtained by RDA fragmentation and successive loss of water molecules. Peak 12, with a similar MS/MS pattern, was tentatively identified as an A-type octamer. Peaks 13 to 17 were detected as polymers with the DP from 9 to 11. Among them, Peaks 14 and 15 contain one A-type linkage. In addition, to our knowledge, this is the first report identifying STPs with a DP of 11, even though the STPs with high DP were well-known.
The composition of GSPs is similar to that of STPs, but GSPs have more A-type linkages. In the HILIC chromatogram of GSPs, Peak 3 was tentatively identified as a trimer containing two A-type linkages. It produced fragment ions at m/z 285.0398 and 571.0902 by QM fragmentation. Peaks 6, 8, 10, 13, 15 and 16, with a similar MS/MS pattern, were tentatively identified as tetramer to nonamer with two A-type linkages. Peak 12 was tentatively assigned to a heptamer with three A-type linkages. It produced fragment ions at m/z 285.0426 and 575.1219 by QM fragmentation, whereas ion at m/z 411.0749 was obtained by HRF. Peaks 14, 17, 18 and 20, with a similar MS/MS pattern, were tentatively identified as polymers with a DP of 8, 10, 11 and 12 containing three A-type linkages. Peak 19 was tentatively assigned to a dodecamer with four A-type linkages. It produced double-charged pseudomolecular ions [M-2H]2− at m/z 1724.3341.
The obtained structure information of PACs could help to predict their functional characteristics, such as bioavailability and physiological effects. As to BLPs, the small proportion of dimers in BLPs indicated their low bioavailability. In the case of procyanidins, GSPs have more oligomers than STPs, suggesting higher bioavailability of GSPs than STPs. It is worth noticing that the large number of A-type linkages in STPs endows their unique physiological effects.
BLPs, GSPs and STPs, polymers with high polarity and have many isomers, are difficult to be identified by traditional RP-HPLC, due to the increase in baseline when analyzing compounds with a DP more than four. The traditional NP-HPLC is rarely used to separate proanthocyanidins, because of their low solubility in organic solvents, strong silica gel adsorption and difficult ionization. Emerging HILIC is popular for separation of proanthocyanidins, but it is not feasible to analyze proanthocyanidins containing monomeric subunits, except for epicatechin, and fluorescence detector limits its popularization. Overall, the HILIC-QTOF-MS method established in the present study is a widely used method to analyze PACs from different plant materials, which is helpful for the in-depth study of their structure–function relationships.

3. Materials and Methods

3.1. Materials and Reagents

Chinese bayberry leaves of ‘Biqi’ cultivar were hand-harvested randomly in June, 2020 in Cixi (Zhejiang, China). Sorghums of ‘Hongzhenzhu’ cultivar were provided by Shandong Academy of Agricultural Science (Jinan, China). GSPs (95%) were purchased from Shanghai Yuanye Biotechnology Co., Ltd. (Shanghai, China). Acetonitrile and methanol of HPLC grade were purchased from Merck KgaA (Darmstadt, Germany). Acetic acid of HPLC grade was purchased from Aladdin Biochemical Technology Co., Ltd. (Shanghai, China). Other chemical reagents of analytical grade were purchased from Sinopharm Chemical Reagent Co., Ltd. (Shanghai, China).

3.2. Extraction and Purification of PACs

Extraction and purification of BLPs and STPs were carried out according to our previous studies [20]. In brief, Chinese bayberry leaves were dried at 40 °C for 12 h and then ground well into a powder by milling. Powder of sorghum testa was prepared by a rice polisher (SATAKE Manufacturing Co., Ltd., Suzhou, China) and then passed through a 500 μm sieve. Obtained powders (50 g) were extracted with 70% aqueous acetone containing 0.1% (w/v) ascorbic acid (500 mL) at room temperature for 12 h. The extract solution was recovered and washed with hexane and dichloromethane. Then, organic solvent was evaporated by rotary evaporation and residual aqueous phase was freeze-dried to crude extract of PACs, which was then purified by the HPD-500 resin to remove proteins and polysaccharides with water as an elution solvent. PACs were then eluted with 80% ethanol and dried by rotary-evaporated under vacuum to remove organic solvent and lyophilized to a brown powder. PACs were further purified with a Sephadex LH-20 column (300 mm × 30 mm i.d.). The column was equilibrated with a methanol/water solution (1:1, v/v) containing 0.1% v/v trifluoroacetic acid. The brown powder (2.0 g) was dissolved in the mobile phase and loaded onto the column. The column was first eluted with 3 column volumes of the mobile phase to remove free flavan-3-ols. PACs were then eluted with 3 column volumes of an acetone/water solution (2:1 v/v) containing 0.1% v/v trifluoroacetic acid and the eluent of PACs was collected. The eluent was concentrated under reduced pressure at 40 °C to remove methanol and acetone and then lyophilized to dry powder.

3.3. UV–Vis Spectroscopic Measurement

UV–Vis spectra of BLPs, GSPs and STPs were recorded at room temperature over the wavelength range of 200 to 800 nm using a UV–vis spectrometer (UV-2600, Shimadzu Co., Kyoto, Japan). The methanol was used as a background.

3.4. HPLC-QTOF-MS Analysis

Chromatographic separation of PACs was performed with a X5H HILIC column (250 mm × 4.6 mm, 5.0 μm, Acchrom Technologies, Taizhou, China). PACs were dissolved in methanol and then filtered through 0.45 μm membrane filter for HPLC analysis (Waters, Milford, CT, USA). The binary mobile phase consisted of (A) acetic acid/acetonitrile (0.1/99.9, v/v) and (B) acetic acid/water/methanol (0.1/3/96.9, v/v/v). The flow rate was 0.5 mL/min and the gradient conditions were as follows: 0–3 min, 7% linear; 3–15 min, 7–23% linear; 15–70 min, 23–65% linear; 70–85 min, 65–100% linear; 85–87 min, 100–7% linear; 87–102 min, 7% linear. Eluting peaks were monitored at 280 nm. The column temperature was kept at 28 °C.
MS ionization was operated in negative mode on Triple TOF 5600plus System (AB SCIEX, Framingham, MA, USA) using the following conditions: scan range, m/z 100–2000; source voltage, −4.5 kV; and source temperature, 550 °C. The pressure of ion source gas 1 (Air), ion source gas 2 (Air) and curtain gas (N2) were set at 50 psi, 50 psi and 30 psi, respectively. Injection volume was set at 10 μL. Flow rate was set at 0.2 mL/min. Maximum allowed error was set at ±5 ppm. Declustering potential was set at 100 V. Collision energy was set at 10 V. For MS/MS acquisition mode, the IDA-based auto-MS/MS was performed on the 8 most intense metabolite ions, the parameters were almost the same except that the collision energy was set at −40 ± 20 V, ion release delay at 67 and ion release width at 25 in a cycle of full scan (1 s). The scan range of m/z of precursor ion and product ion was set at 100–2000 Da and 50–1500 Da, respectively.

4. Conclusions

The structure of PACs from different sources is significantly different, which brings difficulties to their structure–activity study. A novel and a general method were exhibited in this study to analyze PACs from different sources using HILIC-QTOF-MS, which is more efficient than other conventional methods, especially for polymers. It was found that BLPs are mainly B-type prodelphinidins with (E)GCG as dominant subunits and (E)GC as minor subunits. BLPs with DP from 1 to 8 were separated effectively and few A-type linkages were found. STPs are procyanidins with (E)C as exclusive subunits. STPs with DP from 3 to 11 could be separated and almost each DP contains one A-type linkage. GSPs are also procyanidins with DP from 2 to 12 and every DP contains A-type linkages with the most up to four. Hence, the HILIC-QTOF-MS method established in this study can be applied to analyze large numbers of PACs from different sources, which is necessary for prediction of their potential health benefits.

Author Contributions

Investigation, data curation and formal analysis, Z.Q.; investigation, data curation and writing—original draft, Y.W.; data validation and formal analysis, S.S., W.T. and Y.Z.; conceptualization, methodology, funding acquisition and writing—review and editing, H.P.; supervision, writing—review and editing and funding acquisition, X.Y. and S.C. All authors have read and agreed to the published version of the manuscript.

Funding

This work was financially supported by Zhejiang Provincial Key R&D Programme (Grant No. 2019C02032) and National Natural Science Foundation of China (Grant No. 31972088 and 32001715).

Institutional Review Board Statement

Not applicable.

Informed Consent Statement

Not applicable.

Data Availability Statement

Not applicable.

Acknowledgments

This work was supported by Zhejiang Provincial Key R&D Programme and National Natural Science Foundation of China.

Conflicts of Interest

The authors declare no conflict of interest.

Sample Availability

Samples of the compounds are available from the authors.

References

  1. Scalbert, A.; Williamson, G. Dietary intake and bioavailability of polyphenols. J. Nutr. 2000, 130, 2073S–2085S. [Google Scholar] [CrossRef] [PubMed]
  2. Cires, M.J.; Wong, X.; Carrasco-Pozo, C.; Gotteland, M. The gastrointestinal tract as a key target organ for the health-promoting effects of dietary proanthocyanidins. Front. Nutr. 2017, 3, 57. [Google Scholar] [CrossRef] [PubMed] [Green Version]
  3. Kalili, K.M.; de Villiers, A. Off-line comprehensive 2-dimensional hydrophilic interaction × reversed phase liquid chromatography analysis of procyanidins. J. Chromatogr. A 2009, 1216, 6274–6284. [Google Scholar] [CrossRef] [PubMed]
  4. Alejo-Armijo, A.; Salido, S.; Altarejos, J.N. Synthesis of A-type proanthocyanidins and their analogues: A comprehensive review. J. Agric. Food Chem. 2020, 68, 8104–8118. [Google Scholar] [CrossRef] [PubMed]
  5. Shoji, T.; Masumoto, S.; Moriichi, N.; Akiyama, H.; Kanda, T.; Ohtake, Y.; Goda, Y. Apple Procyanidin Oligomers Absorption in Rats after Oral Administration:  Analysis of procyanidins in plasma using the porter method and high-performance liquid chromatography/tandem mass spectrometry. J. Agric. Food Chem. 2006, 54, 884–892. [Google Scholar] [CrossRef] [PubMed]
  6. Tsang, C.; Auger, C.; Mullen, W.; Bornet, A.; Rouanet, J.-M.; Crozier, A.; Teissedre, P.-L. The absorption, metabolism and excretion of flavan-3-ols and procyanidins following the ingestion of a grape seed extract by rats. Br. J. Nutr. 2005, 94, 170–181. [Google Scholar] [CrossRef] [PubMed]
  7. Tao, W.; Wei, C.; Shen, S.; Wang, M.; Chen, S.; Ye, X.; Cao, Y. Mainly dimers and trimers of Chinese bayberry leaves proanthocyanidins (BLPs) are utilized by gut microbiota: In vitro digestion and fermentation coupled with caco-2 transportation. Molecules 2020, 25, 184. [Google Scholar] [CrossRef] [PubMed] [Green Version]
  8. Andersen-Civil, A.I.S.; Leppä, M.M.; Thamsborg, S.M.; Salminen, J.-P.; Williams, A.R. Structure-function analysis of purified proanthocyanidins reveals a role for polymer size in suppressing inflammatory responses. Commun. Biol. 2021, 4, 896. [Google Scholar] [CrossRef] [PubMed]
  9. Kennedy, J.A.; Jones, G.P. Analysis of proanthocyanidin cleavage products following acid-catalysis in the presence of excess phloroglucinol. J. Agric. Food Chem. 2001, 49, 1740–1746. [Google Scholar] [CrossRef] [PubMed]
  10. Awika, J.M.; Dykes, L.; Gu, L.W.; Rooney, L.W.; Prior, R.L. Processing of sorghum (Sorghum bicolor) and sorghum products alters procyanidin oligomer and polymer distribution and content. J. Agric. Food Chem. 2003, 51, 5516–5521. [Google Scholar] [CrossRef] [PubMed]
  11. Verardo, V.; Cevoli, C.; Pasini, F.; Gomez-Caravaca, A.M.; Marconi, E.; Fabbri, A.; Caboni, M.F. Analysis of oligomer proanthocyanidins in different barley genotypes using high-performance liquid chromatography-fluorescence detection-mass spectrometry and near-infrared methodologies. J. Agric. Food Chem. 2015, 63, 4130–4137. [Google Scholar] [CrossRef] [PubMed]
  12. Rue, E.A.; Rush, M.D.; van Breemen, R.B. Procyanidins: A comprehensive review encompassing structure elucidation via mass spectrometry. Phytochem. Rev. 2018, 17, 1–16. [Google Scholar] [CrossRef] [PubMed]
  13. Hollands, W.J.; Voorspoels, S.; Jacobs, G.; Aaby, K.; Meisland, A.; Garcia-Villalba, R.; Tomas-Barberan, F.; Piskula, M.K.; Mawson, D.; Vovk, I.; et al. Development, validation and evaluation of an analytical method for the determination of monomeric and oligomeric procyanidins in apple extracts. J. Chromatogr. A 2017, 1495, 46–56. [Google Scholar] [CrossRef] [PubMed]
  14. Anouar, E.H.; Gierschner, J.; Duroux, J.-L.; Trouillas, P. UV/Visible spectra of natural polyphenols: A time-dependent density functional theory study. Food Chem. 2012, 131, 79–89. [Google Scholar] [CrossRef]
  15. Wang, D.Y.; Nie, B.L.; Li, H.J.; Zhang, W.W.; Wu, Y.C. Anticorrosion performance of grape seed proanthocyanidins extract and Tween-80 for mild steel in hydrochloric acid medium. J. Mol. Liq. 2021, 331, 115799. [Google Scholar] [CrossRef]
  16. Liu, H.; Zou, T.; Gao, J.-M.; Gu, L. Depolymerization of cranberry procyanidins using (+)-catechin, (−)-epicatechin, and (−)-epigallocatechin gallate as chain breakers. Food Chem. 2013, 141, 488–494. [Google Scholar] [CrossRef] [PubMed]
  17. Gu, L.; Kelm, M.A.; Hammerstone, J.F.; Zhang, Z.; Beecher, G.; Holden, J.; Haytowitz, D.; Prior, R.L. Liquid chromatographic/electrospray ionization mass spectrometric studies of proanthocyanidins in foods. J. Mass Spectrom. 2003, 38, 1272–1280. [Google Scholar] [CrossRef] [PubMed]
  18. Singh, A.; Kumar, S.; Kumar, B. LC-MS identification of proanthocyanidins in bark and fruit of six Terminalia species. Nat. Prod. Commun. 2018, 13, 555–560. [Google Scholar] [CrossRef] [Green Version]
  19. Pan, H.; Wang, Y.; Xu, X.; Qian, Z.; Cheng, H.; Ye, X.; Chen, S. Simultaneous extraction and depolymerization of condensed tannins from Chinese bayberry leaves for improved bioavailability and antioxidant activity. J. Agric. Food Chem. 2021, 69, 11292–11302. [Google Scholar] [CrossRef] [PubMed]
  20. Fu, Y.; Qiao, L.; Cao, Y.; Zhou, X.; Liu, Y.; Ye, X. Structural elucidation and antioxidant activities of proanthocyanidins from Chinese bayberry (Myrica rubra Sieb. et Zucc.) leaves. PLoS ONE 2014, 9, e96162. [Google Scholar] [CrossRef] [PubMed] [Green Version]
Figure 1. UV–Vis spectra of Chinese bayberry (Myrica rubra Sieb. et Zucc.) leaves (BLPs), sorghum testa (STPs) and grape seeds (GSPs).
Molecules 27 02684 g001
Figure 2. Chromatographic separation of BLPs (a), STPs (b) and GSPs (c), according to the DP.
Molecules 27 02684 g002
Table 1. Main prodelphinidins identified from Chinese bayberry leaves using HILIC-QTOF-MS.
PeakDPRetention Time (min)Molecular
Formula
NA[M-H][M-2H]2−[MS/MS]Error
(ppm)
Identification
1119.561C22H18O11-457.0776-125.0249HRF, 169.0143(gallic acid)0.7(E)GCG
2227.206C37H28O181759.1228-177.0204HRF, 301.0366QM, 455.0648RDA0.4(E)GC + (E)GCG
3229.275C37H30O18-761.1362-125.0249HRF, 177.0195HRF, 305.0671QM, 423.0730RDA−0.3(E)GC + (E)GCG
4231.659C44H34O22-913.1470-177.0194HRF, 285.0404QM, 423.0726RDA, 591.1177(GL, galloyl loss)0.92(E)GCG
5336.757C52H42O25-1065.1929-177.0198HRF; 243.0298; 423.0740RDA−12(E)GC + (E)GCG
6339.413C59H46O29-1217.2025-423.0742RDA, 709.1262(RDA, galloyl loss), 1047.1941(galloyl loss)−2.3(E)GC + 2(E)GCG
7341.382C66H50O33-1369.2128684.1023125.0266HRF, 169.0156(gallic acid), 285.0411QM, 423.073RDA−1.43(E)GCG
8444.517C74H56O3611519.2421759.1204-−2.22(E)GC + 2(E)GCG
9444.998C74H58O36-1521.2564760.1275125.0266HRF, 169.0157(gallic acid), 177.0211HRF, 243.0307−3.52(E)GC + 2(E)GCG
10447.107C81H62O40-1673.2664836.1304125.0272HRF, 169.0162(gallic acid), 177.0214HRF, 319.0479−2.9(E)GC + 3(E)GCG
11448.637C88H66O44-1825.2773912.1391169.0159(gallic acid), 177.0229HRF, 285.0426QM, 319.04960.54(E)GCG
12551.776C96H74O47-1977.3243988.1548169.0156(gallic acid), 177.0207HRF, 243.0312; 319.0461; 423.0715RDA, 760.1393QM, 1217.2235QM, 1522.2688QM−1.62(E)GC + 3(E)GCG
13552.447C103H78O51--1064.1583169.0160(gallic acid), 303.0535, 423.0767RDA, 762.1430QM, 1066.2029(two GL), 1370.2245QM−0.8(E)GC + 4(E)GCG
14657.218C118H90O58--1216.1920-−2.12(E)GC + 4(E)GCG
15659.001C132H98O66--1368.1997-−0.66(E)GCG
16763.259C147H110O73--1520.2345-0.5(E)GC + 6(E)GCG
17764.176C154H114O77--1596.2549-0.47(E)GCG
18866.286C162H120O80--1671.2474-−1.22(E)GC + 6(E)GCG
19867.333C169H125O84--1748.7661-−3.1(E)GC + 7(E)GCG
20869.309C176H130O88--1824.2760-2.48(E)GCG
NA, number of A-type linkage; (epi)gallocatechin ((E)GC); (epi)gallocatechin gallate ((E)GCG).
Table 2. Main procyanidins identified from sorghum testae using HILIC-QTOF-MS.
PeakDPRetention Time (min)Molecular
Formula
NA[M-H][M-2H]2−[MS/MS]Error (ppm)Identification
1323.9703C45H36O181863.1870-289.0709QM, 411.0726(RDA, H2O loss)4.33(E)C
2325.0561C45H38O18-865.2014-289.0698QM, 407.0767(RDA, H2O loss)3.33(E)C
3429.1185C60H48O2411151.2478-287.0547QM, 407.0774(RDA, H2O loss), 575.1241QM, 861.1795QM2.44(E)C
4431.4384C60H50O24-1153.2632-287.0553QM, 407.0780(RDA, H2O loss), 575.1238QM, 739.1748HRF, 865.2100QM−0.14(E)C
5534.8734C75H60O3011439.3088719.1500289.0703QM, 407.0769(RDA, H2O loss), 529.0789RDA−0.85(E)C
6535.9701C75H62O30-1441.3215720.1579289.0693QM, 407.0757(RDA, H2O loss)−1.45(E)C
7639.2811C90H72O3611728.3641863.1802289.0700QM, 411.0707(RDA, H2O loss)−1.36(E)C
8639.8536C90H74O36-1729.3784864.1872289.0696QM, 407.0755(RDA, H2O loss)−3.86(E)C
9741.0480C105H84O421-1007.2108285.0382QM, 449.0887HRF, 575.1190QM−2.17(E)C
10743.2758C105H86O42--1008.2181287.0539QM, 407.0757(RDA, H2O loss), 575.1197QM, 863.1896QM−3.77(E)C
11846.2532C120H98O48--1152.2455287.0540QM, 407.0749(RDA, H2O loss), 449.0863HRF, 575.1198QM, 693.1234(RDA, H2O loss), 865.2083QM, 1152.2677QM, 1440.3280QM, 1728.3798QM−4.78(E)C
12847.1237C120H96O481-1151.2415287.0534QM, 407.0742(RDA, H2O loss), 575.1182QM, 693.1235(RDA, H2O loss), 861.1725QM, 1439.3156QM, 1726.3827QM−5.38(E)C
13948.9865C135H110O54--1296.2752-−5.89(E)C
14949.7734C135H108O541-1295.2678-−6.39(E)C
151051.1335C150H120O601-1439.2981-−5.410(E)C
161051.5021C150H122O60--1440.3040-−7.710(E)C
171153.4928C165H134O66--1584.3329-−5.411(E)C
NA, number of A-type linkage; (epi)catechin ((E)C).
Table 3. Main procyanidins identified from grape seeds using HILIC-QTOF-MS.
PeakDPRetention Time (min)Molecular
Formula
NA[M-H][M-2H]2−[MS/MS]Error (ppm)Identification
1218.4672C30H24O121575.1180-285.0392QM, 407.0702(RDA, H2O loss)−22(E)C
2220.7521C30H26O12-577.1339-289.0711 QM, 407.0792(RDA, H2O loss)−1.92(E)C
3323.5959C45H34O182861.1660-285.0398QM, 571.0902QM−1.53(E)C
4325.9204C45H36O181863.1807-285.0402QM, 407.0742(RDA, H2O loss), 449.0807HRF−1.93(E)C
5327.7716C45H38O18-865.1951-289.0721QM, 407.0702(RDA, H2O loss)−3.23(E)C
6429.0211C60H46O2421149.2240-285.0409QM, 411.0733HRF, 575.1215QM, 979.1813(RDA, H2O loss)−4.54(E)C
7431.1407C60H48O2411151.2387-287.0576QM, 449.0890HRF, 575.1214QM, 693.1288(RDA, H2O loss), 863.1882QM, 981.1936(RDA, H2O loss)−6.14(E)C
8534.8175C75H58O3021437.2789718.1421285.0425QM, 411.0735HRF, 575.1183QM−1.65(E)C
9538.3058C75H60O3011439.2956719.1503285.0422QM, 407.0812(RDA, H2O loss)−1.35(E)C
10640.6233C90H70O3621725.3401861.1636285.0438QM, 411.0754HRF, 575.1231QM−5.96(E)C
11642.6287C90H72O3611727.3537863.1782 −5.86(E)C
12743.9009C105H80O423-1005.6966285.0426QM, 411.0749HRF, 575.1219QM−3.37(E)C
13744.7250C105H82O422-1006.2002285.0436QM, 411.0745HRF, 575.1225QM−4.57(E)C
14845.8513C120H92O483-1149.2220287.0584QM, 411.0737HRF, 575.1229QM, 863.1879QM, 1151.2521QM−6.28(E)C
15846.9126C120H94O482-1150.2270287.0580QM, 411.0745HRF, 575.1212QM, 863.1855QM, 1151.2475QM−7.98(E)C
16948.8524C135H106O542-1294.2588-−8.89(E)C
171051.6613C150H116O603-1437.2806-−9.310(E)C
181154.2179C165H128O663-1581.3085-−9.211(E)C
191256.7175C180H138O724-1724.3341-−5.812(E)C
201257.7746C180H140O723-1725.3350-−9.112(E)C
NA, number of A-type linkage; (epi)catechin ((E)C).
Publisher’s Note: MDPI stays neutral with regard to jurisdictional claims in published maps and institutional affiliations.

