

Nitrogen-Doped Carbon Quantum Dots for Biosensing Applications: The Effect of the Thermal Treatments on Electrochemical and Optical Properties

 , ,
, , 
 ,
,  and
and
Abstract
:
1. Introduction
2. Results
2.1. Structural and Optical Characterization
2.2. Electrochemistry
3. Discussion
4. Materials and Methods
4.1. Nitrogen-Doped Carbon Quantum Dots Synthesis
4.2. Characterization Techniques
5. Conclusions
Supplementary Materials
Author Contributions
Funding
Institutional Review Board Statement
Informed Consent Statement
Data Availability Statement
Acknowledgments
Conflicts of Interest
Sample Availability
References
- Xu, X.; Ray, R.; Gu, Y.; Ploehn, H.J.; Gearheart, L.; Raker, K.; Scrivens, W.A. Electrophoretic Analysis and Purification of Fluorescent Single-Walled Carbon Nanotube Fragments. J. Am. Chem. Soc. 2004, 126, 12736–12737. [Google Scholar] [CrossRef] [PubMed]
- Yahaya Pudza, M.; Zainal Abidin, Z.; Abdul Rashid, S.; Yasin, F.M.; Noor, A.S.M.; Issa, M.A. Eco-Friendly Sustainable Fluorescent Carbon Dots for the Adsorption of Heavy Metal Ions in Aqueous Environment. Nanomaterials 2020, 10, 315. [Google Scholar] [CrossRef] [PubMed] [Green Version]
- Dorđević, L.; Arcudi, F.; Cacioppo, M.; Prato, M. A multifunctional chemical toolbox to engineer carbon dots for biomedical and energy applications. Nat. Nanotechnol. 2022, 17, 112–130. [Google Scholar] [CrossRef] [PubMed]
- Zeng, Q.; Feng, T.; Tao, S.; Zhu, S.; Yang, B. Precursor-dependent structural diversity in luminescent carbonized polymer dots (CPDs): The nomenclature. Light Sci. Appl. 2021, 10, 142. [Google Scholar] [CrossRef]
- Wang, C.; Wang, C.; Xu, P.; Li, A.; Chen, Y.; Zhuo, K. Synthesis of cellulose-derived carbon dots using acidic ionic liquid as a catalyst and its application for detection of Hg2+. J. Mater. Sci. 2016, 51, 861–867. [Google Scholar] [CrossRef]
- Gao, N.; Huang, L.; Li, T.; Song, J.; Hu, H.; Liu, Y.; Ramakrishna, S. Application of carbon dots in dye-sensitized solar cells: A review. J. Appl. Polym. Sci. 2020, 137, 48443. [Google Scholar] [CrossRef] [Green Version]
- Raja, D.; Sundaramurthy, D. Facile synthesis of fluorescent carbon quantum dots from Betel leafs (Piper betle) for Fe3+ sensing. Mater. Today Proc. 2021, 34, 488–492. [Google Scholar] [CrossRef]
- Sadrolhosseini, A.R.; Rashid, S.A.; Jamaludin, N.; Isloor, A.M. Experimental and molecular modeling of interaction of carbon quantum dots with glucose. Appl. Phys. A Mater. Sci. Process. 2019, 125, 529. [Google Scholar] [CrossRef]
- Meierhofer, F.; Dissinger, F.; Weigert, F.; Jungclaus, J.; Müller-Caspary, K.; Waldvogel, S.R.; Resch-Genger, U.; Voss, T. Citric Acid Based Carbon Dots with Amine Type Stabilizers: pH-Specific Luminescence and Quantum Yield Characteristics. J. Phys. Chem. C 2020, 124, 8894–8904. [Google Scholar] [CrossRef]
- Alam, A.M.; Park, B.Y.; Ghouri, Z.K.; Park, M.; Kim, H.Y. Synthesis of carbon quantum dots from cabbage with down- and up-conversion photoluminescence properties: Excellent imaging agent for biomedical applications. Green Chem. 2015, 17, 3791–3797. [Google Scholar] [CrossRef]
- Das, R.; Bandyopadhyay, R.; Pramanik, P. Carbon quantum dots from natural resource: A review. Mater. Today Chem. 2018, 8, 96–109. [Google Scholar] [CrossRef]
- Fernando, K.A.S.; Sahu, S.; Liu, Y.; Lewis, W.K.; Guliants, E.A.; Jafariyan, A.; Wang, P.; Bunker, C.E.; Sun, Y.P. Carbon Quantum Dots and Applications in Photocatalytic Energy Conversion. ACS Appl. Mater. Interfaces 2015, 7, 8363–8376. [Google Scholar] [CrossRef] [PubMed]
- Baptista, F.R.; Belhout, S.A.; Giordani, S.; Quinn, S.J. Recent developments in carbon nanomaterial sensors. Chem. Soc. Rev. 2015, 44, 4433–4453. [Google Scholar] [CrossRef]
- Feng, J.; Dong, H.; Yu, L.; Dong, L. The optical and electronic properties of graphene quantum dots with oxygen-containing groups: A density functional theory study. J. Mater. Chem. C 2017, 5, 5984–5993. [Google Scholar] [CrossRef]
- Gayen, B.; Palchoudhury, S.; Chowdhury, J. Carbon Dots: A Mystic Star in the World of Nanoscience. J. Nanomater. 2019, 2019, 3451307. [Google Scholar] [CrossRef] [Green Version]
- Ansari, L.; Hallaj, S.; Hallaj, T.; Amjadi, M. Doped-carbon dots: Recent advances in their biosensing, bioimaging and therapy applications. Colloids Surf. B Biointerfaces 2021, 203, 111743. [Google Scholar] [CrossRef]
- Das, P.; Ganguly, S.; Ahmed, S.-R.; Sherazee, M.; Margel, S.; Gedanken, A.; Srinivasan, S.; Reza Rajabzadeh, A. Carbon Dot Biopolymer-Based Flexible Functional Films for Antioxidant and Food Monitoring Applications. ACS Appl. Polym. Mater. 2022, 4, 9323–9340. [Google Scholar] [CrossRef]
- Bilal, S.; Sami, A.J.; Hayat, A.; Rehman, M.F. Assessment of pesticide induced inhibition of Apis mellifera (honeybee) acetylcholinesterase by means of N-doped carbon dots/BSA nanocomposite modified electrochemical biosensor. Bioelectrochemistry 2022, 144, 107999. [Google Scholar] [CrossRef]
- Zhang, X.; Wei, X.; Gu, O.; Zhang, J.; Ding, Y.; Xue, L.; Chen, M.; Wang, J.; Wu, S.; Yang, X.; et al. Cascade amplification based on PEI-functionalized metal–organic framework supported gold nanoparticles/nitrogen–doped graphene quantum dots for amperometric biosensing applications. Electrochim. Acta 2022, 405, 139803. [Google Scholar] [CrossRef]
- Das, P.; Ganguly, S.; Saha, A.; Noked, M.; Margel, S.; Gedanken, A. Carbon-Dots-Initiated Photopolymerization: An In Situ Synthetic Approach for MXene/Poly(norepinephrine)/Copper Hybrid and its Application for Mitigating Water Pollution. ACS Appl. Mater. Interfaces 2021, 13, 31038–31050. [Google Scholar] [CrossRef]
- Li, H.; Yan, X.; Kong, D.; Jin, R.; Sun, C.; Du, D.; Lin, Y.; Lu, G. Recent advances in carbon dots for bioimaging applications. Nanoscale Horiz. 2020, 5, 218–234. [Google Scholar] [CrossRef]
- Ji, C.; Zhou, Y.; Leblanc, R.M.; Peng, Z. Recent developments of carbon dots in biosensing: A review. ACS Sens. 2020, 5, 2724–2741. [Google Scholar] [CrossRef] [PubMed]
- Emran, M.Y.; Mohamed, A.; Shenashen, M.A.; Eid, A.I.; Selim, M.M.; El-Safty, S.A. Portable sensitive and selective biosensing assay of dopamine in live cells using dual phosphorus and nitrogen doped carbon urchin-like structure. Chem. Eng. J. 2022, 430, 132818. [Google Scholar] [CrossRef]
- Jia, Q.; Zhao, Z.; Liang, K.; Nan, F.; Li, Y.; Wang, J.; Ge, J.; Wang, P. Recent advances and prospects of carbon dots in cancer nanotheranostics. Mater. Chem. Front. 2020, 4, 449–471. [Google Scholar] [CrossRef]
- Perumal, V.; Hashim, U. Advances in biosensors: Principle, architecture and applications. J. Appl. Biomed. 2014, 12, 1–15. [Google Scholar] [CrossRef]
- Vercelli, B.; Donnini, R.; Ghezzi, F.; Sansonetti, A.; Giovanella, U.; La Ferla, B. Nitrogen-doped carbon quantum dots obtained hydrothermally from citric acid and urea: The role of the specific nitrogen centers in their electrochemical and optical responses. Electrochim. Acta 2021, 387, 138557. [Google Scholar] [CrossRef]
- Gan, Z.; Hao, Y.; Shan, Y. Temperature-Dependent Dual Emission from Sucrose-Derived Carbon Nanodots: A Ratiometric Fluorescent Thermometer. ChemNanoMat 2016, 2, 171–175. [Google Scholar] [CrossRef]
- Qu, D.; Zheng, M.; Zhang, L.; Zhao, H.; Xie, Z.; Jing, X.; Haddad, R.E.; Fan, H.; Sun, Z. Formation mechanism and optimization of highly luminescent N-doped grapheme quantum dots. Sci. Rep. 2015, 4, 5294. [Google Scholar] [CrossRef] [Green Version]
- Hou, J.; Wang, W.; Zhou, T.; Wang, B.; Li, H.; Ding, L. Synthesis and formation mechanistic investigation of nitrogen-doped carbon dots with high quantum yields and yellowish-green fluorescence. Nanoscale 2016, 8, 11185. [Google Scholar] [CrossRef] [PubMed]
- Li, H.-J.; Sun, X.; Xue, F.F.; Ou, N.; Sun, B.-W.; Qian, D.-J.; Chen, M.; Wang, D.; Yang, J.H.; Wang, X.Y. Redox Induced Fluorescence On−Off Switching Based on Nitrogen Enriched Graphene Quantum Dots for Formaldehyde Detection and Bioimaging. ACS Sustain. Chem. Eng. 2018, 6, 1708–1716. [Google Scholar] [CrossRef]
- Silverstein, R.M.; Bassler, G.C. Spectrometric Identification of Organic Compounds, 2nd ed.; John Wiley & Sons, Inc.: New York, NY, USA, 1967; pp. 64–78. [Google Scholar]
- Shang, S.; Dai, W.; Wang, L.; Lv, Y.; Gao, S. Metal-free catalysis of nitrogen-doped nanocarbons for the ammoxidation of alcohols to nitriles. Chem. Commun. 2017, 53, 1048. [Google Scholar] [CrossRef]
- Perry, R.H.; Green, D. Perry’s Chemical Handbook; McGraw-Hill: New York, NY, USA, 1997. [Google Scholar]
- Yoshizawa, M.; Kumazawa, K.; Fujita, M. Room-Temperature and Solution-State Observation of the Mixed-Valence Cation Radical Dimer of Tetrathiafulvalene, [(TTF)2]+•, within a Self-Assembled Cage. J. Am. Chem. Soc. 2005, 127, 13456–13457. [Google Scholar] [CrossRef]
- Zotti, G.; Zecchin, S.; Vercelli, B.; Berlin, A.; Grimoldi, S.; Pasini, M.C.; Raposo, M.M.M. Electrochemical, Magnetic, and Electrical Properties of α,ω-Capped Sexithiophene Films. 1. Neutral-Polaron and Polaron-Bipolaron Conductivities. Chem. Mater. 2005, 17, 6492–6502. [Google Scholar] [CrossRef]
- Li, D.; Kou, E.; Li, W.; Zhang, H.; Zhang, X.; Zhuang, J.; Liu, Y.; Hu, C.; Zheng, Y.; Qichang Yang, O.; et al. Oxidation-induced quenching mechanism of ultrabright red carbon dots and application in antioxidant RCDs/PVA film. Chem. Eng. J. 2021, 425, 131653. [Google Scholar] [CrossRef]
- Stachurski, C.D.; Click, S.M.; Wolfe, K.D.; Dervishogullari, D.; Rosenthal, S.J.; Jennings, G.K.; David, E.; Cliffel, D.E. Optical and electrochemical tuning of hydrothermally synthesized nitrogen-doped carbon dots. Nanoscale Adv. 2020, 2, 3375–3383. [Google Scholar] [CrossRef] [PubMed]
- Ghezzi, F.; Laguardia, L.; Caniello, R.; Canton, A.; Dal Bello, S.; Rais, B.; Anderle, M. XPS, SIMS and FTIR-ATR characterization of boronized graphite from the thermonuclear plasma device RFX-mod. Appl. Surf. Sci. 2015, 354, 408–419. [Google Scholar] [CrossRef]


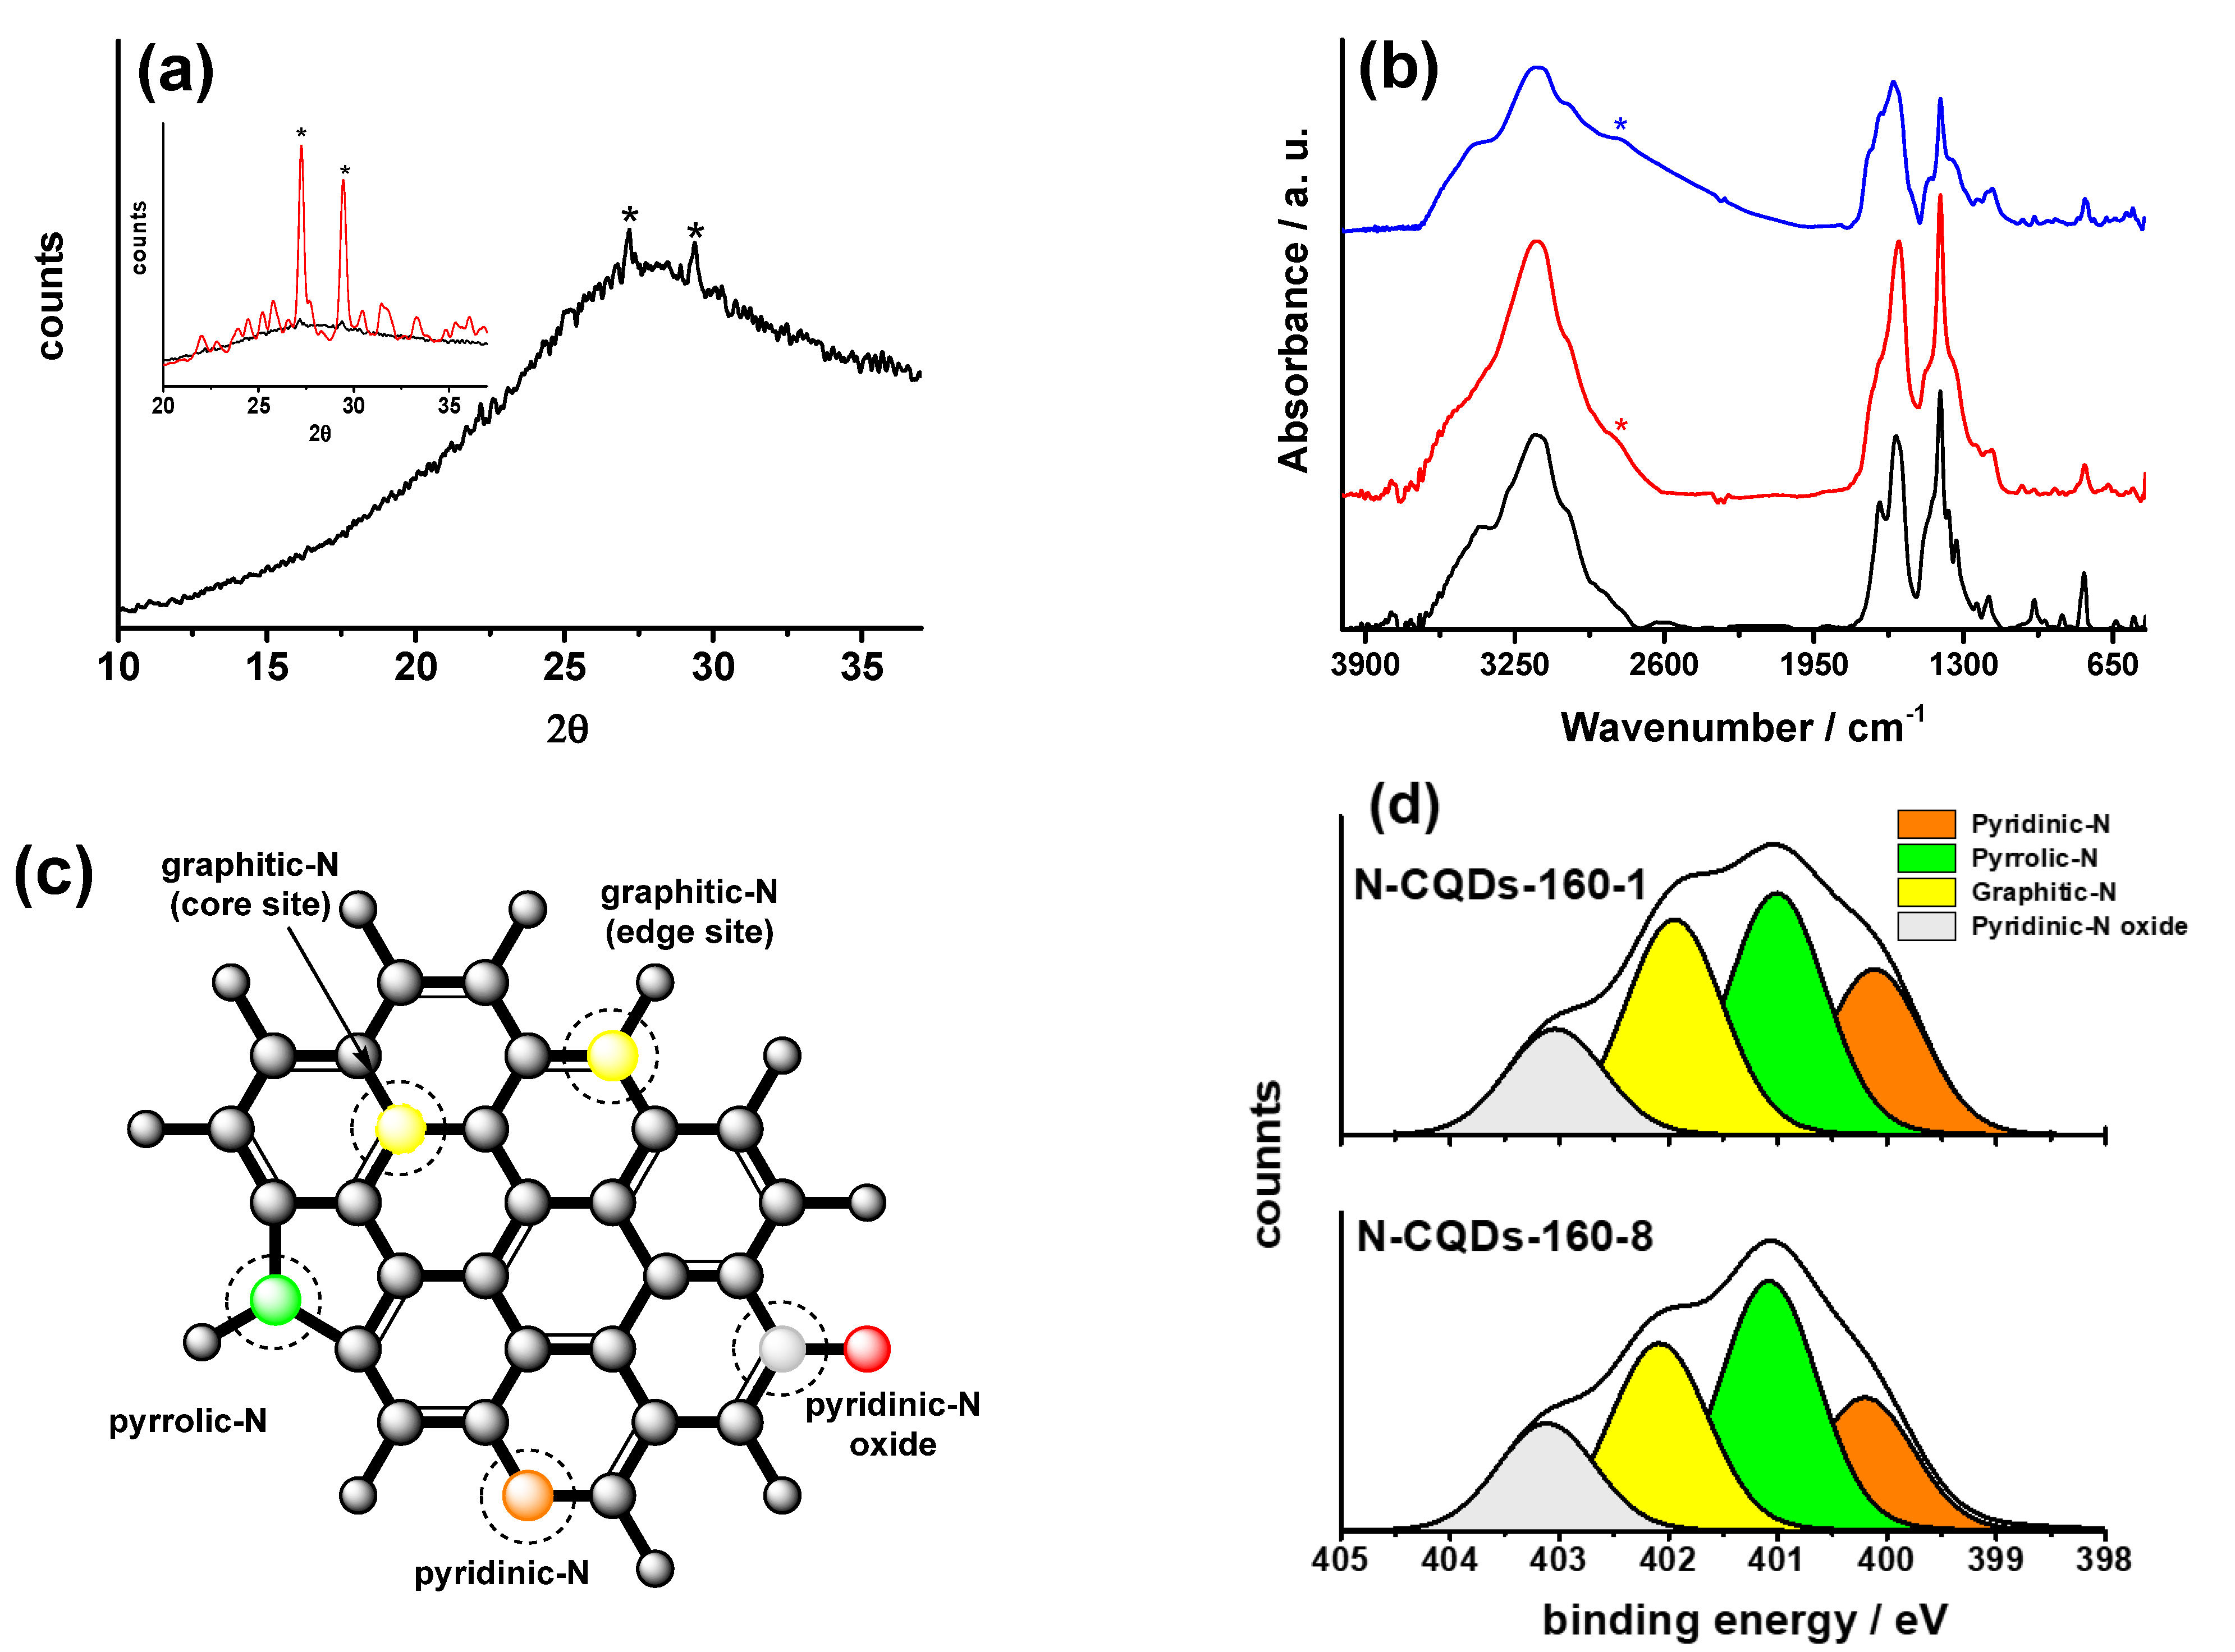
| Sample | N1s/C1s | % Ngr | % Npyr | % Npy | % Npy-O |
|---|---|---|---|---|---|
| N-CQDs-160-1 | 0.18 | 30 | 33 | 22 | 15 |
| N-CQDs-160-8 | 0.16 | 28 | 37 | 20 | 15 |
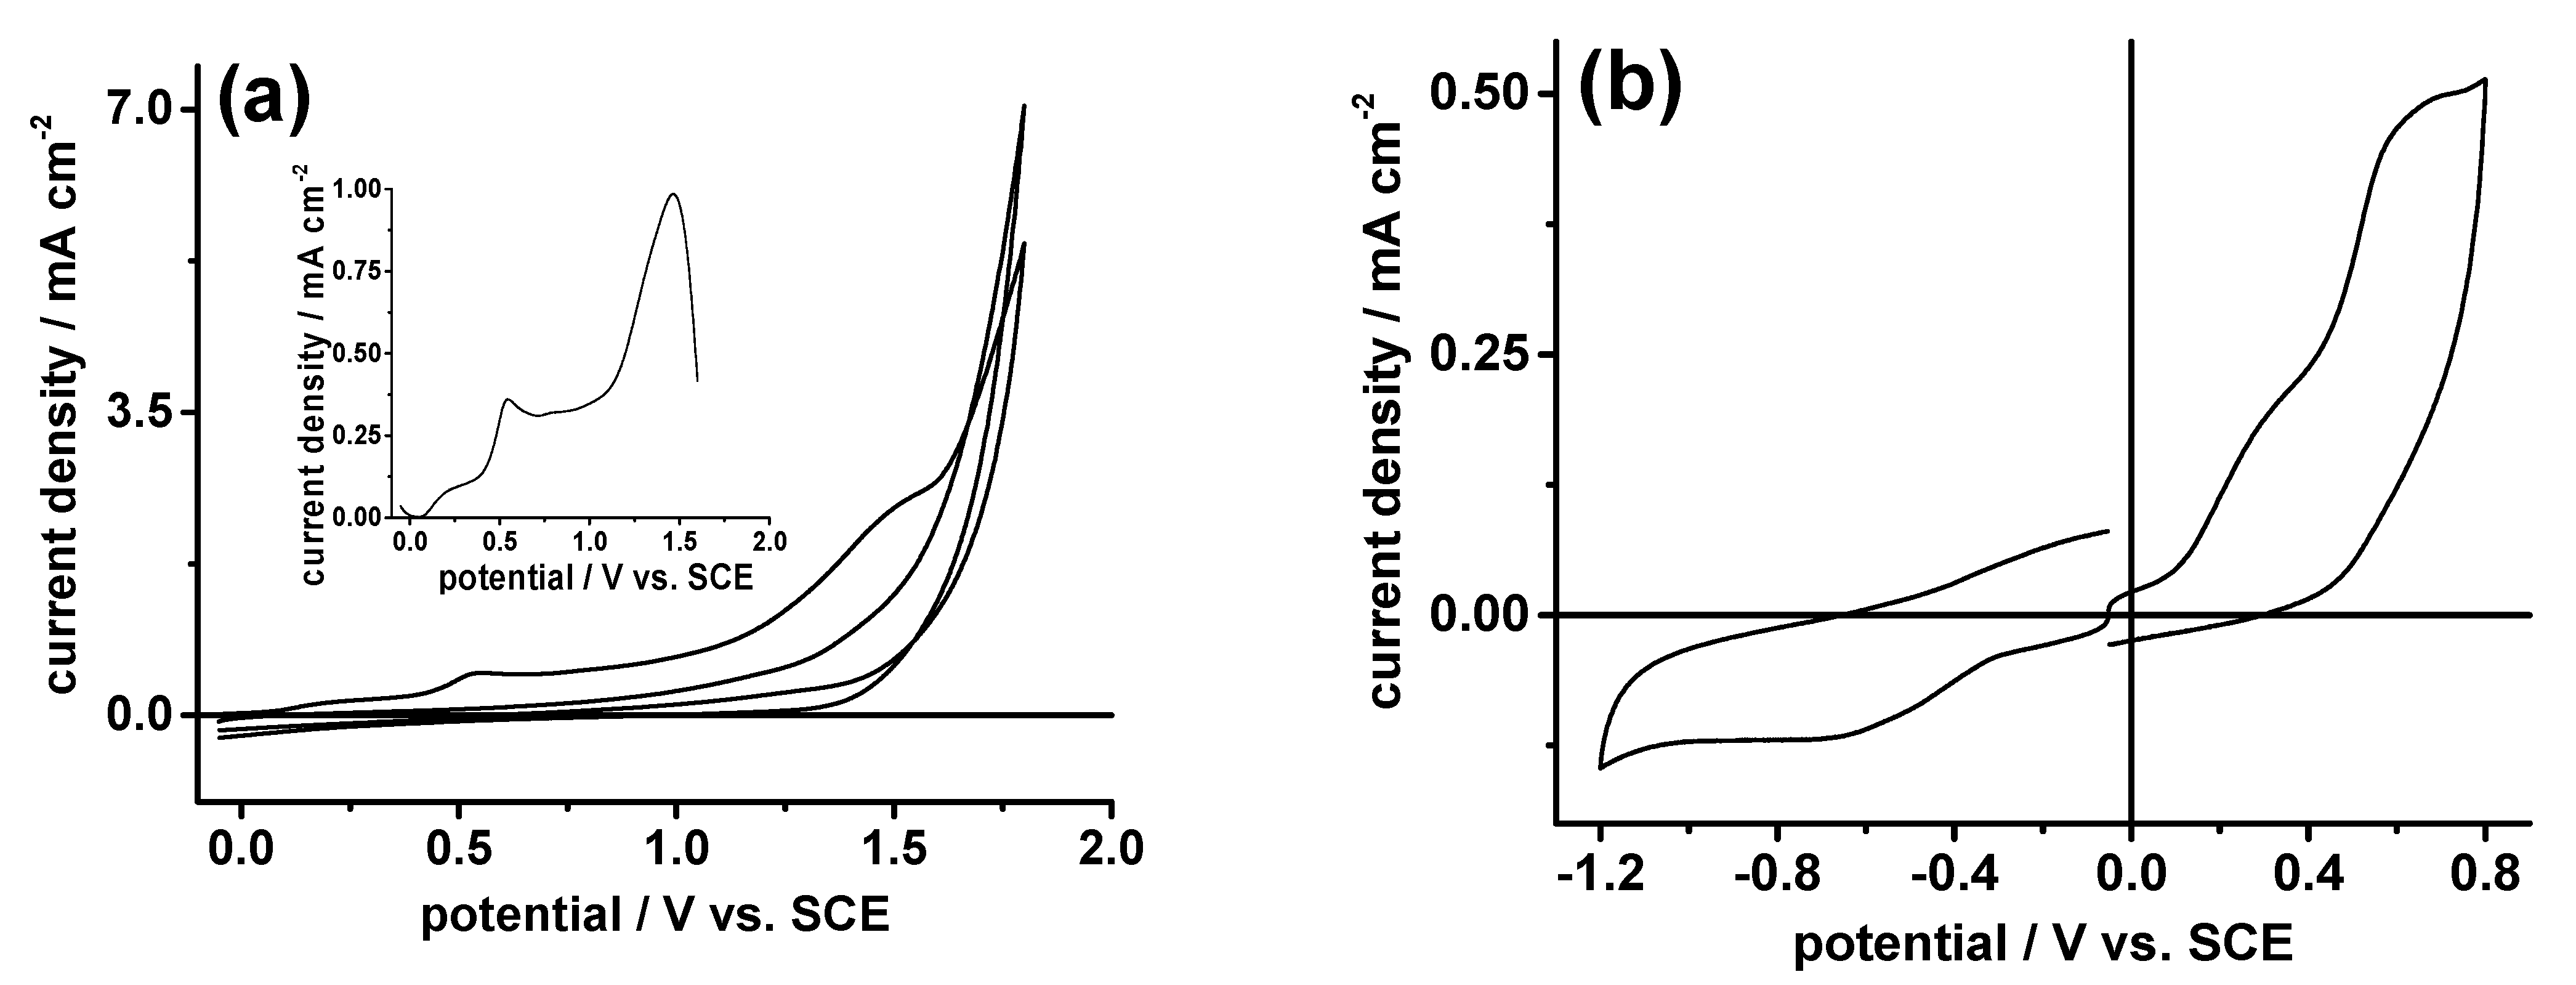
| pH | Eox1; Eox2 | Ered | ∆Epox1; ∆Epox2 | ∆Epred | ∆E |
|---|---|---|---|---|---|
| 1 | 0.38 *; 0.81 * | −0.038 * | 40; 103 | 53 | 0.43 |
| 2 | 0.32 *; 0.75 * | −0.11 * | 50; 100 | 41 | 0.43 |
| 3 | 0.27 *; 0.71 * | −0.16 * | 50; 120 | 59 | 0.44 |
| 5 | 0.29 *; 0.66 * | −0.35 * | 90; 140 | 64 | 0.37 |
| 7 | 0.35 *; 0.66 * | −0.70 * | 100; 150 | 172 | 0.30 |
| 9 | 0.39 *; 0.65 * | −1.09 * | 150 | 320 | 0.30 |
| 12 | 0.66 * | −1.22 * | 230 | 240 |
Disclaimer/Publisher’s Note: The statements, opinions and data contained in all publications are solely those of the individual author(s) and contributor(s) and not of MDPI and/or the editor(s). MDPI and/or the editor(s) disclaim responsibility for any injury to people or property resulting from any ideas, methods, instructions or products referred to in the content. |
© 2022 by the authors. Licensee MDPI, Basel, Switzerland. This article is an open access article distributed under the terms and conditions of the Creative Commons Attribution (CC BY) license (https://creativecommons.org/licenses/by/4.0/).
Share and Cite
Ghezzi, F.; Donnini, R.; Sansonetti, A.; Giovanella, U.; La Ferla, B.; Vercelli, B. Nitrogen-Doped Carbon Quantum Dots for Biosensing Applications: The Effect of the Thermal Treatments on Electrochemical and Optical Properties. Molecules 2023, 28, 72. https://doi.org/10.3390/molecules28010072
Ghezzi F, Donnini R, Sansonetti A, Giovanella U, La Ferla B, Vercelli B. Nitrogen-Doped Carbon Quantum Dots for Biosensing Applications: The Effect of the Thermal Treatments on Electrochemical and Optical Properties. Molecules. 2023; 28(1):72. https://doi.org/10.3390/molecules28010072
Chicago/Turabian StyleGhezzi, Francesco, Riccardo Donnini, Antonio Sansonetti, Umberto Giovanella, Barbara La Ferla, and Barbara Vercelli. 2023. "Nitrogen-Doped Carbon Quantum Dots for Biosensing Applications: The Effect of the Thermal Treatments on Electrochemical and Optical Properties" Molecules 28, no. 1: 72. https://doi.org/10.3390/molecules28010072
APA StyleGhezzi, F., Donnini, R., Sansonetti, A., Giovanella, U., La Ferla, B., & Vercelli, B. (2023). Nitrogen-Doped Carbon Quantum Dots for Biosensing Applications: The Effect of the Thermal Treatments on Electrochemical and Optical Properties. Molecules, 28(1), 72. https://doi.org/10.3390/molecules28010072