

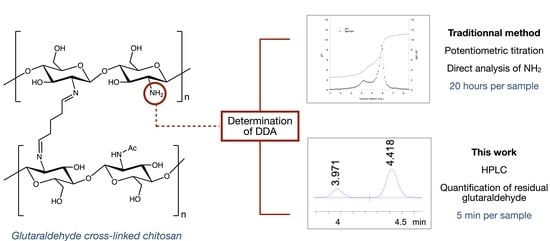
A New and Rapid HPLC Method to Determine the Degree of Deacetylation of Glutaraldehyde-Cross-Linked Chitosan


Abstract
:
1. Introduction
2. Results and Discussion
3. Materials and Methods
3.1. Materials
3.2. Determination of DDA Values of Starting Materials via Potentiometric Titration
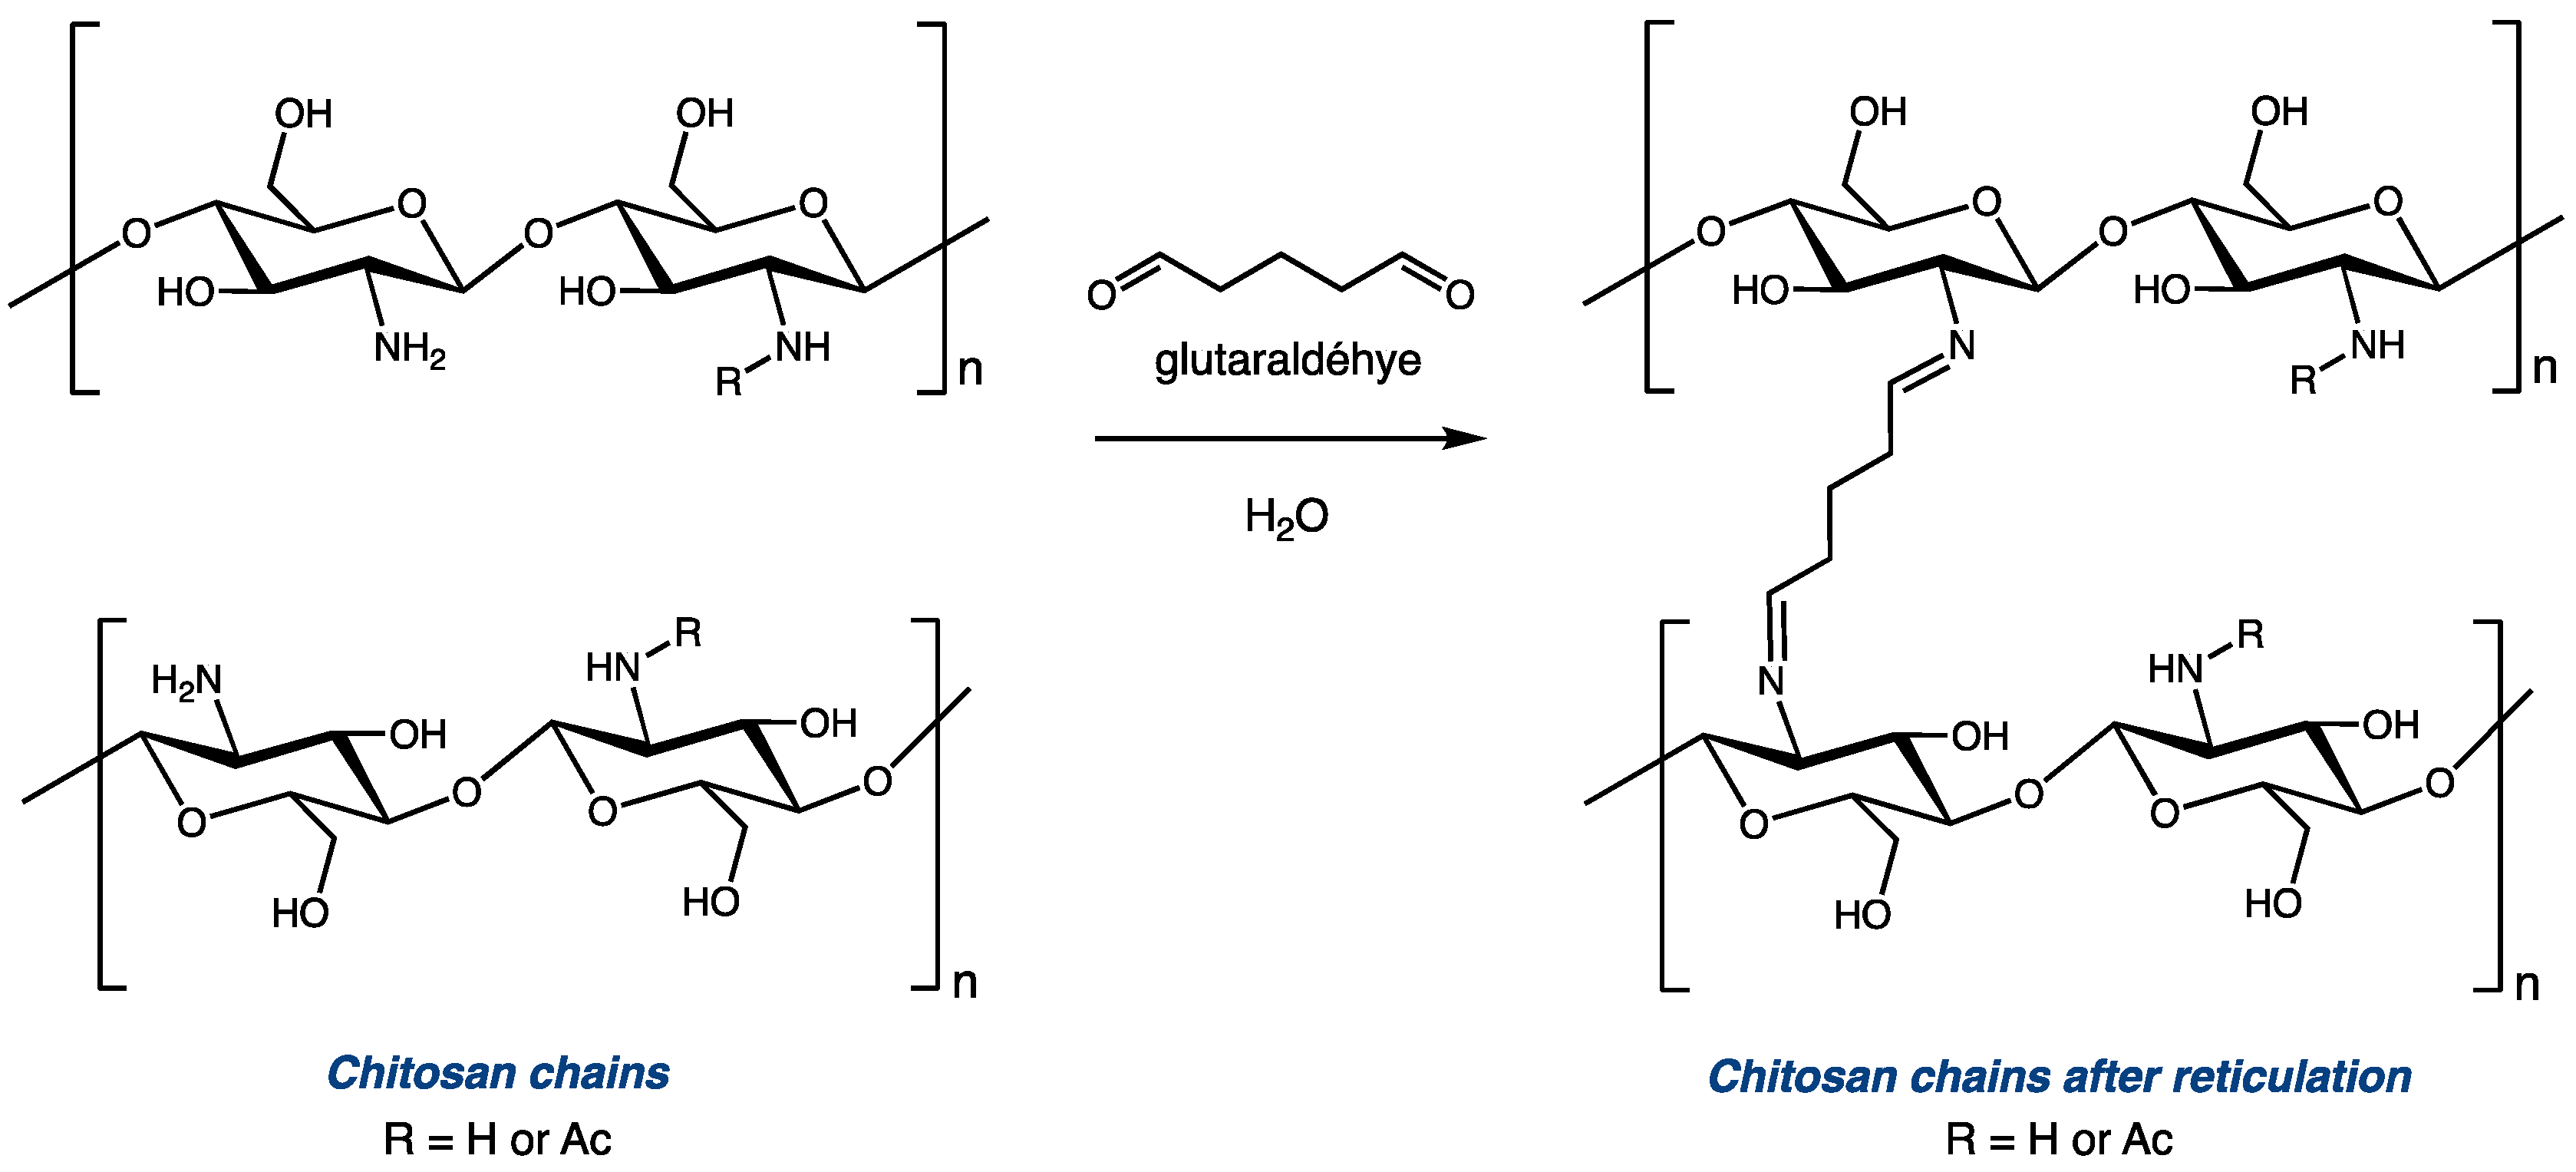
3.3. Preparation of Glutaraldehyde-Cross-Linked Chitosan
3.4. Potentiometric Titration of Glutaraldehyde-Cross-Linked Chitosan
3.5. Determination of the Level of Reticulation via HPLC (LRHPLC)
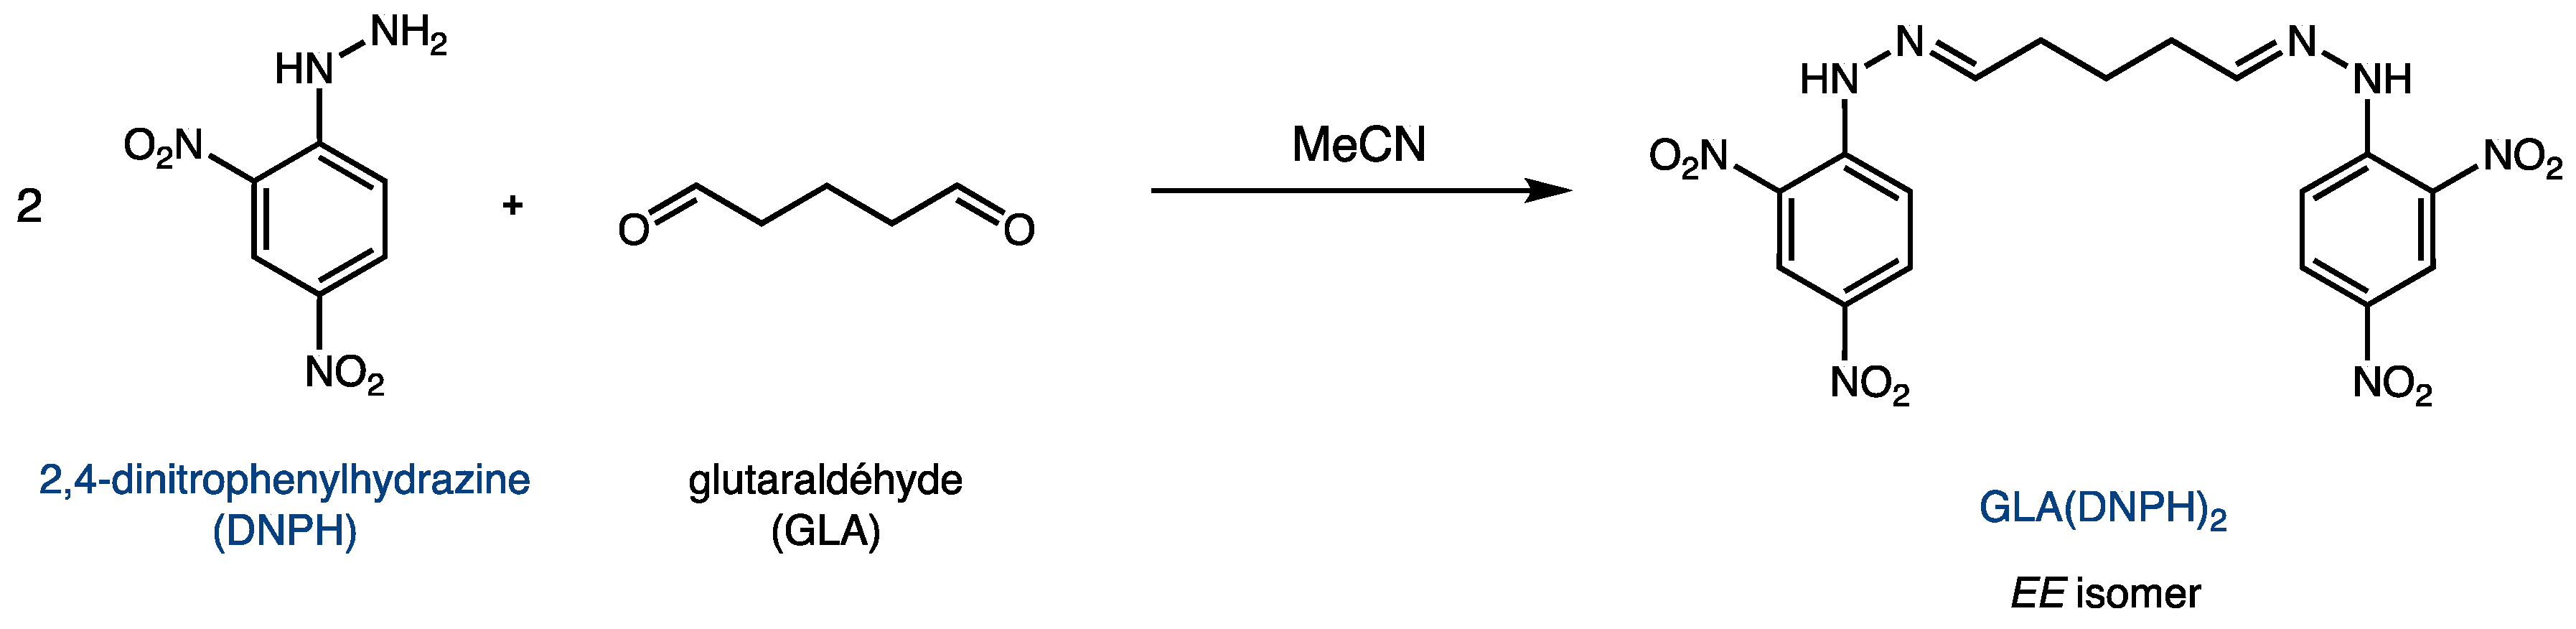
3.5.1. Preparation of a 2,4-dinitrophenylhydrazine (DNPH) Stock Solution
3.5.2. Preparation of an HPLC Calibration Curve for GLA(DNPH)2
3.5.3. Determination of Residual Glutaraldehyde after Cross-Linking Reaction
3.5.4. Data Treatment
3.6. Statistical Analysis
4. Conclusions
Supplementary Materials
Author Contributions
Funding
Institutional Review Board Statement
Informed Consent Statement
Data Availability Statement
Acknowledgments
Conflicts of Interest
References
- Qin, Y.; Li, P. Antimicrobial Chitosan Conjugates: Current Synthetic Strategies and Potential Applications. Int. J. Mol. Sci. 2020, 21, 499. [Google Scholar] [CrossRef] [PubMed]
- Xin, Y.; Zhao, H.; Xu, J.; Xie, Z.; Li, G.; Gan, Z.; Wang, X.W. Borneol-modified chitosan: Antimicrobial adhesion properties and application in skin flora protection. Carbohydr. Polym. 2020, 228, 115378. [Google Scholar] [CrossRef] [PubMed]
- El Hadrami, A.; Adam, L.R.; El Hadrami, I.; Daayf, F. Chitosan in Plant Protection. Mar. Drugs 2010, 8, 968–987. [Google Scholar] [CrossRef] [PubMed]
- Kumirska, J.; Czerwicka, M.; Kaczynski, Z.; Bychowska, A.; Brzozowski, K.; Thoming, J.; Stepnowski, P. Application of Spectroscopic Methods for Structural Analysis of Chitin and Chitosan. Mar. Drugs 2010, 8, 1567–1636. [Google Scholar] [CrossRef] [PubMed]
- Zhao, D.; Yu, S.; Sun, B.; Gao, S.; Guo, S.; Zhao, K. Biomedical Applications of Chitosan and Its Derivative Nanoparticles. Polymers 2018, 10, 462. [Google Scholar] [CrossRef] [PubMed]
- Pella, M.C.G.; Lima-Tenório, M.K.; Tenório-Neto, E.T.; Guilherme, M.R.; Muniz, E.C.; Rubira, A.F. Chitosan-based hydrogels: From preparation to biomedical applications. Carbohydr. Polym. 2018, 196, 233–245. [Google Scholar] [CrossRef] [PubMed]
- Yu, Q.; Song, Y.; Shi, X.; Xu, C.; Bin, Y. Preparation and properties of chitosan derivative/poly(vinyl alcohol) blend film crosslinked with glutaraldehyde. Carbohydr. Polym. 2011, 84, 465–470. [Google Scholar] [CrossRef]
- Zhao, J.; Han, W.; Chen, H.; Tu, M.; Zeng, R.; Shi, Y.; Cha, Z.; Zhou, C. Preparation, structure and crystallinity of chitosan nano-fibers by a solid-liquid phase separation technique. Carbohydr. Polym. 2011, 83, 1541–1546. [Google Scholar] [CrossRef]
- Jabli, M.; Baouab, M.H.V.; Sintes-Zydowicz, N.; Hassine, B.B. [Dye Molecules/Copper(II)/Macroporous Glutaraldehyde-Chitosan] Microspheres Complex: Surface Characterization, Kinetic, and Thermodynamic Investigations. J. Appl. Polym. Sci. 2012, 123, 3412–3424. [Google Scholar] [CrossRef]
- Steiger, B.G.K.; Wilson, L.D. Modular Chitosan-Based Adsorbents for Tunable Uptake of Sulfate from Water. Int. J. Mol. Sci. 2020, 21, 7130. [Google Scholar] [CrossRef]
- Hsien, T.Y.; Rorrer, G.L. Heterogeneous Cross-Linking of Chitosan Gel Beads: Kinetics, Modeling, and Influence on Cadmium Ion Adsorption Capacity. Ind. Eng. Chem. Res. 1997, 36, 3631–3638. [Google Scholar] [CrossRef]
- Beppu, M.M.; Vieira, R.S.; Aimoli, C.G.; Santana, C.C. Crosslinking of chitosan membranes using glutaraldehyde: Effect on ion permeability and water absorption. J. Membr. Sci. 2007, 301, 126–130. [Google Scholar] [CrossRef]
- Crini, G.; Torri, G.; Lichtfouse, E.; Kyzas, G.Z.; Wilson, L.D.; Morin-Crini, N. Dye removal by biosorption using cross-linked chitosan-based hydrogels. Environ. Chem. Lett. 2019, 17, 1645–1666. [Google Scholar] [CrossRef]
- Crini, G. Recent developments in polysaccharide-based materials used as adsorbents in wastewater treatment. Prog. Polym. Sci. 2005, 30, 38–70. [Google Scholar] [CrossRef]
- Frick, J.M.; Ambrosi, A.; Pollo, L.D.; Tessaro, I.C. Influence of Glutaraldehyde Crosslinking and Alkaline Post-treatment on the Properties of Chitosan-Based Films. J. Polym. Environ. 2018, 26, 2748–2757. [Google Scholar] [CrossRef]
- Guibal, E. Interaction of metal ions with chitosan-based sorbents: A review. Sep. Purif. Technol. 2004, 38, 43–74. [Google Scholar] [CrossRef]
- Shigemasa, Y.; Matsuura, H.; Sashiwa, H.; Saimoto, H. Evaluation of different absorbance ratios from infrared spectroscopy for analyzing the degree of deacetylation in chitin. Int. J. Biol. Macromol. 1996, 18, 237–242. [Google Scholar] [CrossRef] [PubMed]
- Hirai, A.; Odani, H.; Nakajima, A. Determination of degree of deacetylation of chitosan by 1H NMR spectroscopy. Polym. Bull. 1991, 26, 87–94. [Google Scholar] [CrossRef]
- Zhang, Y.; Xue, C.; Xue, Y.; Gao, R.; Zhang, X. Determination of the degree of deacetylation of chitin and chitosan by X-ray powder diffraction. Carbohydr. Res. 2005, 340, 1914–1917. [Google Scholar] [CrossRef]
- Tan, S.C.; Khor, E.; Tan, T.K.; Wong, S.M. The degree of deacetylation of chitosan: Advocating the first derivative UV-spectrophotometry method of determination. Talanta 1998, 45, 713–719. [Google Scholar] [CrossRef]
- Broussignac, P. Haut Polymère Naturel Connu dans l’industrie: Le chitosane. Chim. Ind. Génie Chim. 1968, 99, 1241–1247. [Google Scholar]
- Dos Santos, Z.M.; Caroni, A.L.P.F.; Pereira, M.R.; da Silva, D.R.; Fonseca, J.L.C. Determination of deacetylation degree of chitosan: A comparison between conductometric titration and CHN elemental analysis. Carbohydr. Res. 2009, 344, 2591–2595. [Google Scholar] [CrossRef] [PubMed]
- Zhang, Y.; Zhang, X.; Ding, R.; Zhang, J.; Liu, J. Determination of the degree of deacetylation of chitosan by potentiometric titration preceded by enzymatic pretreatment. Carbohydr. Polym. 2011, 83, 813–817. [Google Scholar] [CrossRef]
- Sivashankari, P.R.; Prabaharan, M. Deacetylation modification techniques of chitin and chitosan. In Chitosan Based Biomaterials Volume 1; Woodhead Publishing: Sawston, UK, 2017; pp. 117–133. [Google Scholar] [CrossRef]
- Czechowska-Biskup, R.; Jarosińska, D.; Rokita, B.; Ulański, P.; Rosiak, J.M. Determination of degree of deacetylation of chitosan—Comparison of methods. Prog. Chem. Appl. Chitin Deriv. 2012, XVII, 5–20. [Google Scholar]
- Yan, X.; Evenocheck, H.M. Chitosan analysis using acid hydrolysis and HPLC/UV. Carbohydr. Polym. 2012, 87, 1774–1778. [Google Scholar] [CrossRef]
- Zhu, X.; Cai, J.; Yang, J.; Su, Q. Determination of glucosamine in impure chitin samples by high-performance liquid chromatography. Carbohydr. Res. 2005, 340, 1732–1738. [Google Scholar] [CrossRef] [PubMed]
- Miao, Q.; Cui, Y.; Zhang, J.; Mi, Y.; Tan, W.; Li, Q.; Gu, G.; Dong, F.; Guo, Z. Determination of chitosan content with ratio coefficient method and HPLC. Int. J. Biol. Macromol. 2020, 164, 384–388. [Google Scholar] [CrossRef] [PubMed]
- Ng, C.-H.; Hein, S.; Chandrkrachang, S.; Stevens, W.F. Evaluation of an Improved Acid Hydrolysis-HPLC Assay for the Acetyl Content in Chitin and Chitosan. J. Biomed. Mater. Res. B Appl. Biomater. 2005, 76, 155–160. [Google Scholar] [CrossRef]
- Miao, Q.; Mi, Y.; Cui, J.; Zhang, J.; Tan, W.; Li, Q.; Guo, Z. Determination of chitosan content with Schiff base method and HPLC. Int. J. Biol. Macromol. 2021, 182, 1537–1542. [Google Scholar] [CrossRef]
- Monteiro, O.A.; Airoldi, C. Some studies of crosslinking chitosan-glutaraldehyde interaction in a homogene system. Int. J. Biol. Macromol. 1999, 26, 119–128. [Google Scholar] [CrossRef]
- Monsan, P.; Puzo, G.; Mazarguil, H. Mechanism of glutaraldehyde-protein bond formation. Biochimie 1975, 57, 1281–1292. [Google Scholar] [CrossRef] [PubMed]
- Zotkin, M.A.; Vikhoreva, G.A.; Smotrina, T.V.; Derbenev, M.A. Thermal modification and study of the structure of chitosan films. Fibre Chem. 2004, 36, 16–20. [Google Scholar] [CrossRef]
- Liggio, J.; Mclaren, R. An optimized method for the determination of volatile and semi-volatile aldehydes and ketones in ambident particulate matter. Int. J. Environ. Anal. Chem. 2003, 83, 819–835. [Google Scholar] [CrossRef]
- Uchiyama, S.; Inaba, Y.; Kunugita, N. Derivatization of carbonyl compounds with 2,4-dinitrophenylhydrazine and their subsequent determination by high-performance liquid chromatography. J. Chromatogr. B 2011, 879, 1282–1289. [Google Scholar] [CrossRef] [PubMed]
- Yuniati, W.; Amelia, T.; Ibrahim, S.; Damayanti, S. Analytical Method Development for Determining Formaldehyde in Cream Cosmetics Using Hyphenated Gas Chromatography. ACS Omega 2021, 6, 28403–28409. [Google Scholar] [CrossRef] [PubMed]
- Bourgeois, C.; Blanc, N.; Cannot, J.-C.; Demesmay, C. Towards a Non-Biased Formaldehyde Quantification in Leather: New Derivatization Conditions before HPLC Analysis of 2,4-Dinitrophenylhydrazine Derivatives. Molecules 2020, 25, 5765. [Google Scholar] [CrossRef] [PubMed]
- Levin, J.-O.; Lindahl, R.; Heeremans, C.E.M.; van Oosten, K. Certification of Reference Materials Related to the Monitoring of Aldehydes in Air by Derivatization with 2,4-Dinitrophenylhydrazine. Analyst 1996, 121, 1273–1278. [Google Scholar] [CrossRef]
- Barnes, A.R. Determination of glutaraldehyde in solution as its bis-2,4-dinitrophenylhydrazone derivative; determination of geometrical isomer ratios. Pharm. Acta Helv. 1993, 68, 113–119. [Google Scholar] [CrossRef]
- Uchiyama, S.; Sakamoto, H.; Ohno, A.; Inaba, Y.; Nakagome, H.; Kunugita, N. Reductive amination of glutaraldehyde 2,4-dinitrophenylhydrazone using 2-picoline borane and high-performance liquid chromatographic analysis. Analyst 2012, 137, 4274. [Google Scholar] [CrossRef]
- Lindahl, R.; Levin, J.-O. Laboratory validation of a diffusive sampler for the determination of glutaraldehyde in air. J. Chromatogr. A 1995, 710, 175–180. [Google Scholar] [CrossRef]
- Uchiyama, S.; Ando, M.; Aoyagi, S. Isomerization of aldehyde-2,4-dinitrophenylhydrazone derivatives and validation of high-performance liquid chromatographic analysis. J. Chromatogr. A 2003, 996, 95–102. [Google Scholar] [CrossRef] [PubMed]
- Binding, N.; Muller, W.; Witting, U. Syn/anti isomerization of 2,4-dinitrophenylhydrazones in the determination of airborne unsymmetrical aldehydes and ketones using 2,4-dinitrophenylhydrazine derivation. Fresenius. J. Anal. Chem. 1996, 356, 315–319. [Google Scholar] [CrossRef] [PubMed]
- Ramirez, F.; Kirby, A.F. Geometrical Isomerism and Absorption Spectra of Dinitrophenylhydrazones. J. Am. Chem. Soc. 1954, 76, 1037–1044. [Google Scholar] [CrossRef]
- Peters, K.; Richards, F.M. Chemical Cross-Linking: Reagents and Problems in Studies of Membrane Structure. Annu. Rev. Biochem. 1977, 46, 523–551. [Google Scholar] [CrossRef] [PubMed]
- Richards, F.M.; Knowles, J.R. Glutaraldehyde as a Protein Cross-linking Reagent. J. Mol. Biol. 1968, 37, 231–233. [Google Scholar] [CrossRef] [PubMed]
- Gorman, S.P.; Scott, E.M.; Russell, A.D. Antimicrobial Activity, Uses and Mechanism of Action of Glutaraldehyde. J. Appl. Bacteriol. 1980, 48, 161–190. [Google Scholar] [CrossRef]
- Kawahara, J.; Ohmori, T.; Ohkubo, T.; Hattori, S.; Kawamura, M. The Structure of Glutaraldehyde in Aqueous Solution Determined by Ultraviolet Absorption and Light Scattering. Anal. Biochem. 1992, 201, 94–98. [Google Scholar] [CrossRef] [PubMed]
- Margel, S.; Rembaum, A. Synthesis and Characterization of poly(glutaraldehyde). A Potential Reagent for Protein Immobilization and Cell Separation. Macromolecules 1980, 13, 19–24. [Google Scholar] [CrossRef]

| Commercial Name | Viscosity (cps) I | Calculated MW (KDa) I | DDASM (%) II |
|---|---|---|---|
| ChitoClear® HQG 10 | <20 | 110–150 | 75.0 ± 0.2 a |
| ChitoClear® HQG 400 | 200–600 | 250–300 | 77.5 ± 0.6 b |
| ChitoClear® HQG 800 | 600–1200 | 300–340 | 69.4 ± 0.1 c |
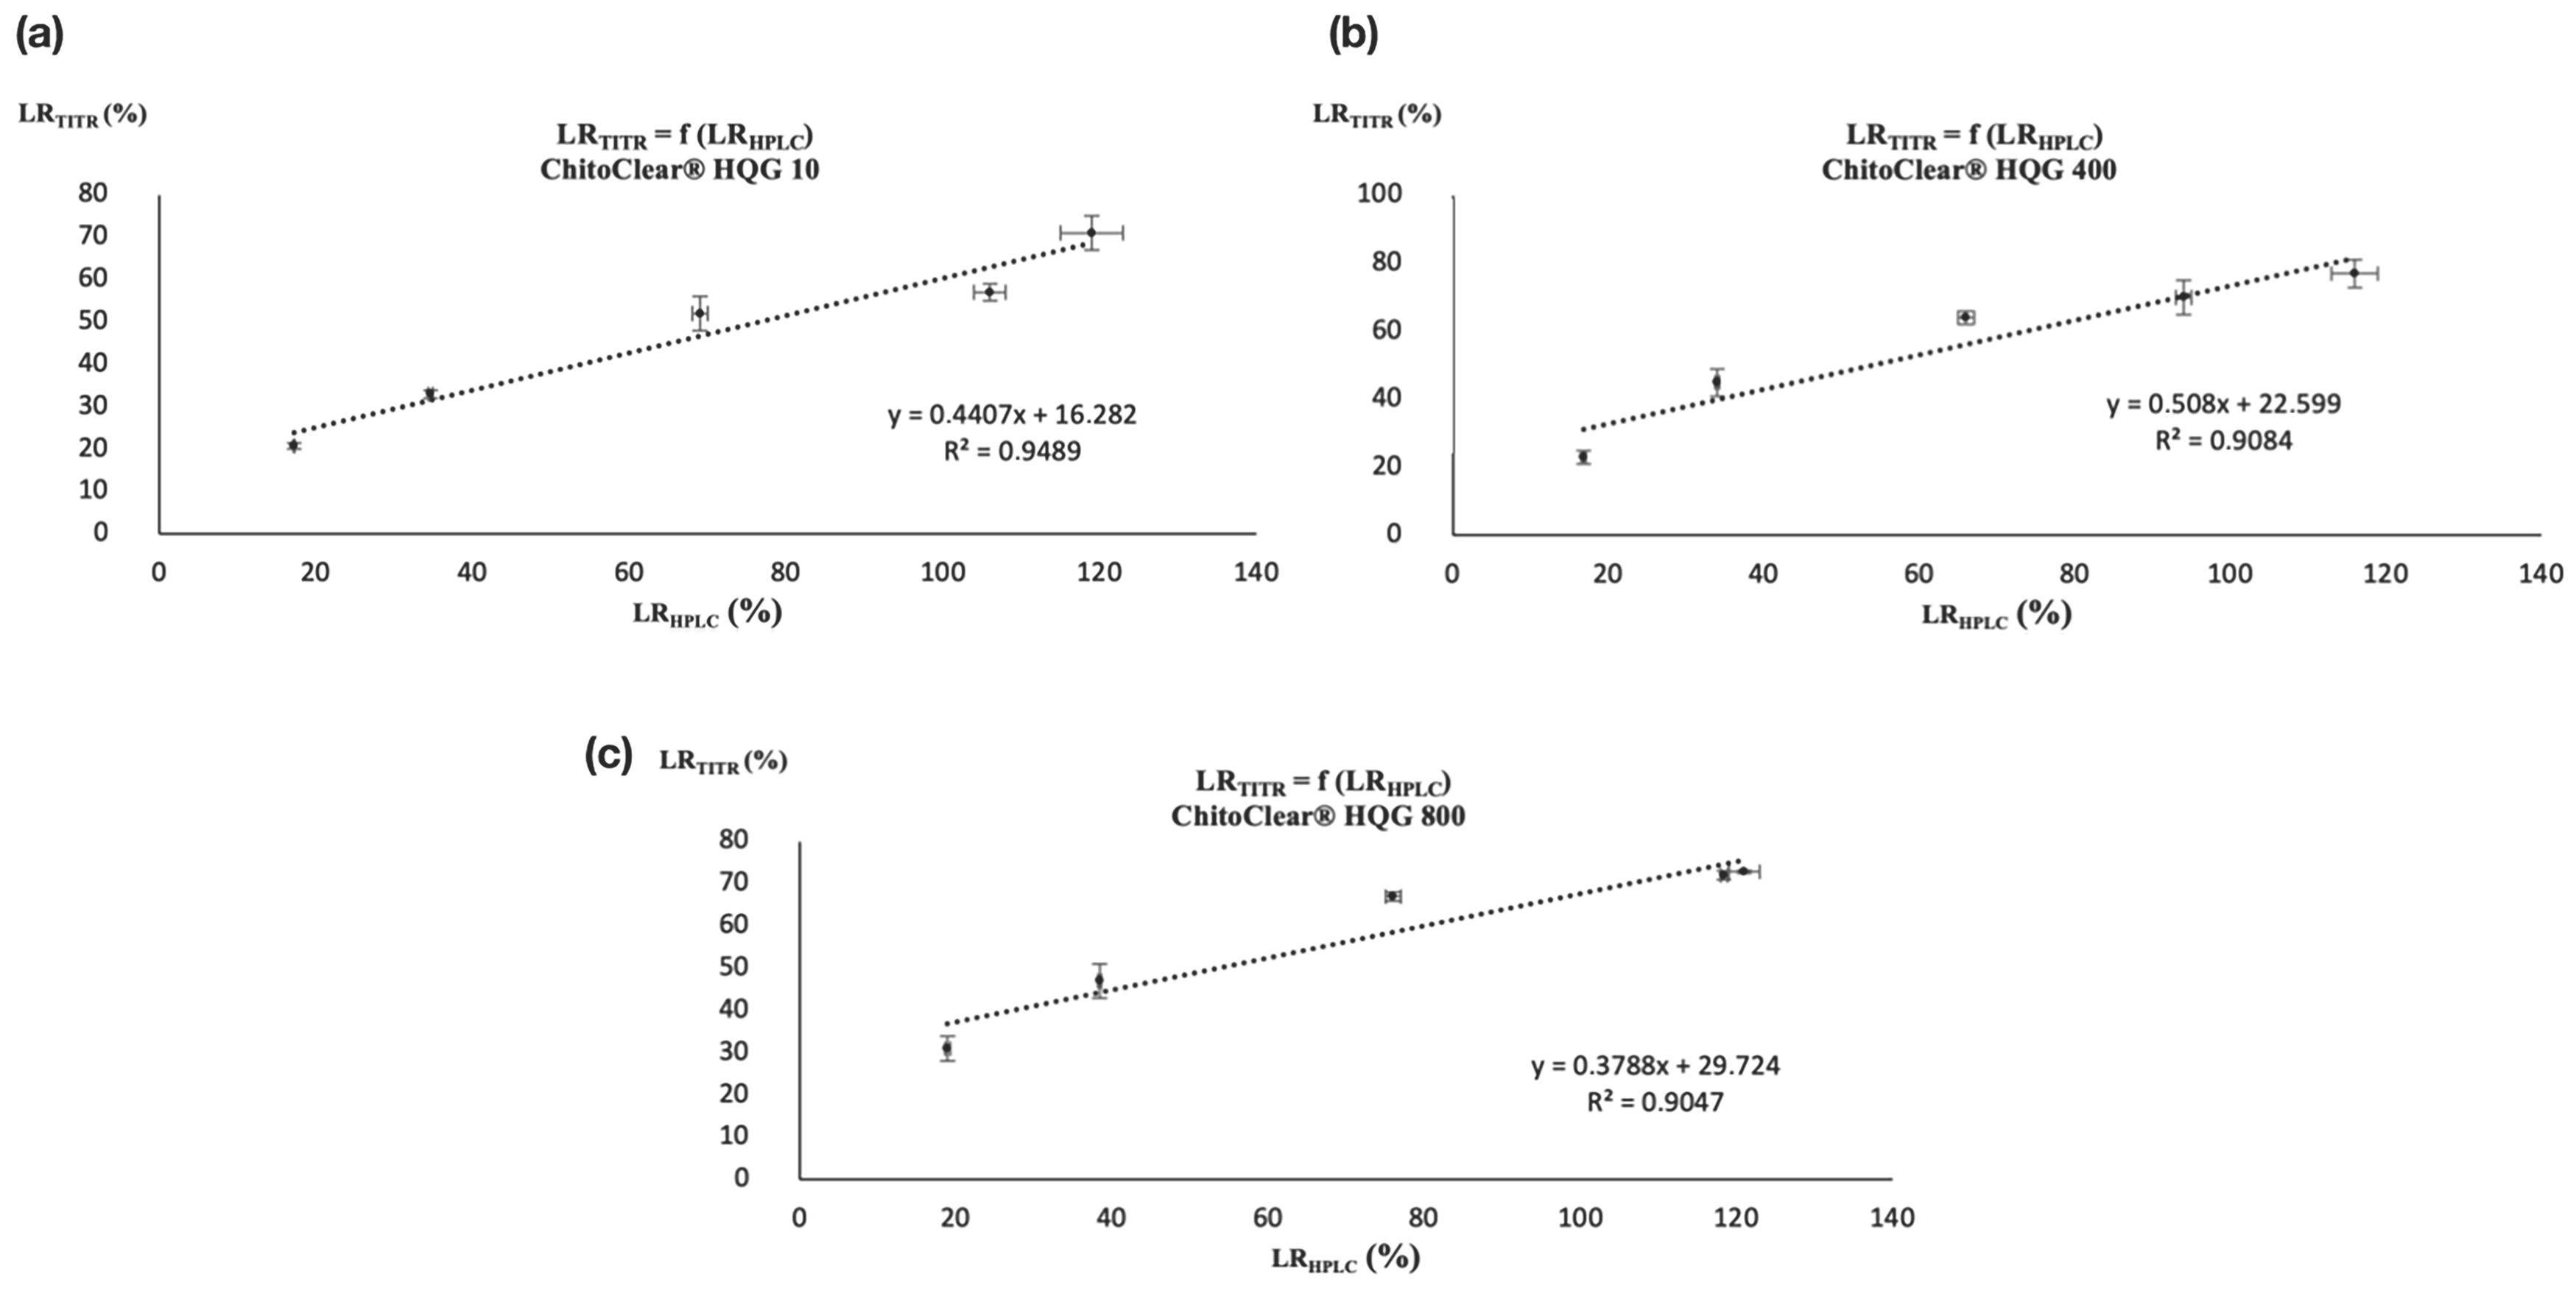
| Entry | Starting Material | GLA/NH2 Ratio | DDARET (%) I | LRTITR (%) II |
|---|---|---|---|---|
| 1 | ChitoClear® HQG 10 | 1:4 | 59.4 ± 0.3 a | 20.8 ± 0.7 |
| 2 | 1:2 | 50.5 ± 0.6 b,* | 33 ± 1 | |
| 3 | 1:1 | 36 ± 3 c,* | 52 ± 4 | |
| 4 | 2:1 | 32.1 ± 0.9 c,* | 57 ± 2 | |
| 5 | 4:1 | 22 ± 3 d | 71 ± 4 | |
| 6 | ChitoClear® HQG 400 | 1:4 | 59.5 ± 0.7 a | 23 ± 2 |
| 7 | 1:2 | 43 ± 2 b,* | 45 ± 4 | |
| 8 | 1:1 | 28.0 ± 0.3 c,* | 64 ± 2 | |
| 9 | 2:1 | 23 ± 2 d | 70 ± 5 | |
| 10 | 4:1 | 18 ± 3 d | 77 ± 4 | |
| 11 | ChitoClear® HQG 800 | 1:4 | 48 ± 2 III, a * | 31 ± 3 |
| 12 | 1:2 | 37 ± 3 b,* | 47 ± 4 | |
| 13 | 1:1 | 23.2 ± 0.2 c,* | 67 ± 1 | |
| 14 | 2:1 | 19.5 ± 0.6 c | 72 ± 1 | |
| 15 | 4:1 | 18.87 ± 0.02 c | 72.8 ± 0.3 |
| Entry | Starting Material | GLA/NH2 Ratio | LRHPLC (%) |
|---|---|---|---|
| 1 | ChitoClear® HQG 10 | 1:4 | 17.2 ± 0.1 a |
| 2 | 1:2 | 34.6 ± 0.3 b | |
| 3 | 1:1 | 69 ± 1 c | |
| 4 | 2:1 | 106 ± 2 d,* | |
| 5 | 4:1 | 119 ± 4 e | |
| 6 | ChitoClear® HQG 400 | 1:4 | 16.8 ± 0.3 a |
| 7 | 1:2 | 34.0 ± 0.3 b | |
| 8 | 1:1 | 66 ± 1 c | |
| 9 | 2:1 | 94 ± 1 d,* | |
| 10 | 4:1 | 116 ± 3 e | |
| 11 | ChitoClear® HQG 800 | 1:4 | 18.9 ± 0.3 a,* |
| 12 | 1:2 | 38.4 ± 0.2 b,* | |
| 13 | 1:1 | 76 ± 1 c,* | |
| 14 | 2:1 | 118.4 ± 0.4 d,* | |
| 15 | 4:1 | 121 ± 2 d |
Disclaimer/Publisher’s Note: The statements, opinions and data contained in all publications are solely those of the individual author(s) and contributor(s) and not of MDPI and/or the editor(s). MDPI and/or the editor(s) disclaim responsibility for any injury to people or property resulting from any ideas, methods, instructions or products referred to in the content. |
© 2023 by the authors. Licensee MDPI, Basel, Switzerland. This article is an open access article distributed under the terms and conditions of the Creative Commons Attribution (CC BY) license (https://creativecommons.org/licenses/by/4.0/).
Share and Cite
Amamou, O.; Denis, J.-P.; Heinen, É.; Boubaker, T.; Cardinal, S. A New and Rapid HPLC Method to Determine the Degree of Deacetylation of Glutaraldehyde-Cross-Linked Chitosan. Molecules 2023, 28, 7294. https://doi.org/10.3390/molecules28217294
Amamou O, Denis J-P, Heinen É, Boubaker T, Cardinal S. A New and Rapid HPLC Method to Determine the Degree of Deacetylation of Glutaraldehyde-Cross-Linked Chitosan. Molecules. 2023; 28(21):7294. https://doi.org/10.3390/molecules28217294
Chicago/Turabian StyleAmamou, Ons, Jean-Philippe Denis, Élise Heinen, Taoufik Boubaker, and Sébastien Cardinal. 2023. "A New and Rapid HPLC Method to Determine the Degree of Deacetylation of Glutaraldehyde-Cross-Linked Chitosan" Molecules 28, no. 21: 7294. https://doi.org/10.3390/molecules28217294
APA StyleAmamou, O., Denis, J.-P., Heinen, É., Boubaker, T., & Cardinal, S. (2023). A New and Rapid HPLC Method to Determine the Degree of Deacetylation of Glutaraldehyde-Cross-Linked Chitosan. Molecules, 28(21), 7294. https://doi.org/10.3390/molecules28217294