Article

Prediction of Xe/Kr Separation in Metal-Organic Frameworks by a Precursor-Based Neural Network Synergistic with a Polarizable Adsorbate Model

1
School of Environmental and Chemical Engineering, Foshan University, Foshan 528000, China
2
School of Chemistry and Chemical Engineering, South China University of Technology, Guangzhou 510640, China
3
School of Environment and Energy, South China University of Technology, Guangzhou Higher Education Mega Centre, Guangzhou 510006, China
4
South China Institute of Environmental Sciences, Ministry of Environmental Protection, Guangzhou 510655, China
5
Guangdong Provincial Key Laboratory of Atmospheric Environment and Pollution Control, South China University of Technology, Guangzhou Higher Education Mega Centre, Guangzhou 510006, China
*
Authors to whom correspondence should be addressed.
Molecules 2023, 28(21), 7367; https://doi.org/10.3390/molecules28217367
Submission received: 7 October 2023 / Revised: 22 October 2023 / Accepted: 25 October 2023 / Published: 31 October 2023
(This article belongs to the Section Inorganic Chemistry)

Abstract

:
Adsorption and separation of Xe/Kr are significant for making high-density nuclear energy environmentally friendly and for meeting the requirements of the gas industry. Enhancing the accuracy of the adsorbate model for describing the adsorption behaviors of Xe and Kr in MOFs and the efficiency of the model for predicting the separation potential (SP) value of Xe/Kr separation in MOFs helps in searching for promising MOFs for Xe/Kr adsorption and separation within a short time and at a low cost. In this work, polarizable and transferable models for mimic Xe and Kr adsorption behaviors in MOFs were constructed. Using these models, SP values of 38 MOFs at various temperatures and pressures were calculated. An optimal neural network model called BPNN-SP was designed to predict SP value based on physical parameters of metal center (electronegativity and radius) and organic linker (three-dimensional size and polarizability) combined with temperature and pressure. The regression coefficient value of the BPNN-SP model for each data set is higher than 0.995. MAE, MBE, and RMSE of BPNN-SP are only 0.331, −0.002, and 0.505 mmol/g, respectively. Finally, BPNN-SP was validated by experiment data from six MOFs. The transferable adsorbate model combined with the BPNN-SP model would highly improve the efficiency for designing MOFs with high performance for Xe/Kr adsorption and separation.

Graphical Abstract

1. Introduction

In 2050, high-density nuclear energy is expected to account for a minimum of 15% of China’s primary energy resources, serving as a sustainable alternative to fossil fuels. To achieve this objective, it is crucial to address the radiation emissions resulting from the reprocessing of nuclear waste, specifically the Xe/Kr mixture, during nuclear electricity generation. The longest half-life period for the isotope elements Xe (Xe127) and Kr (Kr85) are 36.4 days and 10.73 years, respectively. By effectively capturing the Xe/Kr mixture produced during reprocessing, high-density nuclear energy can become more environmentally friendly. Furthermore, the properties of xenon (Xe) and krypton (Kr), including their non-flammable inert nature and low boiling points, have led to their widespread application in various industries, such as insulating gases, lighting, imaging, tracer applications, and leak detection, etc. [1,2,3,4]. For instance, Xe is a useful propellant in ion propulsion engines, while Kr can be applied as electric light sources, gas lasers, and in plasma flows. Considering the above, it is significant to develop an effective technology to obtain Xe/Kr mixture or highly purified species, which can not only reduce the radioactive gas emission but also satisfy industrial requirements. However, the inert nature and the extremely low concentration of Xe and Kr (Xe: 0.087 ppmv, Kr: 1.14 ppmv) in the air make it difficult to capture highly purified Xe or Kr. One of the main sources for Xe/Kr mixture, with an 80:20 molar ratio for Kr to Xe, is from the side product stream from a series of steps in producing nitrogen and oxygen. Further treatment is needed for generating highly purified Xe or Kr. Compared to traditional cryogenic distillation, pressure swing adsorption (PSA) can be an alternative method for the adsorption and separation of binary gas mixture due to its high efficiency, energy, and cost saving. Therefore, highly effective PSA technology is indispensable to promote the nuclear electricity energy generation and meet the industrial requirements.
The performance of PSA technology is mainly determined by the adsorbent. In comparison to traditional nanoporous adsorbents, metal-organic frameworks (MOFs), which are assembled by organic linkers and metal nodes, have been widely used throughout several applications, especially in the field of gas adsorption and separation, owing to their high surface area, large pore volume, tunable structure, and rich functionality [5,6,7,8,9,10]. It has been confirmed that MOFs can be a promising platform for adsorption and separation of Xe/Kr mixture with considerable capacity and selectivity [11,12,13,14,15,16,17,18]. PCN-14 [17] exhibited remarkable adsorption capacity of Xe, reaching up to 7.2 mmol/g at 1 bar and 292 K. Meanwhile, a Co-based MOF [18] was reported to possess an impressive selectivity for Xe/Kr mixture, with a value of 69.7. It is worth noting that both adsorption capacity and selectivity of Xe/Kr mixture in MOFs surpass those of traditional materials. Nevertheless, it is a rare occurrence to find MOFs that possess both high adsorption uptake and selectivity of Xe/Kr mixture. To evaluate the adsorption and separation performance of binary gas mixtures in MOFs, certain criteria have been established. One of them is separation potential (SP), which serves as an indicator to reflect the fixed bed breakthrough process. It takes into consideration both adsorption capacity and selectivity in a comprehensive way [19,20]. Nonetheless, the diversity of MOFs presents a challenge when it comes to efficiently and cost-effectively identifying promising MOFs with large SP value for Xe/Kr mixture. Traditional methods for such screening demand a large amount of experimental data, incurring significant costs and time constraints. In view of searching for promising MOFs within a short time and at a low cost, it becomes imperative to unravel the intricate relationship between MOF structures and their performance. A potential solution to this issue involves the application of molecular simulation, high-throughput screening, and the development of an artificial neural network (ANN) model. These approaches offer a more efficient shortcut for addressing this challenge.
Grand Canonical Monte Carlo (GCMC) simulation has been utilized to delve into the intricacies of the adsorption and separation mechanisms of Xe/Kr in MOFs [17,21,22,23,24,25]. However, the traditional models for description of Xe and Kr have poor performance to mimic Xe and Kr adsorption behaviors in some MOFs due to the flaw of the model in expressing adsorbent–adsorbate interaction induced by the polarizability of the adsorbate and the electric field of the adsorbent [17,26]. Previous reports employed correction from density functional theory (DFT) to enhance the accuracy of the model for describing adsorption behaviors of Xe and Kr in MOFs [27,28]. Such correction technology has high precision on specific or several MOFs analogues, but when it comes to the high-throughput screening, this method would consume a lot of time when generating various Lennard-Jones (LJ) parameters because the correction varies with each MOF. Therefore, to develop a universal model for studying the adsorption and separation behaviors of Xe/Kr mixture in MOFs by dealing with the induced polarization issue is significant.
Combined with high-throughput technology, artificial neural network is an effective tool for investigating the correlation between MOF structures and their adsorption performances [23,29,30,31,32,33]. As demonstrated by Cory M. Simon and colleagues, the most favorable environments within MOFs for Xe/Kr separation are characterized by pocket-like, ring-like, tube-like, and cage-like structures. This conclusion was drawn by a screening for Xe/Kr separation performances of 670,000 predicted nanoporous materials including MOFs. They constructed a bond between selectivity and pore size by mathematical models [33]. Seda Keskin et al. investigated 115 different MOFs at their adsorption and separation performance of noble gas mixtures using molecular simulation. Results suggested that MOFs have pore sizes, surface areas, and porosities in the range of 4.3–6.8 Å, 150–1000 m2/g, and 0.37–0.58, respectively [23]. On the strength of textural properties such as pore limiting diameter, largest cavity diameter, surface area, etc., previous methodologies (called product-based prediction methodology) could predict adsorption and separation performance of MOFs or give theoretical guidance for designing MOFs with high performance at specific temperatures and pressures with high accuracy [19,32,34,35,36]. However, such product-based methodology can only predict performance based on textural properties of synthesized or designed MOFs, which is a flaw in terms of saving time and in terms of economic cost. What is more, most of previous prediction models were generated from the GCMC simulation using the traditional model for Xe and Kr. Therefore, there is still room for improving the accuracy of the prediction model as long as it is served by a new universally polarized model. Herein, a prediction methodology (called precursor-based prediction methodology) that can only use physical parameters of MOFs precursors (such as the three-dimensional size of the organic linker with radius and the electronegativity of the metal center) to predict adsorption and separation performance of Xe/Kr mixture in MOFs is proposed, which can help to reduce the time and economic cost for studying the structure–activity relationship and for designing MOFs with excellent performance.
In this study, GCMC simulation was performed to establish universally polarized models for Xe and Kr, which were tested by seven MOFs, including MOFs with various topologies, organic linkers, and metal centers. DFT, high-throughput screening, and ANN modeling were combined to delve into the structure–activity relationship between structures of 38 MOFs and their performance in terms of adsorption and separation of an Xe/Kr mixture at various temperatures (P = 278 K, 288 K, 298 K, 308 K, and 318 K) and pressures (T = 0.1 bar, 0.4 bar, 1 bar, 10 bar, 35 bar, and 50 bar). Finally, the optimal ANN model was validated by experiment data from six MOFs.

2. Results and Discussion

2.1. Adsorption Isotherms of Xe and Kr

The comparison of simulated and experimental adsorption isotherms for Xe and Kr is displayed in Figure 1 and Figure 2. MOFs including M-MOF-74 (M = Mg, Co, Ni, Zn), Cu-BTC, IRMOF-1, and SBMOF-1 were utilized in this study to test the accuracy of the polarizable model and its transferability. Among these MOFs, M-MOF-74 and Cu-BTC are MOFs with open metal sites, while IRMOF-1 and SBMOF-1 are MOFs without open metal sites. In addition, these MOFs consist of various pore size distributions, metal centers, and organic linkers, indicating the diversity of such sets of MOFs. In view of eliminating the effect of difference between theoretical and experimental surface area on the adsorption uptake, the unit of adsorption uptake was cm3/m2, which was transferred from cm3/g (volumetric uptake) divided by m2/g (surface area). As can be seen in Figure 1 and Figure 2, most of the simulated Xe and Kr adsorption isotherms generated by the model without polarization underestimate the adsorption uptake compared with experiment data. The consideration of polarization did enhance adsorbate–adsorbent interaction due to the extra polarization energy, suggesting that adsorption behaviors of Xe and Kr can be restored using the polarization model. All adsorption isotherms of both Xe and Kr in MOFs, except for Xe in SBMOF-1, are in the same shape compared with experimental ones. Of note, not all adsorption uptakes of Xe and Kr can be obviously increased by the impulse of the polarization effect, especially for MOFs without open metal sites such as SBMOF-1 and IRMOF-1, because the contribution of the polarization energy to adsorption uptake is mainly determined by the distribution of the electronic cloud of the metal center. For Xe and Kr adsorption in SBMOF-1, the polarization model can maintain a similar accuracy for the prediction of adsorption isotherms because of almost equal adsorption uptake predicted from models with and without polarization effect.
In order to figure out the accuracy of the model with or without polarization consideration, two types of root-mean-squared errors (RMSE-I and RMSE-II) were generated using the following equations.
R M S E I = N a d s N e x p 2 n
R M S E I I = ( N a d s N e x p N e x p ) 2 n
where Nads and Nexp are adsorption uptake of Xe or Kr from simulation and experiment, respectively. n is the number of data points from the experimental isotherm.
RMSE-I and RMSE-II value for Xe and Kr adsorption in MOFs are listed in Table 1 and Table 2, respectively. As can be seen in Table 1, the RMSE-I value of the traditional np model was reduced from 0.013 cm3/m2 to 0.010 cm3/m2, while the RMSE-II value was reduced from 28% to 19%. For MOFs like Ni-MOF-74 and IRMOF-1, polarization consideration can reduce the RMSE-II value by 50%. Since the polarizability of Kr is much smaller than that of Xe, the effect of polarization consideration on adsorption uptake of Kr should be less than that of Xe, especially in MOFs without open metal sites. However, the polarization model can also get better at mimicking the adsorption behavior of Kr in MOFs. As shown in Table 2, the RMSE-I value of the traditional np model was reduced from 0.005 cm3/m2 to 0.004 cm3/m2, while the RMSE-II value was reduced from 38% to 27%. From the above, we can conclude that the polarization model can well predict adsorption uptakes of Xe and Kr in MOFs with and without open metal sites.

2.2. Selectivity of Xe/Kr Mixture

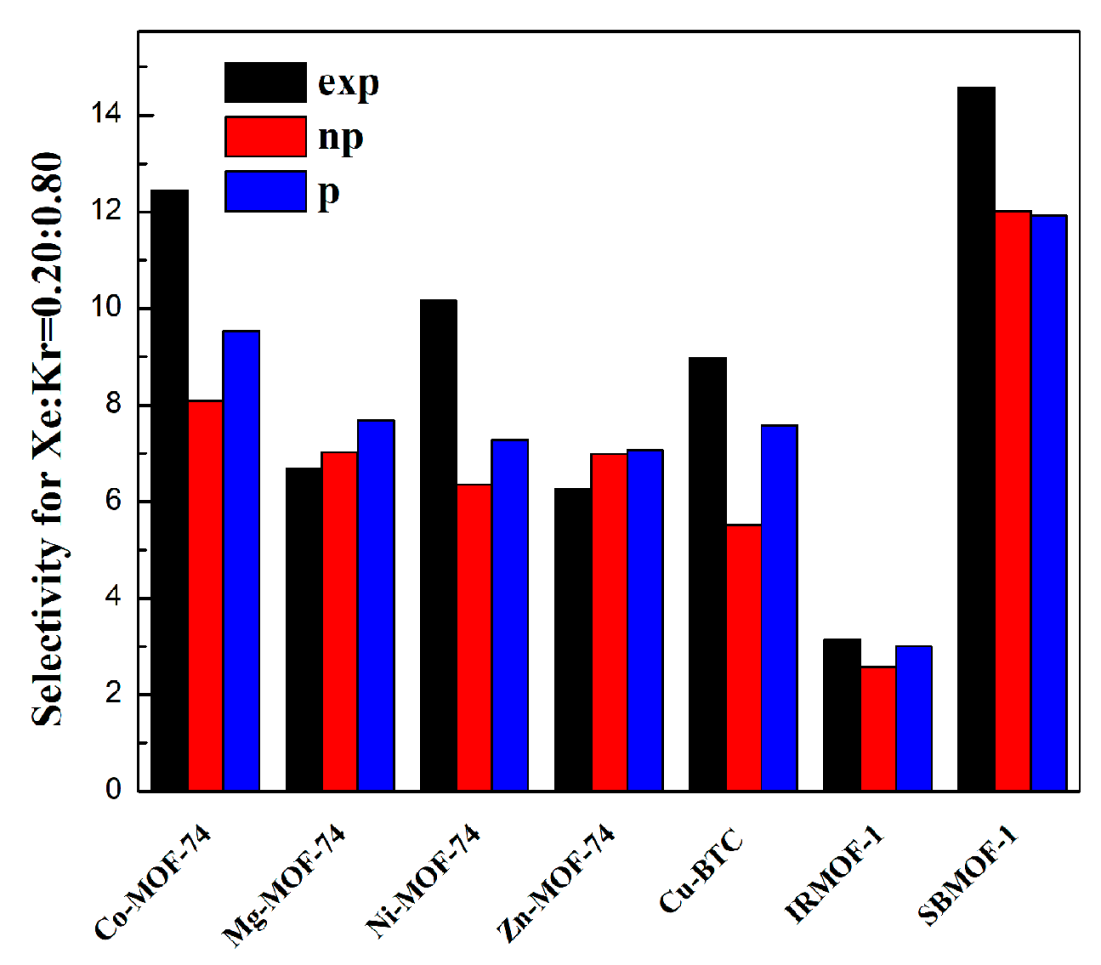
In order to do a comprehensive study on the polarization model, RMSE values (as shown in Table 3) for selectivity of Xe/Kr mixture in MOFs were also tested. Comparisons of selectivities for Xe/Kr mixture in tested MOFs generated from an experiment using IAST and models with or without polarization and GCMC simulation are shown in Figure 3. The reason for using selectivity calculated from a GCMC simulation is that a GCMC simulation can be more accurate in mimicking the adsorbate–adsorbent interaction, which can be influenced by polarization interaction in real time, while IAST cannot well describe such polarization interaction. Futures studies could focus on performances of MOFs at various pressures even higher than 1 bar, using GCMC simulation with polarization consideration to predict selectivity of Xe/Kr mixture in a MOF, which would make the prediction more accurate. As can be seen in Figure 3, simulation without polarization consideration obviously underestimated selectivity of Xe/Kr in some unsaturated MOFs, including Co-MOF-74, Ni-MOF-74, and Cu-BTC. Simulation with polarization consideration could reduce the difference between experiment and simulation for these three saturated MOFs. As can be seen in Table 3, the RMSE-I value for prediction of selectivity was reduced from 2.75 to 1.06, while the RMSE-II value was reduced from 26% to 18%. It can be safely concluded that the polarization model is a transferrable model for describing adsorption and separation performance of Xe/Kr in MOFs well, including those that consist of various metal centers and organic linkers.

2.3. ANN Model

In order to clarify the relationship between the physical parameters of MOF precursors (metal center and organic linker) and the separation potential of the Xe/Kr mixture in a MOF, a new BPNN (back propagation neuron network) model was designed following various trial and error tests. Herein, inputs consist of physical parameters, temperature, and pressure, while the separation potential of the Xe/Kr mixture was set as output data. Firstly, mean absolute error (MAE), mean bias error (MBE), root-mean-squared error (RMSE), and regression coefficient (R) were calculated to compare performances of different models. An optimal model should have the lowest MAE, MBE, and RMSE value with the highest R value, and these were calculated by the following equations.
M A E = 1 N i = 1 N | t a r g e t s i o u t p u t s i |
M B E = 1 N i = 1 N ( t a r g e t s i o u t p u t s i )
R M S E = 1 N i = 1 N ( t a r g e t s i o u t p u t s i ) 2
where targets and outputs refer to the SP value from the GCMC simulation and the prediction by the ANN model.
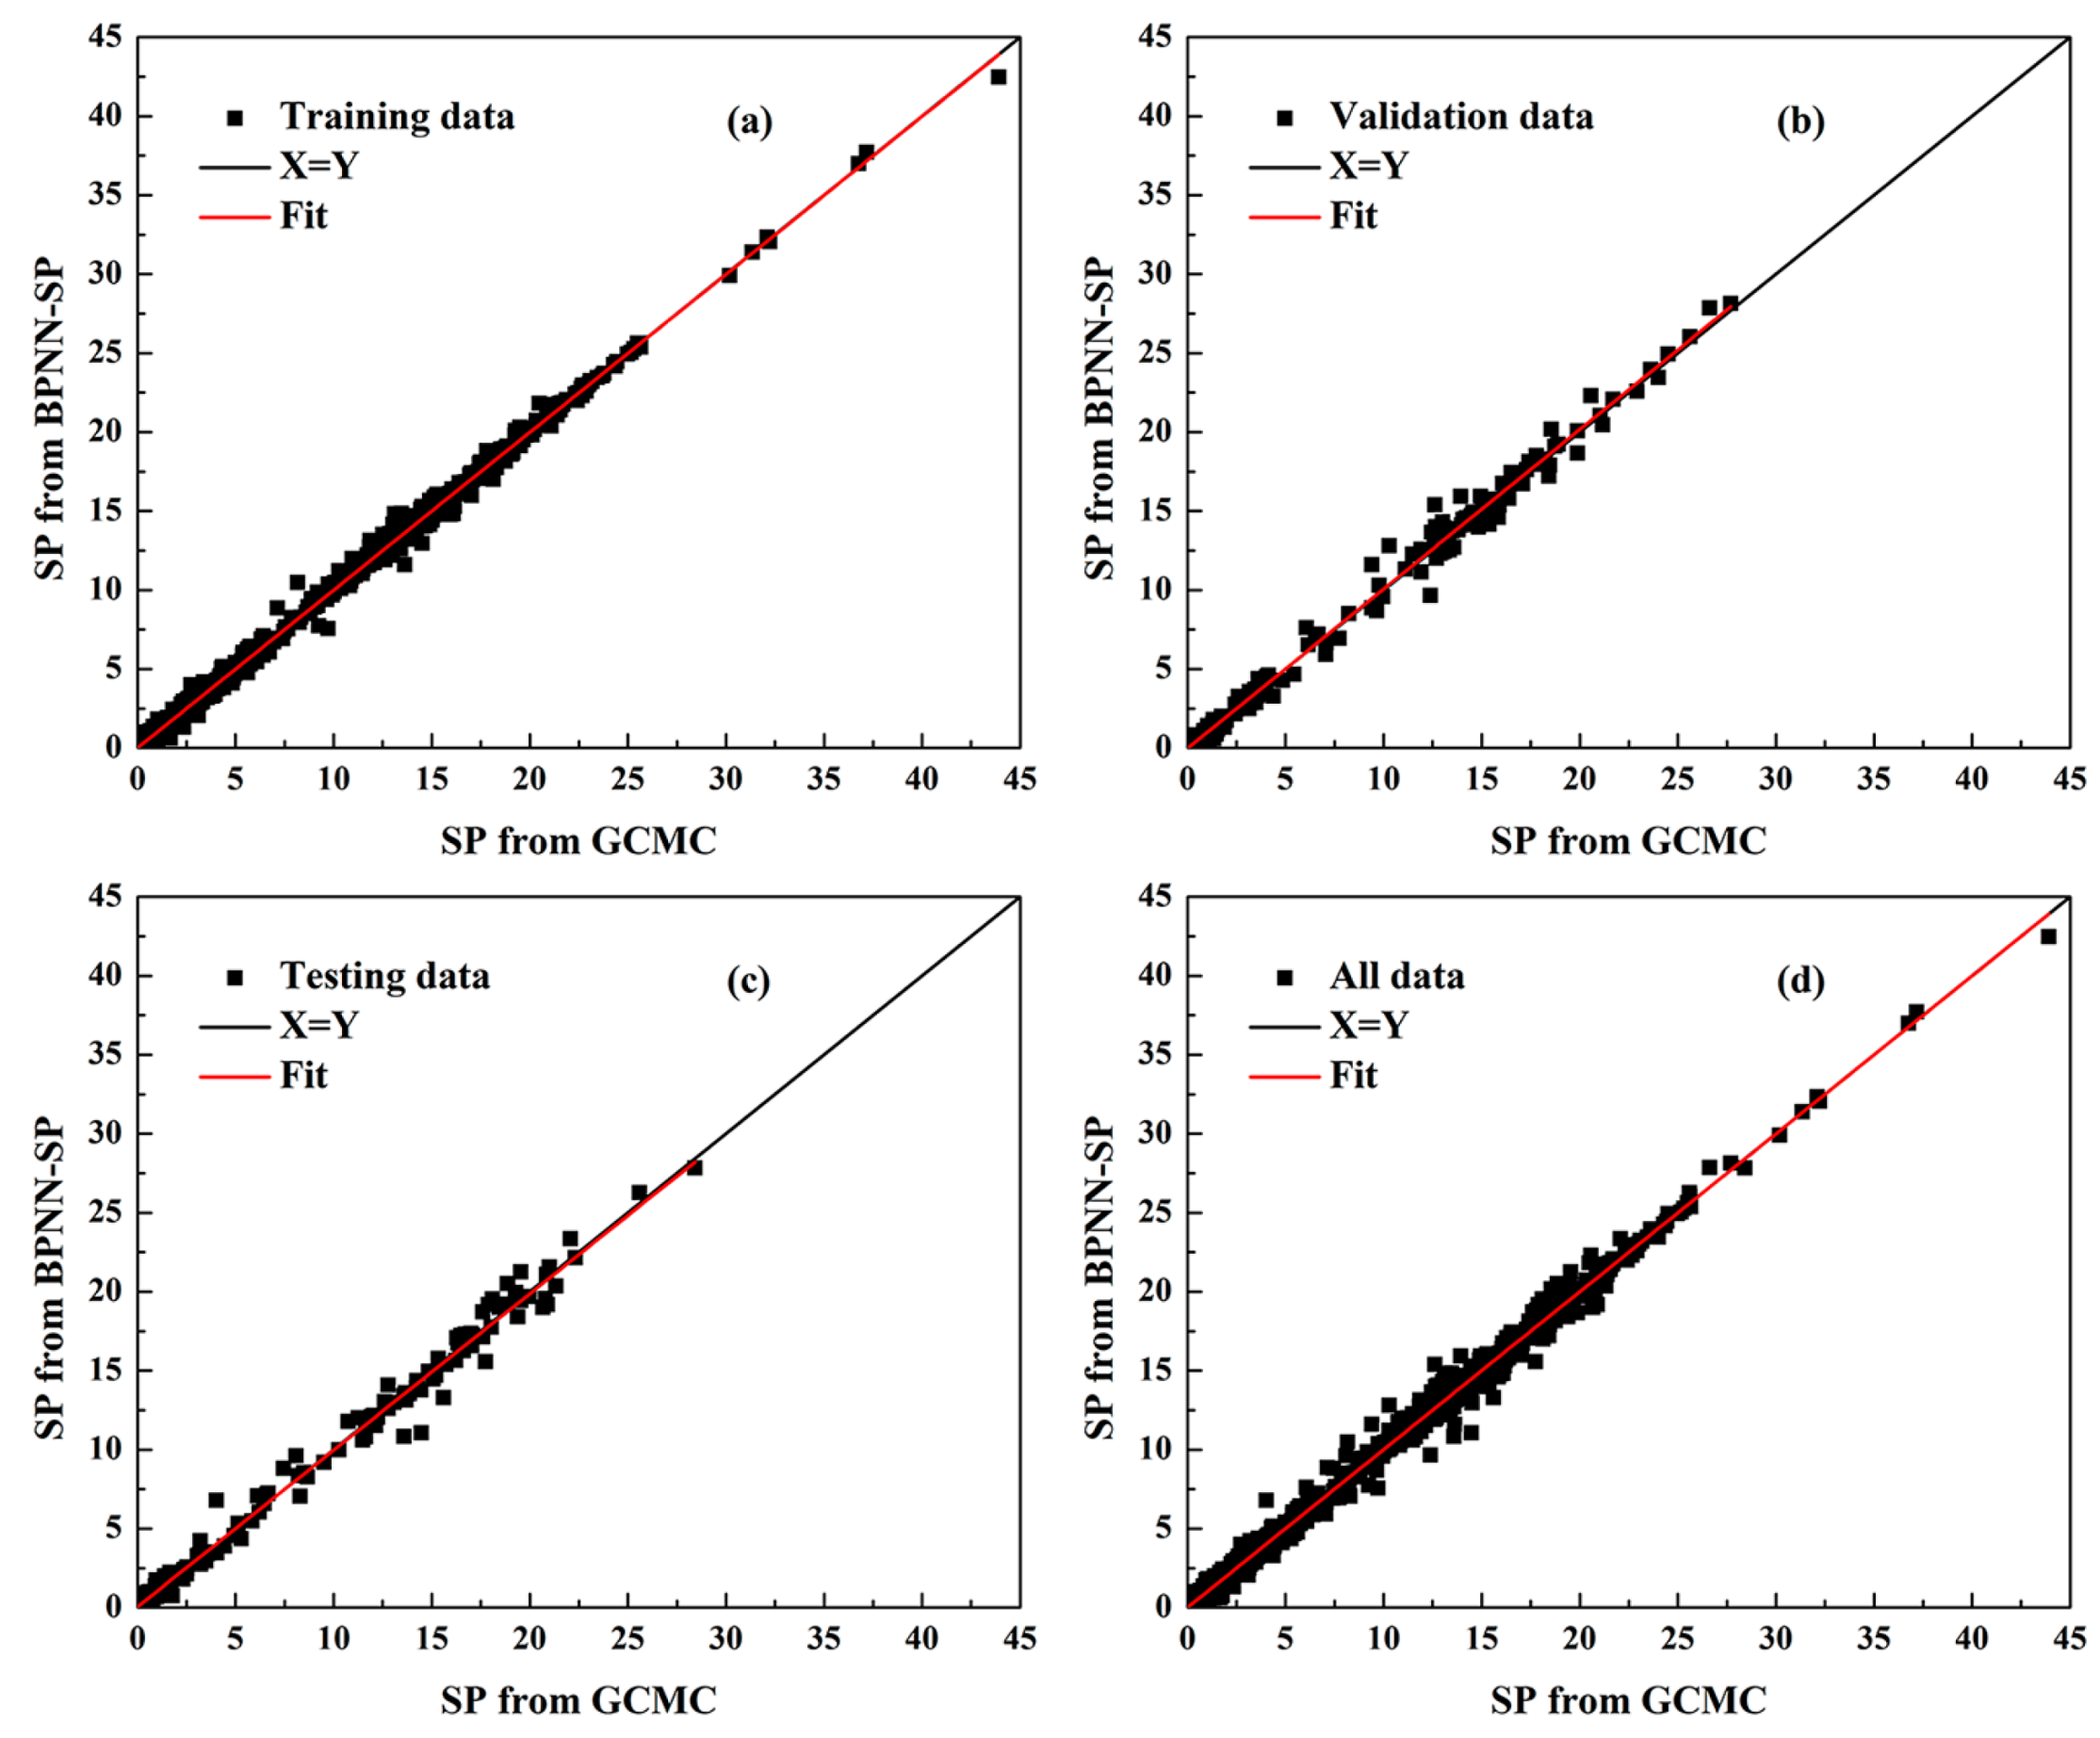
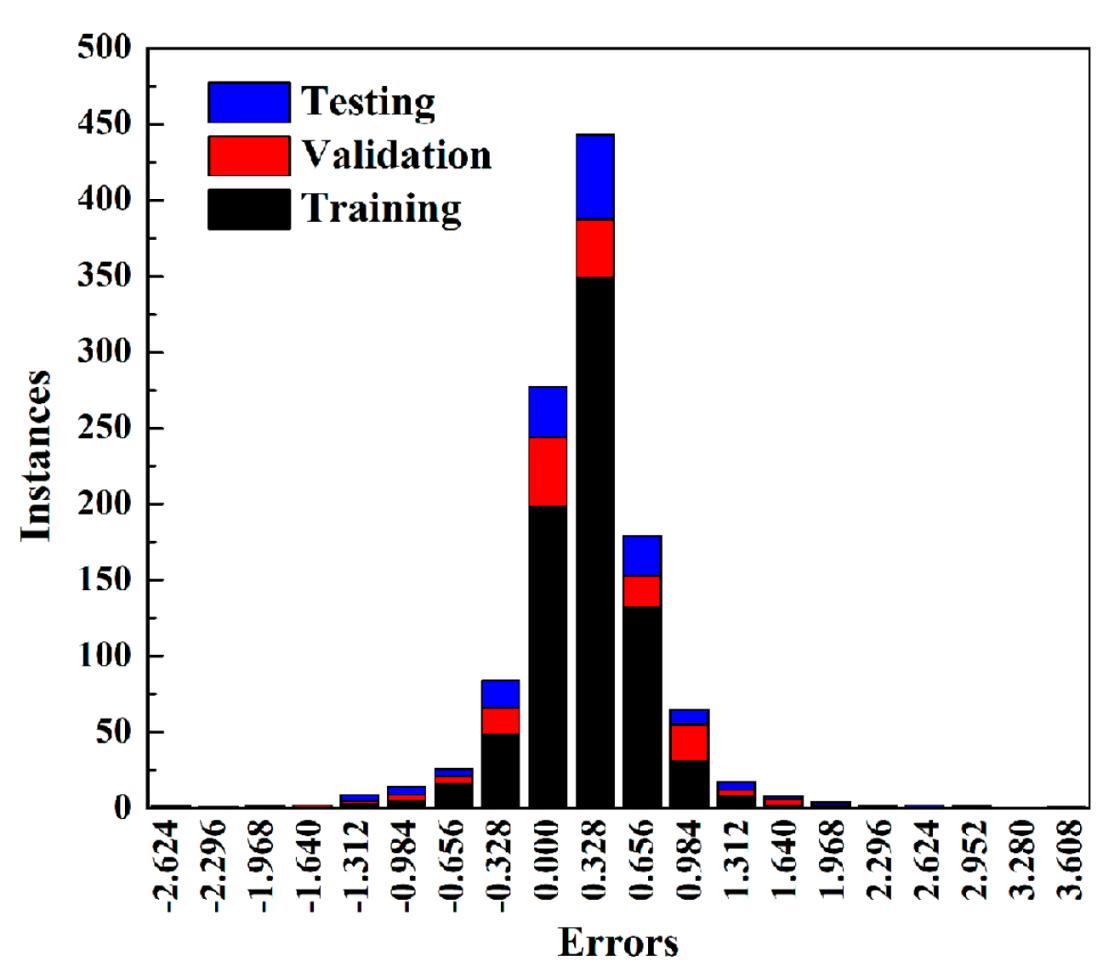
All values for various models are listed in Table 4. Overall, R values for each data set from each model were all larger than 0.96, indicating that the BPNN model appears tailor-made for predicting SP value based on physical parameters of MOF precursors, temperature and pressure with strong associativity. It is obvious that model No. 14 (denoted as BPNN-SP) is the best one with the lowest MAE, MBE, and RMSE values accompanied by the highest R value, which is higher than 0.995 for each data set. It is toted that the MBE value of the BPNN-SP model is only −0.002 mmol/g, while MAE and RMSE are the lowest ones, suggesting that the BPNN-SP model is a well-designed model for predicting the separation factor of Xe/Kr mixture in MOFs at various temperatures and pressures based on the physical parameters of the MOF precursors. In addition, Figure 4 gives an insight on the correlationship between SP values predicted by the BPNN-SP model and those simulated through the GCMC method for each data set. As can be seen in Figure 4, results of SP values from GCMC range from 0 to 42.5 mmol/g. Combining a high R value (larger than 0.995) from Table 4 for each data set, Figure 4 shows that the fit line and diagonal line was highly correlated for each data set. The error histograms for each target from the BPNN-SP model shown in Figure 5 indicate that the maximum error among all data is only 3.608 mmol/g, accounting for just one output from the testing data set. It must be pointed out that those relatively high errors are generated from data with high SP values. Therefore, those relatively high errors virtually also refer to low errors in percentage. What is more, the rate of errors settles in the range of −0.328 mmol/g to 0.328 mmol/g and can go as high as 65.0%. Even better is that about 94.3% of errors stay inside the range of −0.984 mmol/g to 0.984 mmol/g. Finally, the BPNN-SP model can well predict separation potential for Xe/Kr mixture in MOFs at various temperatures and pressures based on the physical parameters of the MOF precursors. The weights and biases of the BPNN-SP model for connection of each neuron and between different layers are listed in the Supplementary Materials S1.

2.4. Sensitivity Analysis

To determine the proportionate influence of each variable within the BPNN-SP model for predicting SP value of Xe/Kr mixture in MOFs, a commonly employed sensitivity analysis approach known as the PaD method was utilized [37,38,39,40]. In comparison to alternative sensitivity analysis techniques, the PaD method in this study offers greater stability and reliability with clear contribution for input variables. The core concept behind the PaD method involves computing partial derivates of the output, generated by input variables, taking into account the relative weights and biases in each layer. Herein, the partial derivates of output, associated with each variable, can be calculated using
N o x i = k = 1 n j = 1 m [ W k , l ( 1 N k 2 ) W j , k ( 1 N j 2 ) W i , j ]
where No is the output derived from the last transfer function, namely the separation potential for Xe/Kr mixture predicted by the BPNN-SP model. Both m and n are 20 and 10, which point to the number of neurons in two hidden layers. Wij, Wjk, and Wkl refer to weight linked to each neuron in each layer. The relative contribution of each input variable was generated by the sum of the squared partial derivatives (SSDi), which was calculated by
S S D i = γ = 1 Z ( N o x i ) γ 2
where Z is the number of all data, which is equal to 1140, and γ is the index of data point. Finally, the percentage contribution of each input variable was generated using
c o n t r i b u t i o n   o f   i t h   v a r i a b l e   % = S S D i i = 1 n S S D i × 100
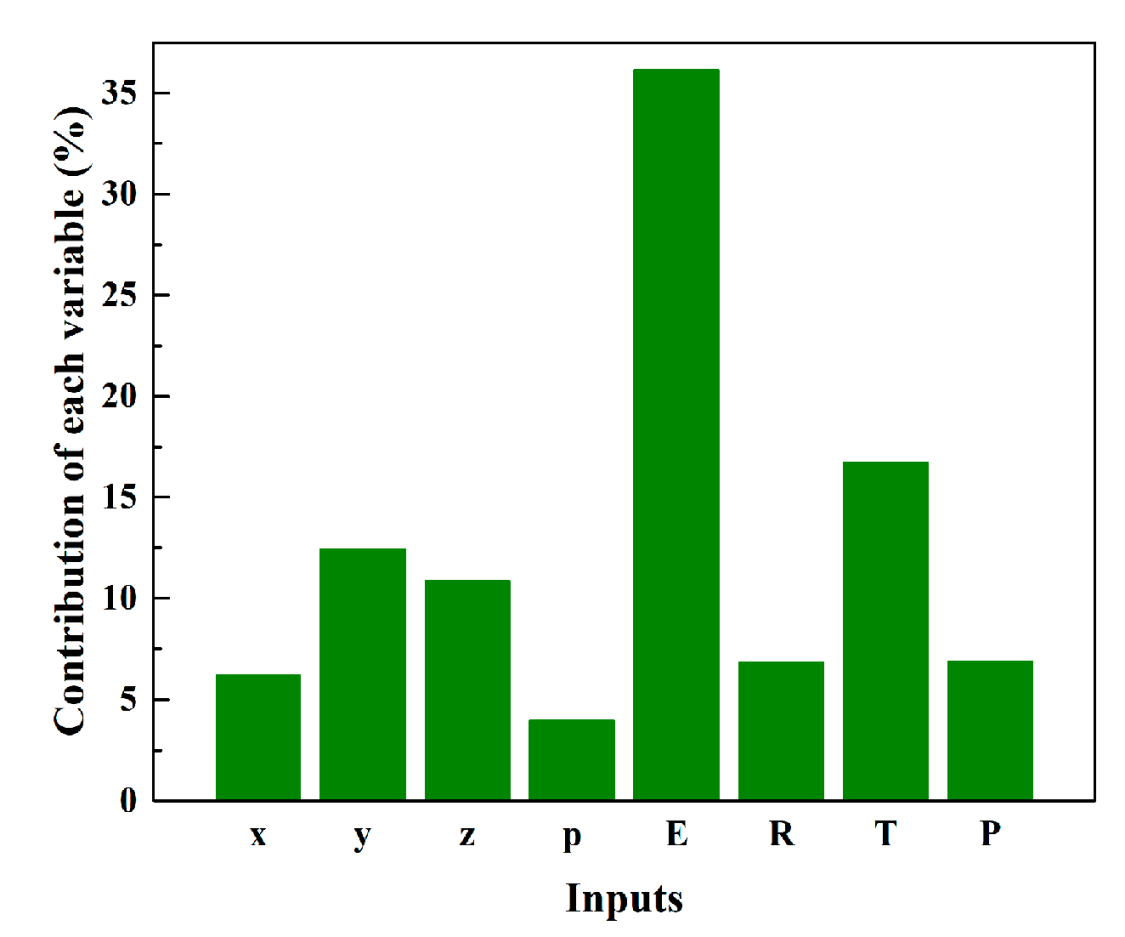
The percentage contribution of each variable for predicting SP value is shown in Figure 6. As shown in Figure 6, percentage contribution of electronegativity (E, 36.12%) is much larger than other variables, implying the important role that induced energy plays in the adsorption and separation of Xe/Kr. The expression for calculating induced energy suggests that the energy could be more easily influenced by the electric field because of the secondary power. What is more, electronegativity can indirectly reflect the strength of the electric field of the metal center. This is also the reason that the insertion of induced energy can obviously enhance the accuracy of the traditional model. The radius of the metal center refers to the exposure of the metal center to adsorbates. This is to say, a larger radius can increase the contact environment for the metal center to interact with adsorbates. However, the strength of the metal–adsorbate interaction is firstly decided by the electronegativity of the metal center. Therefore, the percentage contribution of the radius is obviously smaller than that of electronegativity. In terms of physical parameters of the organic linker, all of them get comparable percentage contribution, which follow the order of sizey > sizez > sizex > polarizability. It suggests that three-dimensional size is more significant than the polarizability of the organic linker for SP value. Combined with the radius of the metal center, three-dimensional size of the organic linker can be a descriptor for the pore size of a MOF. More importantly, the strength of the linker–adsorbate interaction is influenced to some degree by the pore size in terms of noble gas adsorption in MOFs. A small pore size can promote the synergistic effect from various organic linkers in a small cage. Then the polarizability of the organic linker is the second important factor to influence the linker–adsorbate interaction. The strength of the polarizability refers to the concentration degree of electron density of the organic linker, which can also reflect the electric field that the organic linker can afford for the polarized noble gas molecule. It can certainly be concluded that the metal center plays a more significant role in adsorption and separation of Xe/Kr mixture in MOFs. The diffusivity and adsorption uptake of the adsorbate varies at different temperatures and pressures, which can directly influence the SP value of a MOF by the difference caused by various T and P on Xe and Kr. Therefore, the influence of temperature and pressure cannot be ignored.

2.5. Validation of ANN Model

Experiment data from six MOFs (NOTT-100, NOTT-101, NOTT-102, NOTT-103, PCN-14, and UiO-66), which consist of various organic linkers, metal centers, and topologies from previous reports [17,41], were selected to validate the reliability and generalizability of the BPNN-SP model. Since pressures of experimental gas adsorption isotherms for these selected MOFs only lay between 0 to 1 bar, only comparisons between SP values generated from experiment data and the BPNN-SP model at 0.1, 0.4, and 1 bar were made. As can be seen in Table 5, SP values from the BPNN-SP are similar to those from experiment data for related MOFs. It is noted that MOFs selected for validation of the BPNN-SP model possess various metal centers, organic linkers, and topologies; the examination of the reliability of the BPNN-SP model in this work is comprehensive. In addition, the RMSE value of the SP values predicted from the BPNN-SP model, compared with that from experiment data, is only 0.248 mmol/g. It is worth noting that predicted SP values for pressure at 0.1 bar have a relatively larger deviation compared with those at 0.4 bar and 1 bar. The main reason for this phenomenon is that uptakes of both Xe and Kr at 0.1 bar are so small that adsorbate molecules cannot adequately interact with an adsorption site, such as the metal center or the organic linker. Another reason is that the simulated model for a MOF is an ideal model so that the density of adsorption site in the simulated model may be richer than that in the experimental model. These two reasons result in the minification on the effect of polarizability and electronegativity on the adsorption and separation of Xe/Kr. As the uptake of Xe or Kr increases with the increasing pressure, the degree of involvement of each physical parameter for MOFs precursors increases because adsorbates gradually occupy adsorption sites and the pore of MOFs. It can be safely concluded that predicted SP values will be close to experimental ones at higher pressures. Therefore, the BPNN-SP model trained in this work should be a reliable and precise model for predicting SP values for adsorption and separation of Xe/Kr in MOFs based on the physical parameters of MOFs precursors.

3. Methods

3.1. Model Construction and Structure Characterization

Models of existing MOFs for testing the polarized model of Xe and Kr were from Cambridge Crystal Data Centre (CCDC). The theoretical MOFs models for further study of the structure–activity relationship were derived from existing MOFs by replacing the metal center. The MOFs set in this study consists of M-BTC (M = Cu, Co, Fe, Mo, Ti, Ru), M-TDPAT (M = Cu, Co, Fe, Mo, Ti, Ru), M-IRMOF-1 (M = Zn, Fe, Cd, Ni), M-IRMOF-6 (M = Zn, Fe, Cd, Ni), M-IRMOF-7 (M = Zn, Fe, Cd, Ni), M-IRMOF-10 (M = Zn, Fe, Cd, Ni), M-MOF-74 (M = Co, Cu, Fe, Mg, Mn, Ni, Ti, V, Zn), and Ca-SBMOF-1. Note that all MOFs in this study are experimentally existing or theoretically feasible according to previous reports [16,28,42,43,44,45]. All MOFs models were then optimized using Forcite Module from Materials Studio 7.0 [46] with ultrafine quality, which has been widely applied in optimization of a MOF model [47,48,49,50]. The convergence criteria for energy are 1 × 10⁻⁵ kcal/mol, force is 0.5 × 10⁻⁵ kcal/mol/Å, and displacement is 1.0 × 10⁻⁶ Å. All optimized structures remained regular and intact. To determine physical parameters, such as three-dimensional size and polarizability of the organic linker, the organic linker should be cut from the MOF unit cell. To maintain the integrity of the ligand’s structure, hydrogen atoms were added at the points where the structure was cut. Subsequently, the organic linker underwent optimization using Gaussian 09 [51], employing the m06/6-311 + g(d,p) basis set. Simultaneously, polarizability of the linker was calculated using the same basis set. Multiwfn 3.8 [52] was employed to generate three-dimensional size, denoted as sizex, sizey and sizez for the optimized organic linker. Herein, sizex represents the length of the organic linker, while sizey corresponds to the direction parallel to the carboxyl group. Sizez is vertical to the xy plane, providing insight into the thickness of the organic linker. Followed by sizey and sizez, the largest value among the three-dimensional size points to sizex for an organic linker with irregular shape.

3.2. Simulation Details

Grand Canonical Monte Carlo (GCMC) simulation was conducted in the RASPA 2.0 [53]. In the simulation, the adsorbent-adsorbate and adsorbate-adsorbate Van der Waals interaction was descried using Lennard-Jones potential [54]. The crosses-interaction was expressed by Lorentz–Berthelot mixing rules.
U i j = 4 ε i j [ σ i j r i j 12 σ i j r i j 6 ]
ε i j = ( ε i × ε j ) 1 2
σ i j = 1 2 ( σ i + σ j )
where ε and σ are energy well depth and Van der Waals radius, respectively. rij refers to the distance between atom i and j.
Combined with universal force field (UFF) [55] for metal atom, Dreiding force field [56] for non-metal atom was used to describe the atom from the adsorbent. Xe and Kr were both considered as single-atom sites with force field parameters from previous reports. Details of force field parameters for all atoms are listed in Table S1 in Supplementary Materials S2.
Besides VDW interaction, there is an induction energy (Uind) induced by the polarized effect on the adsorbate from the electric field of the adsorbent. Only polarization between adsorbent and adsorbate was considered. The field was described by charge from EQEq calculation. In this simulation, induced dipoles μi were calculated as follows [57]:
μ i = α i · E i 0
where αi is the static dipole polarizability of the adsorbate molecule, E i 0 refers to the electric field created from the interaction site i of the framework. αi for Xe and Kr in this work were set as 1.5 Å3 and 0.924 Å3, respectively.
The induction energy Uind can be generated by the accumulation of the static electric field on the interaction site pointing to the static dipole polarizabilities [57].
U i n d = 1 2 i = 1 n α i · | E i 0 | 2
where n is the total amount of interaction sites of the moved adsorbate molecule. The model with and without polarization effect are denoted as p and np model, respectively. It is noted that the calculation of induction energy neglects the back-polarization.
The cutoff for the simulation is 12.8 Å, so lattices of all MOFs cells should be kept at least 25.6 Å. Adsorption uptakes for pure Xe and Kr at various temperatures and pressures were calculated. The Peng–Robinson equation of state was employed to translate fugacity into pressure [58]. To facilitate a comparison between simulations and experimental data, the absolute uptake (Nabs) was transformed into excess uptake (Nexc) by
N e x c = N a b s ρ g V
where ρg and V are the gas density under specific condition and the pore volume of the framework determined by applying the ideal gas law [59].
The Dual-Sites Langmuir–Freundlich (DSLF) model was used to fit the simulated and experimental pure gas adsorption isotherms for further calculation about selectivities of Xe/Kr mixture in MOFs.
Q = q m , 1 × b 1 p n 1 1 + b 1 p n 1 + q m , 2 × b 2 p n 2 1 + b 2 p n 2
where Q represents the equilibrium uptake at pressure p for the bulk gas, qm,i signifies the saturation loading at site i, bi stands for the adsorption affinity coefficient of site i and ni pertains to the deviation from an ideal homogenous surface.
With the fitting parameters from the DSLF model, Ideal Adsorbed Solution Theory (IAST) [60], which has been widely used to evaluate the selectivity of gas mixture in a MOF [5,61,62], was employed for generating selectivity of Xe/Kr mixture in MOFs. The selectivity was described as
S i j = x i x j y j y i
where xi and xj denote the molar fraction of component i and j within the adsorbed phase, while yi and yj indicate the molar fraction of component i and j in the gas phase.
SP, which can embody the potential of a MOF when used in fixed bed adsorption, was chosen to be the performance descriptor in this study.
S P = N a d s , X e × y K r y X e N a d s , K r
where Nads,Xe and Nads,Kr are adsorption uptake of Xe and Kr from the mixture in MOFs, respectively. yXe and yKr refer to molar fraction of Xe and Kr.

3.3. ANN Model

To establish the connection between MOFs and their SP values for Xe/Kr mixture, artificial neural network was employed. The objective was to develop an optimal model for predicting SP values for MOFs, utilizing textural characteristics of MOFs precursors, as well as temperature and pressure as inputs. The back propagation neural network (BPNN) model, a well-established ANN technology, has found extensive application in the analysis of the structure–activity relationship between MOFs and their performances [63,64,65,66].
Figure 7 shows the workflow of a typical BPNN model, which consists of an input layer comprising input data, one or more hidden layers comprising some neurons in each layer, and an output layer comprising output data. Levenberg−Marquardt optimization as the training function of the BPNN model used in this work is a faster method that can more easily avoid trapping to local minima compared with other optimization methods. Each layer was interlinked by transfer functions (TF1, TF2, and TF3), which are expressed as follows:
T F 1 = 1 1 + e n
T F 2 = T F 3 = 2 1 + e ( 2 n ) 1
where n is the output from the former layer.
Combined with transfer function, weight (W) and bias (B) were employed to enlarge the freedom of data distribution and adjust data to be approximately equal with target data. w is updated by
d W = M × d W p r e v + ( 1 M ) × L R × g W
where M is equal to 0.9 for momentum constant, Wprev refers to weight in previous training, LR is equal to 0.01 for learning rate, and gW is the random gradient for a weight.
With the changing W and B, data in hidden layer and output layer were transferred by transfer function through the following equation.
Y = T F 3 k = 1 l T F 2 j = 1 k T F 1 i = 1 j X i W i j + B j W j k + B k W k l + B l
where i, j, k, and l are input layer, 1st hidden layer, 2nd hidden layer, and output layer, respectively. Xi is the input data.
On account of the efficiency and ease of handling, a widely used cross validation technique known as “hold-out” was implemented to prevent overtraining of the BPNN model during the modeling process. Within the training process, the data set was divided into three distinct subsets: training, validation, and testing data, with the respective proportions of 70%:15%:15%. All subsets were randomly extracted from the main dataset.
In this study, physical parameters, such as the three-dimensional size and the polarizability of organic linkers along with the radius and electronegativity of the metal center were considered in conjunction with varying temperature and pressure ranges as inputs, while SP values of Xe/Kr mixture in MOFs at each temperature and pressure were the outputs. The springboard of setting the three-dimensional size of the organic linker as input data was that it can partly reflect the pore size or topology of the structure, while the polarizability of the organic linker was used to recognize the adsorbent–adsorbate interaction. In addition, adsorbent–adsorbate interaction was partly influenced by the property of the metal center, which was described by the electronegativity. Moreover, the value of electronegativity, which points to the electro-withdrawing property, can determine bond length of the metal center and binding site that form the organic linker. The radius of the metal center can give an index to the coordination environment that the metal center can afford for the organic linker. Moreover, the radius of the metal center can to some degree determine the room for noble gas interacting with metal center.

4. Conclusions

In this study, a polarizable and transferable model for describing adsorption and separation of Xe/Kr in MOFs was developed. The reliability of the polarizable model was tested by comparison between adsorption isotherms and selectivities generated from simulation and experiment for MOFs, which consist of various metal centers, organic linkers, topologies, and pore size distributions. The RMSE-I values for Xe and Kr adsorption were decreased from 0.013 to 0.010 cm3/m2 and 0.005 to 0.004 cm3/m2, respectively. The RMSE-II values for Xe and Kr adsorption were reduced from 28% to 19% and 38% to 27%, respectively. In terms of the performance of the polarizable model on selectivity, the RMSE-I value for prediction of selectivity was reduced from 2.75 to 1.06, while the RMSE-II value was reduced from 26% to 18% compared with traditional models.
Based on the polarizable and transferable model, high-throughput screening for SP value of Xe/Kr in MOFs was performed in order to design a BPNN model for the prediction of the SP value of Xe/Kr in MOFs based on the physical parameters of the metal center (electronegativity and radius) and the organic linker (three-dimensional size and polarizability). An optimal BPNN model (called BPNN-SP) was constructed through various trial and error tests. Regression coefficient values of the BPNN-SP model for all data sets are higher than 0.995, while values of MAE, MBE, and RMSE are only 0.331, −0.002, and 0.505 mmol/g. About 94.3% of errors stay inside the range of −0.984 mmol/g to 0.984 mmol/g. It should be highlighted that the range of SP values for tested MOFs is from 0 to 42.5 mmol/g. Such a model with high accuracy was then validated by experiment data from six MOFs. The data suggest that the BPNN-SP model tested in this study could be a reliable precursor-based model for predicting the SP value of Xe/Kr mixture in MOFs at various temperatures and pressures.

Supplementary Materials

The following supporting information can be downloaded at: https://www.mdpi.com/article/10.3390/molecules28217367/s1, Table S1: LJ parameters for atoms of each adsorbate and adsorbent.

Author Contributions

Conceptualization, Z.L. and H.X.; methodology, Z.L. and H.Y.; software, Q.X. and H.X.; validation, F.X. and B.H.; writing—original draft preparation, Z.L. and J.Y.; writing—review and editing, all authors. All authors have read and agreed to the published version of the manuscript.

Funding

This research was funded by National Key Research and Development Program (No. 2019YFC1805804), National Natural Science Foundation of China (No. 21576094), Guangdong Basic and Applied Basic Research Foundation (Nos. 2022A1515011192, 2023A1515010679, 2020A1515110234, 2020A1515110325), Guangzhou Basic and Applied Basic Research Foundation (No. 202102020653) and China Postdoctoral Science Foundation (2021M691059).

Institutional Review Board Statement

Not applicable.

Informed Consent Statement

Not applicable.

Data Availability Statement

Data is contained within the article and Supplementary Materials.

Conflicts of Interest

The authors declare no conflict of interest.

References

  1. Holsträter, T.F.; Georgieff, M.; Föhr, K.J.; Klingler, W.; Uhl, M.E.; Walker, T.; Köster, S.; Grön, G.; Adolph, O. Intranasal application of xenon reduces opioid requirement and postoperative pain in patients undergoing major abdominal surgery: A randomized controlled trial. Anesthesiology 2011, 115, 398–407. [Google Scholar] [CrossRef] [PubMed]
  2. Chen, L.; Reiss, P.S.; Chong, S.Y.; Holden, D.; Jelfs, K.E.; Hasell, T.; Little, M.A.; Kewley, A.; Briggs, M.E.; Stephenson, A.; et al. Separation of rare gases and chiral molecules by selective binding in porous organic cages. Nat. Mater. 2014, 13, 954–960. [Google Scholar] [CrossRef]
  3. Auer, M.; Kumberg, T.; Sartorius, H.; Wernsperger, B.; Schlosser, C. Ten years of development of equipment for measurement of atmospheric radioactive xenon for the verification of the CTBT. Pure Appl. Geophys. 2010, 167, 471–486. [Google Scholar] [CrossRef]
  4. Hoff, P.W.; Swingle, J.C.; Rhodes, C.K. Observations of stimulated emission from high-pressure krypton and argon/xenon mixtures. Appl. Phys. Lett. 1973, 23, 245–246. [Google Scholar] [CrossRef]
  5. Gong, W.; Xie, Y.; Pham, T.D.; Shetty, S.; Son, F.A.; Idrees, K.B.; Chen, Z.; Xie, H.; Snurr, R.Q.; Chen, B.L.; et al. Creating optimal pockets in a clathrochelate-based metal–organic framework for gas adsorption and separation: Experimental and computational studies. J. Am. Chem. Soc. 2022, 144, 3737–3745. [Google Scholar] [CrossRef] [PubMed]
  6. Sun, W.; Hu, J.; Duttwyler, S.; Wang, L.; Krishna, R.; Zhang, Y. Highly selective gas separation by two isostructural boron cluster pillared MOFs. Sep. Purif. Technol. 2022, 283, 120220. [Google Scholar] [CrossRef]
  7. Cai, Z.; Bien, C.E.; Liu, Q.; Wade, C.R. Insights into CO2 adsorption in M–OH functionalized MOFs. Chem. Mater. 2020, 32, 4257–4264. [Google Scholar] [CrossRef]
  8. He, X.; Chen, D.R.; Wang, W.N. Bimetallic metal-organic frameworks (MOFs) synthesized using the spray method for tunable CO2 adsorption. Chem. Eng. J. 2020, 382, 122825. [Google Scholar] [CrossRef]
  9. Wang, S.; Cheng, M.; Luo, L.; Ji, X.; Liu, C.; Bi, K.; Zhou, L. High-throughput screening of metal-organic frameworks for hydrogen purification. Chem. Eng. J. 2023, 451, 138436. [Google Scholar] [CrossRef]
  10. Duan, C.; Yu, Y.; Li, J.; Li, L.; Huang, B.; Chen, D.; Xi, H. Recent advances in the synthesis of monolithic metal-organic frameworks. Sci. China Mater. 2021, 64, 1305–1319. [Google Scholar] [CrossRef]
  11. Wang, T.; Peng, Y.L.; Lin, E.; Niu, Z.; Li, P.; Ma, S.; Zhao, P.; Chen, Y.; Cheng, P.; Zhang, Z. Robust bimetallic ultramicroporous metal-organic framework for separation and purification of noble gases. Inorg. Chem. 2020, 59, 4868–4873. [Google Scholar] [CrossRef] [PubMed]
  12. Lee, S.J.; Yoon, T.U.; Kim, A.R.; Kim, S.Y.; Cho, K.H.; Hwang, Y.K.; Yeon, J.W.; Bae, Y.S. Adsorptive separation of xenon/krypton mixtures using a zirconium-based metal-organic framework with high hydrothermal and radioactive stabilities. J. Hazard. Mater. 2016, 320, 513–520. [Google Scholar] [CrossRef] [PubMed]
  13. Mohamed, M.H.; Elsaidi, S.K.; Pham, T.; Forrest, K.A.; Schaef, H.T.; Hogan, A.; Wojtas, L.; Xu, W.; Space, B.; Zaworotko, M.J.; et al. Hybrid Ultra-microporous materials for selective xenon adsorption and separation. Angew. Chem. Int. Ed. Engl. 2016, 55, 8425–8429. [Google Scholar] [CrossRef]
  14. Xiong, S.; Gong, Y.; Hu, S.; Wu, X.; Li, W.; He, Y.; Chen, B.; Wang, X. A microporous metal–organic framework with commensurate adsorption and highly selective separation of xenon. J. Mater. Chem. A 2018, 6, 4752–4758. [Google Scholar] [CrossRef]
  15. Gong, W.; Wang, X.; Kirlikovali, K.O.; Idrees, K.B.; Sha, F.; Xie, H.; Liu, Y.; Chen, B.; Cui, Y.; Farha, O.K. Programmed polarizability engineering in a cyclen-based cubic Zr(IV) metal–organic framework to boost Xe/Kr Separation. J. Am. Chem. Soc. 2023, 145, 2679–2689. [Google Scholar] [CrossRef]
  16. Banerjee, D.; Simon, C.M.; Plonka, A.M.; Motkuri, R.K.; Liu, J.; Chen, X.; Smit, B.; Parise, J.B.; Haranczyk, M.; Thallapally, P.K. Metal-organic framework with optimally selective xenon adsorption and separation. Nat. Commun. 2016, 7, ncomms11831. [Google Scholar] [CrossRef]
  17. Perry, J.J.; Teich, M.S.L.; Meek, S.T.; Greathouse, J.A.; Haranczyk, M.; Allendorf, M.D. Noble gas adsorption in metal–organic frameworks containing open metal sites. J. Phys. Chem. C 2014, 118, 11685–11698. [Google Scholar] [CrossRef]
  18. Li, L.Y.; Guo, L.; Zhang, Z.G.; Yang, Q.W.; Yang, Y.W.; Bao, Z.B.; Ren, Q.L.; Li, J. A robust squarate-based metal–organic framework demonstratesrecord-high affinity and selectivity for xenon over krypton. J. Am. Chem. Soc. 2019, 141, 9358–9364. [Google Scholar] [CrossRef]
  19. Altintas, C.; Avci, G.; Daglar, H.; Azar, A.N.V.; Velioglu, S.; Erucar, I.; Keskin, S. Database for CO2 separation performances of MOFs based on computational materials screening. ACS Appl. Mater. Interfaces 2018, 10, 17257–17268. [Google Scholar] [CrossRef]
  20. Krishna, R. Screening metal–organic frameworks for mixture separations in fixed-bed adsorbers using a combined selectivity/capacity metric. RSC Adv. 2017, 7, 35724–35737. [Google Scholar] [CrossRef]
  21. Fu, X.; Li, Z.; Liu, Q.; Guan, H.; Wang, Y. Microporous metal–organic framework with cage-within-cage structures for xenon/krypton separation. Ind. Eng. Chem. Res. 2022, 61, 7397–7402. [Google Scholar] [CrossRef]
  22. Magdysyuk, O.V.; Adams, F.; Liermann, H.P.; Spanopoulos, I.; Trikalitis, P.N.; Hirscher, M.; Morris, R.E.; Duncan, M.J.; McCormick, L.J.; Dinnebier, R.E. Understanding the adsorption mechanism of noble gases Kr and Xe in CPO-27-Ni, CPO-27-Mg, and ZIF-8. Phys. Chem. Chem. Phys. 2014, 16, 23908–23914. [Google Scholar] [CrossRef] [PubMed]
  23. Sumer, Z.; Keskin, S. Molecular simulations of MOF adsorbents and membranes for noble gas separations. Chem. Eng. Sci. 2017, 164, 108–121. [Google Scholar] [CrossRef]
  24. Tao, Y.; Fan, Y.; Xu, Z.; Feng, X.; Krishna, R.; Luo, F. Boosting selective adsorption of Xe over Kr by double-accessible open-metal site in metal-organic framework: Experimental and theoretical research. Inorg. Chem. 2010, 59, 11793–11800. [Google Scholar] [CrossRef] [PubMed]
  25. Xiong, X.L.; Chen, G.H.; Xiao, S.T.; Ouyang, Y.G.; Li, H.B.; Wang, Q. New discovery of metal–organic framework UTSA-280: Ultrahigh adsorption selectivity of krypton over xenon. J. Phys. Chem. C 2020, 124, 14603–14612. [Google Scholar] [CrossRef]
  26. Meek, S.T.; McGoldrick, S.L.T.; Perry, J.J.; Greathouse, J.A.; Allendorf, M.D. Effects of polarizability on the adsorption of noble gases at low pressures in monohalogenated isoreticular metal–organic frameworks. J. Phys. Chem. C 2012, 116, 19765–19772. [Google Scholar] [CrossRef]
  27. Demir, H.; Greathouse, J.A.; Staiger, C.L.; Perry, J.J.; Allendorf, M.D.; Sholl, D.S. DFT-based force field development for noble gas adsorption in metal organic frameworks. J. Mater. Chem. A 2015, 3, 23539–23548. [Google Scholar] [CrossRef]
  28. Vazhappilly, T.; Ghanty, T.K.; Jagatap, B.N. Computational modeling of adsorption of Xe and Kr in M-MOF-74 metal organic frame works with different metal atoms. J. Phys. Chem. C 2016, 120, 10968–10974. [Google Scholar] [CrossRef]
  29. Halder, P.; Singh, J.K. High-throughput screening of metal–organic frameworks for ethane–ethylene separation using the machine learning technique. Energy Fuels 2020, 34, 14591–14597. [Google Scholar] [CrossRef]
  30. Feng, M.; Cheng, M.; Ji, X.; Zhou, L.; Dang, Y.; Bi, K.; Dai, Z.; Dai, Y. Finding the optimal CO2 adsorption material: Prediction of multi-properties of metal-organic frameworks (MOFs) based on DeepFM. Sep. Purif. Technol. 2022, 302, 122111. [Google Scholar] [CrossRef]
  31. Liu, X.; Wang, R.; Wang, X.; Xu, D. High-throughput computational screening and machine learning model for accelerated metal-organic frameworks discovery in toluene vapor adsorption. J. Phys. Chem. C 2023, 127, 11268–11282. [Google Scholar] [CrossRef]
  32. Sikora, B.J.; Wilmer, C.E.; Greenfield, M.L.; Snurr, R.Q. Thermodynamic analysis of Xe/Kr selectivity in over 137 000 hypothetical metal–organic frameworks. Chem. Sci. 2012, 3, 2217–2223. [Google Scholar] [CrossRef]
  33. Simon, C.M.; Mercado, R.; Schnell, S.K.; Smit, B.; Haranczyk, M. What are the best materials to separate a xenon/krypton mixture? Chem. Mater. 2015, 27, 4459–4475. [Google Scholar] [CrossRef]
  34. Avci, G.; Velioglu, S.; Keskin, S. High-throughput screening of MOF adsorbents and membranes for H2 purification and CO2 capture. ACS Appl. Mater. Interfaces 2018, 10, 33693–33706. [Google Scholar] [CrossRef]
  35. Rogacka, J.; Seremak, A.; Luna, T.A.; Formalik, F.; Matito, M.I.; Firlej, L.; Calero, S.; Kuchta, B. High-throughput screening of metal-organic frameworks for CO2 and CH4 separation in the presence of water. Chem. Eng. J. 2021, 403, 126392. [Google Scholar] [CrossRef]
  36. Altintas, C.; Erucar, I.; Keskin, S. High-throughput computational screening of the metal organic framework database for CH4/H2 separations. ACS Appl. Mater. Interfaces 2018, 10, 3668–3679. [Google Scholar] [CrossRef]
  37. Ozonoh, M.; Oboirien, B.O.; Higginson, A.; Daramola, M.O. Performance evaluation of gasification system efficiency using artificial neural network. Renew. Energy 2020, 145, 2253–2270. [Google Scholar] [CrossRef]
  38. Zheng, Z.Y.; Guo, X.N.; Zhu, K.X.; Peng, W.; Zhou, H.M. Artificial neural network—Genetic algorithm to optimize wheat germ fermentation condition: Application to the production of two anti-tumor benzoquinones. Food. Chem. 2017, 227, 264–270. [Google Scholar] [CrossRef]
  39. Chenar, S.S.; Deng, Z. Development of artificial intelligence approach to forecasting oyster norovirus outbreaks along Gulf of Mexico coast. Environ. Int. 2018, 111, 212–223. [Google Scholar] [CrossRef]
  40. An, J.; He, G.; Qin, F.; Li, R.; Huang, Z. A new framework of global sensitivity analysis for the chemical kinetic model using PSO-BPNN. Comput. Chem. Eng. 2018, 112, 154–164. [Google Scholar] [CrossRef]
  41. Yan, Z.; Gong, Y.; Chen, B.; Wu, X.; Liu, Q.; Cui, L.; Xiong, S.; Peng, S. Methyl functionalized Zr-Fum MOF with enhanced xenon adsorption and separation. Sep. Purif. Technol. 2020, 239, 116514. [Google Scholar] [CrossRef]
  42. Borycz, J.; Tiana, D.; Haldoupis, E.; Sung, J.C.; Farha, O.K.; Siepmann, J.I.; Gagliardi, L. CO2 adsorption in M-IRMOF-10 (M = Mg, Ca, Fe, Cu, Zn, Ge, Sr, Cd, Sn, Ba). J. Phys. Chem. C 2016, 120, 12819–12830. [Google Scholar] [CrossRef]
  43. Lahoz, M.F.D.; Calero, S.; Gutiérrez, S.J.J.; Martin, C.A. Adsorptive separation of ethane and ethylene using isoreticular metal-organic frameworks. Microporous Mesoporous Mater. 2017, 248, 40–45. [Google Scholar] [CrossRef]
  44. Wu, Y.; Chen, H.Y.; Xiao, J.; Liu, D.F.; Liu, Z.W.; Qian, Y.; Xi, H.X. Adsorptive separation of methanol-acetone on isostructural series of metal-organic frameworks M-BTC (M = Ti, Fe, Cu, Co, Ru, Mo): A computational study of adsorption mechanisms and metal-substitution impacts. ACS Appl. Mater. Interfaces 2015, 7, 26930–26940. [Google Scholar] [CrossRef]
  45. Liu, K.; Li, B.; Li, Y.; Li, X.; Yang, F.; Zeng, G.; Peng, Y.; Zhang, Z.; Li, G.; Shi, Z.; et al. An N-rich metal-organic framework with an rht topology: High CO2 and C2 hydrocarbons uptake and selective capture from CH4. Chem. Commun. 2014, 50, 5031–5033. [Google Scholar] [CrossRef]
  46. Biovia Software Inc. Materials Studio, v7.0; Biovia Software Inc.: San Diego, CA, USA, 2023.
  47. Altintas, C.; Acvi, G.; Daglar, H.; Azar, A.N.V.; Erucar, I.; Velioglu, S.; Keskin, S. An extensive comparative analysis of two MOF databases: High-throughput screening of computation-ready MOFs for CH4 and H2 adsorption. J. Mater. Chem. A 2019, 7, 9593–9608. [Google Scholar] [CrossRef]
  48. Liu, Z.W.; Zhang, K.; Wu, Y.; Xi, H.X. New functionalized IRMOF-10 with strong affinity for methanol: A simulation study. Appl. Surf. Sci. 2018, 440, 351–358. [Google Scholar] [CrossRef]
  49. Wu, X.; Peng, L.; Xiang, S.; Cai, W. Computational design of tetrazolate-based metal-organic frameworks for CH4 storage. Phys. Chem. Chem. Phys. 2018, 20, 30150–30158. [Google Scholar] [CrossRef]
  50. Liu, Z.W.; Zhang, K.; Xia, Q.B.; Wang, X.J.; Huang, B.C.; Xi, H.X. Predicting adsorption and separation performance indicators of Xe/Kr in metal-organic frameworks via a precursor-based neural network model. Chem. Eng. Sci. 2021, 243, 116772. [Google Scholar] [CrossRef]
  51. Frisch, M.J.; Trucks, G.W.; Schlegel, H.B. GAUSSIAN 09, Rev. D.1; Gaussian, Inc.: Wallingford, CT, USA, 2009. [Google Scholar]
  52. Lu, T.; Chen, F. Multiwfn: A multifunctional wavefunction analyzer. J. Comput. Chem. 2012, 33, 580–592. [Google Scholar] [CrossRef]
  53. Dubbeldam, D.; Calero, S.; Ellis, D.E.; Snurr, R.Q. RASPA: Molecular simulation software for adsorption and diffusion in flexible nanoporous materials. Mol. Simul. 2015, 42, 81–101. [Google Scholar] [CrossRef]
  54. Barker, J.A.; Henderson, D. What is “liquid”? Understanding the states of matter. Rev. Mod. Phys. 1976, 48, 587–671. [Google Scholar] [CrossRef]
  55. Rappé, A.K.; Casewit, C.J.; Colwell, K.S.; Goddard III, W.A.; Skif, W.M. UFF, a full periodic table force field for molecular mechanics and molecular dynamics simulations. J. Am. Chem. Soc. 1992, 114, 10024–10035. [Google Scholar] [CrossRef]
  56. Stephen, L.M.; Olafson, B.D.; Goddard III, W.A. DREIDING: A generic force field for molecular simulations. J. Phys. Chem. 1990, 94, 8897–8909. [Google Scholar]
  57. Becker, T.M.; Triguero, A.L.; Luna, J.M.V.; Lin, L.C.; Dubbeldam, D.; Calero, S.; Vlugt, T.J.H. Potential of polarizable force fields for predicting the separation performance of small hydrocarbons in M-MOF-74. Phys. Chem. Chem. Phys. 2018, 20, 28848–28859. [Google Scholar] [CrossRef]
  58. Düren, T.S.; Snurr, R.Q. Assessment of isoreticular metal–organic frameworks for adsorption separations: A molecular simulation study of methane/n-butane mixtures. J. Phys. Chem. B 2004, 108, 15703–15708. [Google Scholar] [CrossRef]
  59. Talu, O.; Myers, A.L. Molecular simulation of adsorption: Gibbs dividing surface and comparison with experiment. AIChE J. 2001, 47, 1160–1168. [Google Scholar] [CrossRef]
  60. Myers, A.L.; Prausnitz, J.M. Thermodynamics of mixed-gas adsorption. AIChE J. 1965, 11, 121–127. [Google Scholar] [CrossRef]
  61. Pai, S.; Ahmed, R.; Manna, A.; Das, M. Potential of a pH-stable microporous MOF for C2H2/C2H4 and C2H2/CO2 gas separations under ambient conditions. Inorg. Chem. 2022, 61, 18293–18302. [Google Scholar]
  62. Liu, X.; Tang, Y.; Yang, G.; Wang, Y. Porous functional metal–organic frameworks (MOFs) constructed from different N-heterocyclic carboxylic ligands for gas adsorption/separation. CrystEngComm. 2023, 25, 896–908. [Google Scholar] [CrossRef]
  63. Esfandiari, K.; Ghoreyshi, A.A.; Jahanshahi, M. Using Artificial neural network and ideal adsorbed solution theory for predicting the CO2/CH4 selectivities of metal–organic frameworks: A comparative study. Ind. Eng. Chem. Res. 2017, 56, 14610–14622. [Google Scholar] [CrossRef]
  64. Liang, H.; Yang, W.; Peng, F.; Liu, Z.; Liu, J.; Qiao, Z.W. Combining large-scale screening and machine learning to predict the metal-organic frameworks for organosulfurs removal from high-sour natural gas. APL Mater. 2019, 7, 091101. [Google Scholar] [CrossRef]
  65. Ye, F.; Ma, S.; Tong, L.; Xiao, J.; Bénard, P.; Chahine, R. Artificial neural network based optimization for hydrogen purification performance of pressure swing adsorption. Int. J. Hydrogen Energy 2019, 44, 5334–5344. [Google Scholar] [CrossRef]
  66. Isiyaka, H.A.; Jumbri, K.; Sambudi, N.S.; Zango, Z.U.; Abdullah, N.A.F.; Saad, B.; Mustapha, A. Adsorption of dicamba and MCPA onto MIL-53(Al) metal–organic framework: Response surface methodology and artificial neural network model studies. RSC Adv. 2020, 10, 43213–43224. [Google Scholar] [CrossRef] [PubMed]
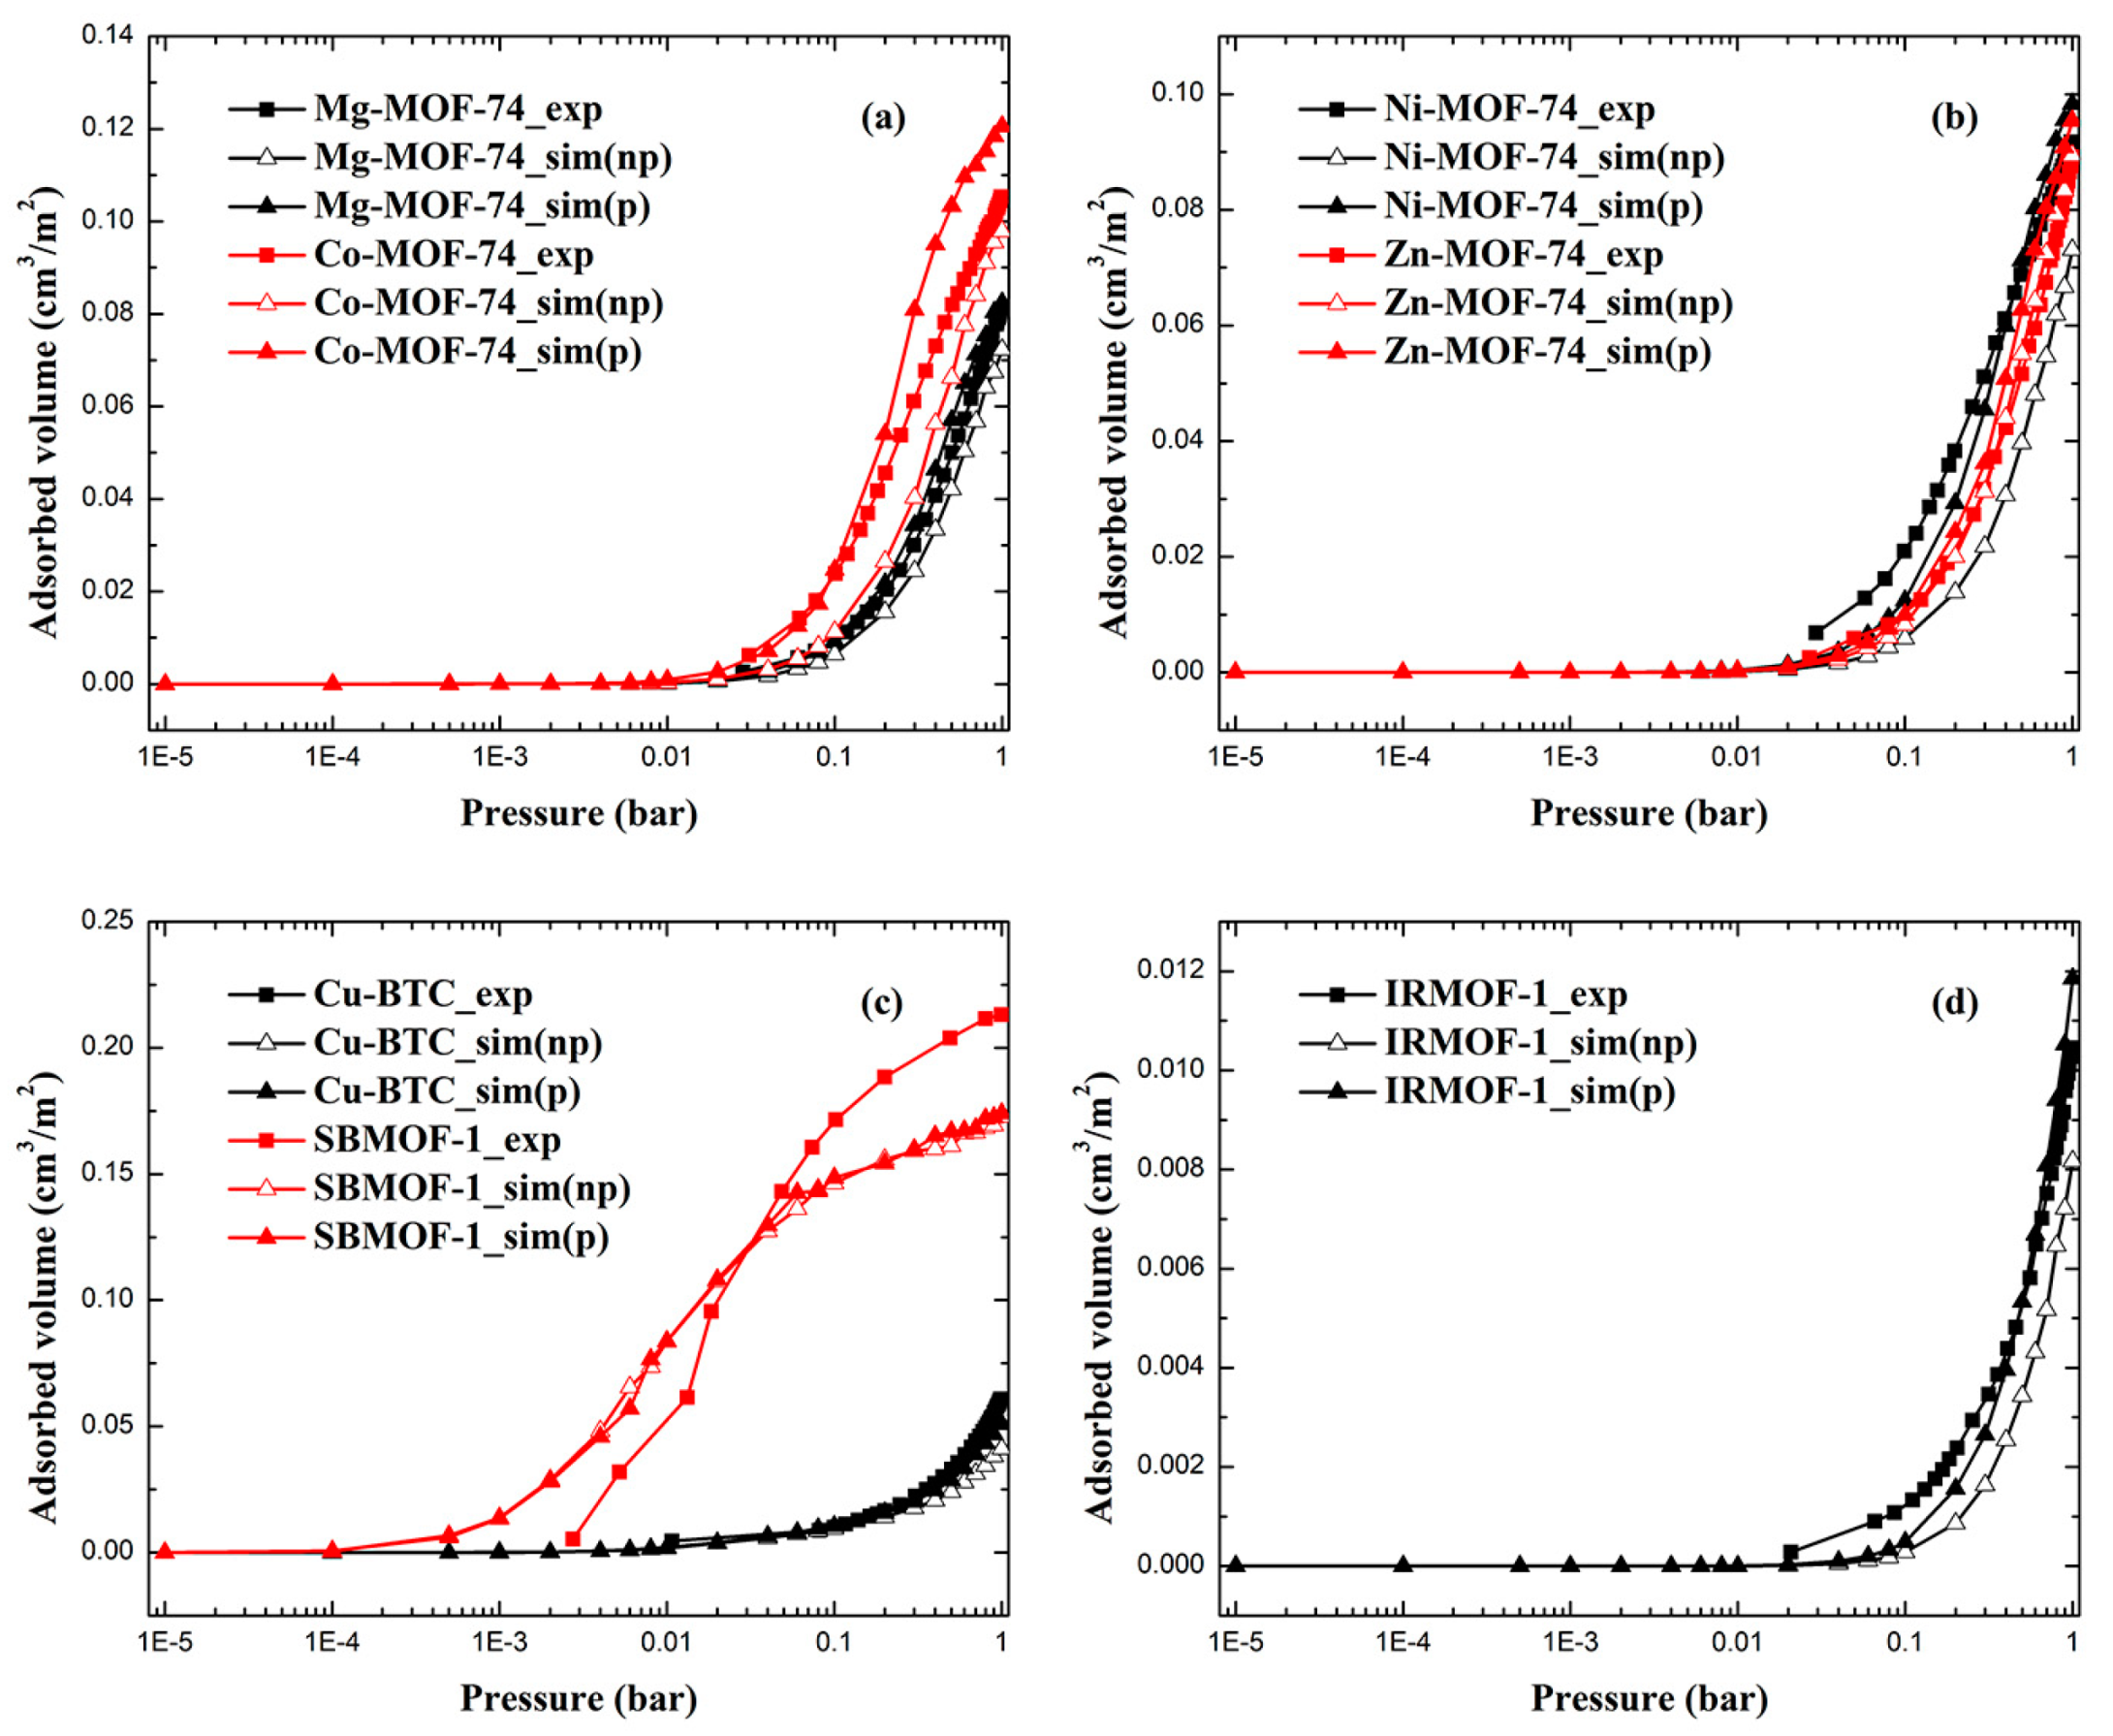
Figure 1. The comparison between simulated and experimental adsorption isotherms of Xe in (a) Mg-MOF-74, Co-MOF-74; (b) Ni-MOF-74, Zn-MOF-74; (c) Cu-BTC, SBMOF-1 and (d) IRMOF-1 (np: model without polarization, p: model with polarization).
Molecules 28 07367 g001
Figure 2. The comparison between simulated and experimental adsorption isotherms of Kr in (a) Mg-MOF-74, Co-MOF-74; (b) Ni-MOF-74, Zn-MOF-74; (c) Cu-BTC, SBMOF-1 and (d) IRMOF-1 (np: model without polarization, p: model with polarization).
Molecules 28 07367 g002
Figure 3. Comparison of selectivities for Xe/Kr mixture in tested MOFs obtained by experiment and models with and without polarization.
Molecules 28 07367 g003
Figure 4. Comparison of SP value from GCMC and BPNN-SP for (a) Training data; (b) Validation data; (c) Testing data, and (d) All data.
Molecules 28 07367 g004
Figure 5. Error histograms of numbers of each target from the BPNN-SP model.
Molecules 28 07367 g005
Figure 6. Percentage contribution of each variable for predicting SP value. (x sizex, y: sizey, z: sizez, p: polarizability, E: electronegativity, R: radius, T: temperature, P: pressure).
Molecules 28 07367 g006
Figure 7. Schematic diagram of the BPNN model for prediction of SP value based on eight inputs.
Molecules 28 07367 g007
Table 1. RMSE-I and RMSE-II values for Xe adsorption in each MOF calculated from model with and without polarization consideration. (np: model without polarization, p: model with polarization.)
RMSE-I (cm3/m2)RMSE-II (%)
nppnpp
Mg-MOF-740.0070.0041810
Co-MOF-740.0120.0163018
Ni-MOF-740.0230.0064724
Zn-MOF-740.0020.009914
Cu-BTC0.0130.0062713
SBMOF-10.0310.0302323
IRMOF-10.0020.0014229
Average0.0130.0102819
Table 2. RMSE-I and RMSE-II values for Kr adsorption in each MOF calculated from model with and without polarization consideration. (np: model without polarization, p: model with polarization.)
RMSE-I (cm3/m2)RMSE-II (%)
nppnpp
Mg-MOF-740.0030.0013723
Co-MOF-740.0040.0044024
Ni-MOF-740.0080.0026029
Zn-MOF-740.0030.0013322
Cu-BTC0.0010.0011519
SBMOF-10.0160.0181416
IRMOF-10.0010.0016554
Average0.0050.0043827
Table 3. Selectivities values from IAST based on experiment data, GCMC based on model without and with polarization consideration, and corresponding RMSE values. (np: model without polarization, p: model with polarization.)
IASTnpp
Co-MOF-7412.448.099.53
Mg-MOF-746.687.027.68
Ni-MOF-7410.176.367.28
Zn-MOF-746.256.997.07
Cu-BTC8.985.517.58
IRMOF-13.142.583.01
SBMOF-114.5612.0211.92
RMSE-I 2.751.06
RMSE-II 26%18%
Table 4. Network architectures for prediction of SP and errors associated with each architecture.
ModelNetwork ArchitectureError Types (mmol/g)Regression Coefficient
MAEMBERMSETrainingValidationTestingAll Data
15-11.277 0.249 1.813 0.975 0.966 0.971 0.973
210-11.034 0.008 1.594 0.979 0.978 0.977 0.979
320-10.643 −0.055 0.966 0.995 0.985 0.987 0.992
430-10.568 −0.059 0.905 0.996 0.988 0.985 0.993
540-10.697 −0.018 1.100 0.992 0.986 0.983 0.990
650-10.623 −0.008 0.997 0.995 0.984 0.984 0.992
760-10.656 0.085 1.193 0.994 0.976 0.974 0.988
85-2-11.096 0.024 1.579 0.983 0.971 0.970 0.979
95-5-10.938 0.064 1.377 0.985 0.985 0.982 0.984
1010-2-10.812 −0.029 1.195 0.990 0.987 0.977 0.988
1110-5-10.555 0.036 0.811 0.995 0.992 0.994 0.995
1210-10-10.440 0.000 0.701 0.997 0.993 0.993 0.996
1320-5-10.499 0.041 0.768 0.997 0.992 0.992 0.995
14 (BPNN-SP)20-10-10.331 −0.002 0.505 0.999 0.996 0.995 0.998
1520-20-10.356 0.002 0.620 0.999 0.992 0.992 0.997
1630-10-10.345 0.003 0.648 0.999 0.990 0.992 0.997
1730-20-10.575 −0.001 0.973 0.996 0.981 0.988 0.992
1830-30-10.755 −0.314 1.119 0.992 0.986 0.988 0.990
1940-10-10.432 0.039 0.812 0.999 0.986 0.983 0.995
2040-20-10.542 −0.032 0.927 0.997 0.986 0.984 0.993
2140-30-10.445 −0.052 0.845 0.998 0.988 0.985 0.994
2240-40-10.597 0.007 0.961 0.996 0.986 0.982 0.992
Table 5. Comparison between SP values calculated from experiment data and the BPNN-SP model.
MOFsTemperature (K)Pressure (Bar)SP_EXP (mmol/g)SP_BPNN (mmol/g)
NOTT-1002920.10.820 1.295
NOTT-1002920.43.013 3.179
NOTT-10029216.380 6.387
NOTT-1012920.10.388 0.460
NOTT-1012920.41.463 1.289
NOTT-10129213.401 3.046
NOTT-1022920.10.179 0.261
NOTT-1022920.40.632 0.517
NOTT-10229211.403 1.522
NOTT-1032920.10.311 0.337
NOTT-1032920.41.207 0.823
NOTT-10329212.873 2.961
PCN-142920.10.335 0.683
PCN-142920.42.366 2.158
PCN-1429215.461 5.446
UiO-662980.10.345 0.884
UiO-662980.41.163 1.300
UiO-6629812.227 2.069
RMSE 0.248
Disclaimer/Publisher’s Note: The statements, opinions and data contained in all publications are solely those of the individual author(s) and contributor(s) and not of MDPI and/or the editor(s). MDPI and/or the editor(s) disclaim responsibility for any injury to people or property resulting from any ideas, methods, instructions or products referred to in the content.