Article

A Ratiometric Fluorescent Probe for N2H4 Having a Large Detection Range Based upon Coumarin with Multiple Applications

School of Pharmaceutical Sciences, Jining Medical University, Rizhao 276826, China
*
Author to whom correspondence should be addressed.
Molecules 2023, 28(22), 7629; https://doi.org/10.3390/molecules28227629
Submission received: 11 October 2023 / Revised: 4 November 2023 / Accepted: 8 November 2023 / Published: 16 November 2023
(This article belongs to the Special Issue Fluorescent Probe: Design, Synthesis and Application)

Abstract

:
Although hydrazine (N2H4) is a versatile chemical used in many applications, it is toxic, and its leakage may pose a threat to both human health and environments. Consequently, the monitoring of N2H4 is significant. This study reports a one-step synthesis for coumarin-based ratiometric fluorescent probe (FP) CHAC, with acetyl as the recognition group. Selected deprotection of the acetyl group via N2H4 released the coumarin fluorophore, which recovered the intramolecular charge transfer process, which caused a prominent fluorescent, ratiometric response. CHAC demonstrated the advantages of high selectivity, a strong capacity for anti-interference, a low limit of detection (LOD) (0.16 μM), a large linear detection range (0–500 μM), and a wide effective pH interval (6–12) in N2H4 detection. Furthermore, the probe enabled quantitative N2H4 verifications in environmental water specimens in addition to qualitative detection of N2H4 in various soils and of gaseous N2H4. Finally, the probe ratiometrically monitored N2H4 in living cells having low cytotoxicity.

Graphical Abstract

1. Introduction

Hydrazine (N2H4) is a significantly active alkali as well as a reducing agent that has been widely applied in medicine, pesticides, materials, and dyes [1,2,3]. Furthermore, N2H4 is a well-known, high-energy fuel broadly employed in propulsion systems such as missiles and rockets [4,5]. However, N2H4 is a highly toxic substance, whose leakage in manufacturing, usage, transferring, and disposal can cause serious environmental problems. Furthermore, N2H4 can enter the human body via breathing and skin contact, thus leading to serious damage of the kidneys, liver, central nervous system, and lungs, which can also induce gene mutation or cancers [6,7,8]. The U.S. Environmental Protection Agency (EPA) has classified N2H4 as a candidate carcinogen with a 10 ppb (0.31 μM) threshold limit value [9]. Consequently, the development of simple and reliable methods that enable the detection of N2H4 trace amounts in the environment and living organisms is of utmost importance.
Several analysis technologies have been proposed to detect N2H4, such as chromatography [10], spectrophotometry [11], electrochemistry [12], potentiometry [13], and surface-enhanced Raman spectroscopy [14]. However, the majority of these technologies are costly, laborious, and require complex analytical procedures, greatly restricting their application to living biological specimens. Fluorescence-based methods, meanwhile, have been broadly applied to verify different analytes, including metal ions, anions, and biomolecules, because of their simple operation, high sensitivity, good selectivity, non-invasiveness, and good biocompatibility [15,16]. Several selective N2H4 fluorescent probes (FPs) with various recognition mechanisms [17,18], including selective deprotection [19,20,21,22]; reaction with diketones to form rings [23,24]; reactions with aromatic aldehydes, dicyanovinyl, or monocyanovinyl to form hydrazones [25,26,27,28,29]; cleavage of carbon–carbon double bonds to form hydrazones [30,31]; and hydrazine-induced ring-opening reactions [32,33] have been reported. However, many of these probes still possess disadvantages, such as their complex synthesis, narrow pH range, low sensitivity, and small detection range, which have limited their application. Furthermore, most hydrazine-based FPs adopt a fluorescence turn-on or turn-off strategy, and these single-emitting FPs are easily interfered with by probe concentrations, instrumental factors, and the test environment. Meanwhile, ratiometric FPs—based on ratios of emission intensity with two different wavelengths—can eliminate the possible external interference mentioned above and are thus more sensitive and accurate [34,35]. Consequently, an easy and reliable method allowing development of an effective ratiometric FP for N2H4 captures is of the utmost importance.
Coumarins have been broadly utilized to develop FPs for distinguished analytes because of their high quantum yield, large Stokes shift, low cytotoxicity, and easy modification [36,37]. The introduction of reactive masking groups on the 7-hydroxylgroup of coumarin is an indispensable step in the design of coumarin-based N2H4 probes, whereby the masking groups are deprotected in the presence of N2H4, which causes significant fluorescence changes, mainly because of inhibition and the recovery of the intramolecular charge transfer (ICT) procedure concerning 7-hydroxycoumarin derivatives. Among these reported N2H4 probes based on 7-hydroxycoumarin, most of them belong to the turn-on variety [19,38,39,40,41,42,43,44,45,46,47,48], while ratiometric probes are rarely reported [49]. The current investigation prepared an ICT-based ratiometric FP CHAC for N2H4 detection via a simple, one-step reaction (Scheme 1). Although CHAC has been previously reported [50], as far as we know, this is the first time it has been used as an FP. The probe CHAC utilized a 7-hydroxycoumarin derivative CHOH as the fluorophore and an acetate ester as the recognition site. We deem that the selective ester cleavage in the probe by N2H4 will restore the push–pull electronic structure of CHOH and enhance the ICT effect, which will lead to a significant red shift with regard to the fluorescence emission spectra, thereby achieving ratiometric detection of N2H4. The experiment data showcased that CHAC exhibited perfect selectivity, a low detection limit (0.16 μM), a large detection range (0–500 μM), and a wide, effective pH range (6–12). Also, we successfully utilized CHAC to monitor N2H4 in environmental specimens as well as in living cells.

2. Results and Discussion

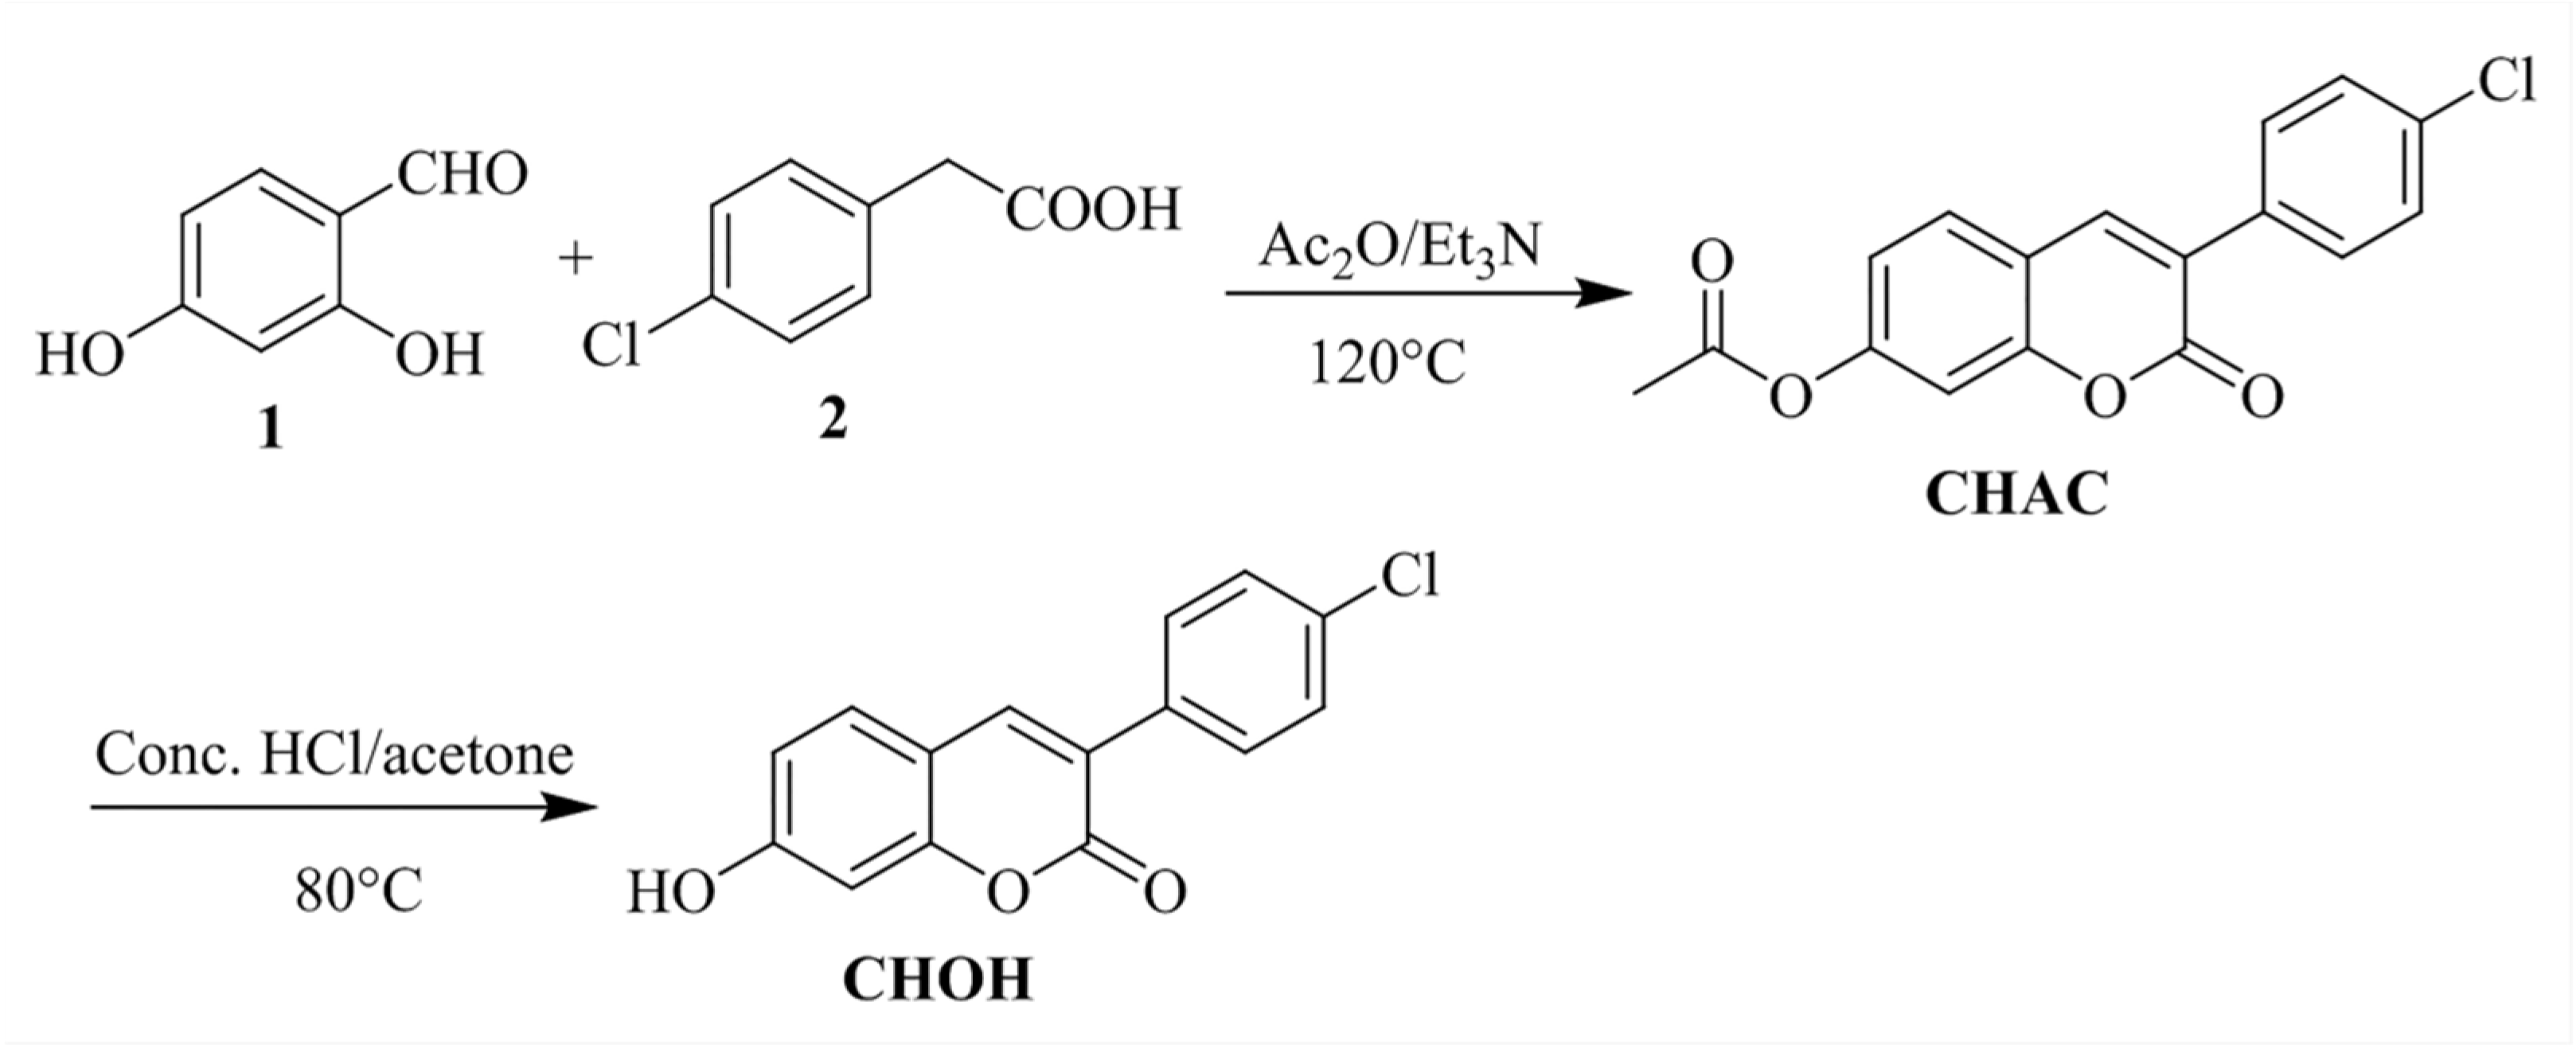
2.1. Design and Synthesis of the Probe CHAC

According to the design strategy of coumarin-based FPs [37], we introduced an electron-donating group (hydroxyl) at the 7-position and an electron-withdrawing group (4-chlorophenyl) at the 3-position of coumarin to form a push–pull π-conjugated system that could enhance the ICT effect, thereby resulting in an increase in fluorescence intensity and the emission wavelength of the fluorophore CHOH. The probe CHAC was prepared by introducing the recognition group acetyl to the hydroxyl group of CHOH. As an electron-withdrawing group, the acetyl group reduced the push–pull electron conjugation effect in CHAC. After reaction with N2H4, CHAC removed the acetyl group to release CHOH with a strong push–pull character, resulting in a significant red shift in the emission spectrum. As shown in Scheme 1, we prepared CHAC through a one-step condensation reaction. To investigate the response mechanisms of CHAC towards N2H4, the fluorophore CHOH was prepared via ester hydrolysis from CHAC. The CHAC and CHOH structures were verified through 1H NMR, 13C NMR and HRMS (Figures S1–S6).

2.2. Optical Properties

We tracked the UV-Vis and fluorescence spectra (FS) with regard to the probe CHAC for the absence and presence of N2H4 in DMSO:PBS buffer (10 mM, 4:6 v/v, pH = 7.4). The free probe (10 μM) showed obvious absorption at 327 nm (ε = 2.39 × 10⁴ M−1·cm−1) (Figure S7a). The addition of N2H4 (100 equiv) to the CHAC solution caused a decrement in the absorption peak at 327 nm accompanied by a novel band centered at 402 nm, which was consistent with that of CHOH (10 μM) (ε = 2.09 × 10⁴ M−1·cm−1). Upon excitation at 340 nm, the CHAC (5 μM) exhibited a single emission centered at 420 nm, which was red-shifted to 480 nm on its reaction with N2H4 (100 equiv), thus corresponding to a fluorescence color alternation from blue to cyan (Figure S7b). The resulting fluorescence spectrum was almost identical to that of CHOH (5 μM). We also measured the quantum yields (QYs) of CHAC and CHOH in the test solution, with quinine sulfate as the reference. The results show that both CHAC (Φ = 0.65) and CHOH (Φ = 0.46) produce high QYs. These data thus confirmed that CHAC could be utilized for fluorescent ratiometric detection of N2H4 via its transformation into CHOH mediated by N2H4.

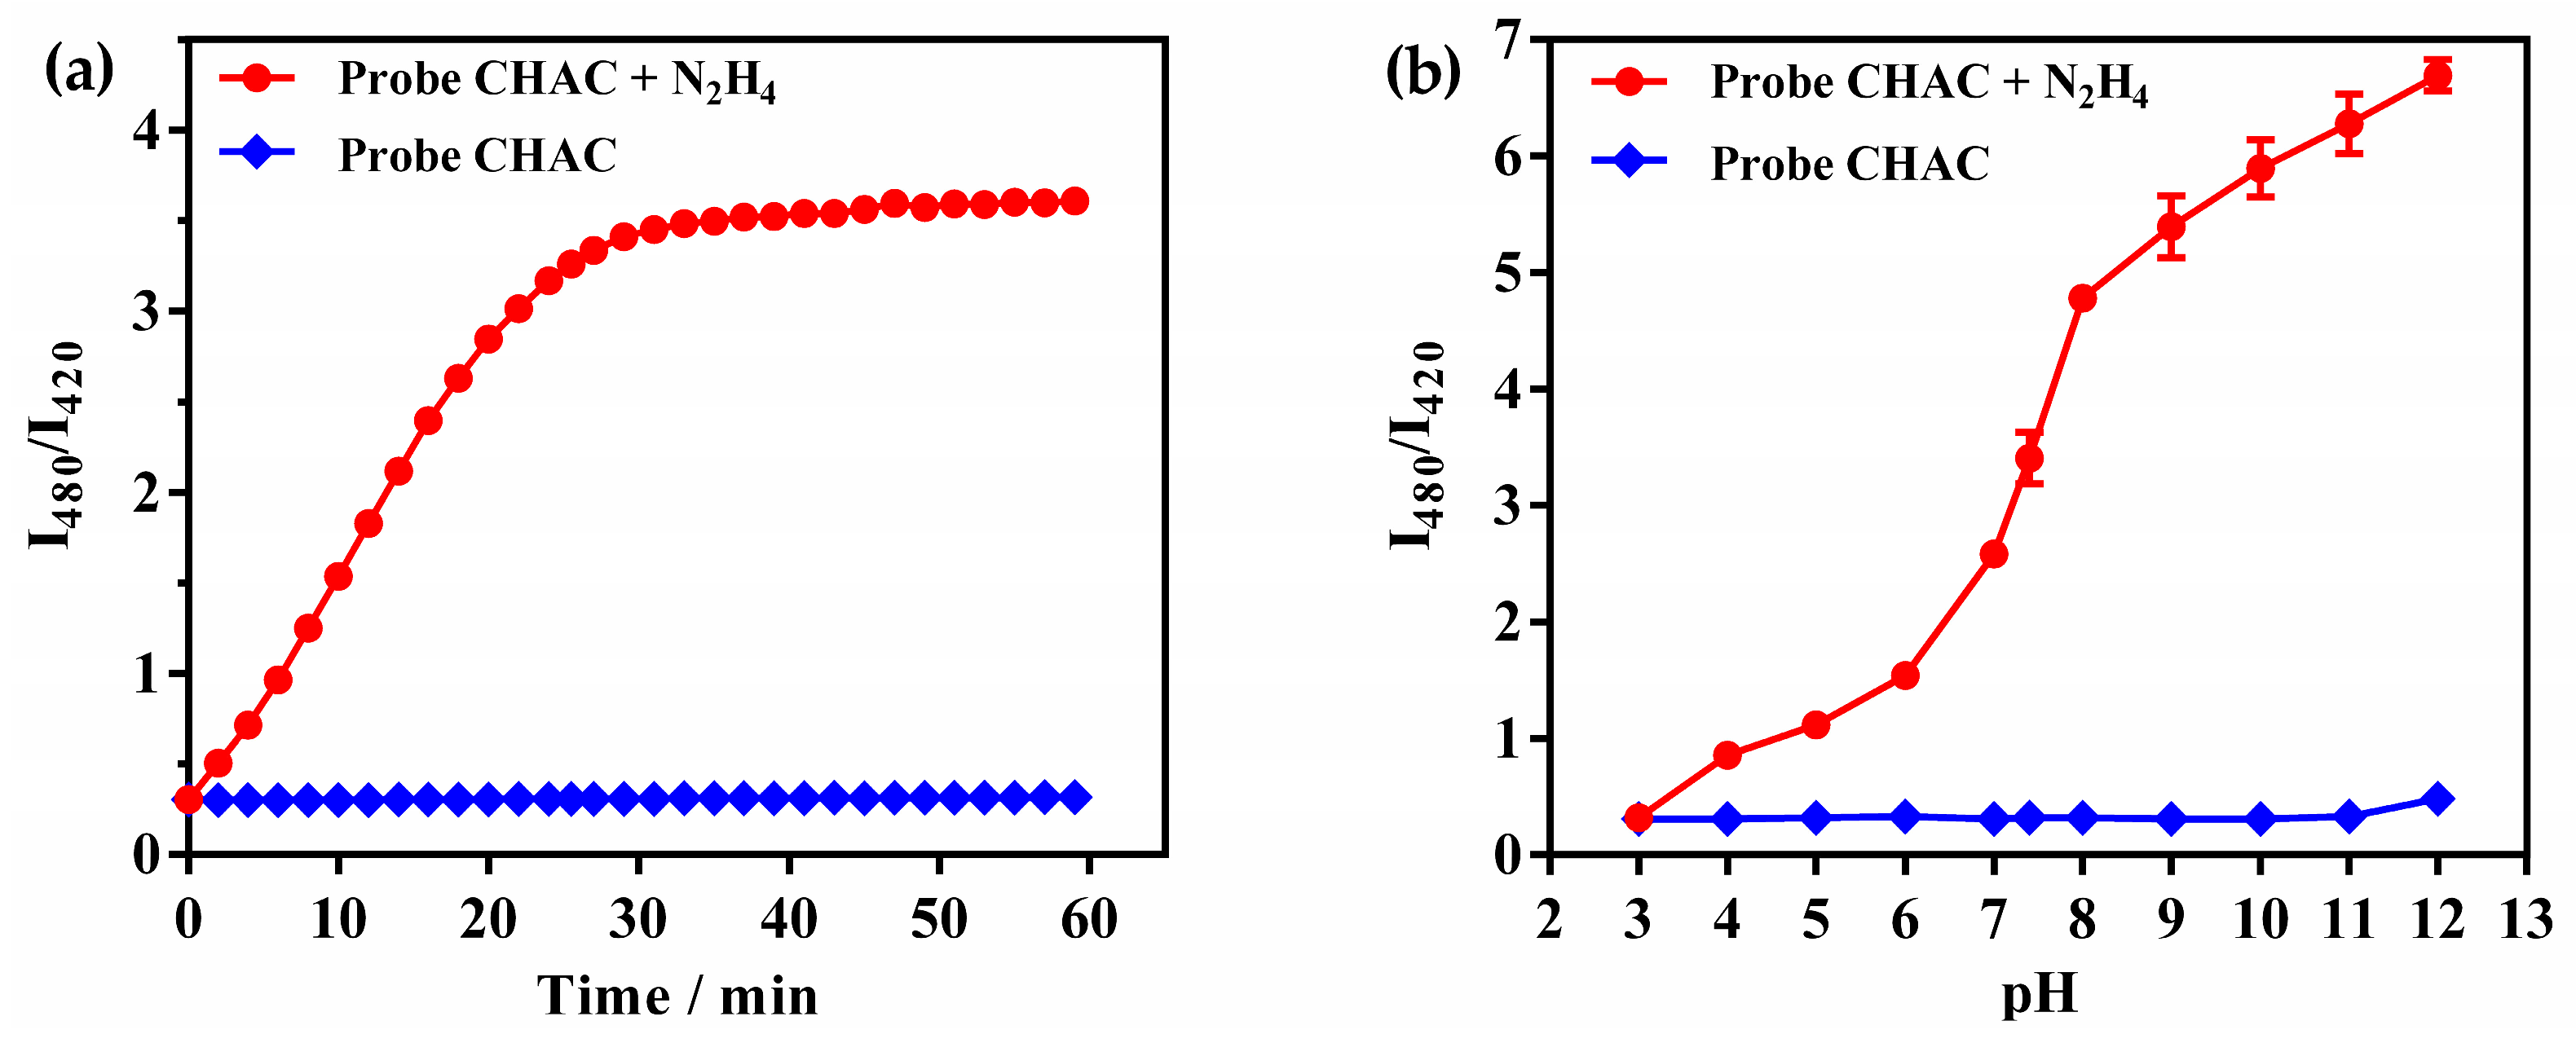
2.3. Reaction Time and pH Effects

The kinetics of the ratio responses of the probe CHAC to N2H4 and the stability of the probe itself were then investigated in DMSO:PBS buffer (10 mM, 4:6 v/v, pH = 7.4). In the absence of N2H4, the fluorescence intensity ratio (I480/I420) did not change during the testing duration, thus producing the inference that the probe was highly stable in the test solution under neutral conditions (Figure 1a). When 100 equiv of N2H4 was added, I480/I420 gradually increased as the reaction time increased, and a plateau was achieved within 30 min. Consequently, the reaction time was set to 30 min.
The pH effects upon N2H4 recognition by CHAC were investigated. In the absence of N2H4, the I480/I420 value did not change in pH ranges from 3 to 12, thus indicating that the free probe was very stable under acidic and alkaline conditions (Figure 1b). Upon incubating the probe with N2H4, I480/I420 gradually increased in the pH range of 3–12, and this increase was particularly significant in the pH range 6–12. This may be because alkaline conditions can prevent N2H4 from binding to hydrogen cations and also promote the hydrazinolysis of CHAC. Therefore, the probe CHAC was more suitable for the detection of N2H4 under neutral and alkaline conditions. A pH value of 7.4 was thus chosen to explore N2H4 in biological samples.

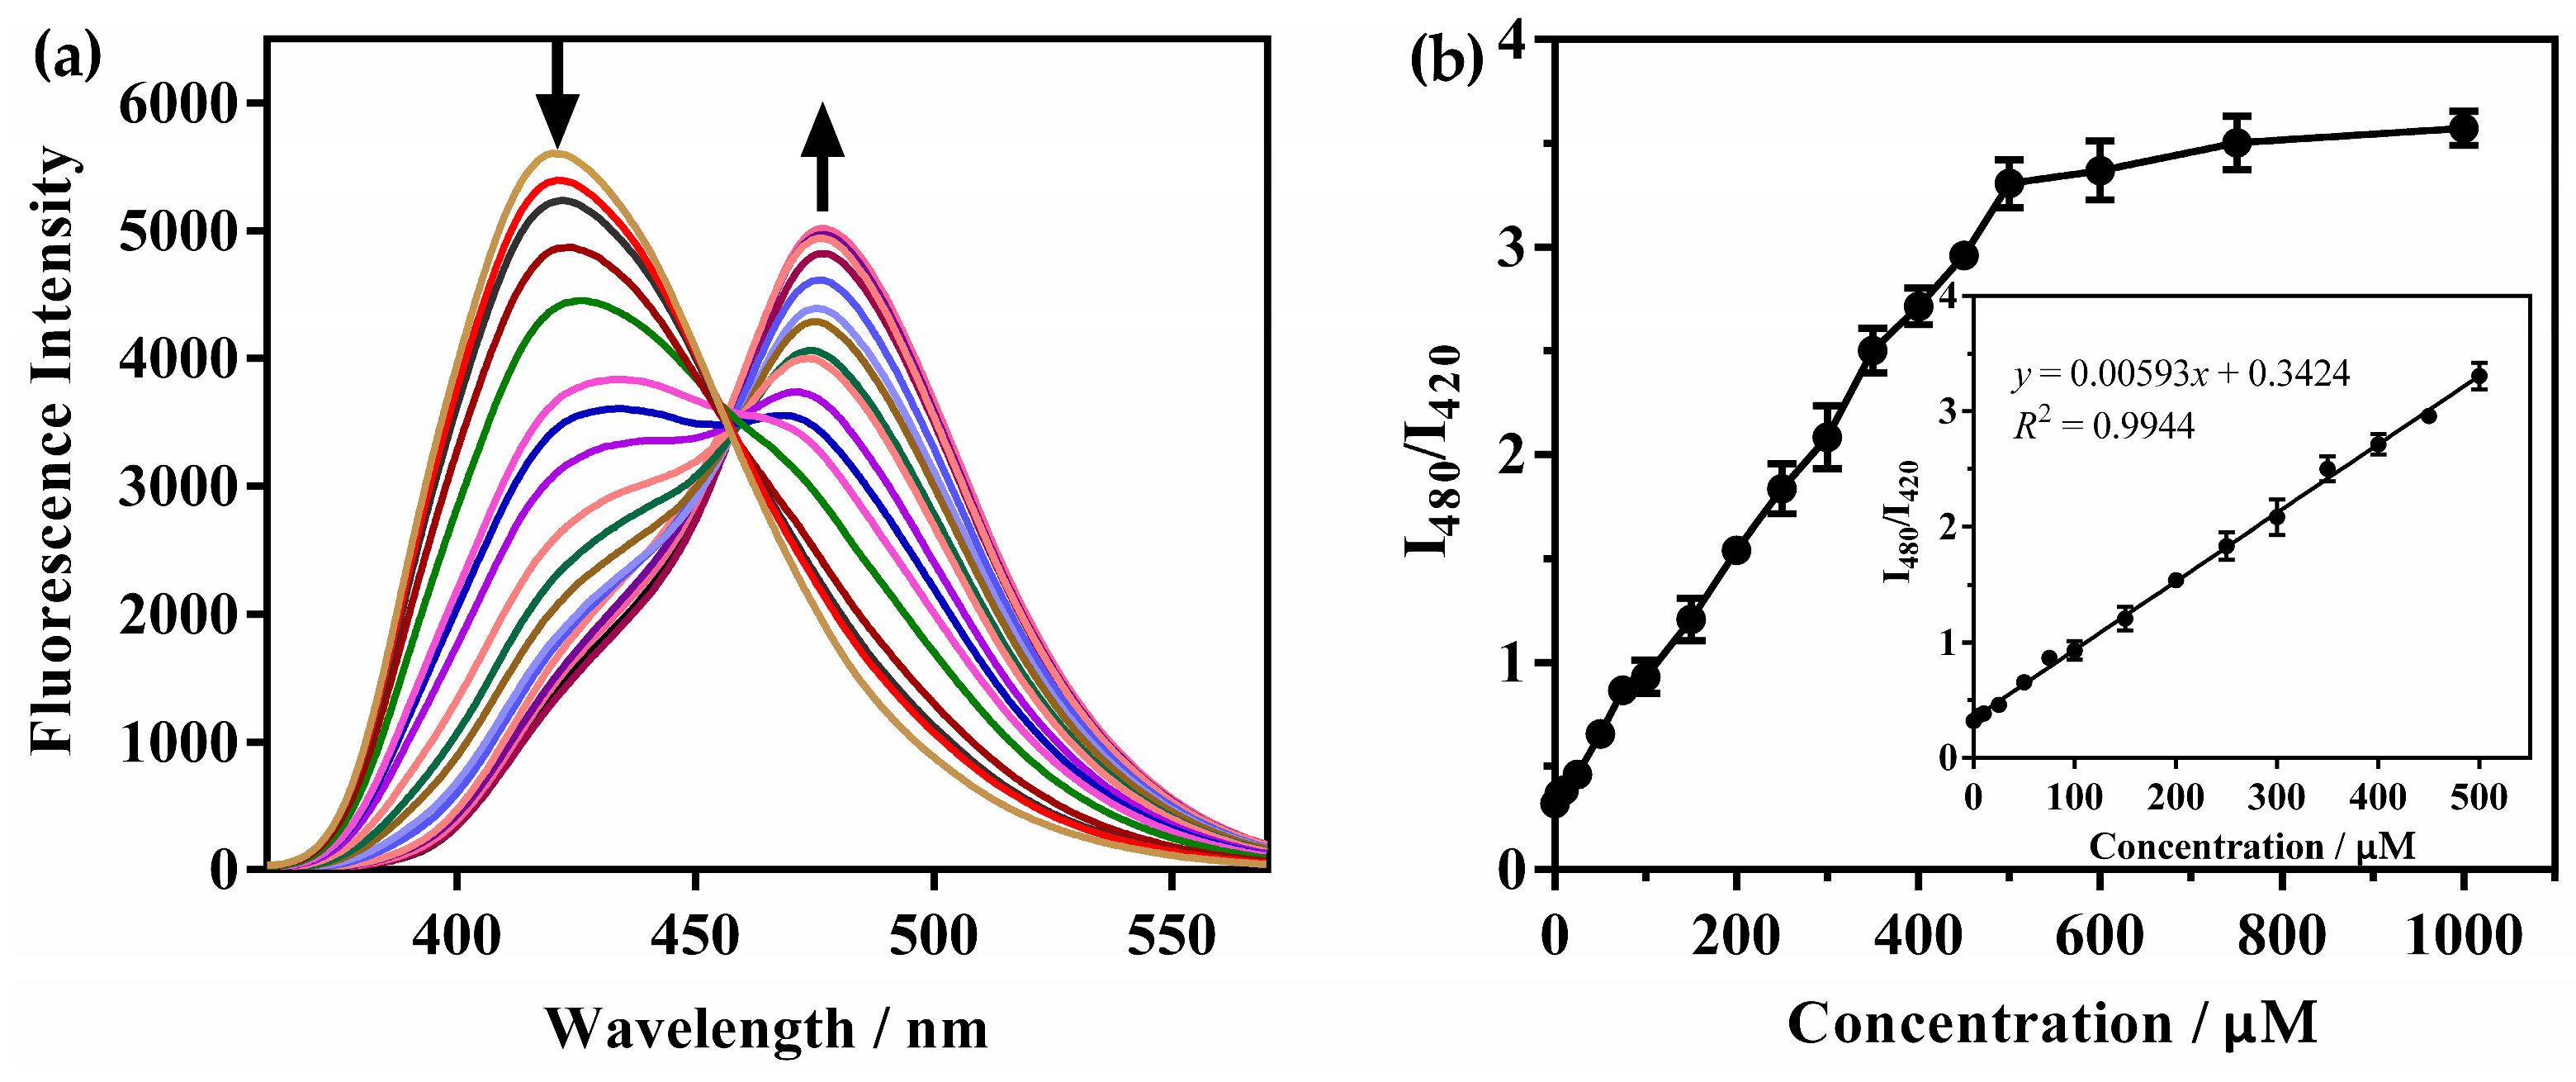
2.4. Fluorescence Spectra (FS) of Probes Titrated with N2H4

The detection limit and linear range were determined via fluorescence titration of the probe CHAC with N2H4 (from 0 to 1000 μM). As the concentration of N2H4 increased, CHAC fluorescence emission at 480 nm gradually increased, while the fluorescence emission at 420 nm decreased markedly (Figure 2a). When the N2H4 concentration reached 500 μM, I480/I420 reached a plateau (Figure 2b). The plot of the I480/I420 ratio of CHAC versus N2H4 concentrations showcased a perfectly linear relationship (R2 = 0.9944) in the 0–500 μM ranges (inset of Figure 2b). The limit of detection (LOD) of CHAC was computed as 0.16 μM following 3σ/K (σ: the standard deviation of blank measurements; K: the linear regression line slope), which is less than the U.S. EPA standard (0.31 μM). Consequently, the CHAC probe demonstrates excellent sensitivity and can be used for the quantitative detection of N2H4. Compared to previously reported N2H4-based FPs (Table S1), CHAC features a large linear detection range, a low LOD, broad effective pH ranges, and versatile application in regard to N2H4, which makes CHAC more effective in detecting N2H4.

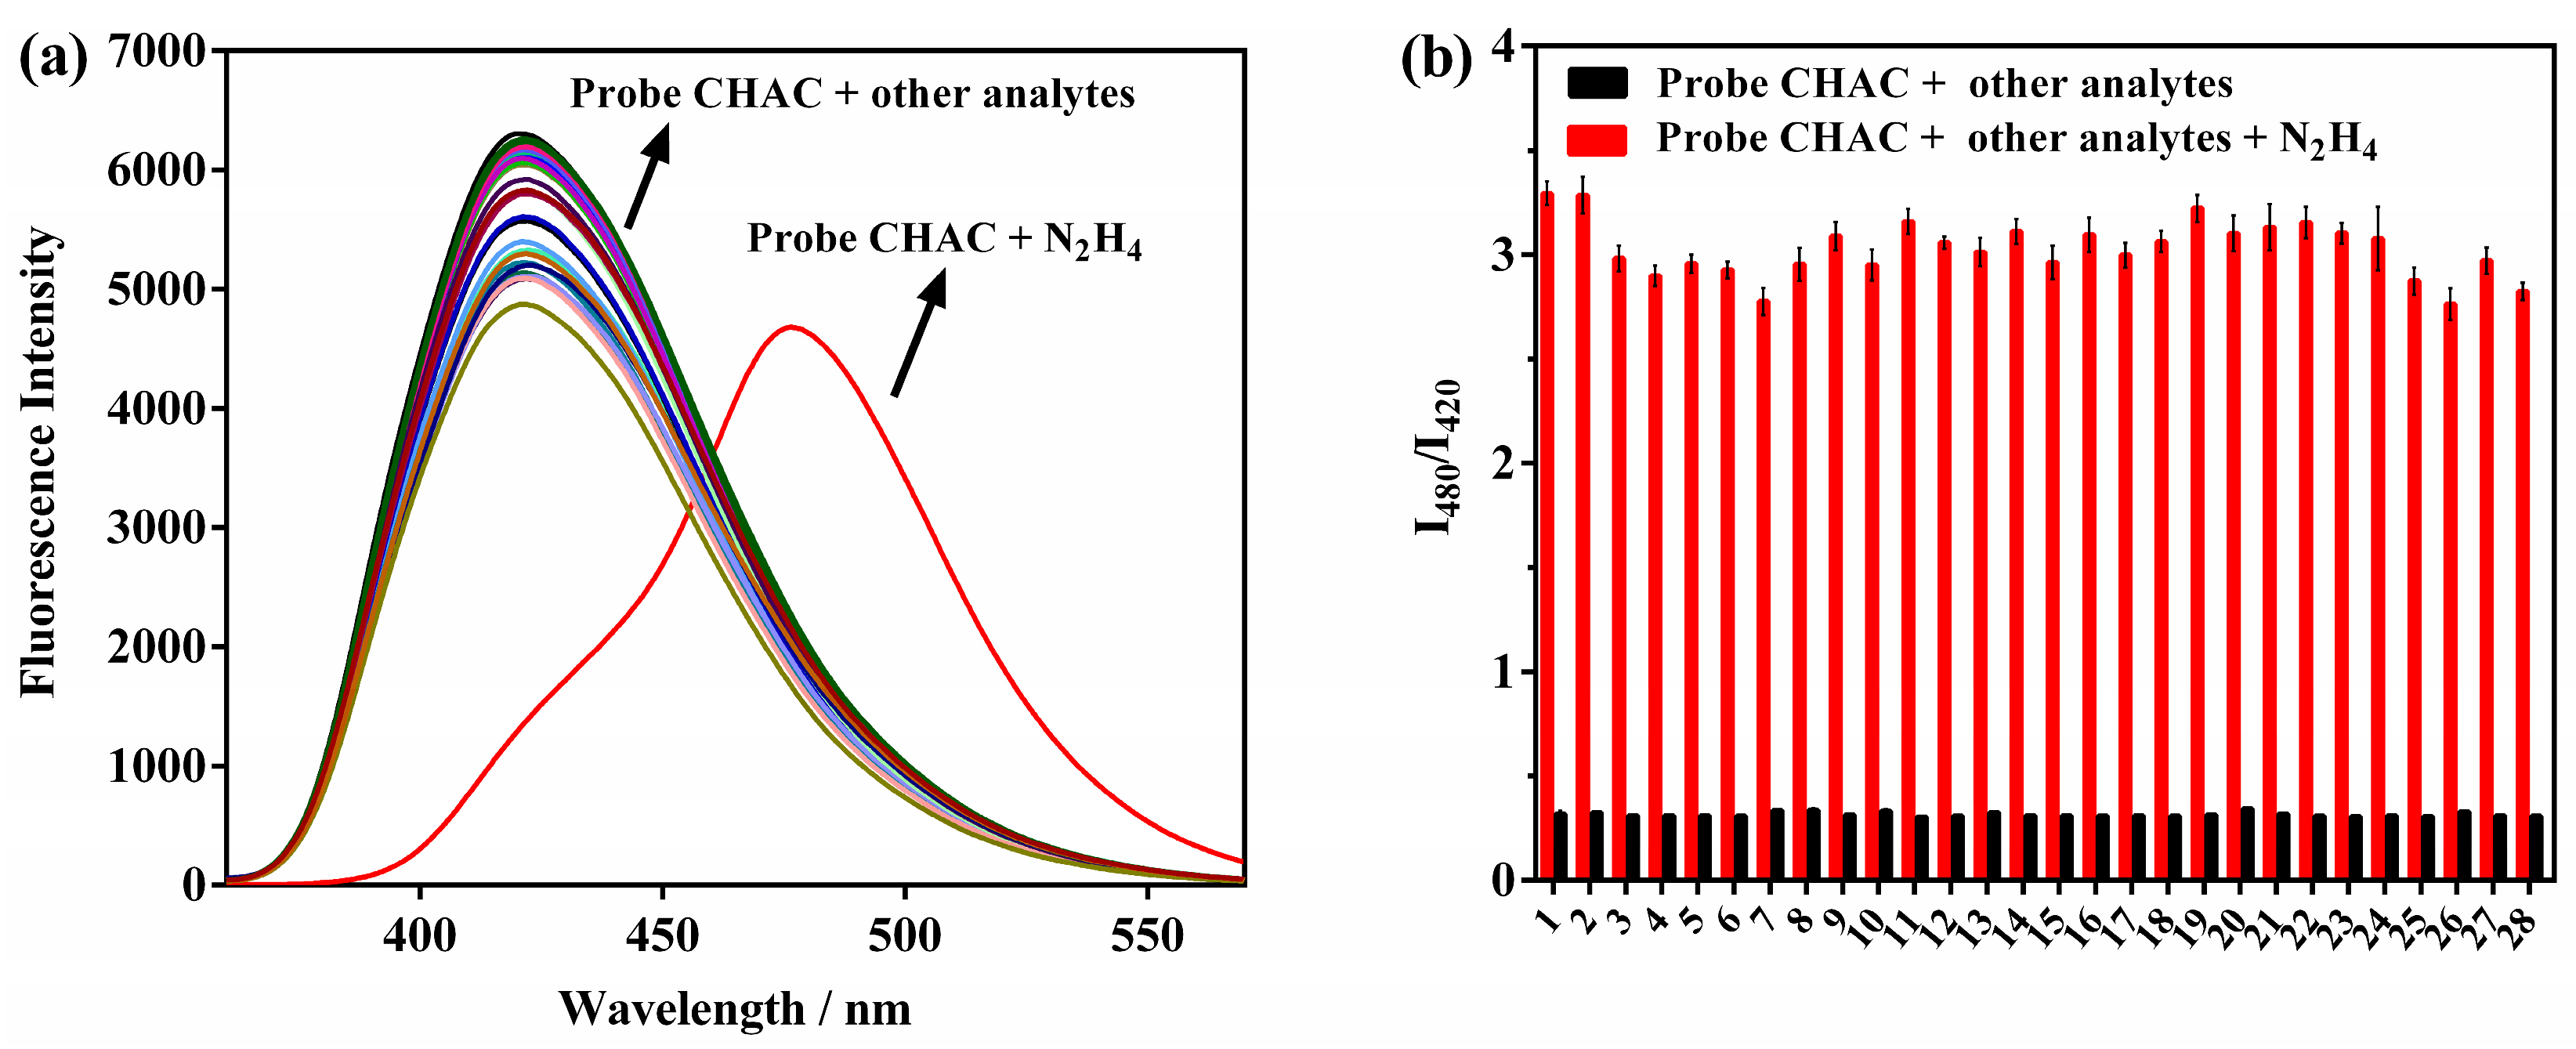
2.5. CHAC Selectivity and Anti-Interference Performance

To test CHAC selectivity for N2H4, we treated CHAC with various competitive analytes in a DMSO:PBS buffer (10 mM, 4:6 v/v, pH = 7.4). As illustrated in Figure 3a, when 100 equiv of related species—such as Cl, Br, F, SO 4 2 , I, CH3COO, H 2 PO 4 , HSO 3 , N 3 , K+, Na+, Ca2+, Mg2+, Al3+, Cd2+, Fe3+, Fe2+, Zn2+, ammonia, aniline, urea, thiourea, hydroxylamine, EDA, Cys, Hcy, or GSH—was incubated with CHAC (5 μM), no obvious variation in CHAC fluorescence characteristics was captured. However, adding 100 equiv N2H4 caused a significant shift in fluorescence emission from 420 to 480 nm. Furthermore, anti-interference experiments showed that the coexistence of all the relevant competing species mentioned above had few effects upon N2H4 detections by CHAC (Figure 3b). It was thus concluded that CHAC responds to N2H4 with perfect selectivity, and that the possibly coexisting interferential species did not interfere with this detection.

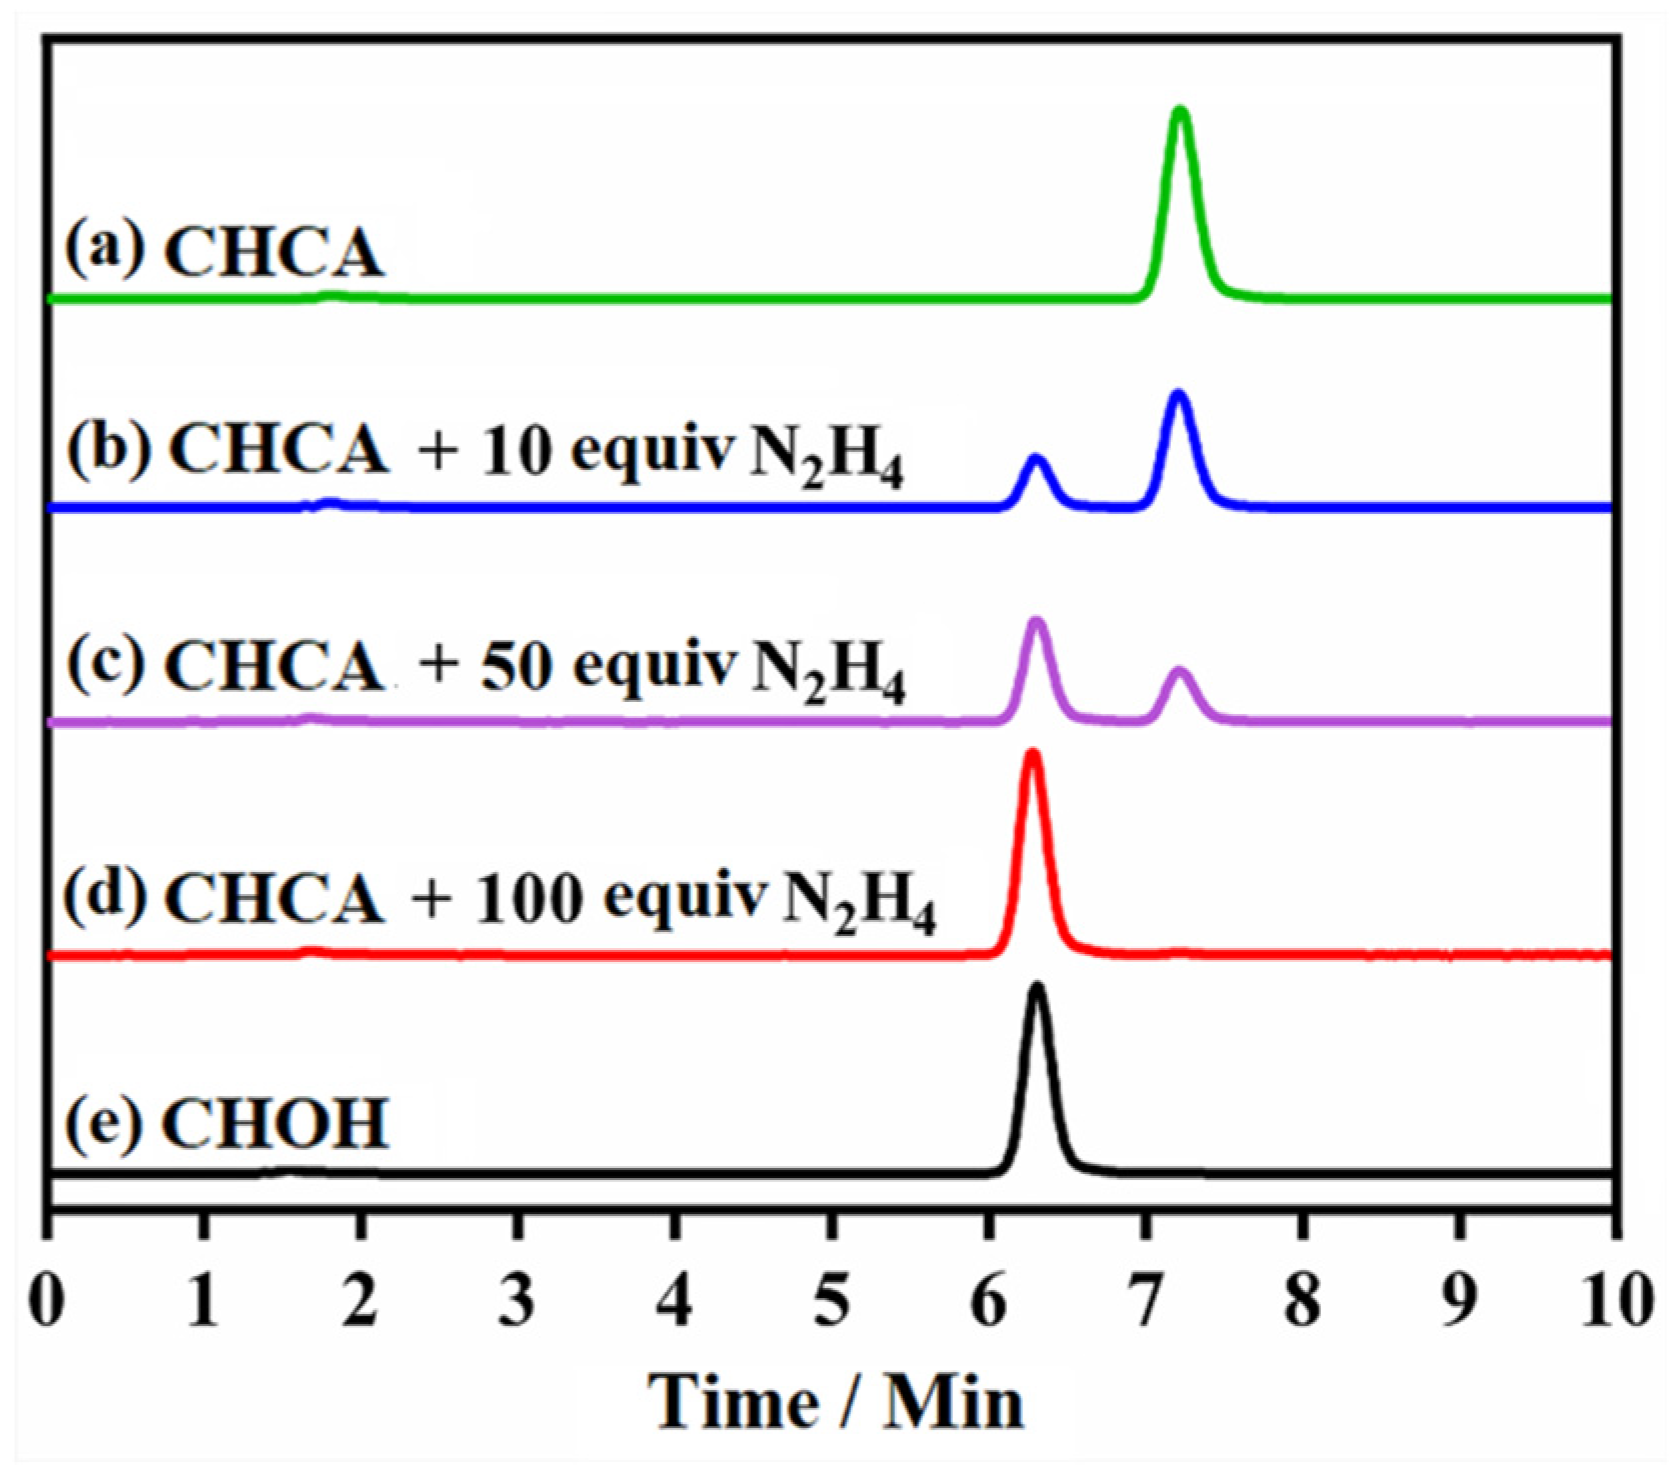
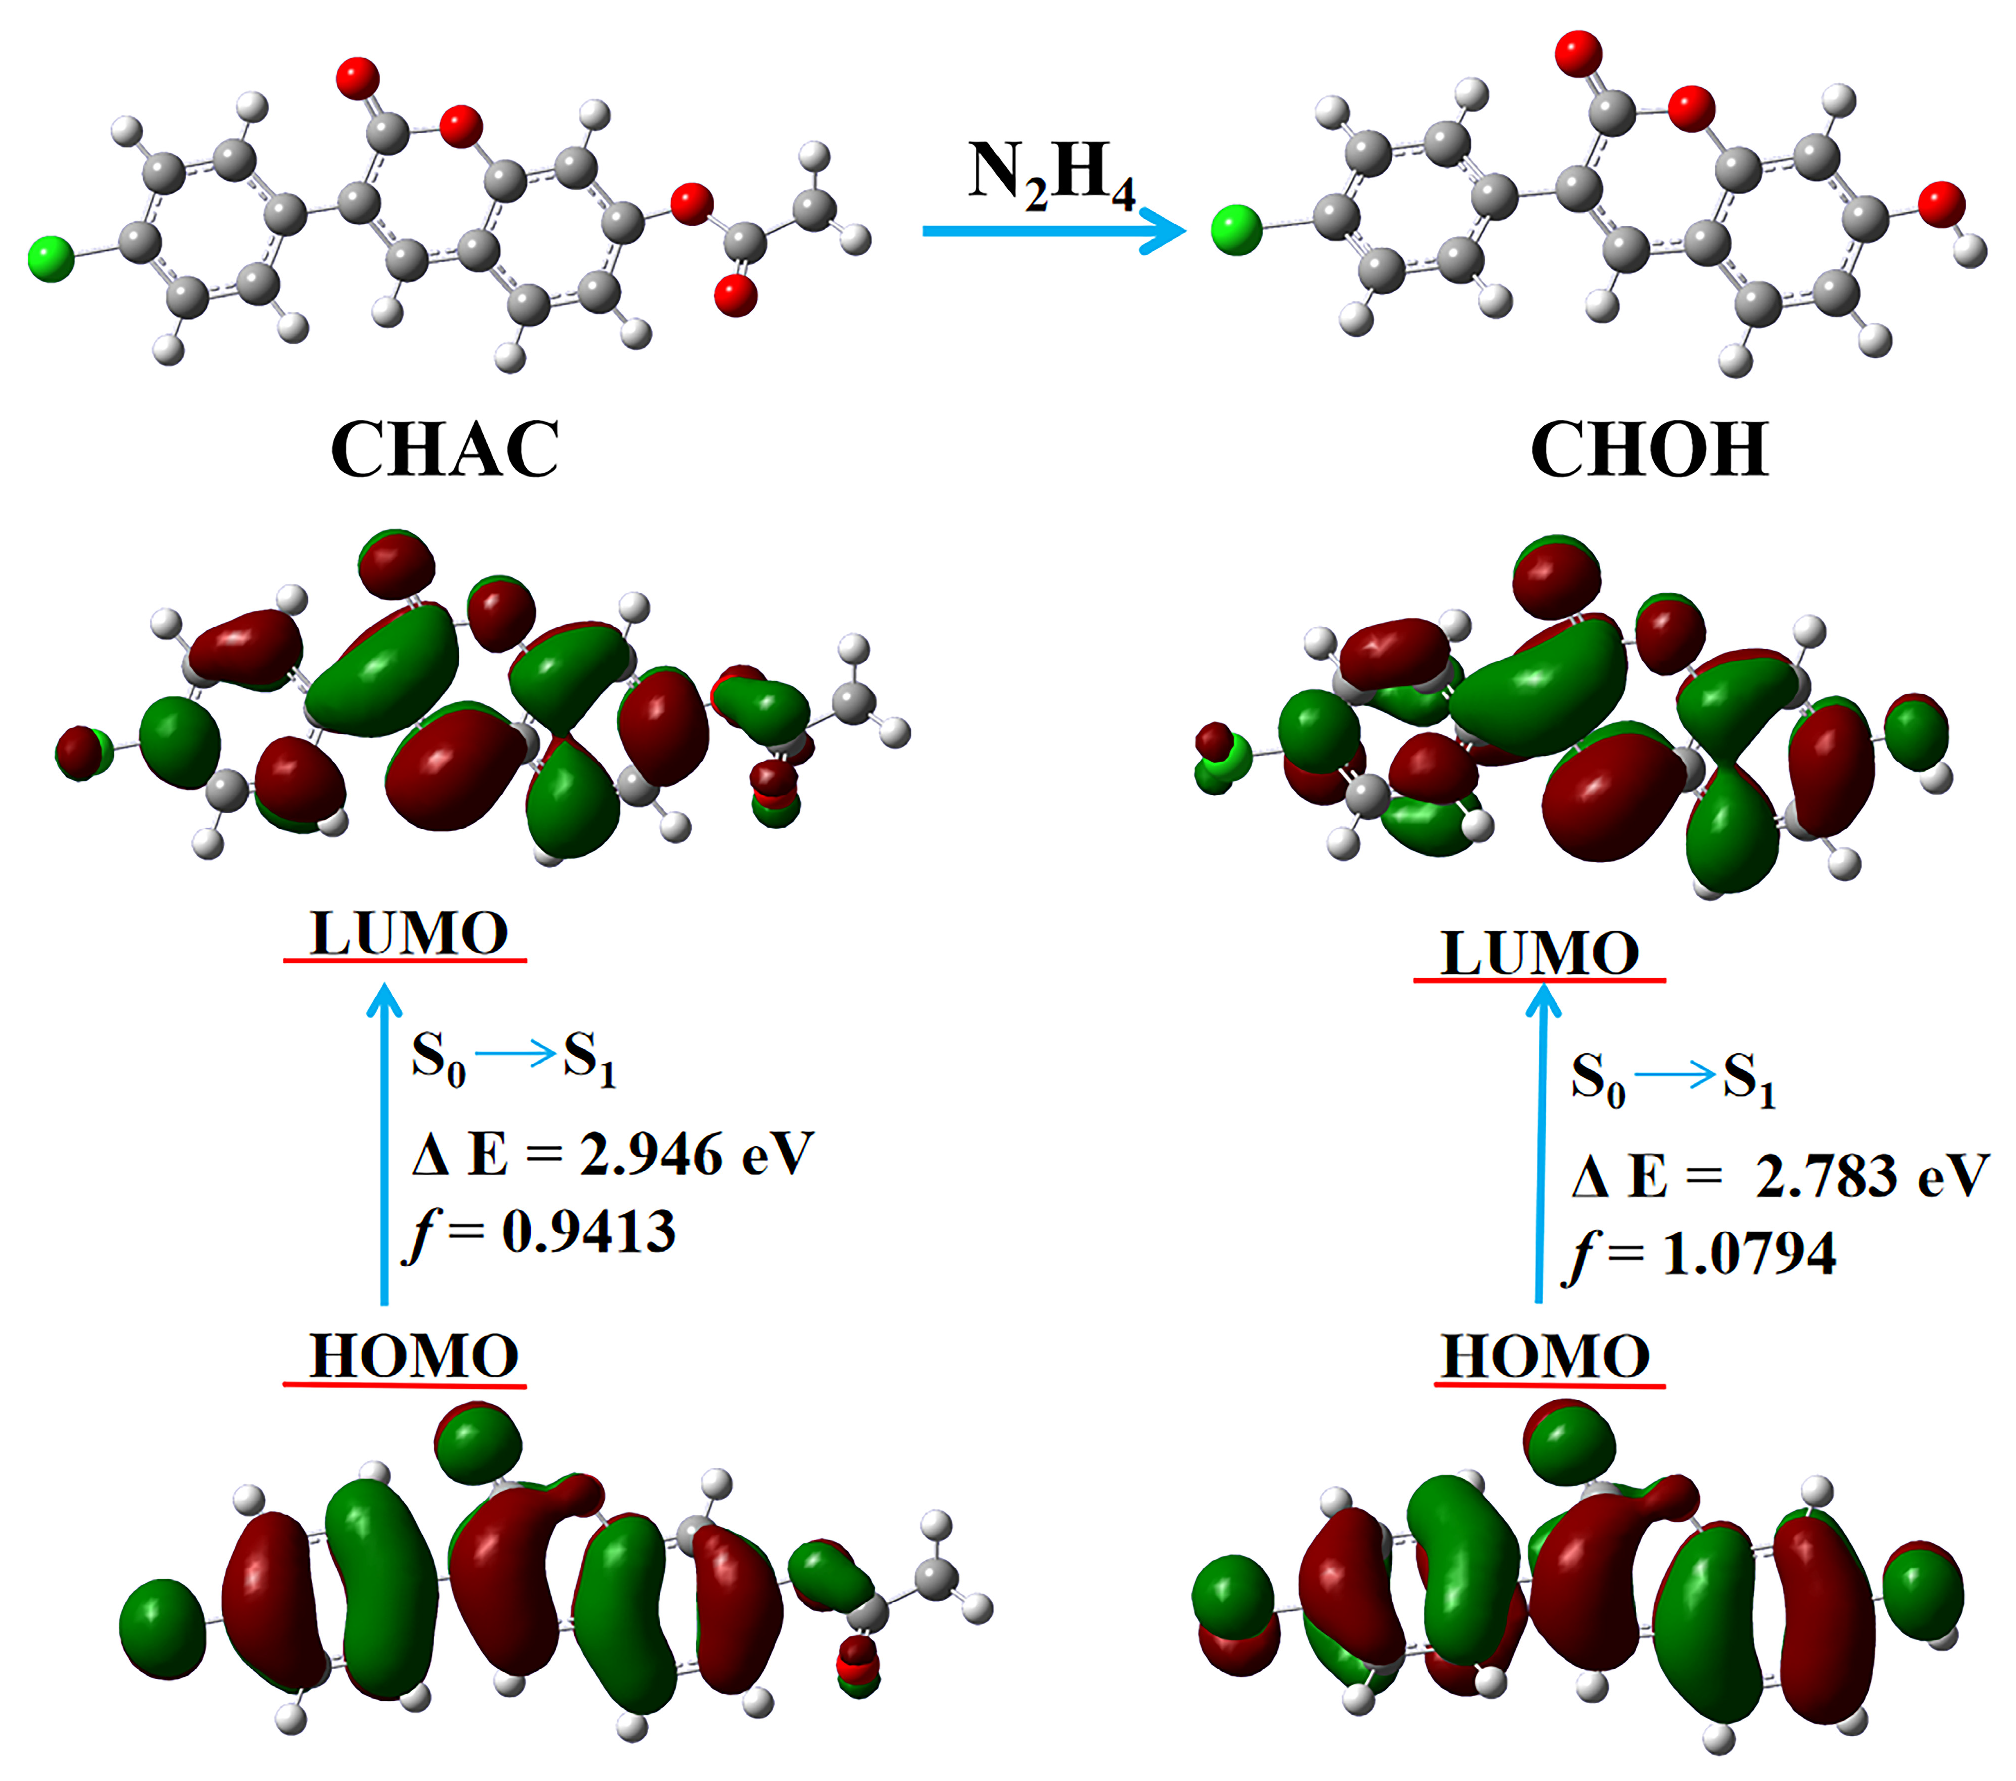
2.6. The Proposed Detection Mechanism

Based on the reported literature [38,40] and the results of UV-Vis and emission spectra (Figure S7), the probe CHAC response mechanism with N2H4 was proposed (Scheme 2). When a sufficient amount of N2H4 was added, it acted as a nucleophile to attack the acetoxy group in CHAC, and a hydrazinolysis reaction occurred that released the fluorophore CHOH. The proposed sensing process was further verified via HPLC and HRMS. From the HPLC chromatograms (Figure 4), the probe CHAC exhibited a main peak with a 7.22 min retention time. Upon post-incubation with N2H4, the CHAC peak gradually disappeared as the N2H4 concentration increased. A new peak also appeared at 6.31 min and gradually increased in intensity, which was attributed to CHOH. Furthermore, a main peak at m/z 271.0168 was discovered in the MS spectrum of the CHAC solution after the reaction with N2H4 (Figure S8), which was concordant with the deprotonated molecular weight of CHOH ([M–H] 271.0167). All these results indicated the conversion of CHAC into CHOH by N2H4.
To help us understand the photophysical properties of probe CHAC before and after reaction with N2H4, we used the Gaussian 16 program [51] to perform time-dependent density functional theory (TDDFT) calculations at a B3LYP/6-311G(d,p) level. A polarizable continuum model (PCM) [52] with a dielectric constant of 78.54 was used to simulate a solvent environment for the calculation. As demonstrated in Figure 5, in the process of excitation from the ground state (S0) to the lowest excited state (S1), the probe CHAC and the fluorophore CHOH showed significantly different π-electron distributions. In the HOMO of CHAC and CHOH, the electron density was distributed evenly throughout the whole molecule, while that in the LUMO of these two molecules displayed a tendency to transfer to coumarin. Compared with the electron density in the LUMO of CHOH, which was found more locally on the pyranone ring of coumarin, that in the LUMO of CHAC was spread mainly over the entire coumarin, indicating that the acetyl group weakened the ICT process in the probe CHAC. In addition, the HOMO-LUMO gap of CHOH (2.783 eV) was slightly weaker compared with the probe CHAC (2.946 eV), which was concordant with the red shift of FS post-hydrazinolysis.

2.7. N2H4 Determinations for Water Samples

To verify the potential application of the probe we designed, we employed CHAC to capture N2H4 in water samples using the addition method. Tap and lake water were selected as representatives of actual water samples. The results revealed that the N2H4 concentrations detected by this probe were consistent with the added concentrations (Table 1). Recoveries for the determination of N2H4 were between 99.5% and 107.2%, thus indicating that CHAC can be utilized as a practical means for the detection of N2H4 in environmental specimens.

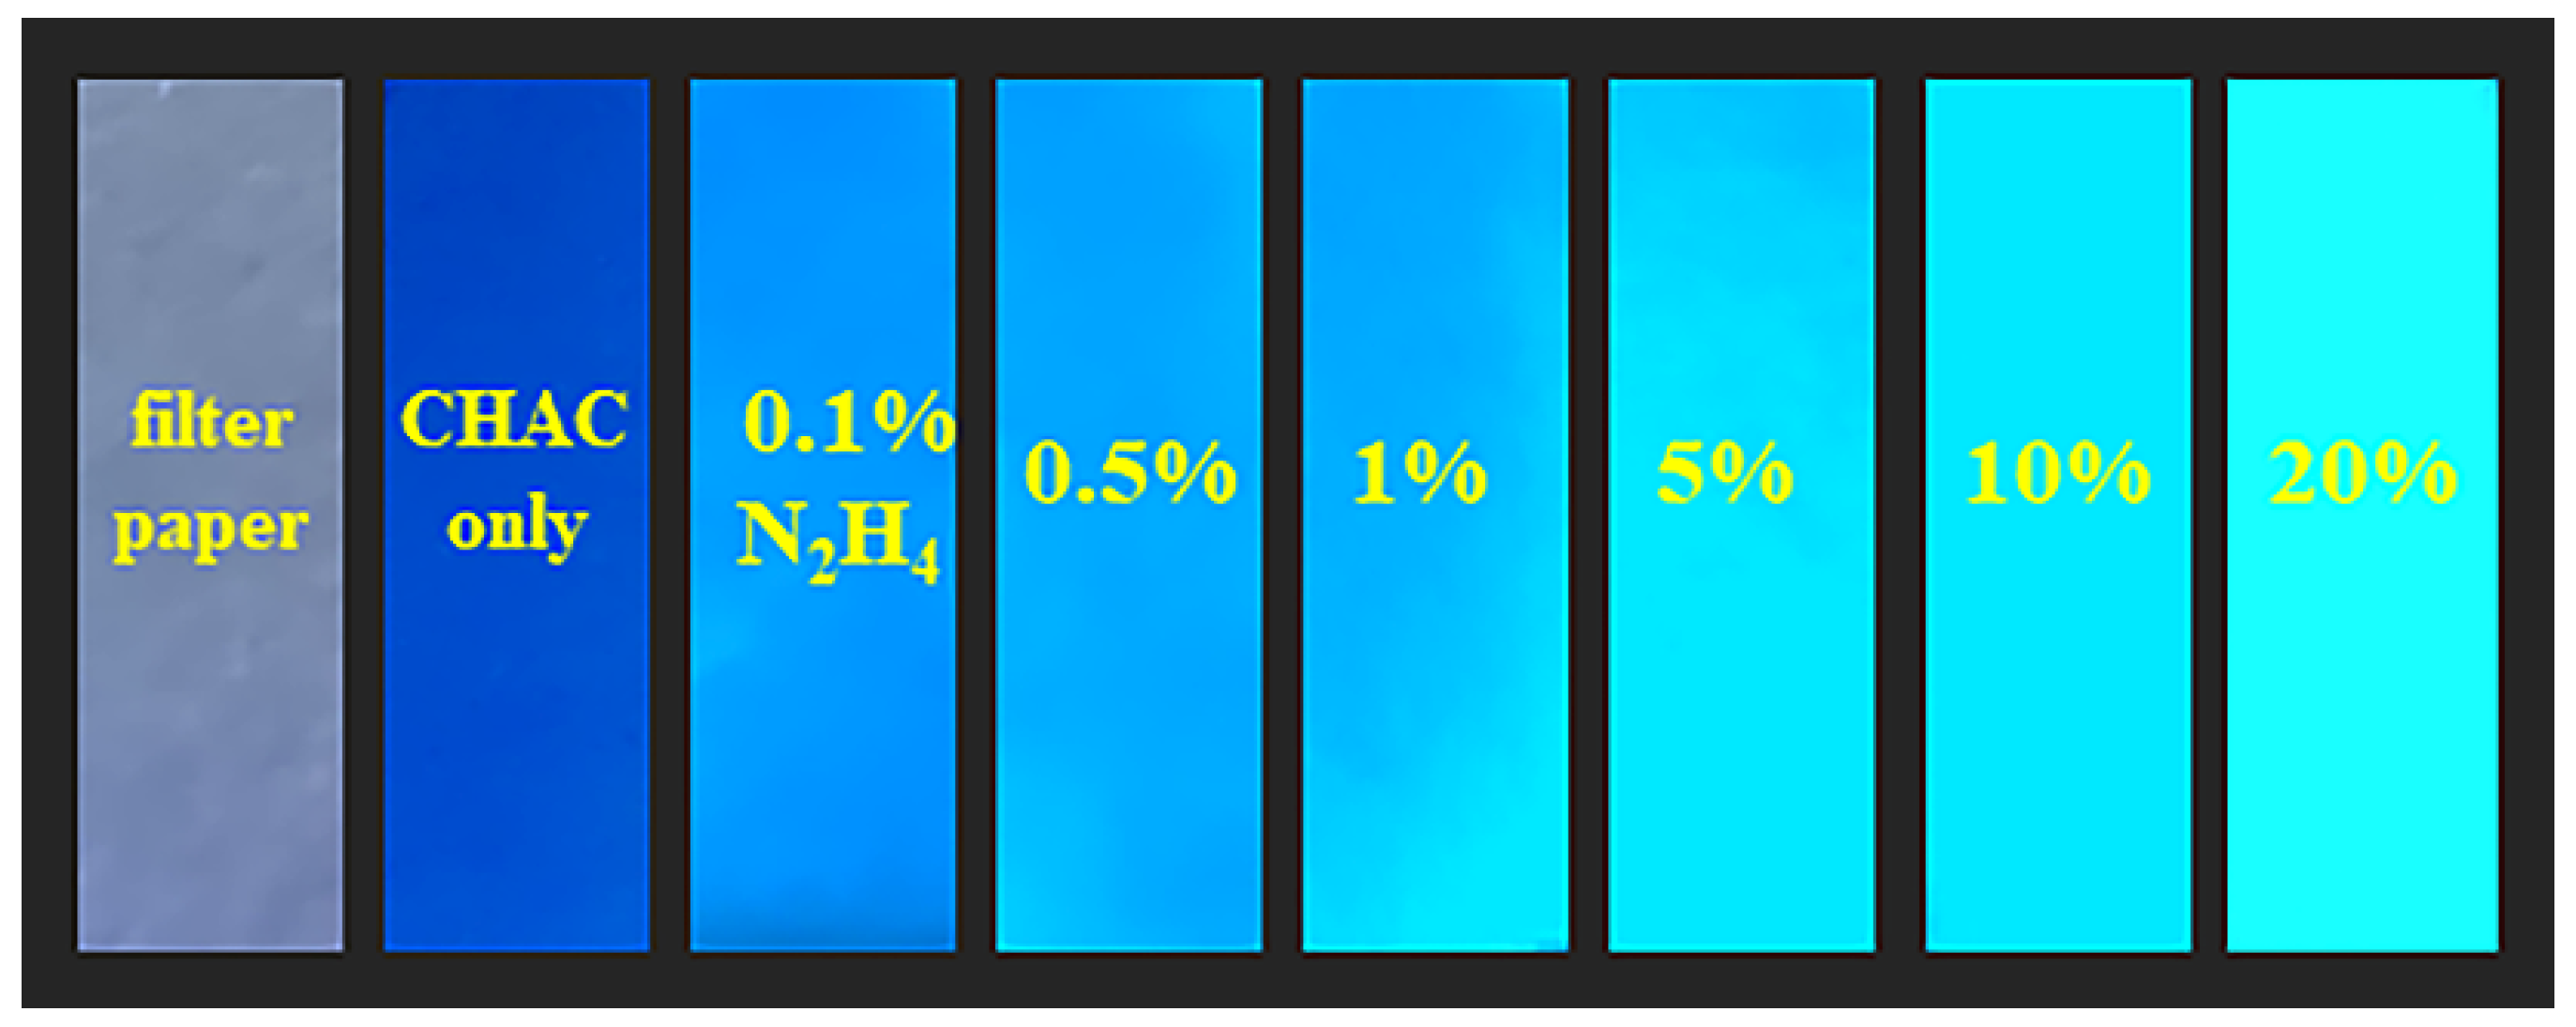
2.8. Gaseous N2H4 Detections

Another practical application of CHAC in N2H4 vapor capture was also investigated by loading CHAC onto filter paper. We pre-treated filter papers via the probe by immersing them in a methanol solution (1 mM) and then drying them. The filter papers were then placed in airtight jars that included distinguished N2H4 concentrations (0, 0.1%, 0.5%, 1%, 5%, 10%, and 20%), and were then exposed to N2H4 vapor for 0.5 h at room temperature. The results revealed that under a 365 nm light, N2H4 concentration increased and the fluorescent color of the filter paper gradually turned from deep blue to cyan (Figure 6). N2H4 vapor concentrations of 0–20% resulted in a noticeable difference in the CHAC color on the filter paper, which indicated that the probe CHAC could also be conveniently utilized for the qualitative detection of gaseous N2H4.

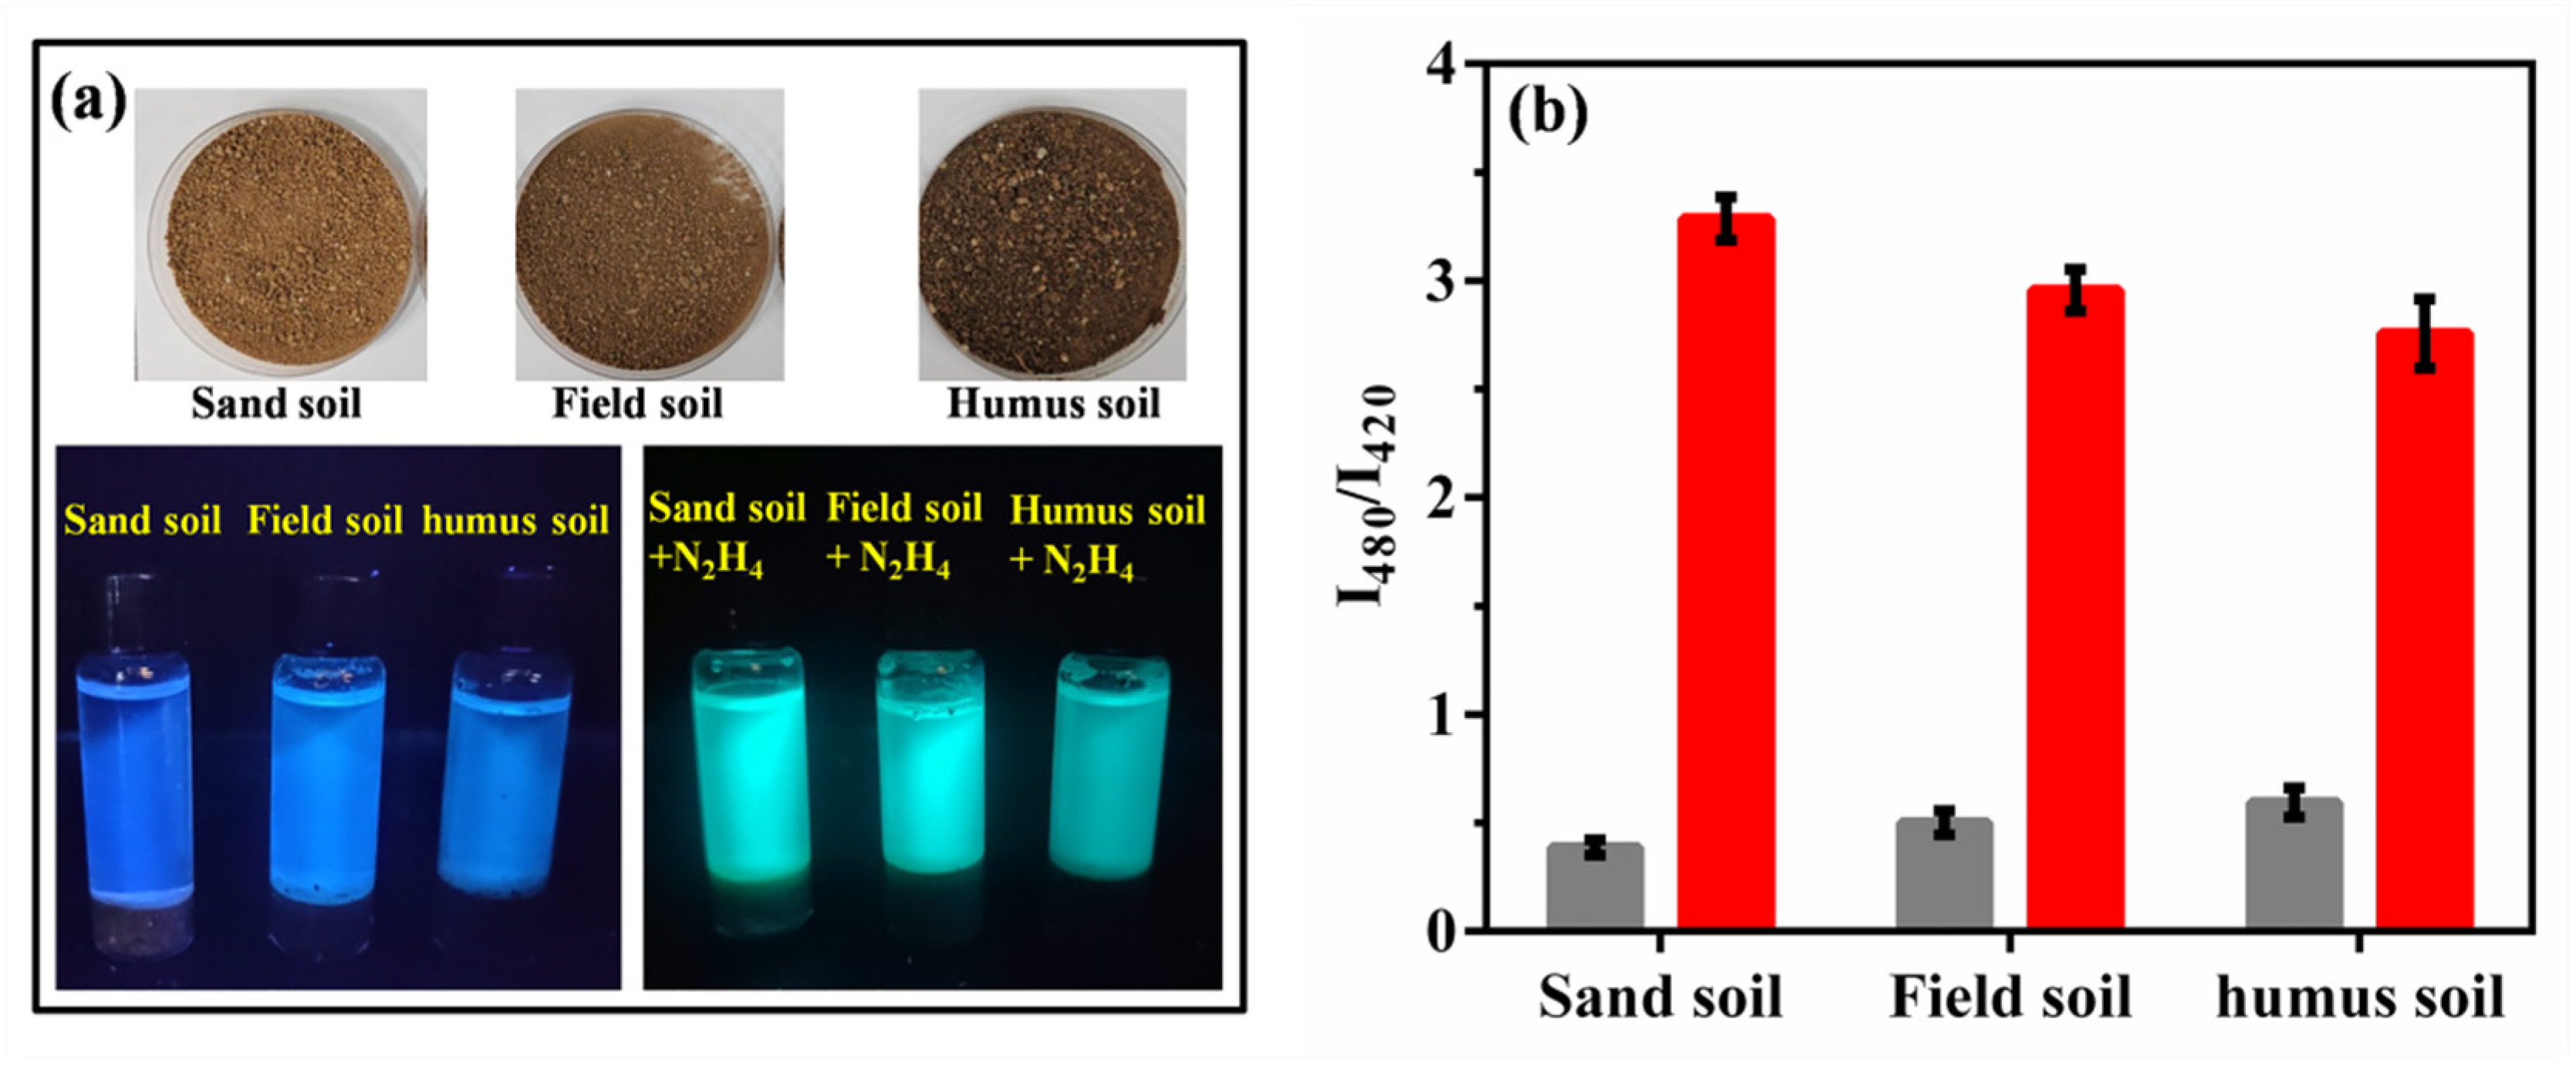
2.9. N2H4 Determinations in Soils

Subsequently, the probe CHAC applications in soil samples were also explored [53]. Sandy, field, and humus soils were collected from the surrounding area as experimental samples. First, 1 g sandy soil/field soil/ humus soil was added to 3 mL of probe CHAC solution (5 μM). We discovered strong blue fluorescence under 365 nm UV light (Figure 7a), indicating that the soil itself did not influence the fluorescence properties of CHAC. Another 1 g of the abovementioned soil samples was first treated with N2H4 solution (2 mM), and then transferred to a solution of 3 mL CHAC (5 μM). After 30 min, the solution showed strong cyan fluorescence under 365 nm UV light. The supernatant of soil solution was then analyzed via fluorescence spectrometry. The data highlighted that the fluorescence intensity ratio I480/I420 of the soil solution treated with N2H4 was significantly higher than that without N2H4 (Figure 7b), which demonstrated that CHAC could be utilized for the ratiometric detection of N2H4 in soils.

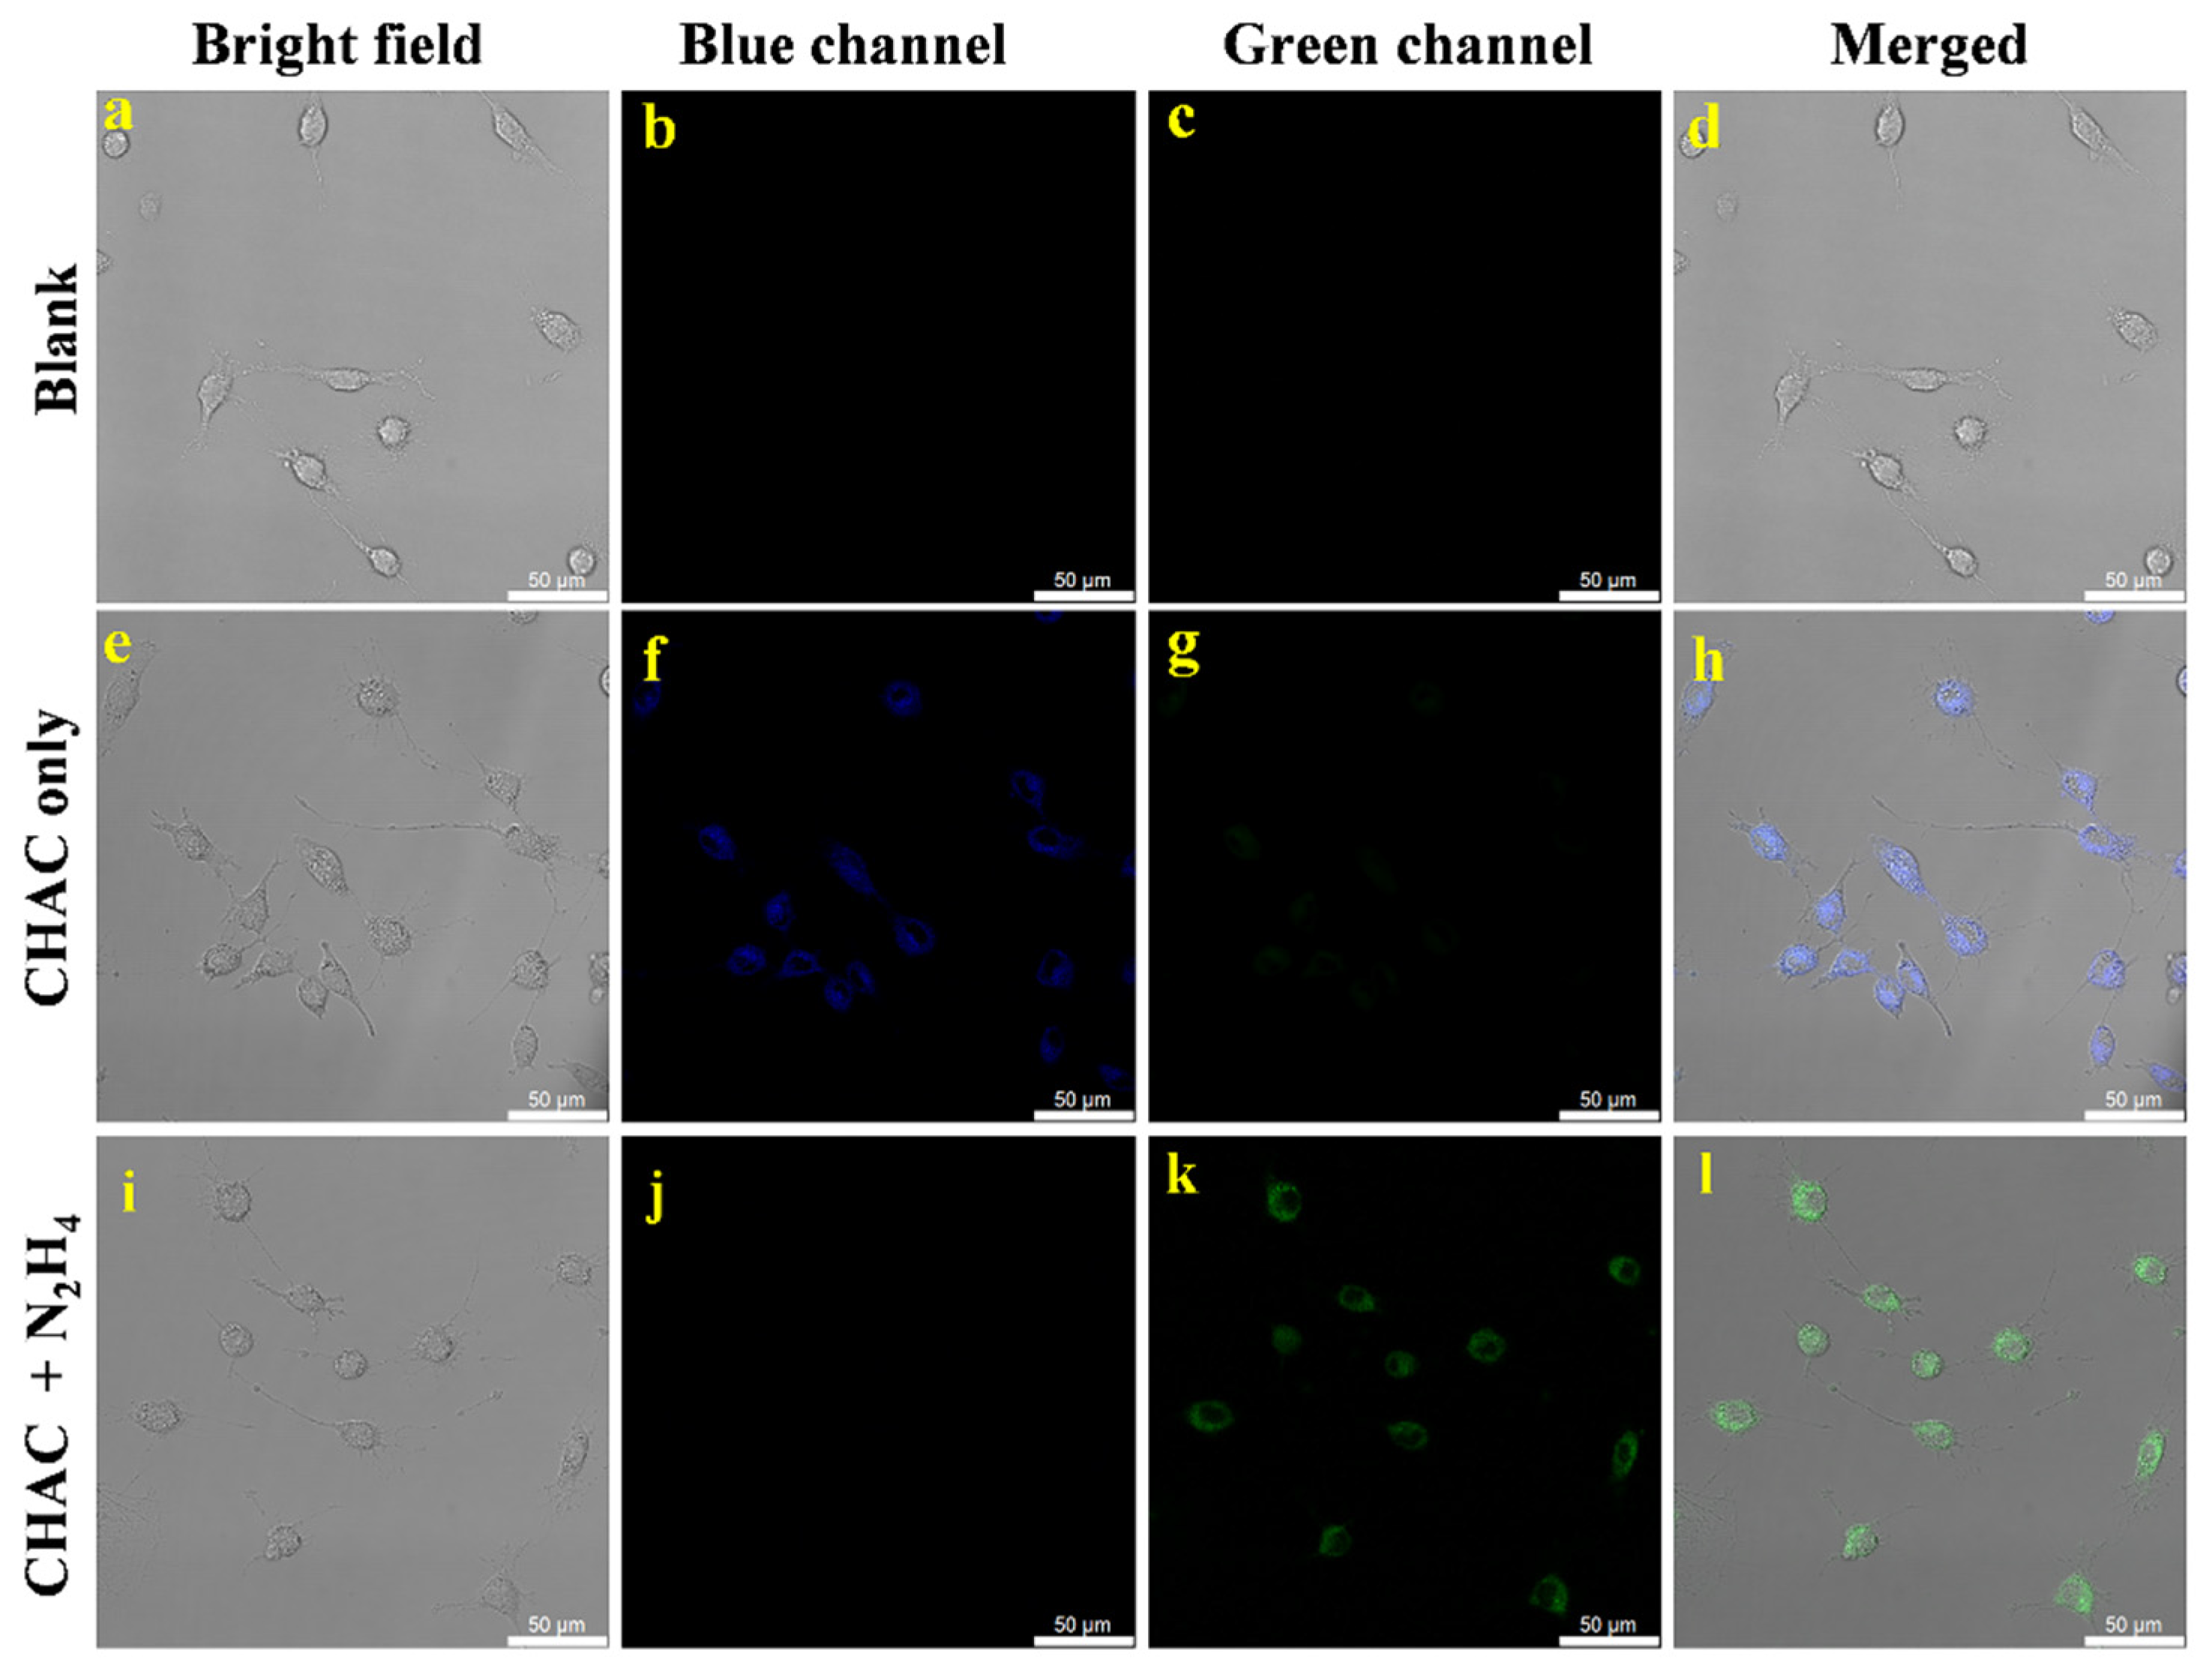
2.10. Toxicity of Probe CHAC and Imaging of Cells

The cytotoxicity of the probe CHAC (10–50 μM) on MC3T3-E1 cells was evaluated using the MTT assay. These data revealed that, even after treatment with the 50 μM probe CHAC for 1 day, the cells maintained a viability of more than 90%, thus indicating the very low cytotoxicity of the probe CHAC (Figure S9).
The imaging results of CHAC in MC3T3-E1 cells are shown in Figure 8. Under excitation at 405 nm, the cells showed fluorescence in neither blue nor green channels (Figure 8b,c). If we treated cells with CHAC alone for 0.5 h, strong fluorescence appeared in the blue channel, and almost no green fluorescence was found (Figure 8f,g). For cells pre-incubated with CHAC for 0.5 h and with N2H4 for another 0.5 h, the fluorescence in the blue channel disappeared, and strong fluorescence appeared in the green channel (Figure 8j,k), which indicated that the probe CHAC possessed effective cell membrane permeability to enable the fluorescent ratiometric detection of exogenous N2H4 in living cells.

3. Materials and Methods

3.1. Materials and Apparatus

2,4-Dihydroxybenzaldehyde, 4-chlorophenylacetic acid, triethylamine, 3-(4,5-dimethylthiazol-2-yl)-2,5-diphenyltetrazolium bromide (MTT), glutathione (GSH), cysteine (Cys), homocysteine (Hcy), and quinine sulfate were purchased from Shanghai Macklin Biochemical Co., Ltd (Shanghai, China). Acetic anhydride, ethylenediamine (EDA), aniline, urea, thiourea, hydroxylamine, N2H4, and various inorganic salts were purchased from Sinopharm Chemical Reagent Co., Ltd (Shanghai, China). Mouse embryonic osteoblasts (MC3T3-E1) were purchased from the National Experimental Cell Resource Sharing Platform (Beijing, China). All solvents used in the experiments were of commercially analytical or spectroscopic grade. Ultrapure, de-ionized water was utilized in the experiments.
NMR spectra were recorded on a Bruker Avance 400 MHz spectrometer (Bruker, Bremen, Germany), employing TMS as an internal reference. HRMS spectra were recorded using an Agilent 6540 Q-TOF spectrometer (Agilent, Santa Clara, CA, USA). UV-Vis spectra were measured using a Shimadzu UV-2450 spectrophotometer (Shimadzu, Kyoto, Japan). FS were recorded using a Hitachi F-4600 fluorescence spectrometer. pH values were determined utilizing a Leici PHSJ-4A acidometer (Leici, Shanghai, China). Cell imaging was performed using Leica Stellaris 5 confocal microscopy (Leica, Wetzler, Germany). Cytotoxicity tests were carried out on a DNM-9602G enzyme-labeled instrument (Perlong, Beijing, China). HPLC analysis was performed using a Shimadzu Prominence LC-20A liquid chromatograph (Shimadzu, Kyoto, Japan).

3.2. Synthesis of the Probe CHAC

2,4-Dihydroxybenzaldehyde (0.54 g, 3.61 mmol) and 4-chlorophenylacetic acid (0.93 g, 5.45 mmol) were dissolved in 8 mL acetic anhydride, and then 2 mL triethylamine was added. The mixture was heated to 120 °C and stirred for 7 h. The end of the reaction was monitored using TLC (EtOAc:petroleum ether = 1:3). After cooling, the white precipitate was collected, washed using water, dried, and then recrystallized with ethanol to obtain CHAC (0.81 g, yield 71%). 1H NMR (400 MHz, DMSO-d6): δ 8.31 (s, 1H), 7.82 (d, 1H, J = 5.4 Hz), 7.76 (d, 2H, J = 5.1 Hz), 7.54 (d, 2H, J = 5.1 Hz), 7.32 (s, 1H), 7.20 (d, 1H, J = 5.4 Hz), 2.32 (s, 3H). 13C NMR (100 MHz, DMSO-d6): δ 168.8, 159.4, 153.5, 152.8, 140.4, 133.4, 133.3, 130.3, 129.6, 128.3, 124.9, 118.9, 117.3, 109.7, 20.9. HRMS m/z calcd. for C17H12ClO4 [M+H]+: 315.0419, found: 315.0419.

3.3. Synthesis of the Fluorophore CHOH

CHAC (0.60 g, 1.91 mmol) was added to a mixture with 4 mL acetone and 8 mL concentrated hydrochloric acid, and the mixture was heated to 80 °C and stirred for 4 h. TLC (EtOAc:petroleum ether = 1:2) showed that CHAC was consumed. After cooling to room temperature, the yellow precipitate was collected, cleaned using water, and dried to collect CHOH (0.44 g, 85% yield). 1H NMR (400 MHz, DMSO-d6): δ 10.65 (s, 1H), 8.19 (s, 1H), 7.73 (d, 2H, J = 5.6 Hz), 7.68 (d, 1H, J = 5.7 Hz), 7.49 (d, 2H, J = 5.6 Hz), 6.83 (dd, 1H, J = 5.6 Hz, J = 1.0 Hz), 6.76 (s, 1H). 13C NMR (100 MHz, DMSO-d6): δ 161.5, 159.9, 155.0, 141.4, 133.9, 132.6, 130.1, 130.0, 128.2, 120.81, 113.5, 111.9, 101.7. HRMS m/z Calcd for C15H9ClNaO3 [M+Na]+: 295.0132, found: 295.0137.

3.4. Preparations for Spectral Measurement

The stock solution (5 mM) of CHAC was prepared in DMSO. Stock solutions (10 mM) of sodium salts (I, F, SO 4 2 , HSO 3 , H 2 PO 4 , Cl, Br, CH3COO, and N 3 ), cations (K+, Na+, Ca2+, Mg2+, Al3+, Cd2+, Fe3+, Fe2+, and Zn2+), and amino-containing analytes (ammonia, aniline, urea, thiourea, hydroxylamine, Cys, EDA, Hcy, and GSH) were obtained by dissolving them in deionized water. The test solutions were prepared as follows: CHAC (3 μL, 5 mM) and the analyte solution were added to a tube and diluted to 3 mL using DMSO: PBS buffer (10 mM, 4:6 v/v, pH = 7.4). We incubated the resulting solution for 0.5 h at room temperature and the fluorescence spectrum was recorded at an excitation wavelength of 340 nm. Emission and excitation slit widths were 5 nm and 2.5 nm, respectively, and the voltage was 700 V.

3.5. Determination of Quantum Yield (QY)

The QYs of the probes CHAC and CHOH were determined using quinine sulfate (Φ = 0.54 in 0.1 M H2SO4) as a reference. To obtain reliable data, the absorbance of all solutions should not be higher than 0.05. The QY was calculated using the following equation [54]:
Φ r = Φ s × F S F r ×   A r A s ×   n s n r 2
where Φr and Φs represent the QY of the sample and the reference, respectively. Fs and Fr denote the integral areas of the Fs of the sample and the reference under the same test conditions, respectively. As and Ar denote the absorbance of the sample and the reference, respectively. ns and nr indicate the refractive index of the sample and the reference in the corresponding solvent, respectively.

3.6. HPLC Detection

The test concentrations of both CHAC and CHOH were 5 μM. The injection volume was 10 μL. The mobile phase was CH3OH/H2O (7:3 v/v) and the flow rate was 1 mL/min. A Diamonsil C18(2) column (150 mm × 4.6 mm, 5 μm) was employed as the chromatographic column.

3.7. Detection of N2H4 in Water Samples

A standard addition approach was utilized to determine N2H4 content in water samples [55]. Our team obtained tap and lake water aliquots from our laboratory and Jian Lake, respectively. The water samples were filtered through a microporous membrane to remove impurities, and then replaced with a PBS buffer for fluorescence spectrometry. Various N2H4 concentrations were spiked into the water samples and subsequently analyzed using CHAC. Every group of experiments was performed simultaneously 3 times.

3.8. Cytotoxicity Test

We culturedMC3T3-E1cells in a DMEM containing 10% FBS at 37 °C under CO2 atmosphere (5%). Initially, we cultured MC3T3-E1 cells in 96-well plates for 1 day and allowed them to adhere. Different concentrations of CHAC (10, 20, 30, 40, and 50 μM) were then added and incubated for another 1 day. The culture media in the wells were removed and an MTT solution (5 mg/mL, 20 μL) was added to every well. Medium was then supplemented and incubated for an additional 4 h under the same conditions. After removing solution from the well, we added DMSO (150 μL/well) to dissolve the formed formazan precipitate. To calculate the cytotoxicity, we captured solution absorbance at 490 nm via a microplate reader.

3.9. Living Cell Fluorescence Imaging (FI)

MC3T3-E1 cells cultured under the aforementioned conditions were used for cell FI experiments. We incubated CHAC (10 μM) and MC3T3-E1 cells at 37 °C for 0.5 h, washed them 3 times with PBS buffer, and divided them into 2 groups. One group was directly imaged utilizing a fluorescence confocal microscope, while the other group of cells was treated with N2H4 (500 μM), incubated for an additional 0.5 h, and cleaned 3 times with PBS prior to imaging experiments. Blank MC3T3-E1 cells were used as the controls. We performed FI utilizing a confocal laser scanning microscope at 420–460 nm and 480–520 nm upon excitation at 405 nm.

4. Conclusions

We developed a new ratiometric N2H4 FP, CHAC, through a simple one-step reaction. The N2H4 presence produced a significant ratiometric alteration in the fluorescence emission curve by cleaving the acetate and releasing the coumarin fluorophore. The response mechanism of CHAC for N2H4 was validated through HRMS, HPLC, and TDDFT computations. CHAC exhibited high selectivity, strong anti-interference, a low LOD, a large detection range, and a broad pH application range. In addition, the CHAC-loaded filter paper strips could detect N2H4 vapor effectively via fluorescence color change. More importantly, we successfully employed CHAC for N2H4 detection in various water and soil specimens, as well as in ratiometric imaging regarding N2H4 in live cells with low toxicity. These data indicate that CHAC could be employed as a useful tool to capture N2H4 in environmental and biological systems.

Supplementary Materials

The following supporting information can be downloaded at: https://www.mdpi.com/article/10.3390/molecules28227629/s1, Figures S1 and S4: 1H NMR spectrum of CHAC and CHOH; Figures S2 and S5: 13C NMR spectrum of CHAC and CHOH; Figures S3 and S6: HRMS spectrum of CHAC and CHOH. Figure S7: UV–Vis absorption (a) and fluorescence emission (b) spectra of CHOH (10 μM and 5 μM), and CHAC (10 μM and 5 μM) pre- and post-reaction with N2H4 (100 equiv) in DMSO:PBS buffer (10 mM, 4:6 v/v, pH = 7.4), λex = 340 nm. Figure S8: HRMS spectrum of CHAC after reaction with N2H4. Figure S9: Various CHAC concentrations and their effects upon MC3T3-E1 cell viability. Table S1: Comparison of CHAC and other probes for N2H4. References [56,57,58,59,60,61,62,63,64,65] are cited in Supplementary Materials.

Author Contributions

Conceptualization, methodology, and writing—original draft preparation, X.S. (Xiao Sheng); software and formal analysis, X.S. (Xinfeng Sun); investigation and data curation, Y.Z.; visualization, C.Z.; resources, S.L.; writing—editing and review, funding acquisition, supervision, S.W. All authors have read and agreed to the published version of the manuscript.

Funding

The present research was funded by the Shandong Provincial Natural Science Foundation (ZR2020MB107), the Project of the Medical and Health Technology Development Program in Shandong Province (202113050717), and the NSFC Cultivation Project at Jining Medical University (JYP2019KJ11).

Institutional Review Board Statement

Not applicable.

Informed Consent Statement

Not applicable.

Data Availability Statement

Data are contained within the article and Supplementary Materials.

Conflicts of Interest

The authors declare no conflict of interest.

References

  1. Ragnarsson, U. Synthetic methodology for alkyl substituted hydrazines. Chem. Soc. Rev. 2001, 30, 205–213. [Google Scholar] [CrossRef]
  2. Khaled, K.F. Experimental and theoretical study for corrosion inhibition of mild steel in hydrochloric acid solution by some new hydrazine carbodithioic acid derivatives. Appl. Surf. Sci. 2006, 252, 4120–4128. [Google Scholar] [CrossRef]
  3. Rosca, V.; Koper, M.T.M. Electrocatalytic oxidation of hydrazine on platinum electrodes in alkaline solutions. Electrochim. Acta 2008, 53, 5199–5205. [Google Scholar] [CrossRef]
  4. Lan, R.; Irvine, J.T.S.; Tao, S. Ammonia and related chemicals as potential indirect hydrogen storage materials. Int. J. Hydrogen Energy 2012, 37, 1482–1494. [Google Scholar] [CrossRef]
  5. Serov, A.; Kwak, C. Direct hydrazine fuel cells: A review. Appl. Catal. B Environ. 2010, 98, 1–9. [Google Scholar] [CrossRef]
  6. Toth, B. Synthetic and naturally occurring hydrazines as possible cancer causative agents. Cancer Res. 1975, 35, 3693–3697. [Google Scholar]
  7. Garrod, S.; Bollard, M.E.; Nicholls, A.W.; Connor, S.C.; Connelly, J.; Nicholson, J.K.; Holmes, E. Integrated metabonomic analysis of the multiorgan effects of hydrazine toxicity in the rat. Chem. Res. Toxicol. 2005, 18, 115–122. [Google Scholar] [CrossRef] [PubMed]
  8. Reilly, C.A.; Aust, S.D. Peroxidase substrates stimulate the oxidation of hydralazine to metabolites which cause single-strand breaks in DNA. Chem. Res. Toxicol. 1997, 10, 328–334. [Google Scholar] [CrossRef]
  9. US Environmental Protection Agency (EPA). Integrated Risk Information System (IRIS) on Hydrazine/hydrazine Sulfate; National Center for Environmental Assessment, Office of Research and Development: Washington, DC, USA, 1999.
  10. Oh, J.A.; Shin, H.S. Simple and sensitive determination of hydrazine in drinking water by ultra-high-performance liquid chromatography-tandem mass spectrometry after derivatization with naphthalene-2,3-dialdehyde. J. Chromatogr. A 2015, 1395, 73–78. [Google Scholar] [CrossRef]
  11. George, M.; Nagaraja, K.S.; Balasubramanian, N. Spectrophotometric determination of hydrazine. Talanta 2008, 75, 27–31. [Google Scholar] [CrossRef]
  12. Maleki, N.; Safavi, A.; Farjami, E.; Tajabadi, F. Palladium nanoparticle decorated carbon ionic liquid electrode for highly efficient electrocatalytic oxidation and determination of hydrazine. Anal. Chim. Acta 2008, 611, 151–155. [Google Scholar] [CrossRef] [PubMed]
  13. Ganesh, S.; Khan, F.; Ahmed, M.K.; Pandey, S.K. Potentiometric determination of free acidity in presence of hydrolysable ions and a sequential determination of hydrazine. Talanta 2011, 85, 958–963. [Google Scholar] [CrossRef]
  14. Gu, X.; Camden, J.P. Surface-enhanced raman spectroscopy-based approach for ultrasensitive and selective detection of hydrazine. Anal. Chem. 2015, 87, 6460–6464. [Google Scholar] [CrossRef]
  15. Abhijna Krishna, R.; Velmathi, S. A review on fluorimetric and colorimetric detection of metal ions by chemodosimetric approach 2013–2021. Coordin. Chem. Rev. 2022, 459, 214401. [Google Scholar] [CrossRef]
  16. Dou, W.-T.; Han, H.-H.; Sedgwick, A.C.; Zhu, G.-B.; Zang, Y.; Yang, X.-R.; Yoon, J.; James, T.D.; Li, J.; He, X.-P. Fluorescent probes for the detection of disease-associated biomarkers. Sci. Bull. 2022, 67, 853–878. [Google Scholar] [CrossRef] [PubMed]
  17. Yan, L.; Zhang, S.; Xie, Y.; Mu, X.; Zhu, J. Recent progress in the development of fluorescent probes for the detection of hydrazine (N2H4). Crit. Rev. Anal. Chem. 2022, 52, 210–229. [Google Scholar] [CrossRef] [PubMed]
  18. Zhang, X.-Y.; Yang, Y.-S.; Wang, W.; Jiao, Q.-C.; Zhu, H.-L. Fluorescent sensors for the detection of hydrazine in environmental and biological systems: Recent advances and future prospects. Coord. Chem. Rev. 2020, 417, 213367. [Google Scholar] [CrossRef]
  19. Jiang, J.-H.; Zhang, Z.-H.; Qu, J.; Wang, J.-Y. A lysosomal targeted fluorescent probe based on coumarin for monitoring hydrazine in living cells with high performance. Anal. Methods 2021, 14, 17–21. [Google Scholar] [CrossRef] [PubMed]
  20. Hu, X.-W.; Zhang, M.-H.; Cheng, J.-Y.; Man, R.-J.; Li, D.-D. A berberrubine-derived fluorescent probe for hydrazine and its practical application in water and food samples. Anal. Chim. Acta 2021, 1172, 338504. [Google Scholar] [CrossRef]
  21. Chen, Y.; Mo, W.; Cheng, Z.; Kong, F.; Chen, C.; Li, X.; Ma, H. A portable system based on turn-on fluorescent probe for the detection of hydrazine in real environment. Dyes Pigm. 2022, 198, 110004. [Google Scholar] [CrossRef]
  22. Tang, L.; Zhou, L.; Liu, A.; Yan, X.; Zhong, K.; Liu, X.; Gao, X.; Li, J. A new cascade reaction-based colorimetric and fluorescence “turn on” dual-function probe for cyanide and hydrazine detection. Dyes Pigm. 2021, 186, 109034. [Google Scholar] [CrossRef]
  23. Luo, M.; Li, Q.; Shen, P.; Hu, S.; Wang, J.; Wu, Z.; Su, Z. Coumarin 1,4-enedione for selective detection of hydrazine in aqueous solution and fluorescence imaging in living cells. Anal. Bioanal. Chem. 2021, 413, 7541–7548. [Google Scholar] [CrossRef] [PubMed]
  24. Xing, M.; Han, Y.; Zhu, Y.; Sun, Y.; Shan, Y.; Wang, K.-N.; Liu, Q.; Dong, B.; Cao, D.; Lin, W. Two ratiometric fluorescent probes based on the hydroxyl coumarin chalcone unit with large fluorescent peak shift for the detection of hydrazine in living cells. Anal. Chem. 2022, 94, 12836–12844. [Google Scholar] [CrossRef] [PubMed]
  25. Yang, Y.Z.; Qing, M.; Luo, X.Y.; Xie, J.; Zhang, L.N. A dual-response fluorescent probe for discriminative sensing of hydrazine and bisulfite as well as intracellular imaging with different emission. Spectrochim. Acta A 2022, 270, 120795. [Google Scholar] [CrossRef]
  26. Hou, J.-T.; Wang, B.; Wang, S.; Wu, Y.; Liao, Y.-X.; Ren, W.X. Detection of hydrazine via a highly selective fluorescent probe: A case study on the reactivity of cyano-substituted C=C bond. Dyes Pigm. 2020, 178, 108366. [Google Scholar] [CrossRef]
  27. Mu, S.; Gao, H.; Li, C.; Li, S.; Wang, Y.; Zhang, Y.; Ma, C.; Zhang, H.; Liu, X. A dual-response fluorescent probe for detection and bioimaging of hydrazine and cyanide with different fluorescence signals. Talanta 2021, 221, 121606. [Google Scholar] [CrossRef] [PubMed]
  28. Yang, H.; Li, M.; Zhang, Y.; Ruan, S.; Yin, J.; Song, J.; Yang, Y.; Wang, Z.; Wang, S. A smart nopinone-based fluorescent probe for colorimetric and fluorogenic detection of hydrazine in water and plants with high sensitivity and selectivity. J. Lumin. 2020, 226, 117436. [Google Scholar] [CrossRef]
  29. Samanta, S.K.; Maiti, K.; Ali, S.S.; Guria, U.N.; Ghosh, A.; Datta, P.; Mahapatra, A.K. A solvent directed D-π-A fluorescent chemodosimeter for selective detection of hazardous hydrazine in real water sample and living cell. Dyes Pigm. 2020, 173, 107997. [Google Scholar] [CrossRef]
  30. Ban, Y.; Wang, R.; Li, Y.; An, Z.; Yu, M.; Fang, C.; Wei, L.; Li, Z. Mitochondria-targeted ratiometric fluorescent detection of hydrazine with a fast response time. New J. Chem. 2018, 42, 2030–2035. [Google Scholar] [CrossRef]
  31. Zhu, B.; Wu, X.; Rodrigues, J.; Hu, X.; Sheng, R.; Bao, G.-M. A dual-analytes responsive fluorescent probe for discriminative detection of ClO and N2H4 in living cells. Spectrochim. Acta A 2021, 246, 118953. [Google Scholar] [CrossRef]
  32. Yan, H.; Huo, F.; Yue, Y.; Chao, J.; Yin, C. A practical pH-compatible fluorescent sensor for hydrazine in soil, water and living cells. Analyst 2020, 145, 7380–7387. [Google Scholar] [CrossRef] [PubMed]
  33. Shi, X.; Yin, C.; Zhang, Y.; Wen, Y.; Huo, F. A novel ratiometric and colorimetric fluorescent probe for hydrazine based on ring-opening reaction and its applications. Sens. Actuators B 2019, 285, 368–374. [Google Scholar] [CrossRef]
  34. Park, S.H.; Kwon, N.; Lee, J.H.; Yoon, J.; Shin, I. Synthetic ratiometric fluorescent probes for detection of ions. Chem. Soc. Rev. 2020, 49, 143–179. [Google Scholar] [CrossRef] [PubMed]
  35. Lee, M.H.; Kim, J.S.; Sessler, J.L. Small molecule-based ratiometric fluorescence probes for cations, anions, and biomolecules. Chem. Soc. Rev. 2015, 44, 4185–4191. [Google Scholar] [CrossRef]
  36. Tian, G.; Zhang, Z.; Li, H.; Li, D.; Wang, X.; Qin, C. Design, synthesis and application in analytical chemistry of photo-sensitive probes based on coumarin. Crit. Rev. Anal. Chem. 2021, 51, 565–581. [Google Scholar] [CrossRef]
  37. Cao, D.; Liu, Z.; Verwilst, P.; Koo, S.; Jangjili, P.; Kim, J.S.; Lin, W. Coumarin-based small-molecule fluorescent chemosensors. Chem. Rev. 2019, 119, 10403–10519. [Google Scholar] [CrossRef]
  38. Tian, X.; Li, M.; Zhang, Y.; Gong, S.; Wang, X.; Wang, Z.; Wang, S. A coumarin-based fluorescent probe for hydrazine detection and its applications in real water samples and living cells. J. Photochem. Photobiol. A Chem. 2023, 437, 114467. [Google Scholar] [CrossRef]
  39. Liu, X.; Zhu, M.; Xu, C.; Fan, F.; Chen, P.; Wang, Y.; Li, D. An ICT-based coumarin fluorescent probe for the detection of hydrazine and its application in environmental water samples and organisms. Front. Bioeng. Biotechnol. 2022, 10, 937489. [Google Scholar] [CrossRef]
  40. Wu, H.; Wang, Y.; Wu, W.-N.; Xu, Z.-Q.; Xu, Z.-H.; Zhao, X.-L.; Fan, Y.-C. A novel ‘turn-on’ coumarin-based fluorescence probe with aggregation-induced emission (AIE) for sensitive detection of hydrazine and its imaging in living cells. Spectrochim. Acta A 2019, 222, 117272. [Google Scholar] [CrossRef]
  41. Chen, S.; Hou, P.; Wang, J.; Liu, L.; Zhang, Q. A highly selective fluorescent probe based on coumarin for the imaging of N2H4 in living cells. Spectrochim. Acta A 2017, 173, 170–174. [Google Scholar] [CrossRef]
  42. Choi, M.G.; Hwang, J.; Moon, J.O.; Sung, J.; Chang, S.-K. Hydrazine-selective chromogenic and fluorogenic probe based on levulinated coumarin. Org. Lett. 2011, 13, 5260–5263. [Google Scholar] [CrossRef]
  43. Shi, X.; Yin, C.; Wen, Y.; Zhang, Y.; Huo, F. A probe with double acetoxyl moieties for hydrazine and its application in living cells. Spectrochim. Acta A 2018, 203, 106–111. [Google Scholar] [CrossRef] [PubMed]
  44. Fang, Q.; Yang, L.; Xiong, H.; Han, S.; Zhang, Y.; Wang, J.; Chen, W.; Song, X. Coumarinocoumarin-based fluorescent probe for the sensitive and selective detection of hydrazine in living cells and zebra fish. Chin. Chem. Lett. 2020, 31, 129–132. [Google Scholar] [CrossRef]
  45. Guo, S.-H.; Guo, Z.-Q.; Wang, C.-Y.; Shen, Y.; Zhu, W.-H. An ultrasensitive fluorescent probe for hydrazine detection and its application in water samples and living cells. Tetrahedron 2019, 75, 2642–2646. [Google Scholar] [CrossRef]
  46. Jiang, X.; Lu, Z.; Shangguan, M.; Yi, S.; Zeng, X.; Zhang, Y.; Hou, L. A fluorescence ‘‘turn-on” sensor for detecting hydrazine in environment. Microchem. J. 2020, 152, 104376. [Google Scholar] [CrossRef]
  47. Wang, X.; Zhou, Y.; Xu, C.; Song, H.; Pang, X.; Liu, X. A dual-responsive fluorescent probe for detection of fluoride ion and hydrazine based on test strips. Spectrochim. Acta A 2019, 211, 125–131. [Google Scholar] [CrossRef]
  48. Jiang, X.; Shangguan, M.; Lu, Z.; Yi, S.; Zeng, X.; Zhang, Y.; Hou, L. A “turn-on” fluorescent probe based on V-shaped bis-coumarin for detection of hydrazine. Tetrahedron 2020, 76, 130921. [Google Scholar] [CrossRef]
  49. Li, K.; Xu, H.-R.; Yu, K.-K.; Hou, J.-T.; Yu, X.-Q. A coumarin-based chromogenic and ratiometric probe for hydrazine. Anal. Methods 2013, 5, 2653–2656. [Google Scholar] [CrossRef]
  50. Garazd, M.M.; Garazd, Y.L.; Ogorodniichuk, A.S.; Khilya, V.P. Modified coumarins. 29. Synthesis of structural analogs of natural 6-arylfuro[3,2-g]chromen-7-ones. Chem. Nat. Comp. 2009, 45, 158–163. [Google Scholar] [CrossRef]
  51. Frisch, M.J.; Trucks, G.W.; Schlegel, H.B.; Scuseria, G.E.; Robb, M.A.; Cheeseman, J.R.; Scalmani, G.; Barone, V.; Petersson, G.A.; Nakatsuji, H.; et al. Gaussian 16, Revision A.03; Gaussian Inc.: Wallingford, CT, USA, 2016. [Google Scholar]
  52. Tomasi, J.; Mennucci, B.; Cammi, R. Quantum mechanical continuum solvation models. Chem. Rev. 2005, 105, 2999–3093. [Google Scholar] [CrossRef] [PubMed]
  53. Jung, Y.; Ju, I.G.; Choe, Y.H.; Kim, Y.; Park, S.; Hyun, Y.-M.; Oh, M.S.; Kim, D. Hydrazine Exposé: The next-generation fluorescent probe. ACS Sens. 2019, 4, 441–449. [Google Scholar] [CrossRef]
  54. Wang, B.; Yang, R.; Zhao, W. Construction of a mitochondria-targeted ratiometric fluorescent probe for monitoring hydrazine in soil samples and culture cells. J. Hazard. Mater. 2021, 406, 124589. [Google Scholar] [CrossRef] [PubMed]
  55. Wu, C.; Xie, R.; Pang, X.; Li, Y.; Zhou, Z.; Li, H. A colorimetric and near-infrared ratiometric fluorescent probe for hydrazine detection and bioimaging. Spectrochim. Acta A 2020, 243, 118764. [Google Scholar] [CrossRef] [PubMed]
  56. Ruan, S.; Gao, Y.; Wang, Y.; Li, M.; Yang, H.; Song, J.; Wang, Z.; Wang, S. A novel berberine-based colorimetric and fluorimetric probe for hydrazine detection. New J. Chem. 2020, 44, 15752–15757. [Google Scholar] [CrossRef]
  57. Zhang, X.; Shi, C.; Ji, P.; Jin, X.; Liu, J.; Zhu, H. A red-emitting fluorescent probe based on flavone for hydrazine detection and its application in aqueous solution. Anal. Methods 2016, 8, 2267–2273. [Google Scholar] [CrossRef]
  58. Wang, W.-D.; Hu, Y.; Li, Q.; Hu, S.-L. A carbazole-based turn-on fluorescent probe for the detection of hydrazine in aqueous solution. Inorg. Chim. Acta 2018, 477, 206–211. [Google Scholar] [CrossRef]
  59. Wang, J.; Wang, H.; Yang, S.; Tian, H.; Liu, Y.; Hao, Y.; Zhang, J.; Sun, B. A fluorescent probe for sensitive detection of hydrazine and its application in red wine and water. Anal. Sci. 2018, 34, 329–333. [Google Scholar] [CrossRef]
  60. Huang, X.; Zhou, Z.; Xiao, X.; Xia, L.; Li, G. Aldehyde spiropyran fluorescent probe for rapid determination of hydrazine in environmental water. Luminescence 2022, 37, 1891–1898. [Google Scholar] [CrossRef]
  61. Zheng, X.-X.; Wang, S.-Q.; Wang, H.-Y.; Zhang, R.-R.; Liu, J.-T.; Zhao, B.-X. Novel pyrazoline-based selective fluorescent probe for the detection of hydrazine. Spectrochim. Acta A 2015, 138, 247–251. [Google Scholar] [CrossRef]
  62. Li, Z.; Zhang, W.; Liu, C.; Yu, M.; Zhang, H.; Guo, L.; Wei, L. A colorimetric and ratiometric fluorescent probe for hydrazine and its application in living cells with low dark toxicity. Sens. Actuators B 2017, 241, 665–671. [Google Scholar] [CrossRef]
  63. Wang, L.; Pan, Q.; Chen, Y.; Ou, Y.; Li, H.; Li, B. A dual-response ratiometric fluorescent probe for hypochlorite and hydrazine detection and its imaging in living cells. Spectrochim. Acta A 2020, 241, 118672. [Google Scholar] [CrossRef] [PubMed]
  64. Wang, M.; Wang, X.; Li, X.; Yang, Z.; Guo, Z.; Zhang, J.; Ma, J.; Wei, C. A coumarin-fused ‘off-on’ fluorescent probe for highly selective detection of hydrazine. Spectrochim. Acta A 2020, 230, 118075. [Google Scholar] [CrossRef] [PubMed]
  65. Liu, Z.; Yang, Z.; Chen, S.; Liu, Y.; Sheng, L.; Tian, Z.; Huang, D.; Xu, H. A smart reaction-based fluorescence probe for ratio detection of hydrazine and its application in living cells. Microchem. J. 2020, 156, 104809. [Google Scholar] [CrossRef]
Scheme 1. CHAC and CHCO synthetic routes.
Molecules 28 07629 sch001
Figure 1. Time (a) and pH (b) effects upon the fluorescence intensity ratio (I480/I420) of CHAC (5 μM) in the absence and presence of N2H4 (500 μM).
Molecules 28 07629 g001
Figure 2. (a) CHAC (5 μM) FS after addition of various N2H4 concentrations (0–1000 μM) in DMSO:PBS buffer (10 mM, 4: 6 v/v, pH = 7.4); (b) plot of fluorescence intensity ratio I480/I420 versus the concentration of N2H4. Inset: The linearity of I480/I420 versus the concentration of N2H4 (0–500 μM).
Molecules 28 07629 g002
Figure 3. (a) CHAC (5 μM) FS upon N2H4 (500 μM) additions and different other analytes (500 μM) (1–28: Blank, Ammonia, Thiourea, Urea, NH2OH, Aniline, EDA, Cys, Hcy, GSH, CH3COO, I, N 3 , F, H 2 PO 4 , SO 4 2 , Cl, Br, HSO 3 , Fe2+, Ca2+, K+, Al3+, Mg2+, Na+, Fe3+, Cd2+, Zn2+); (b) Fluorescence intensity ratio I480/I420 of CHAC (5 μM) with various other analytes (500 μM), followed by 500 μM N2H4 addition.
Molecules 28 07629 g003
Scheme 2. Proposed sensing mechanism of CHAC for N2H4.
Molecules 28 07629 sch002
Figure 4. HPLC chromatograms of (a) probe CHAC (5 μM); (b) CHAC (5 μM) and 10 equiv N2H4; (c) probe CHAC (5 μM) and 50 equiv N2H4; (d) probe CHAC (5 μM) and 100 equiv N2H4; (e) compound CHOH (5 μM).
Molecules 28 07629 g004
Figure 5. The energy diagrams of the optimized structures, LUMO, and HOMO of CHAC and CHOH were obtained from TDDFT calculations.
Molecules 28 07629 g005
Figure 6. Figures of probe-coated filter papers on exposure to gaseous N2H4 from N2H4 aqueous solutions of various concentrations.
Molecules 28 07629 g006
Figure 7. Photographs under 365 nm UV lamp (a) and fluorescence intensity ratio I480/I420 (b) of probe CHAC solution (5 μM) after the addition of untreated and N2H4 pretreated and soils.
Molecules 28 07629 g007
Figure 8. Confocal fluorescence images (FIs) in MC3T3-E1 cells. FI regarding MC3T3-E1 cells alone (ad); Cells incubated through 10 μM CHAC for 0.5 h at 37 °C (eh); Cells pretreated via 10 μM CHAC and incubated with 500 μM N2H4 for 0.5 h at 37 °C (il). λex = 405 nm.
Molecules 28 07629 g008
Table 1. N2H4 detection in water samples.
SampleAdded (μM)Found (μM)Recovery (%)RSD (%)
Tap water0Not detected
5.005.36107.21.1
25.0025.51102.00.8
50.0052.07104.13.6
Lake water0Not detected
5.005.13102.22.8
25.0024.9199.50.8
50.0051.02102.03.3
Disclaimer/Publisher’s Note: The statements, opinions and data contained in all publications are solely those of the individual author(s) and contributor(s) and not of MDPI and/or the editor(s). MDPI and/or the editor(s) disclaim responsibility for any injury to people or property resulting from any ideas, methods, instructions or products referred to in the content.

