

Comparative Study on the Sensing Kinetics of Carbon and Nitrogen Nutrients in Cancer Tissues and Normal Tissues Based Electrochemical Biosensors

 ,
,  , ,
, , 
Abstract
:
1. Introduction
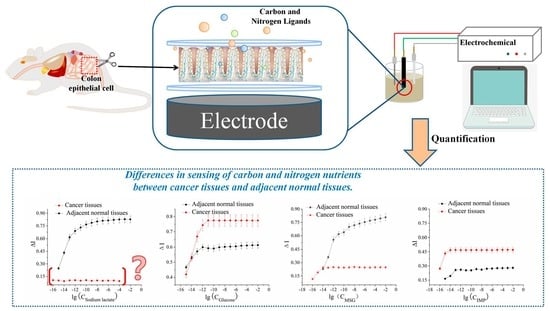
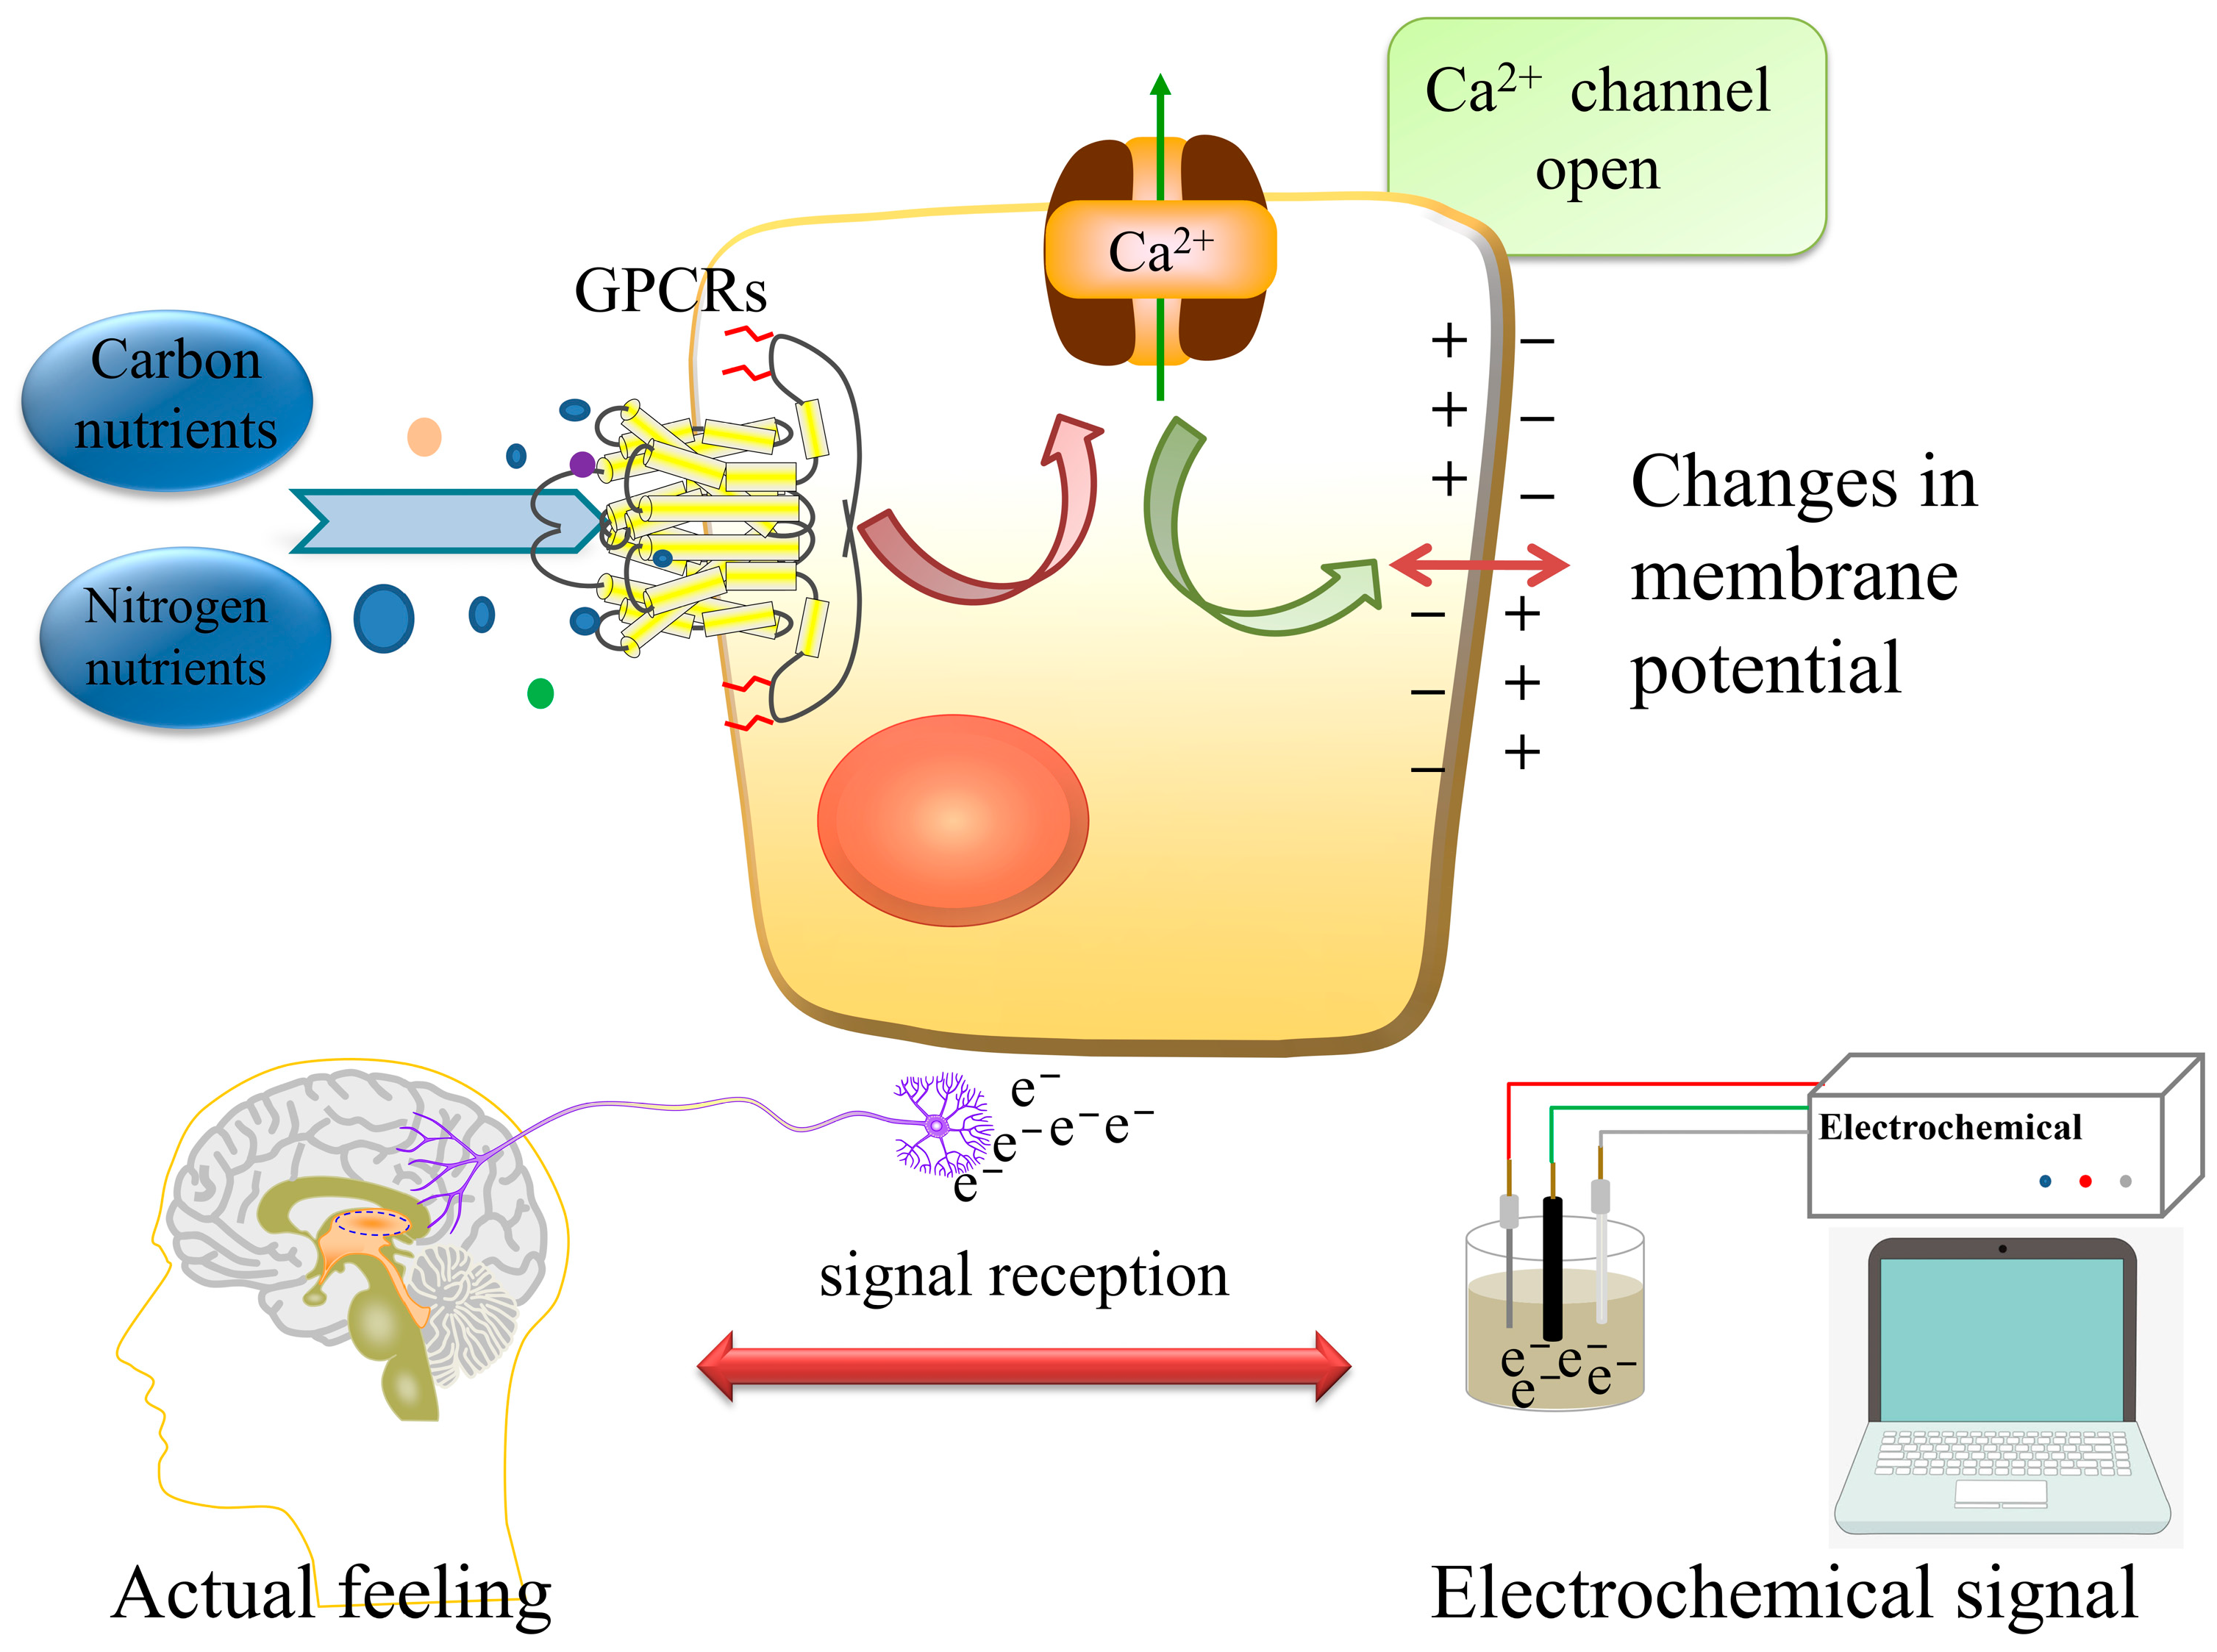
2. Results and Discussion
2.1. Potential Optimization of the Current-Time Measurement Method
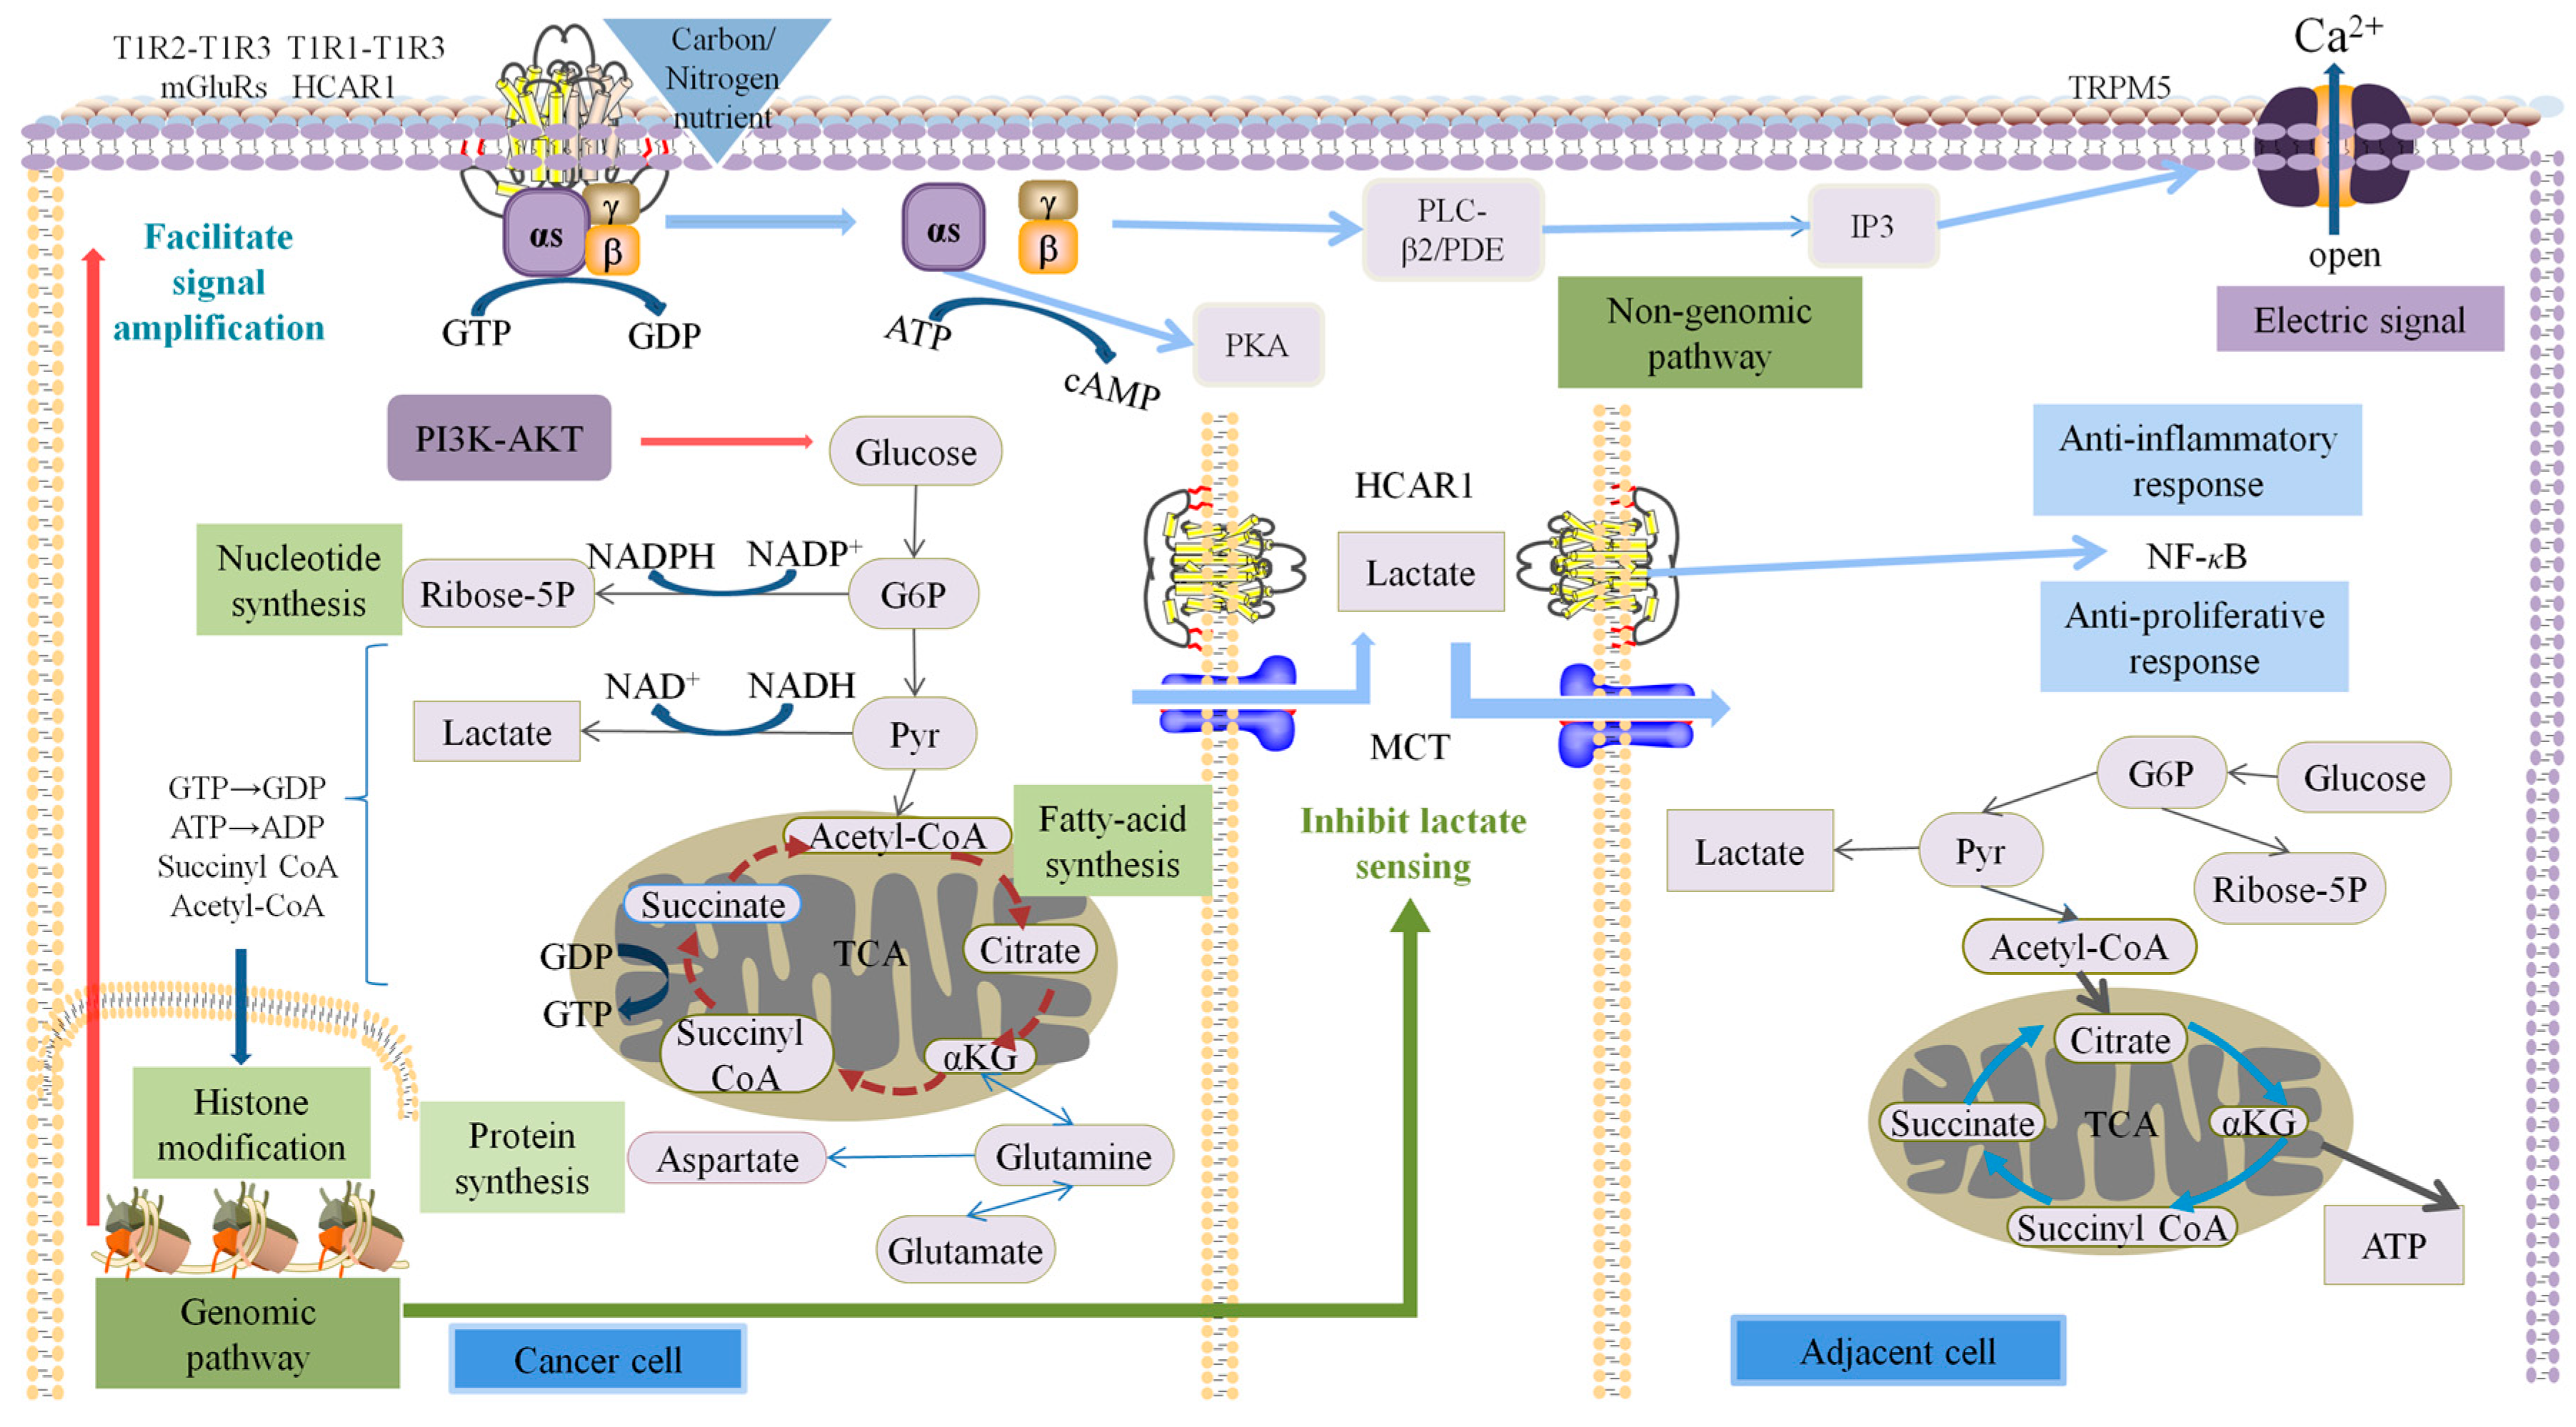
2.2. Studies on the Sensing Kinetics of Carbon and Nitrogen Nutrients
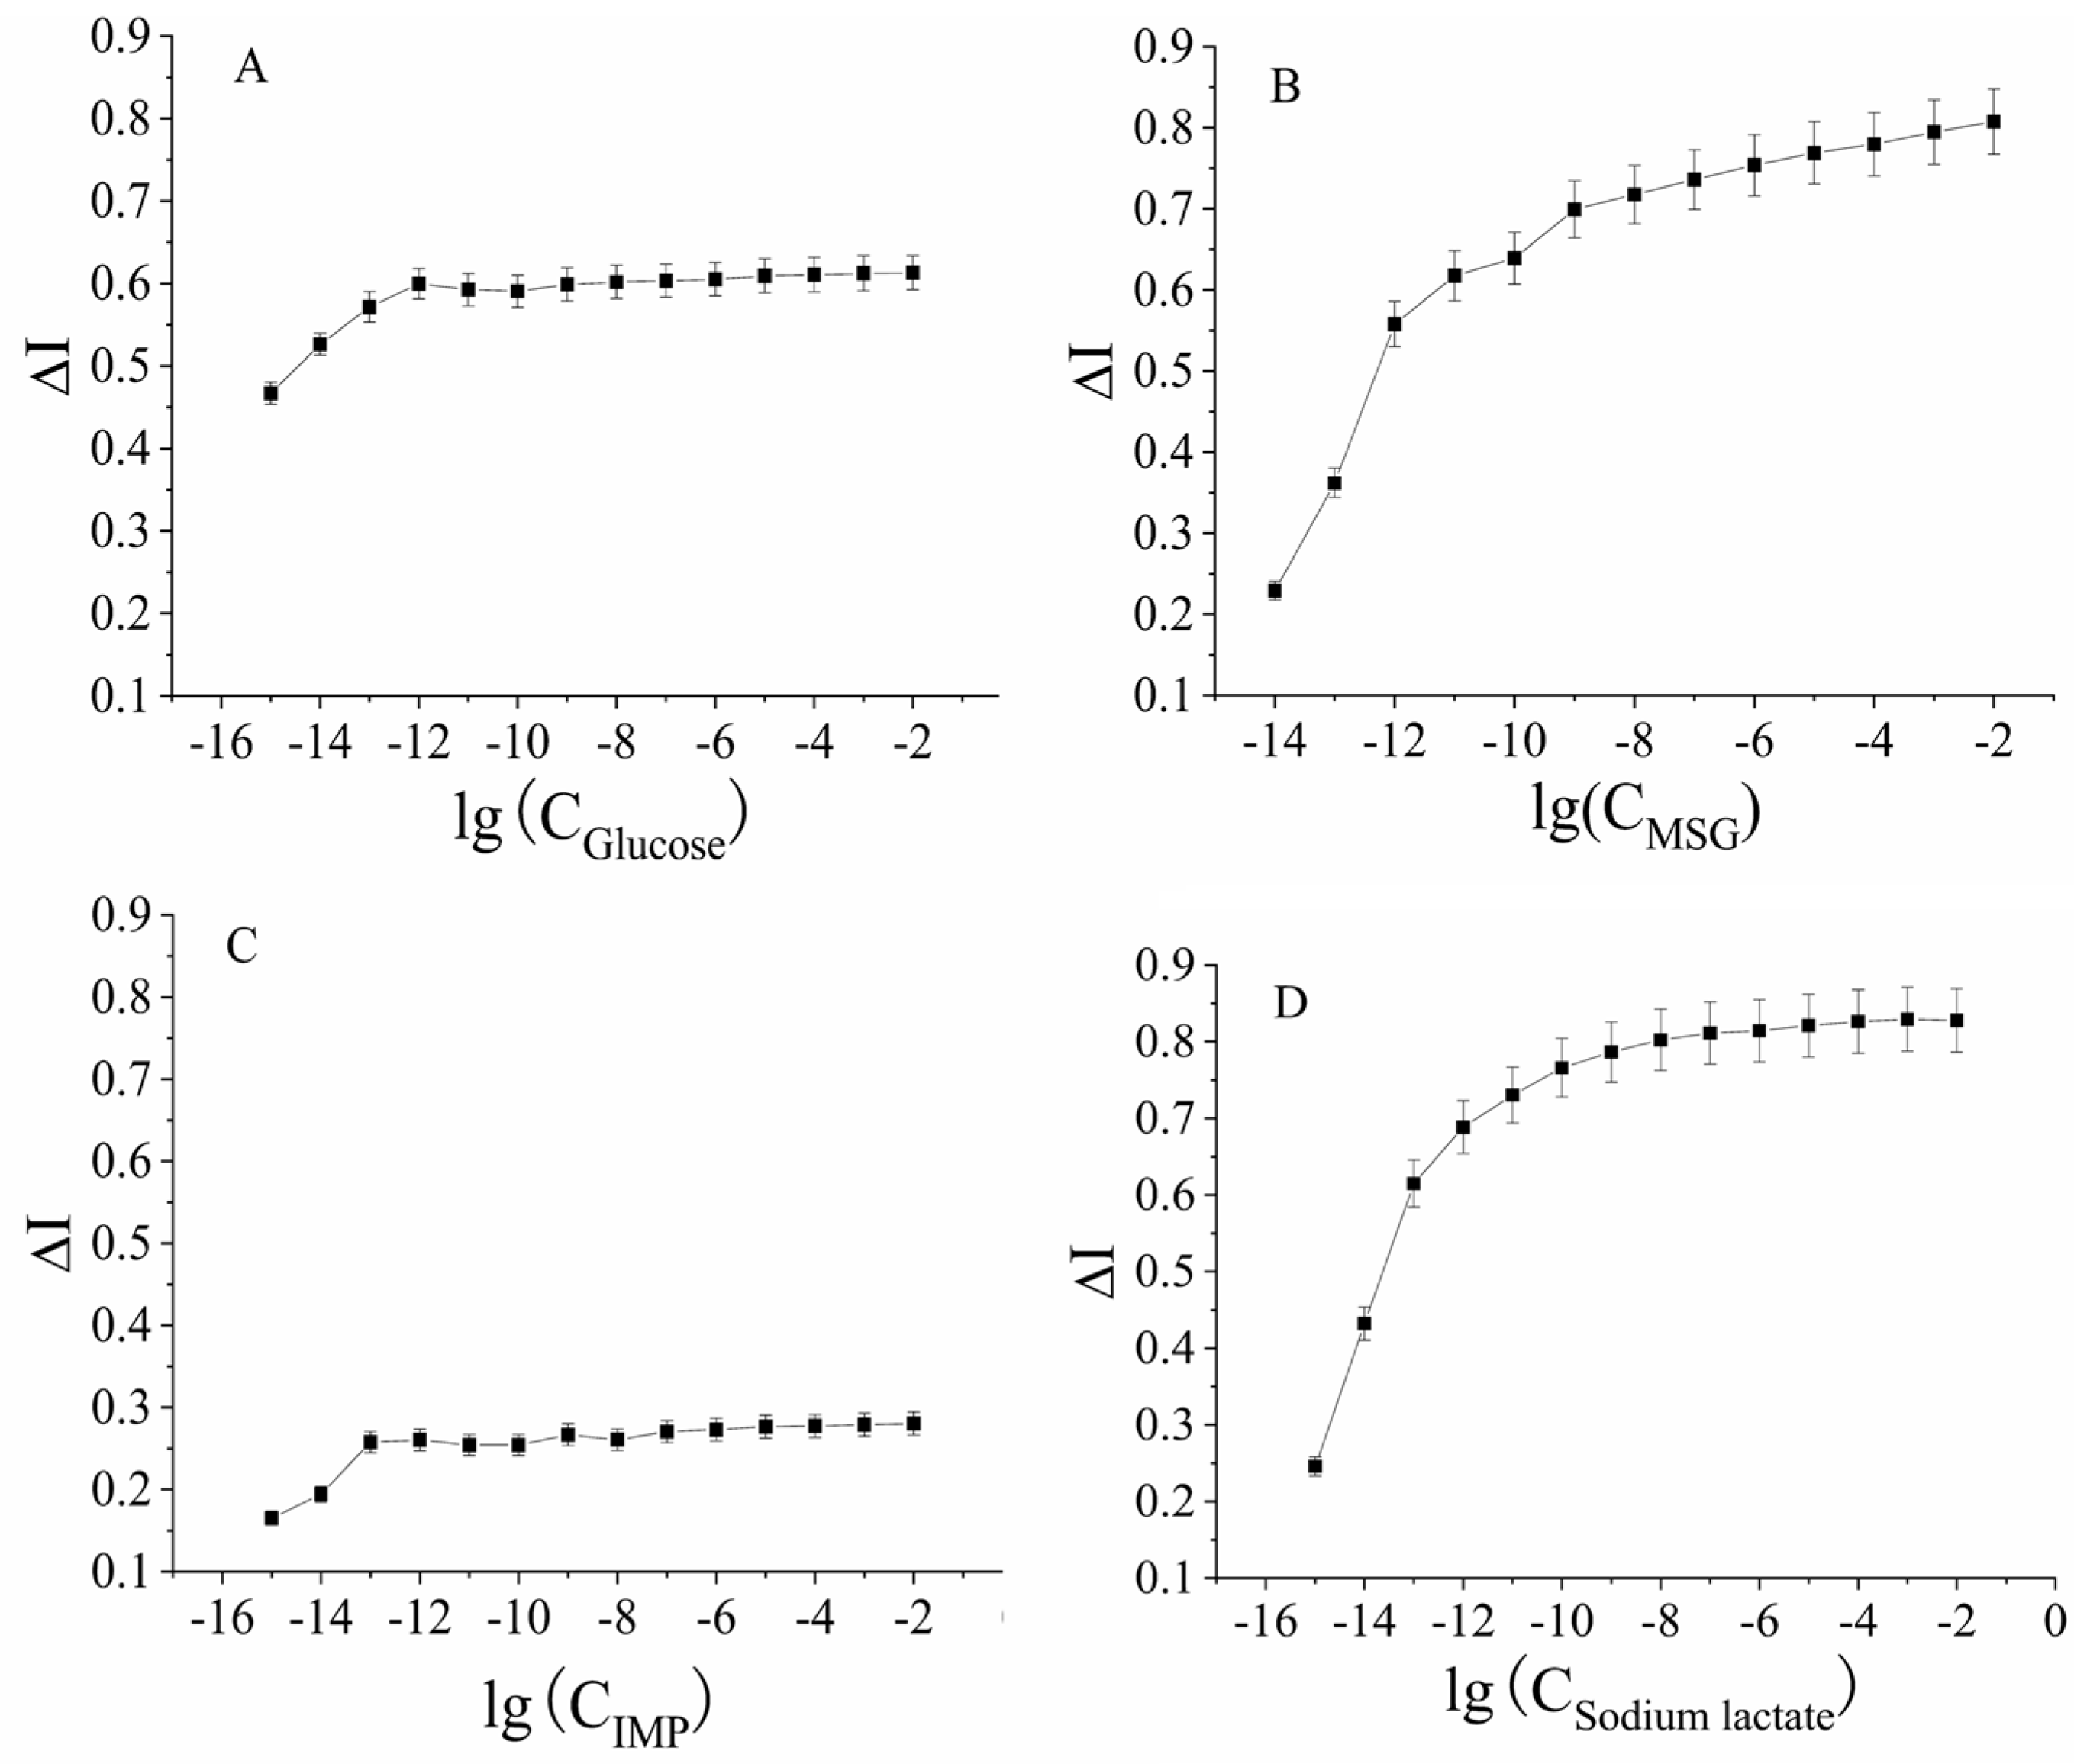
2.2.1. The Curve of Carbon and Nitrogen Nutrient Detection by the Cancer Adjacent Tissue-Based Biosensor
2.2.2. Kinetic Curves of the Signal Output from the Interactions of Four Carbon and Nitrogen Nutrients with Receptors in Adjacent Tissues
2.2.3. Kinetic Curves of the Signal Output from the Interaction of the Four Nutrients and the Receptor on Cancer Tissue
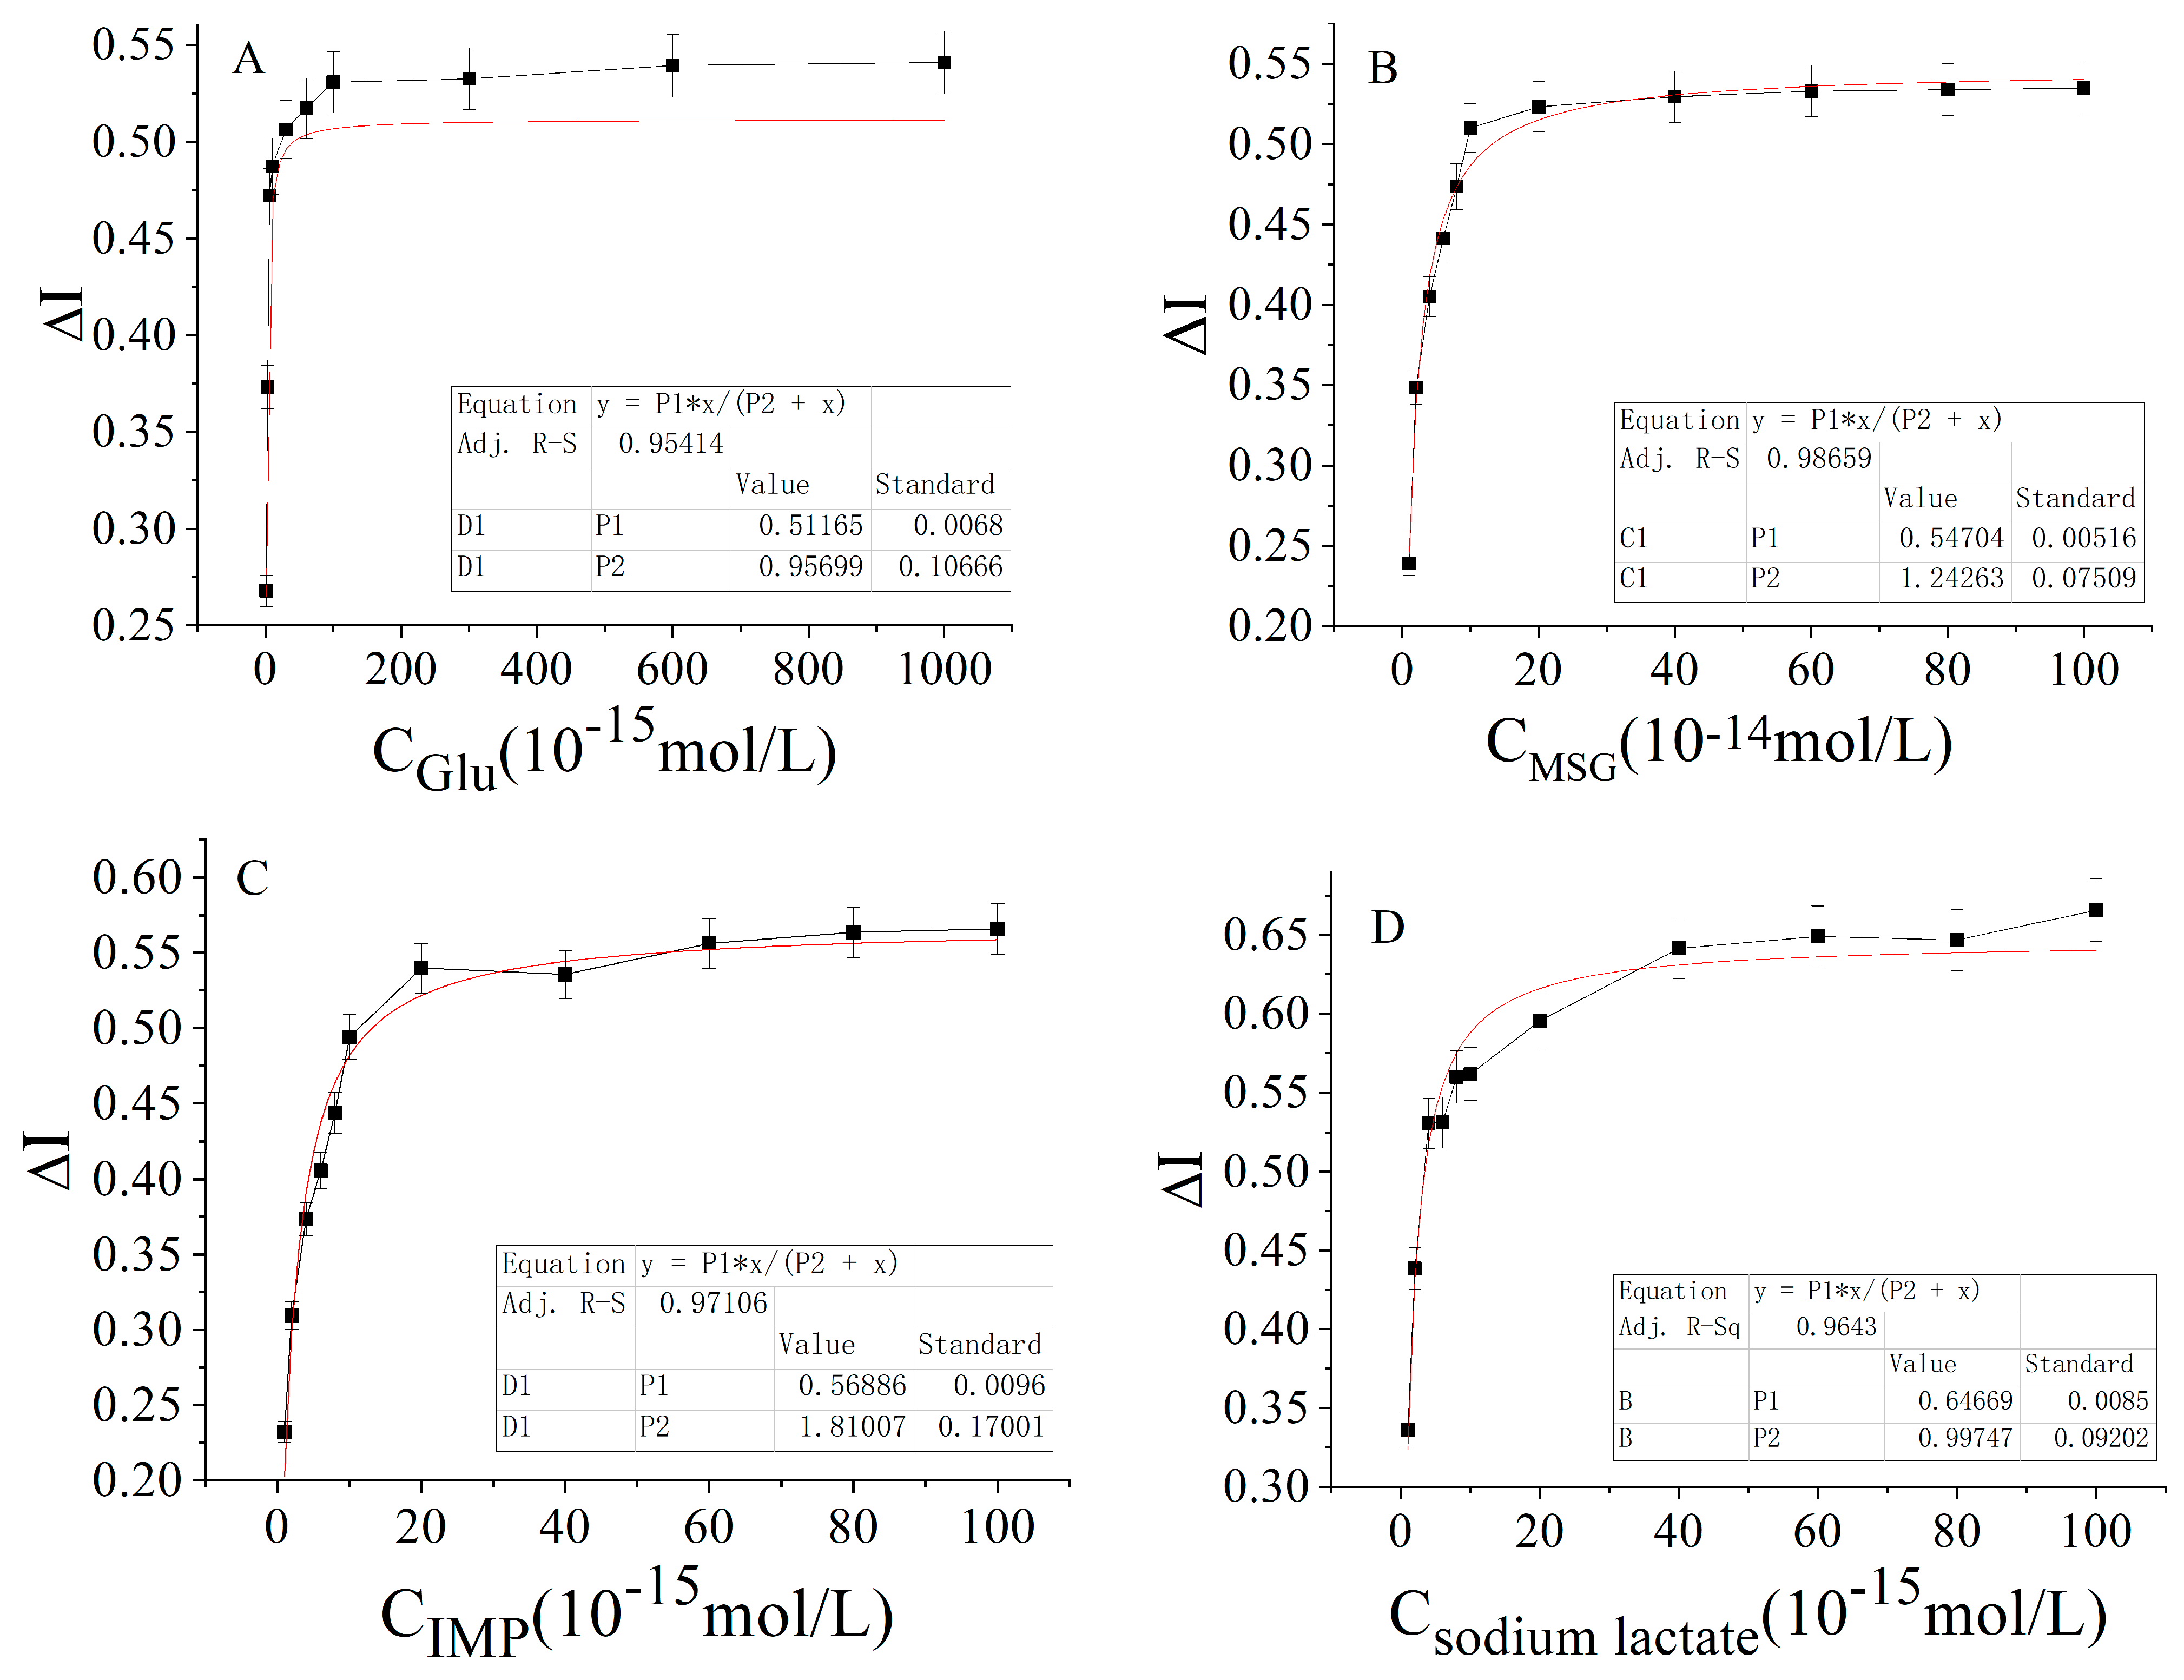
2.3. Activation Constant of the Receptor and the Ligand
2.4. Estimation of Cell Cascade Magnification
2.5. Estimation of the Minimum Number of Receptors Required to Activate Cancer-Adjacent Tissues or Cancerous Tissues to Achieve the Maximum Signal Output
2.6. Stability of Electrochemical Sensor
2.7. Discussion
3. Materials and Methods
3.1. Materials and Reagents
3.2. Instruments and Equipment
3.3. Methods
3.3.1. Establishment of the Mouse Colon Cancer Model
3.3.2. Electrode Pretreatment and Effect Characterization
3.3.3. Preparation of Electrochemical Biosensors
3.3.4. Determination of the Electrochemical Biosensor on Mouse Colon Tissue
4. Conclusions
Author Contributions
Funding
Data Availability Statement
Conflicts of Interest
References
- Siegel, R.L.; Miller, K.D.; Jemal, A. Cancer statistics, 2020. CA Cancer J. Clin. 2020, 70, 7–30. [Google Scholar] [CrossRef]
- Sonnenschein, C.; Soto, A.M. Theories of carcinogenesis: An emerging perspective. Semin. Cancer Biol. 2008, 18, 372–377. [Google Scholar] [CrossRef] [PubMed]
- Seyfried, T.N.; Shelton, L.M. Cancer as a metabolic disease. Nutr. Metab. 2010, 7, 7. [Google Scholar] [CrossRef] [PubMed]
- Seyfried, T.N.; Mukherjee, P. Targeting energy metabolism in brain cancer: Review and hypothesis. Nutr. Metab. 2005, 2, 30. [Google Scholar] [CrossRef]
- Semenza, G.L.; Artemov, D.; Bedi, A.; Bhujwalla, Z.; Chiles, K.; Feldser, D.; Laughner, E.; Ravi, R.; Simons, J.; Taghavi, P.; et al. ‘The Metabolism of Tumours’: 70 Years Later. Novartis Found. Symp. 2001, 240, 251–260. [Google Scholar] [CrossRef]
- Ristow, M. Oxidative metabolism in cancer growth. Curr. Opin. Clin. Nutr. Metab. Care 2006, 9, 339–345. [Google Scholar] [CrossRef]
- Denkert, C.; Budczies, J.; Weichert, W.; Wohlgemuth, G.; Scholz, M.; Kind, T.; Niesporek, S.; Noske, A.; Buckendahl, A.; Dietel, M.; et al. Metabolite profiling of human colon carcinoma—Deregulation of TCA cycle and amino acid turnover. Mol. Cancer 2008, 7, 72. [Google Scholar] [CrossRef]
- Polakis, E.; Bartley, W. Changes in the enzyme activities of Saccharomyces cerevisiae during aerobic growth on different carbon sources. Biochem. J. 1965, 97, 284–297. [Google Scholar] [CrossRef]
- Alasadi, A.; Chen, M.; Swapna, G.V.T.; Tao, H.; Guo, J.; Collantes, J.; Fadhil, N.; Montelione, G.T.; Jin, S. Effect of mitochondrial uncouplers niclosamide ethanolamine (NEN) and oxyclozanide on hepatic metastasis of colon cancer. Cell Death Dis. 2018, 9, 215. [Google Scholar] [CrossRef]
- Lozoya, O.A.; Martinez-Reyes, I.; Wang, T.; Grenet, D.; Bushel, P.; Li, J.; Chandel, N.; Woychik, R.P.; Santos, J.H. Mitochondrial nicotinamide adenine dinucleotide reduced (NADH) oxidation links the tricarboxylic acid (TCA) cycle with methionine metabolism and nuclear DNA methylation. PLoS Biol. 2018, 16, e2005707. [Google Scholar] [CrossRef] [Green Version]
- Jesinkey, S.R.; Madiraju, A.K.; Alves, T.C.; Yarborough, O.H.; Cardone, R.L.; Zhao, X.; Parsaei, Y.; Nasiri, A.R.; Butrico, G.; Liu, X.; et al. Mitochondrial GTP Links Nutrient Sensing to β Cell Health, Mitochondrial Morphology, and Insulin Secretion Independent of OxPhos. Cell Rep. 2019, 28, 759–772.e10. [Google Scholar] [CrossRef] [PubMed]
- Cai, R.; Huang, M.; Wang, Y. Targeted Quantitative Profiling of GTP-Binding Proteins in Cancer Cells Using Isotope-Coded GTP Probes. Anal. Chem. 2018, 90, 14339–14346. [Google Scholar] [CrossRef] [PubMed]
- Vega, F.M.; Ridley, A.J. Rho GTPases in cancer cell biology. FEBS Lett. 2008, 582, 2093–2101. [Google Scholar] [CrossRef]
- Vigil, D.; Cherfils, J.; Rossman, K.L.; Der, C.J. Ras superfamily GEFs and GAPs: Validated and tractable targets for cancer therapy? Nat. Rev. Cancer 2010, 10, 842–857. [Google Scholar] [CrossRef] [PubMed]
- Doherty, J.R.; Cleveland, J.L. Targeting lactate metabolism for cancer therapeutics. J. Clin. Investig. 2013, 123, 3685–3692. [Google Scholar] [CrossRef]
- McLaughlin, S.K.; McKinnon, P.J.; Margolskee, R.F. Gustducin is a taste-cell-specific G protein closely related to the transducins. Nature 1992, 357, 563–569. [Google Scholar] [CrossRef] [PubMed]
- Zhang, R.; Xie, X. Tools for GPCR drug discovery. Acta Pharmacol. Sin. 2012, 33, 372–384. [Google Scholar] [CrossRef]
- Scott, C.W.; Peters, M.F. Label-free whole-cell assays: Expanding the scope of GPCR screening. Drug Discov. Today 2010, 15, 704–716. [Google Scholar] [CrossRef]
- De la Nuez Veulens, A.; Rodriguez, R. Protein-coupled receptors as targets for drug design. Biotecnol. Apl. 2009, 26, 24–33. Available online: https://www.researchgate.net/publication/283078500_G_Proteincoupled_receptors_as_targets_for_drug_design (accessed on 7 September 2022).
- Case, A.; Huskey, W.P.; Stein, R.L. Enzymatic Reaction of Silent Substrates: Kinetic Theory and Application to the Serine Protease Chymotrypsin. Biochemistry 2003, 42, 4727–4732. [Google Scholar] [CrossRef]
- Johnson, K.A.; Goody, R.S. The Original Michaelis Constant: Translation of the 1913 Michaelis–Menten Paper. Biochemistry 2011, 50, 8264–8269. [Google Scholar] [CrossRef] [Green Version]
- Xu, Q.; Lu, D.; Pang, G. Study on Bombykol Receptor Self-Assembly and Universality of G Protein Cellular Signal Amplification System. ACS Sens. 2019, 4, 257–264. [Google Scholar] [CrossRef] [PubMed]
- Venkatakrishnan, A.J.; Deupi, X.; Lebon, G.; Tate, C.G.; Schertler, G.F.; Babu, M.M. Molecular signatures of G-protein-coupled receptors. Nature 2013, 494, 185–194. [Google Scholar] [CrossRef] [PubMed]
- Wei, L.; Qiao, L.; Pang, G.; Xie, J. A kinetic study of bitter taste receptor sensing using immobilized porcine taste bud tissues. Biosens. Bioelectron. 2017, 92, 74–80. [Google Scholar] [CrossRef]
- Ferraguti, F.; Shigemoto, R. Metabotropic glutamate receptors. Cell Tissue Res. 2006, 326, 483–504. [Google Scholar] [CrossRef] [PubMed]
- Nwachukwu, J.C.; Srinivasan, S.; Bruno, N.E.; Nowak, J.; Wright, N.J.; Minutolo, F.; Rangarajan, E.S.; Izard, T.; Yao, X.-Q.; Grant, B.J.; et al. Systems Structural Biology Analysis of Ligand Effects on ERα Predicts Cellular Response to Environmental Estrogens and Anti-hormone Therapies. Cell Chem. Biol. 2017, 24, 35–45. [Google Scholar] [CrossRef]
- Dai, Z.; Ramesh, V.; Locasale, J.W. The evolving metabolic landscape of chromatin biology and epigenetics. Nat. Rev. Genet. 2020, 21, 737–753. [Google Scholar] [CrossRef]
- Jones, P.A.; Baylin, S.B. The Epigenomics of Cancer. Cell 2007, 128, 683–692. [Google Scholar] [CrossRef]
- Hirschhaeuser, F.; Sattler, U.G.A.; Mueller-Klieser, W. Lactate: A Metabolic Key Player in Cancer. Cancer Res. 2011, 71, 6921–6925. [Google Scholar] [CrossRef]
- Metallo, C.M.; Heiden, M.G.V. Understanding Metabolic Regulation and Its Influence on Cell Physiology. Mol. Cell 2013, 49, 388–398. [Google Scholar] [CrossRef]
- Imai, S.-I.; Guarente, L. Ten years of NAD-dependent SIR2 family deacetylases: Implications for metabolic diseases. Trends Pharmacol. Sci. 2010, 31, 212–220. [Google Scholar] [CrossRef]
- Philp, A.; Macdonald, A.L.; Watt, P.W. Lactate—A signal coordinating cell and systemic function. J. Exp. Biol. 2005, 208, 4561–4575. [Google Scholar] [CrossRef]
- Zhao, Y.; Li, M.; Yao, X.; Fei, Y.; Lin, Z.; Li, Z.; Cai, K.; Zhao, Y.; Luo, Z. HCAR1/MCT1 Regulates Tumor Ferroptosis through the Lactate-Mediated AMPK-SCD1 Activity and Its Therapeutic Implications. Cell Rep. 2020, 33, 108487. [Google Scholar] [CrossRef] [PubMed]
- Lerch, M.M.; Conwell, D.L.; Mayerle, J. The Anti-inflammasome Effect of Lactate and the Lactate GPR81-Receptor in Pancreatic and Liver Inflammation. Gastroenterology 2014, 146, 1602–1605. [Google Scholar] [CrossRef] [PubMed]
- Donigan, M.; Loh, B.D.; Norcross, L.S.; Li, S.; Williamson, P.R.; DeJesus, S.; Ferrara, A.; Gallagher, J.T.; Baker, C.H. A metastatic colon cancer model using nonoperative transanal rectal injection. Surg. Endosc. 2010, 24, 642–647. [Google Scholar] [CrossRef] [PubMed]
- Gombotz, W.R.; Wee, S.F. Protein release from alginate matrices. Adv. Drug Deliv. Rev. 2012, 64, 194–205. [Google Scholar] [CrossRef]
- Zactiti, E.M.; Kieckbusch, T.G. Release of potassium sorbate from active films of sodium alginate crosslinked with calcium chloride. Packag. Technol. Sci. 2009, 22, 349–358. [Google Scholar] [CrossRef]
- Reiss, M.; Heibges, A.; Metzger, J.; Hartmeier, W. Determination of BOD-values of starch-containing waste water by a BOD-biosensor. Biosens. Bioelectron. 1998, 13, 1083–1090. [Google Scholar] [CrossRef] [PubMed]
- Bierhalz, A.C.; da Silva, M.A.; Braga, M.E.; Sousa, H.J.; Kieckbusch, T.G. Effect of calcium and/or barium crosslinking on the physical and antimicrobial properties of natamycin-loaded alginate films. LWT Food Sci. Technol. 2014, 57, 494–501. [Google Scholar] [CrossRef]
- Rhim, J.-W. Physical and mechanical properties of water resistant sodium alginate films. LWT Food Sci. Technol. 2004, 37, 323–330. [Google Scholar] [CrossRef]


| Carbon and Nitrogen Nutrients | Hyperbolic Equation | Correlation Coefficient (R2) |
|---|---|---|
| Glucose | ΔI = 0.51165 (±0.0068) × 10−15 C/(0.95699 (±0.10666) + C × 10−15) | 0.9541 |
| MSG | ΔI = 0.54704 (±0.00516) × 10−14 C/(1.24263 (±0.07509) + C × 10−14) | 0.9866 |
| IMP | ΔI = 0.56886 (±0.0096) × 10−15 C/(1.81007 (±0.17001) + C × 10−15) | 0.9711 |
| Sodium lactate | ΔI = 0.64669 (±0.0085) × 10−14 C/(0.99747 (±0.09202) + C × 10−14) | 0.9643 |
| Carbon and Nitrogen Nutrients | Linear Regression Equation | Correlation Coefficient (R2) |
|---|---|---|
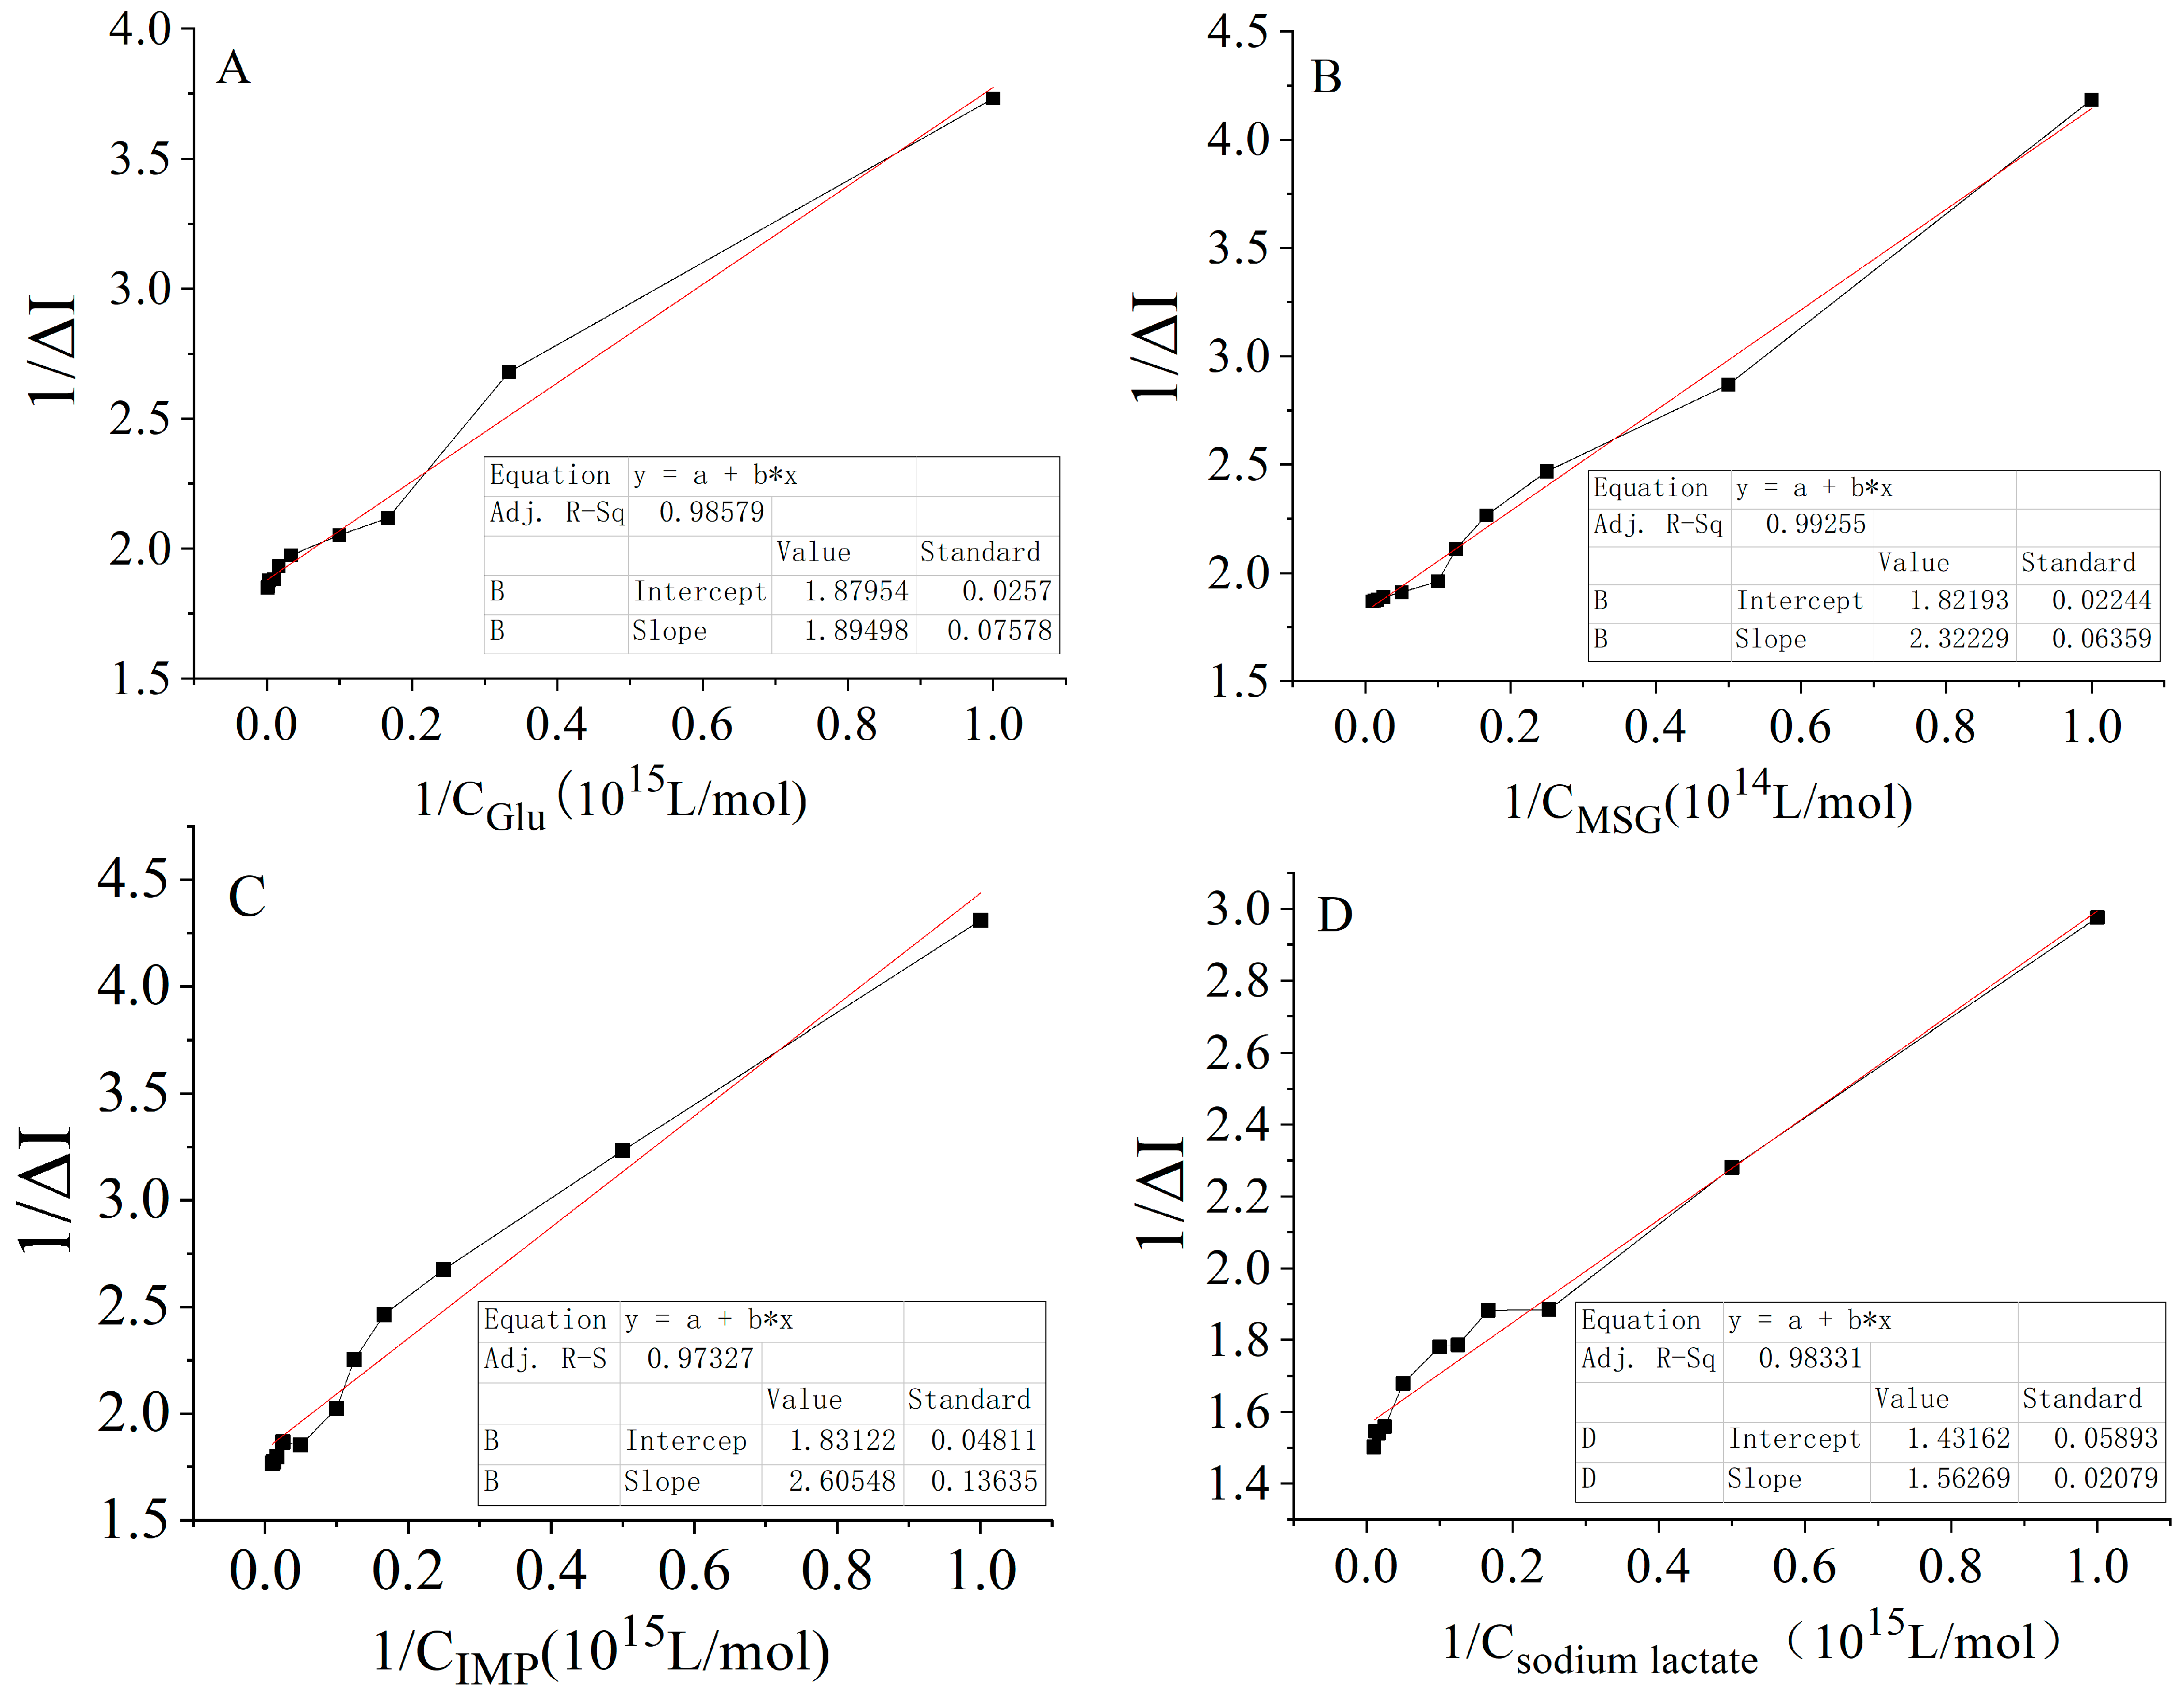
| Glucose | 1/ΔI = 1.8950 (±0.07578) × 1015 1/C + 1.8795 (±0.0257) | 0.9858 |
| MSG | 1/ΔI = 2.3223 (±0.06459) × 1014 1/C + 1.8219 (±0.02244) | 0.9926 |
| IMP | 1/ΔI = 2.6055 (±0.13635) × 1015 1/C + 1.8312 (±0.04811) | 0.9732 |
| Sodium lactate | 1/ΔI = 1.5627 (±0.02079) × 1014 1/C + 1.4316 (±0.05893) | 0.9833 |
| Carbon and Nitrogen Nutrients | Hyperbolic Equation | Correlation Coefficient (R2) |
|---|---|---|
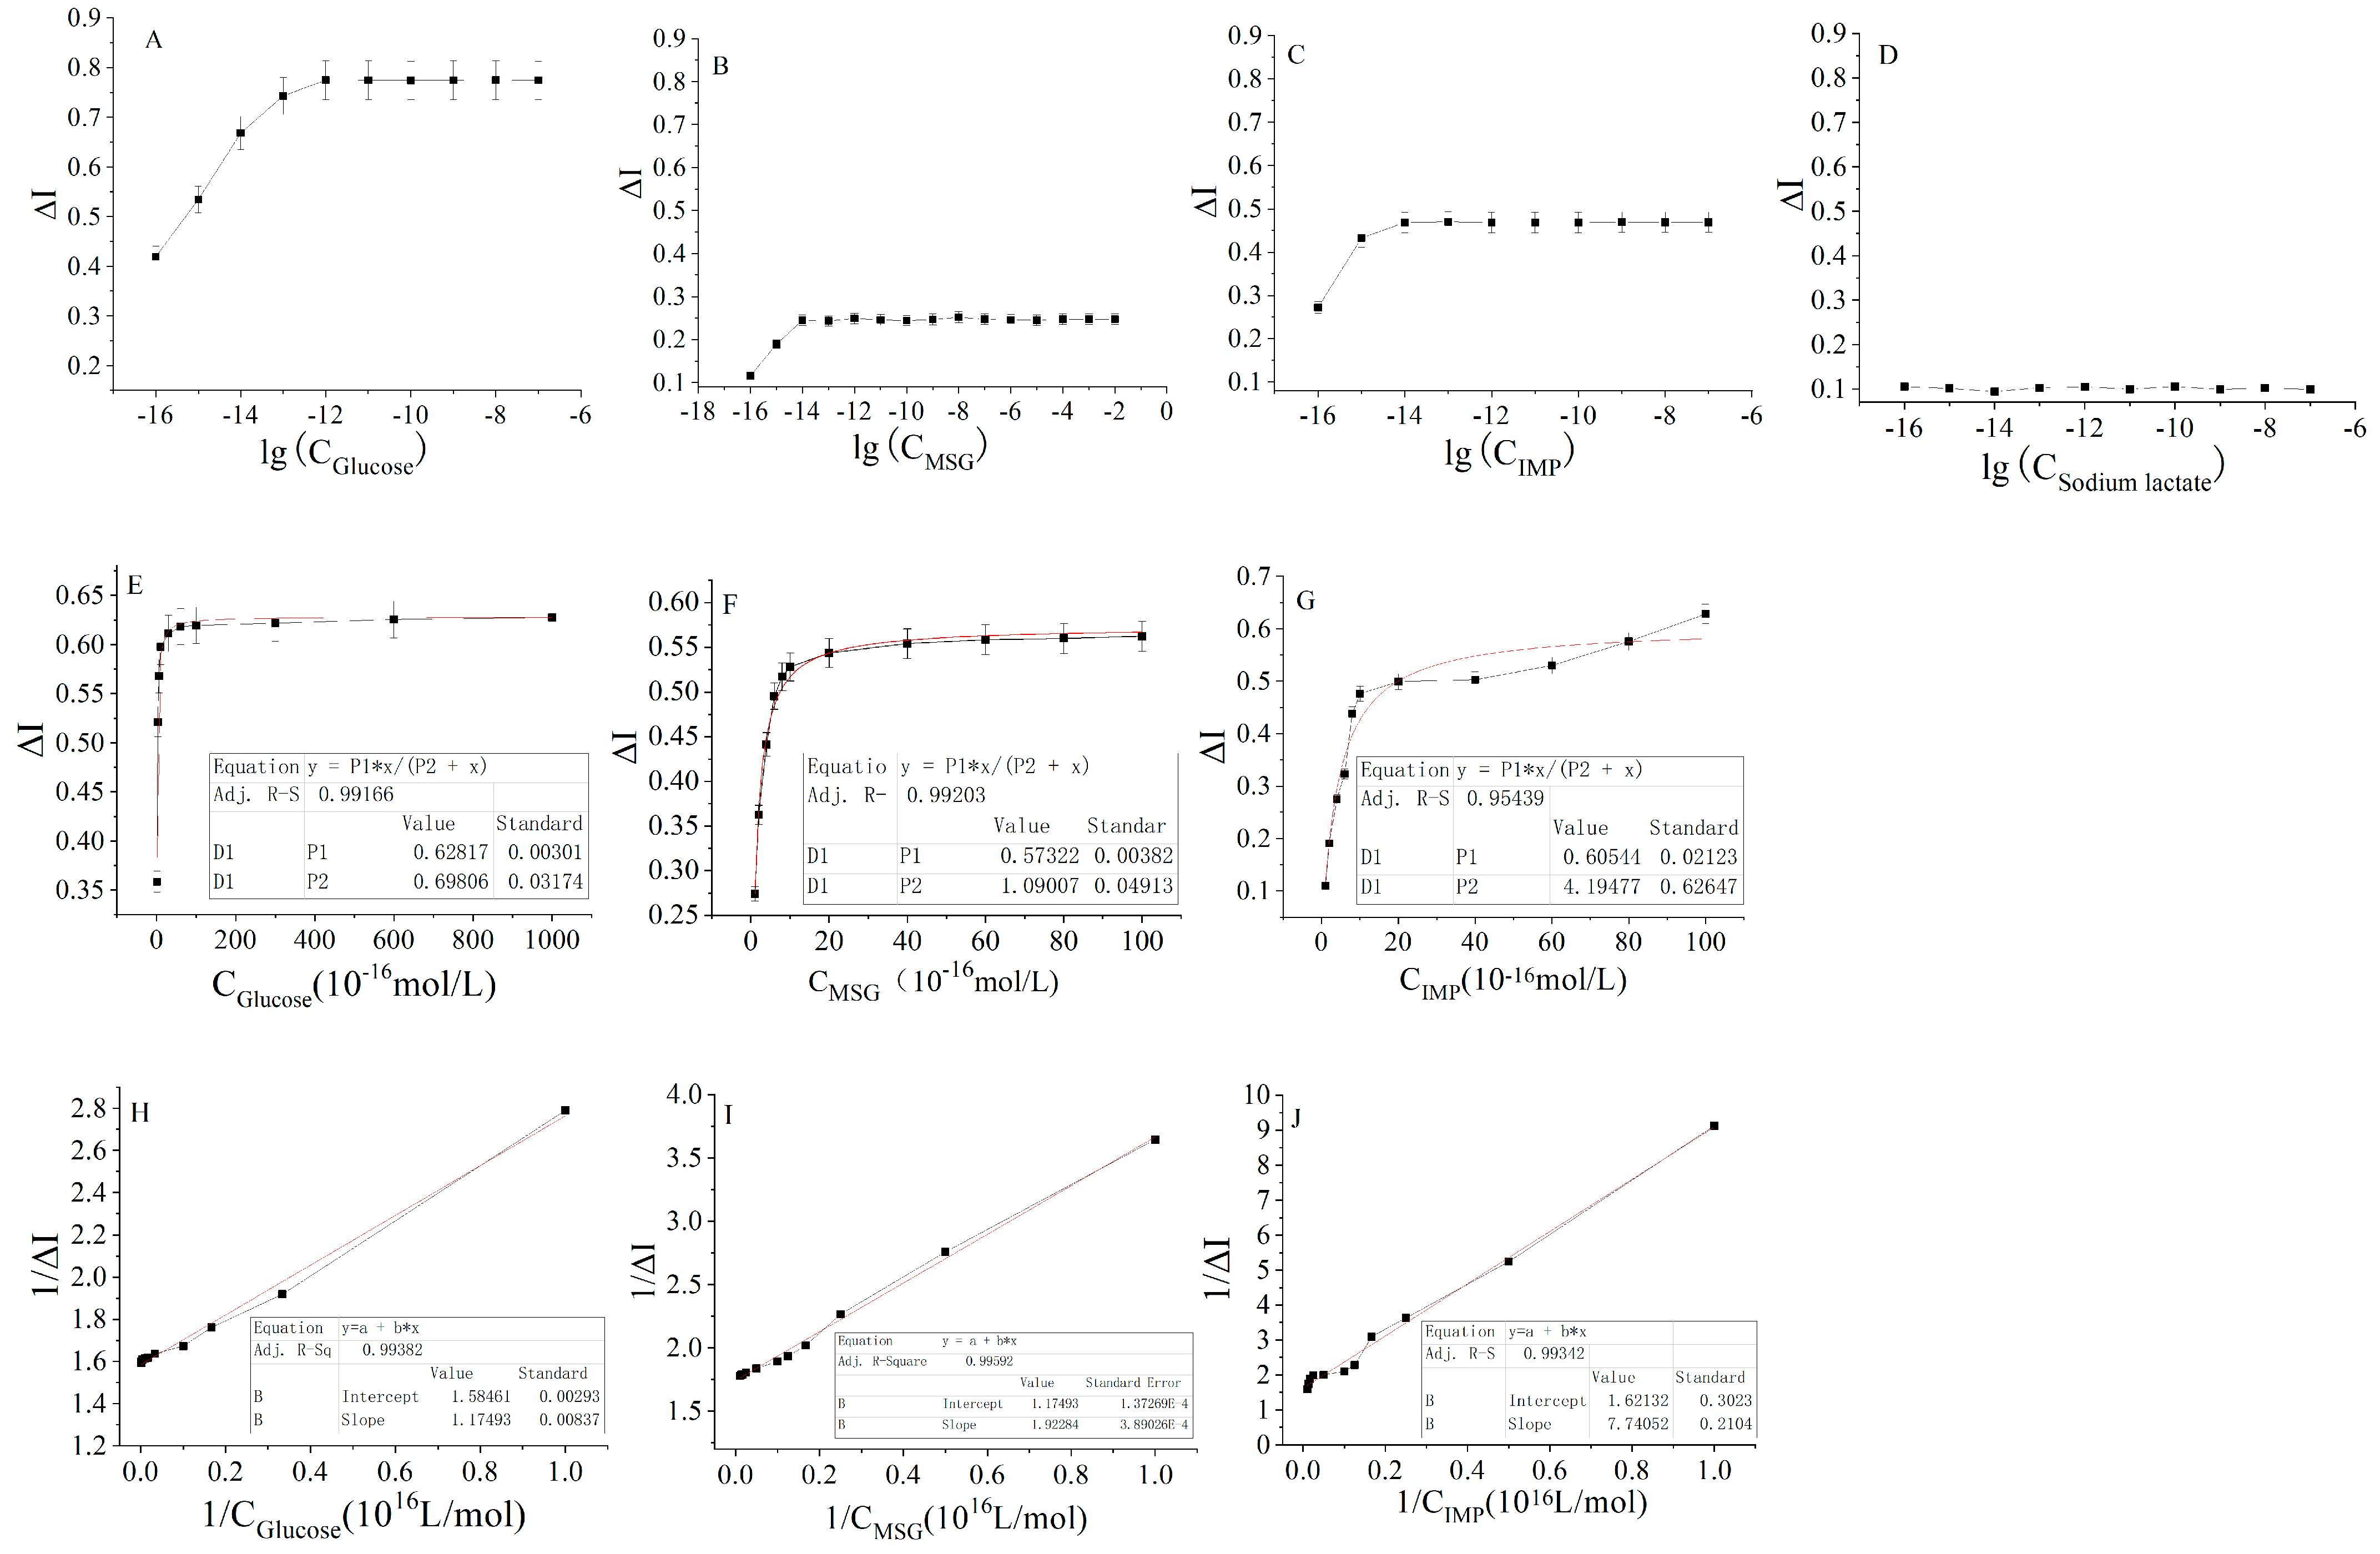
| Glucose | ΔI = 0.62817 (±0.00301) × 10−16 C/(0.69806 (±0.03174) + C × 10−16) | 0.9917 |
| MSG | ΔI = 0.57322 (±0.00382) × 10−16 C/(1.09007 (±0.04913) + C × 10−16) | 0.9920 |
| IMP | ΔI = 0.60544 (±0.02123) × 10−16 C/(4.19477 (±0.62647) + C × 10−16) | 0.9544 |
| Sodium lactate | ___ | ___ |
| Carbon and Nitrogen Nutrients | Linear Regression Equation | Correlation Coefficient (R2) |
|---|---|---|
| Glucose | 1/ΔI = 1.1794 (±0.00293) × 1016 1/C + 1.5846 (±0.00837) | 0.9938 |
| MSG | 1/ΔI = 1.9228 (±0.00039) × 1016 1/C + 1.7429 (±0.00014) | 0.9959 |
| IMP | 1/ΔI = 7.4705 (±0.2104) × 1016 1/C + 1.6213 (±0.3023) | 0.9934 |
| Sodium lactate | ___ | ___ |
| Carbon and Nitrogen Nutrients | Activation Constant (Ka) | Cascade Magnification | Minimum Number of Receptors | |||
|---|---|---|---|---|---|---|
| Colon Cancer Tissue | Adjacent Tissues | Colon Cancer Tissue | Adjacent Tissues | Colon Cancer Tissue | Adjacent Tissues | |
| Glucose | 7.438 × 10‒17 | 1.008 × 10‒15 | 1.544 × 10⁴ | 61.975 | 1.49 | 2.02 |
| MSG | 1.103 × 10‒16 | 1.275 × 10‒14 | 2.322 × 10⁴ | 85.883 | 2.20 | 2.55 |
| IMP | 4.608 × 10‒16 | 1.423 × 10‒15 | 1.943 × 10⁵ | 1.242 × 10³ | 9.21 | 2.85 |
| Sodium lactate | 9.162 × 10‒16 | 2.128 × 10⁶ | 1.83 | |||
| Carbon and Nitrogen Nutrients | Bare Electrode Action Equation | Correlation Coefficient (R2) |
|---|---|---|
| Glucose | ∆I/% = 5.02508 C1 + 92.4035 | 0.9914 |
| MSG | ∆I/% = 4.76044 Ca + 92.27473 | 0.9872 |
| IMP | ∆I/% = 3.90549 C3 + 70.93407 | 0.9891 |
| Sodium lactate | ∆I/% = 5.4711 C4 + 100.4991 | 0.9689 |
Disclaimer/Publisher’s Note: The statements, opinions and data contained in all publications are solely those of the individual author(s) and contributor(s) and not of MDPI and/or the editor(s). MDPI and/or the editor(s) disclaim responsibility for any injury to people or property resulting from any ideas, methods, instructions or products referred to in the content. |
© 2023 by the authors. Licensee MDPI, Basel, Switzerland. This article is an open access article distributed under the terms and conditions of the Creative Commons Attribution (CC BY) license (https://creativecommons.org/licenses/by/4.0/).
Share and Cite
Lu, D.; Liu, D.; Liu, Y.; Wang, X.; Liu, Y.; Yuan, S.; Ren, R.; Pang, G. Comparative Study on the Sensing Kinetics of Carbon and Nitrogen Nutrients in Cancer Tissues and Normal Tissues Based Electrochemical Biosensors. Molecules 2023, 28, 1453. https://doi.org/10.3390/molecules28031453
Lu D, Liu D, Liu Y, Wang X, Liu Y, Yuan S, Ren R, Pang G. Comparative Study on the Sensing Kinetics of Carbon and Nitrogen Nutrients in Cancer Tissues and Normal Tissues Based Electrochemical Biosensors. Molecules. 2023; 28(3):1453. https://doi.org/10.3390/molecules28031453
Chicago/Turabian StyleLu, Dingqiang, Danyang Liu, Yujiao Liu, Xinqian Wang, Yixuan Liu, Shuai Yuan, Ruijuan Ren, and Guangchang Pang. 2023. "Comparative Study on the Sensing Kinetics of Carbon and Nitrogen Nutrients in Cancer Tissues and Normal Tissues Based Electrochemical Biosensors" Molecules 28, no. 3: 1453. https://doi.org/10.3390/molecules28031453
APA StyleLu, D., Liu, D., Liu, Y., Wang, X., Liu, Y., Yuan, S., Ren, R., & Pang, G. (2023). Comparative Study on the Sensing Kinetics of Carbon and Nitrogen Nutrients in Cancer Tissues and Normal Tissues Based Electrochemical Biosensors. Molecules, 28(3), 1453. https://doi.org/10.3390/molecules28031453