
A Novel Quantum Dots-Based Fluorescent Sensor for Determination of the Anticancer Dacomitinib: Application to Dosage Forms

 , , ,
, , ,
Abstract
:1. Introduction
2. Results and Discussion
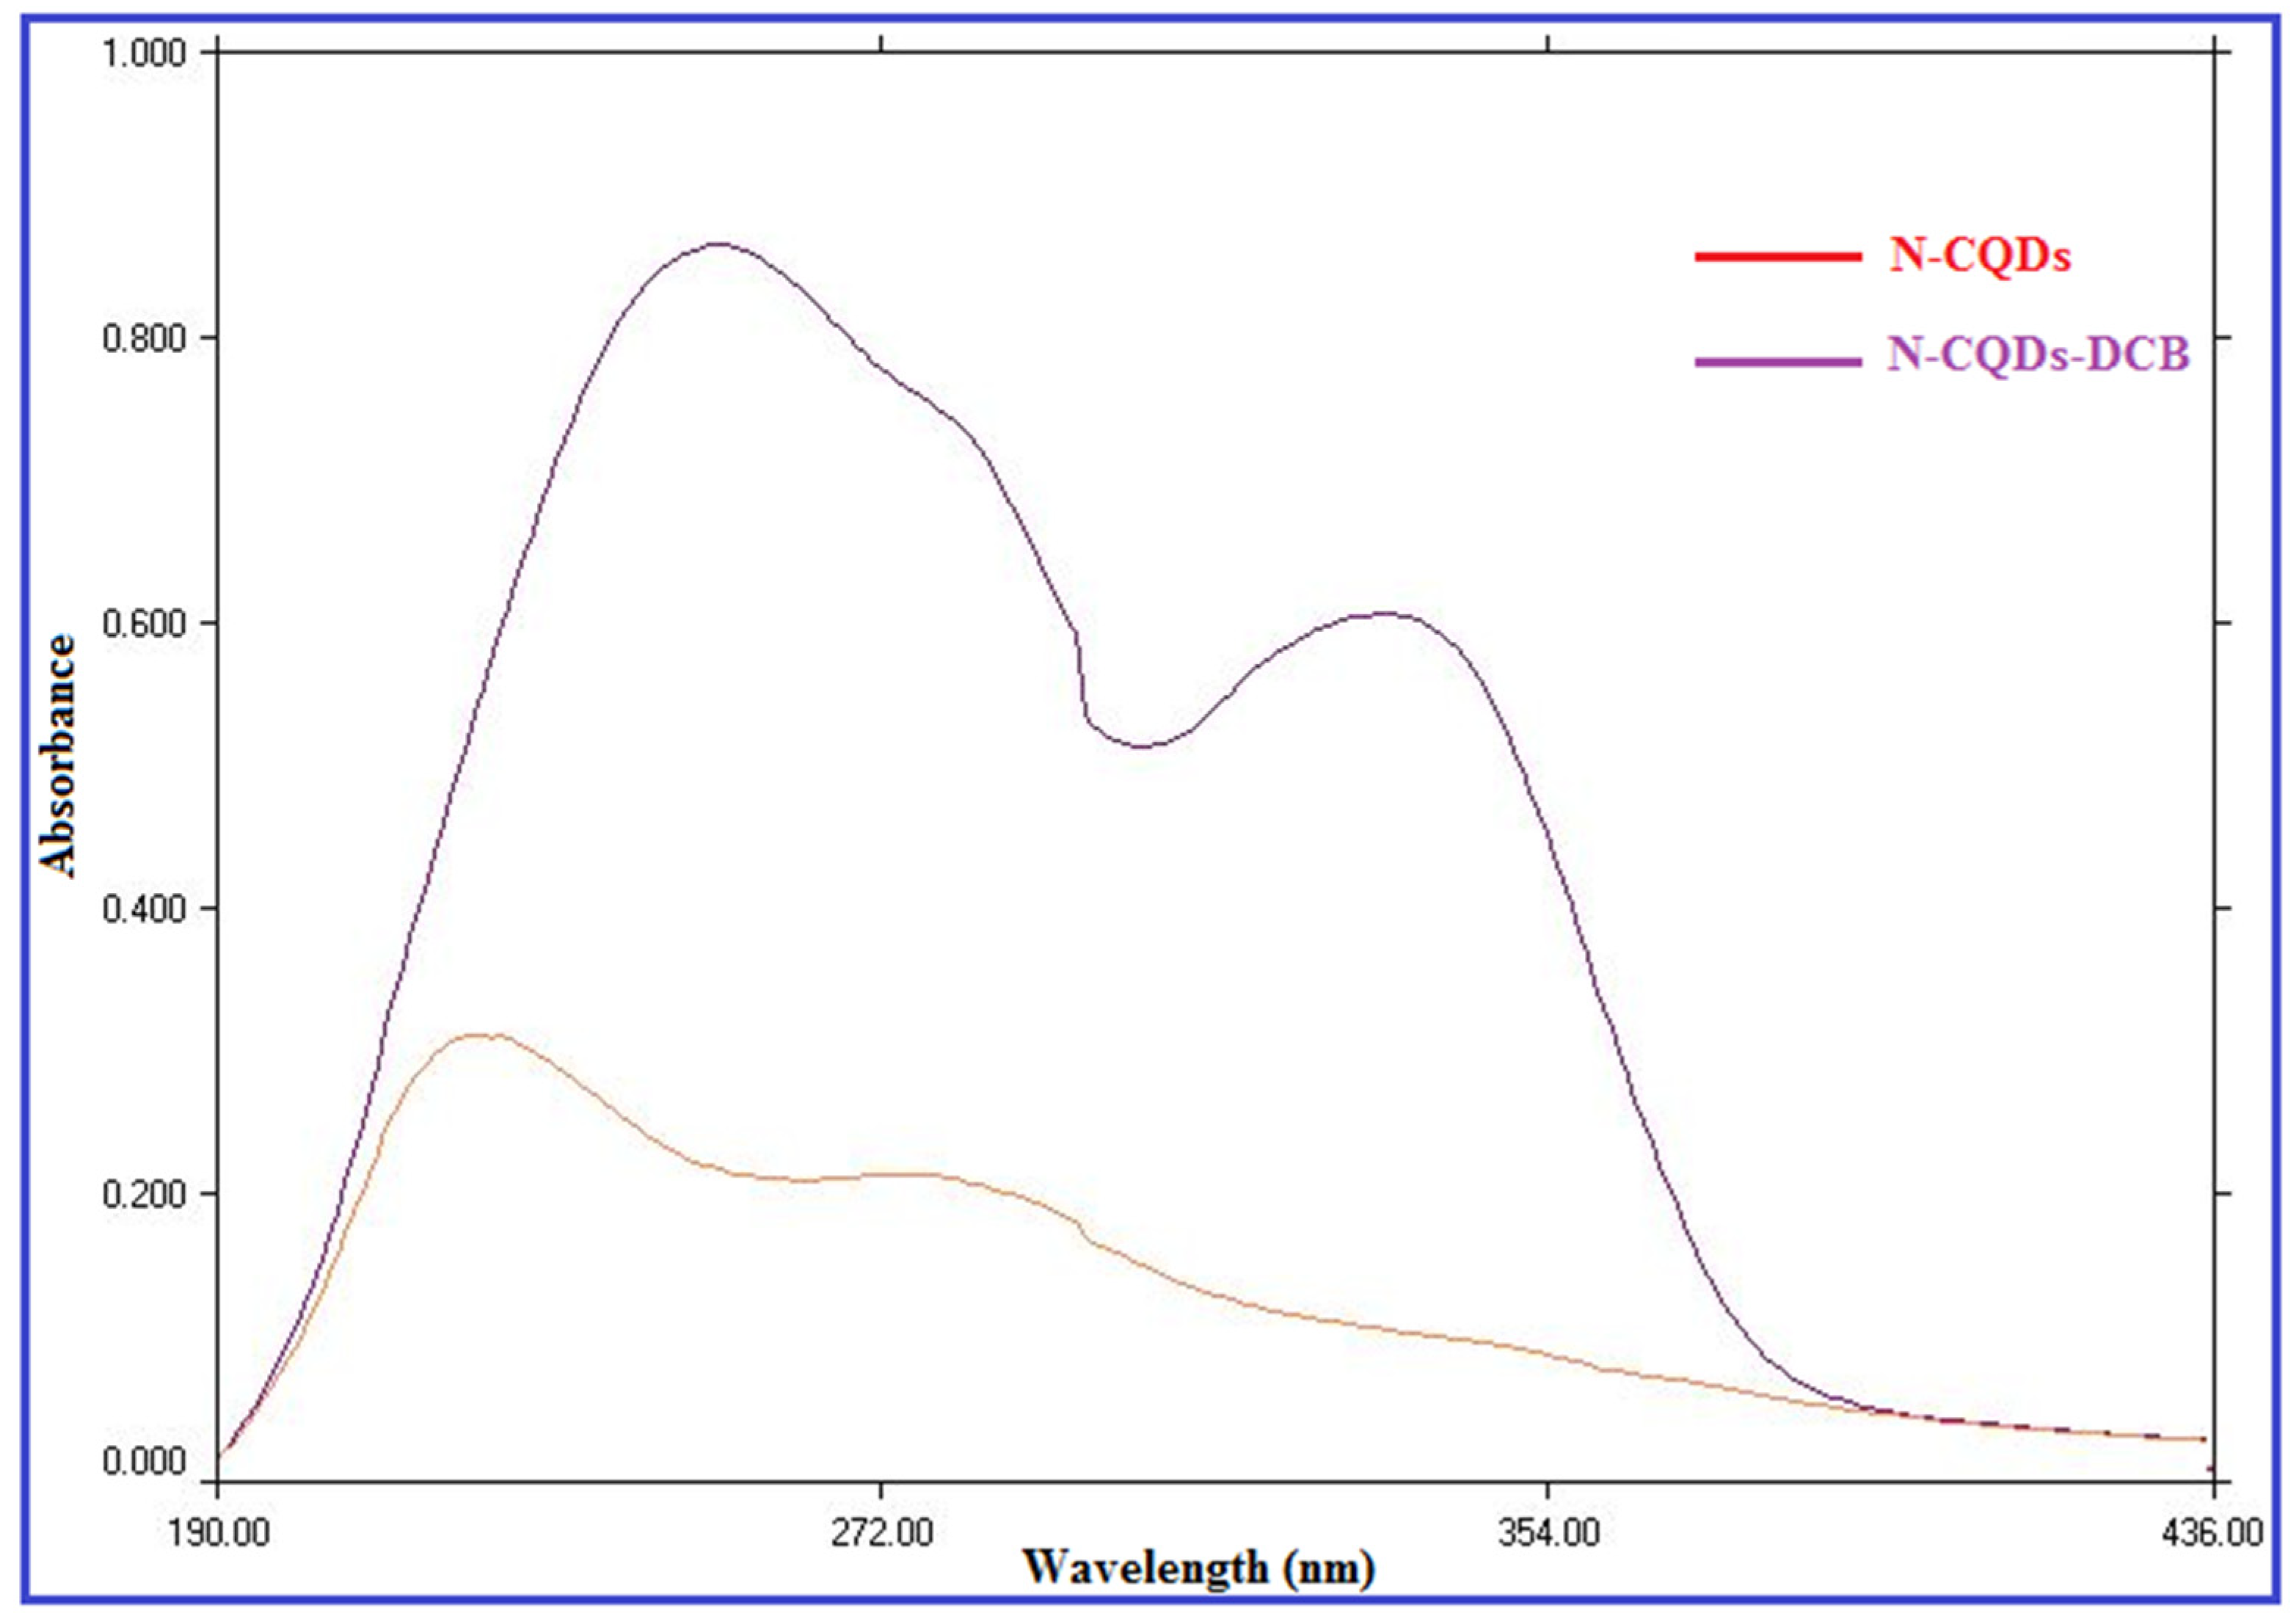
2.1. Characterization of N-CQDs
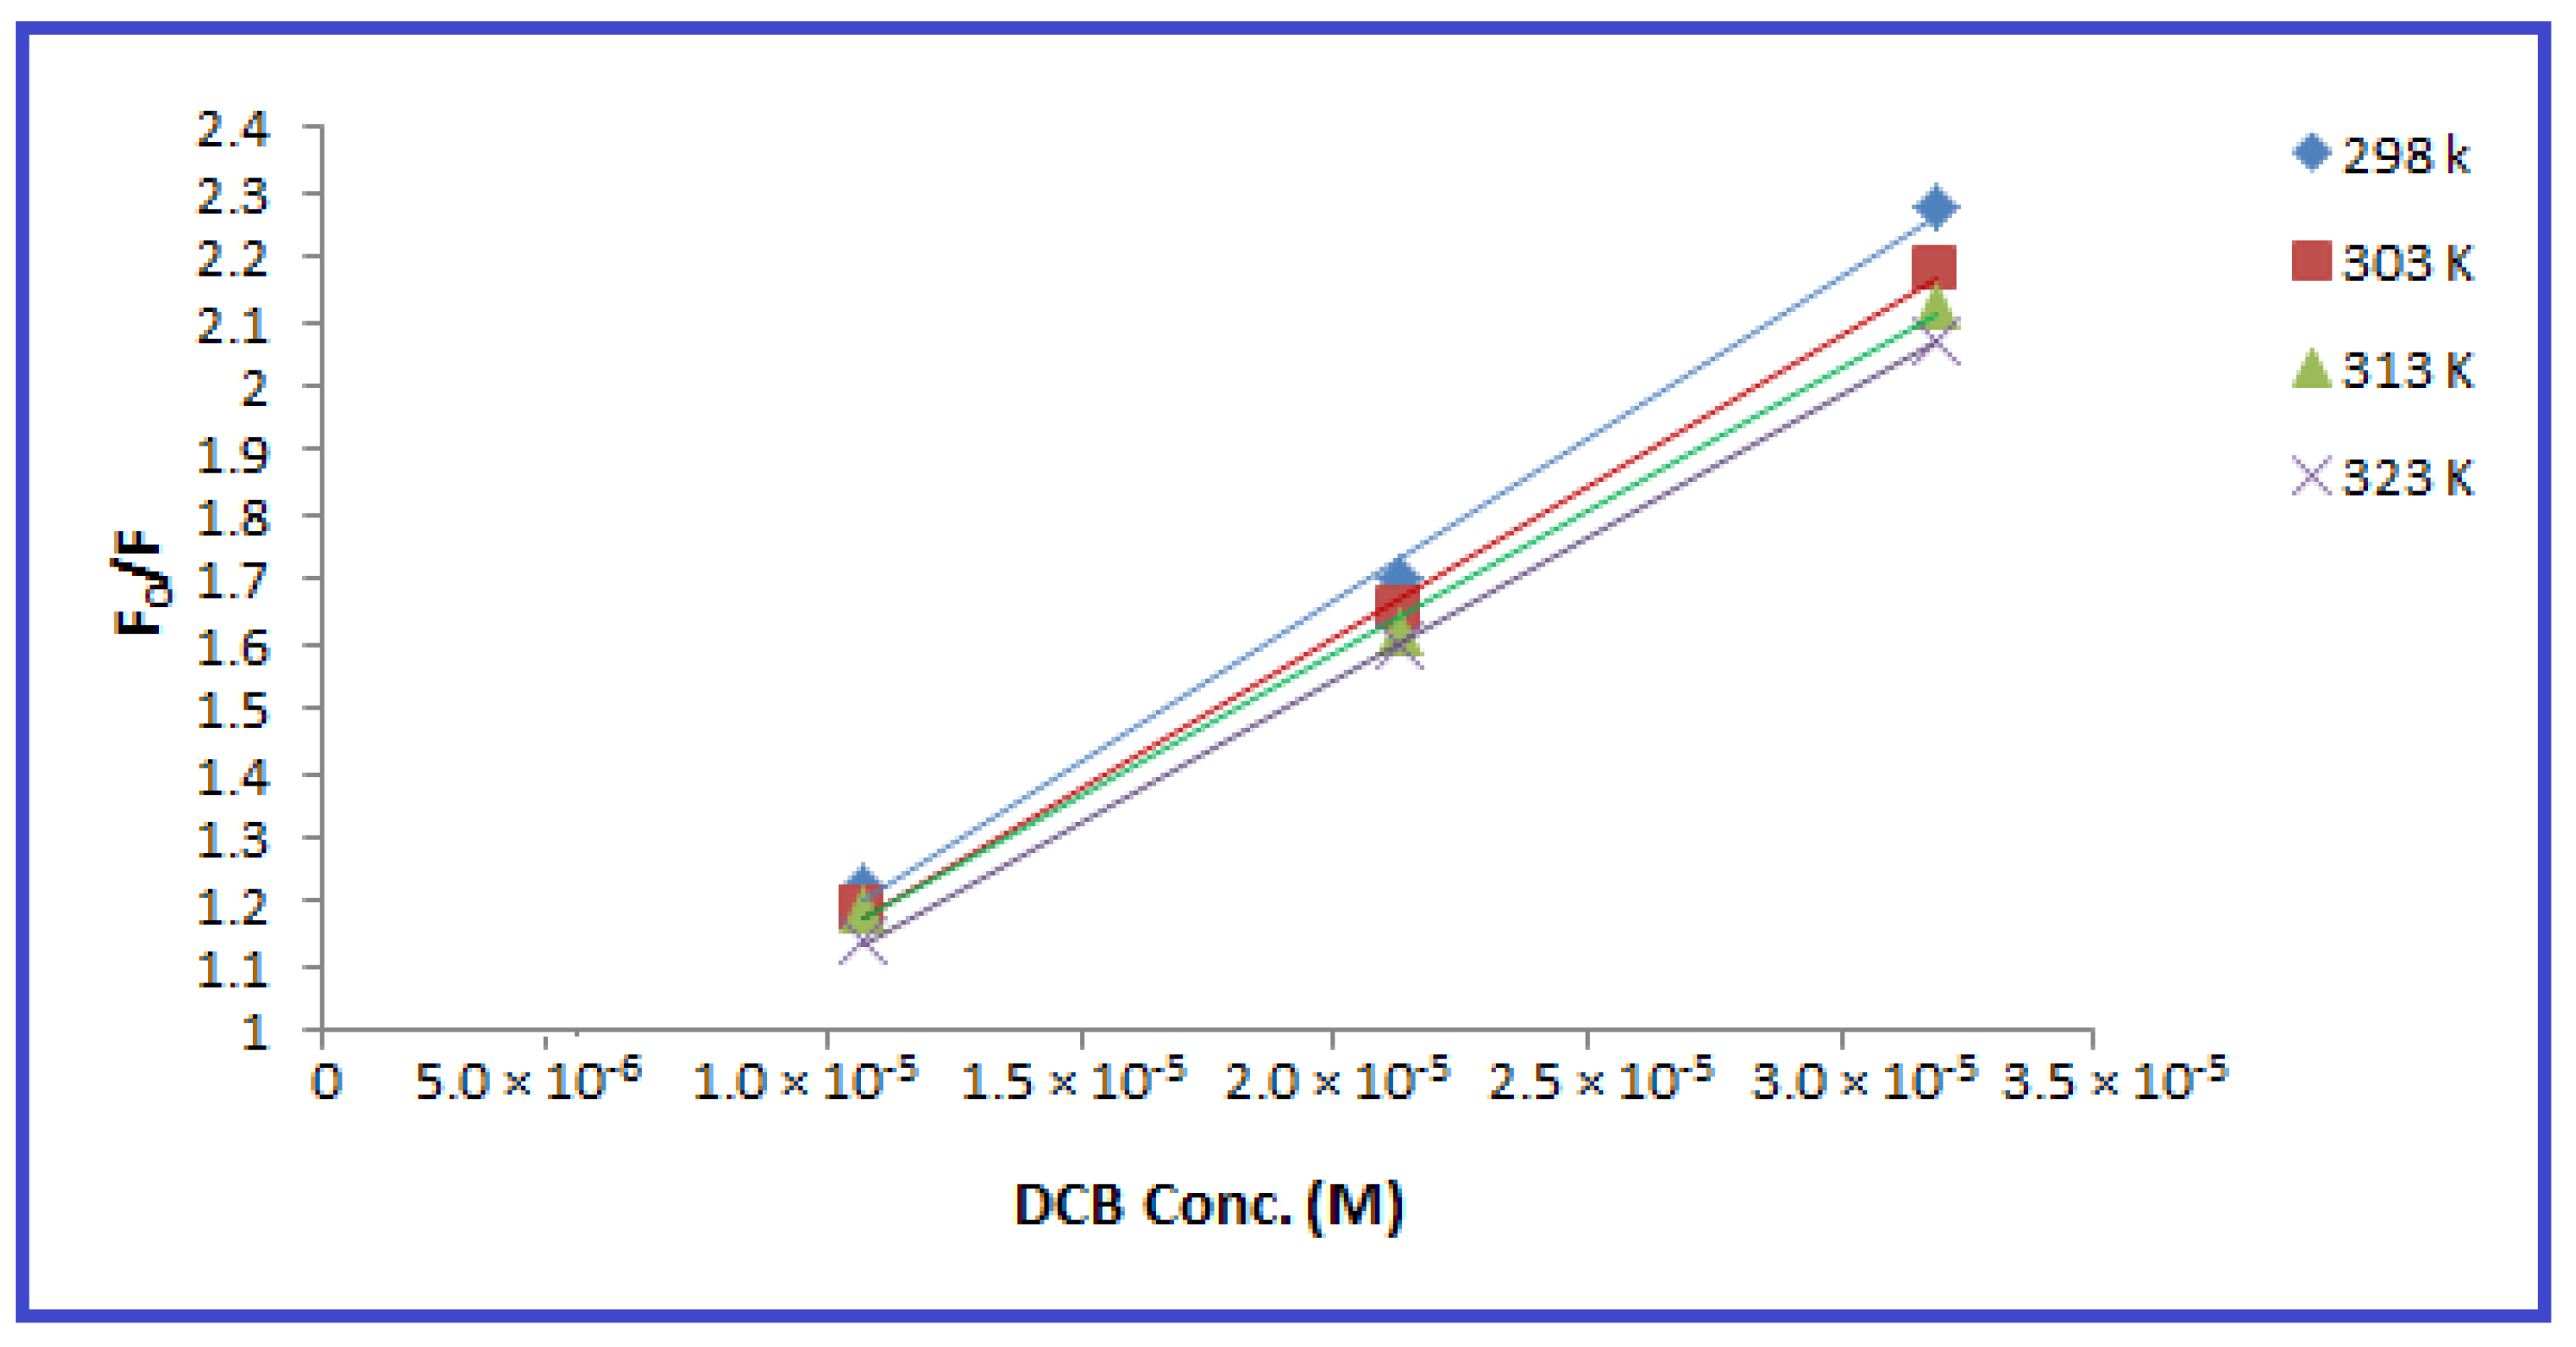
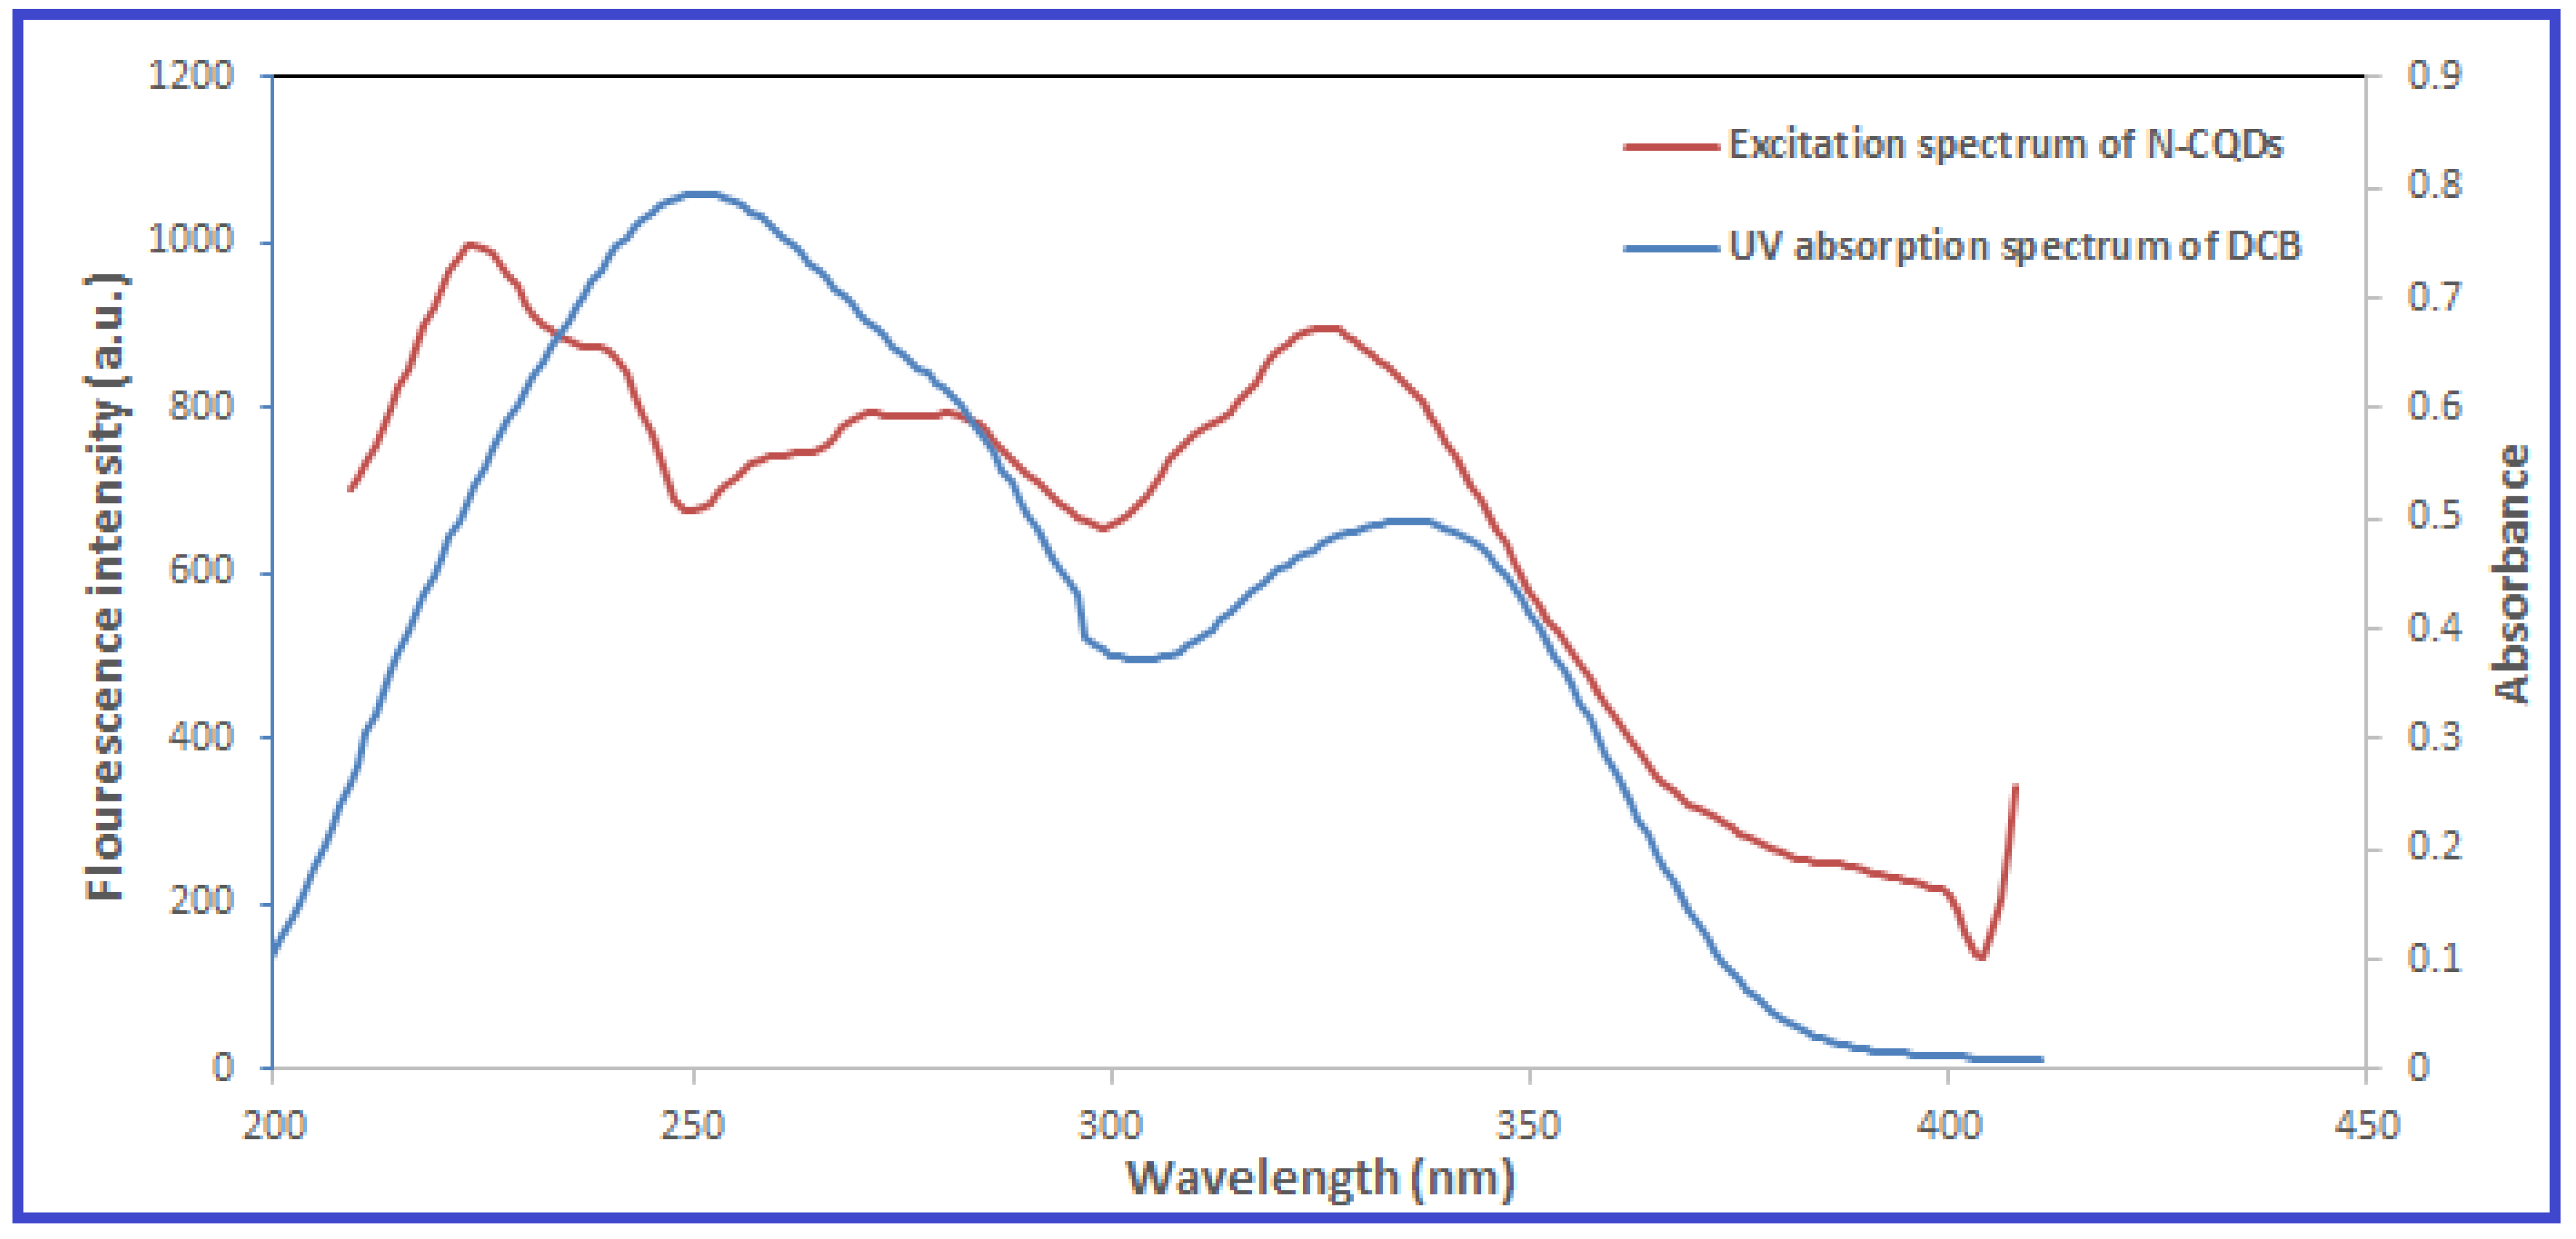
2.2. Investigation of the Quenching Mechanism
- denotes the fluorescence intensity of the DCB and N-CQD mixture.
- denotes the intrinsic fluorescence intensity of the N-CQDs.
- represents the Stern–Volmer quenching constant.
- is the DCB concentration.
- denotes the quenching rate constant.
- represents the average lifetime of the fluorophore ().
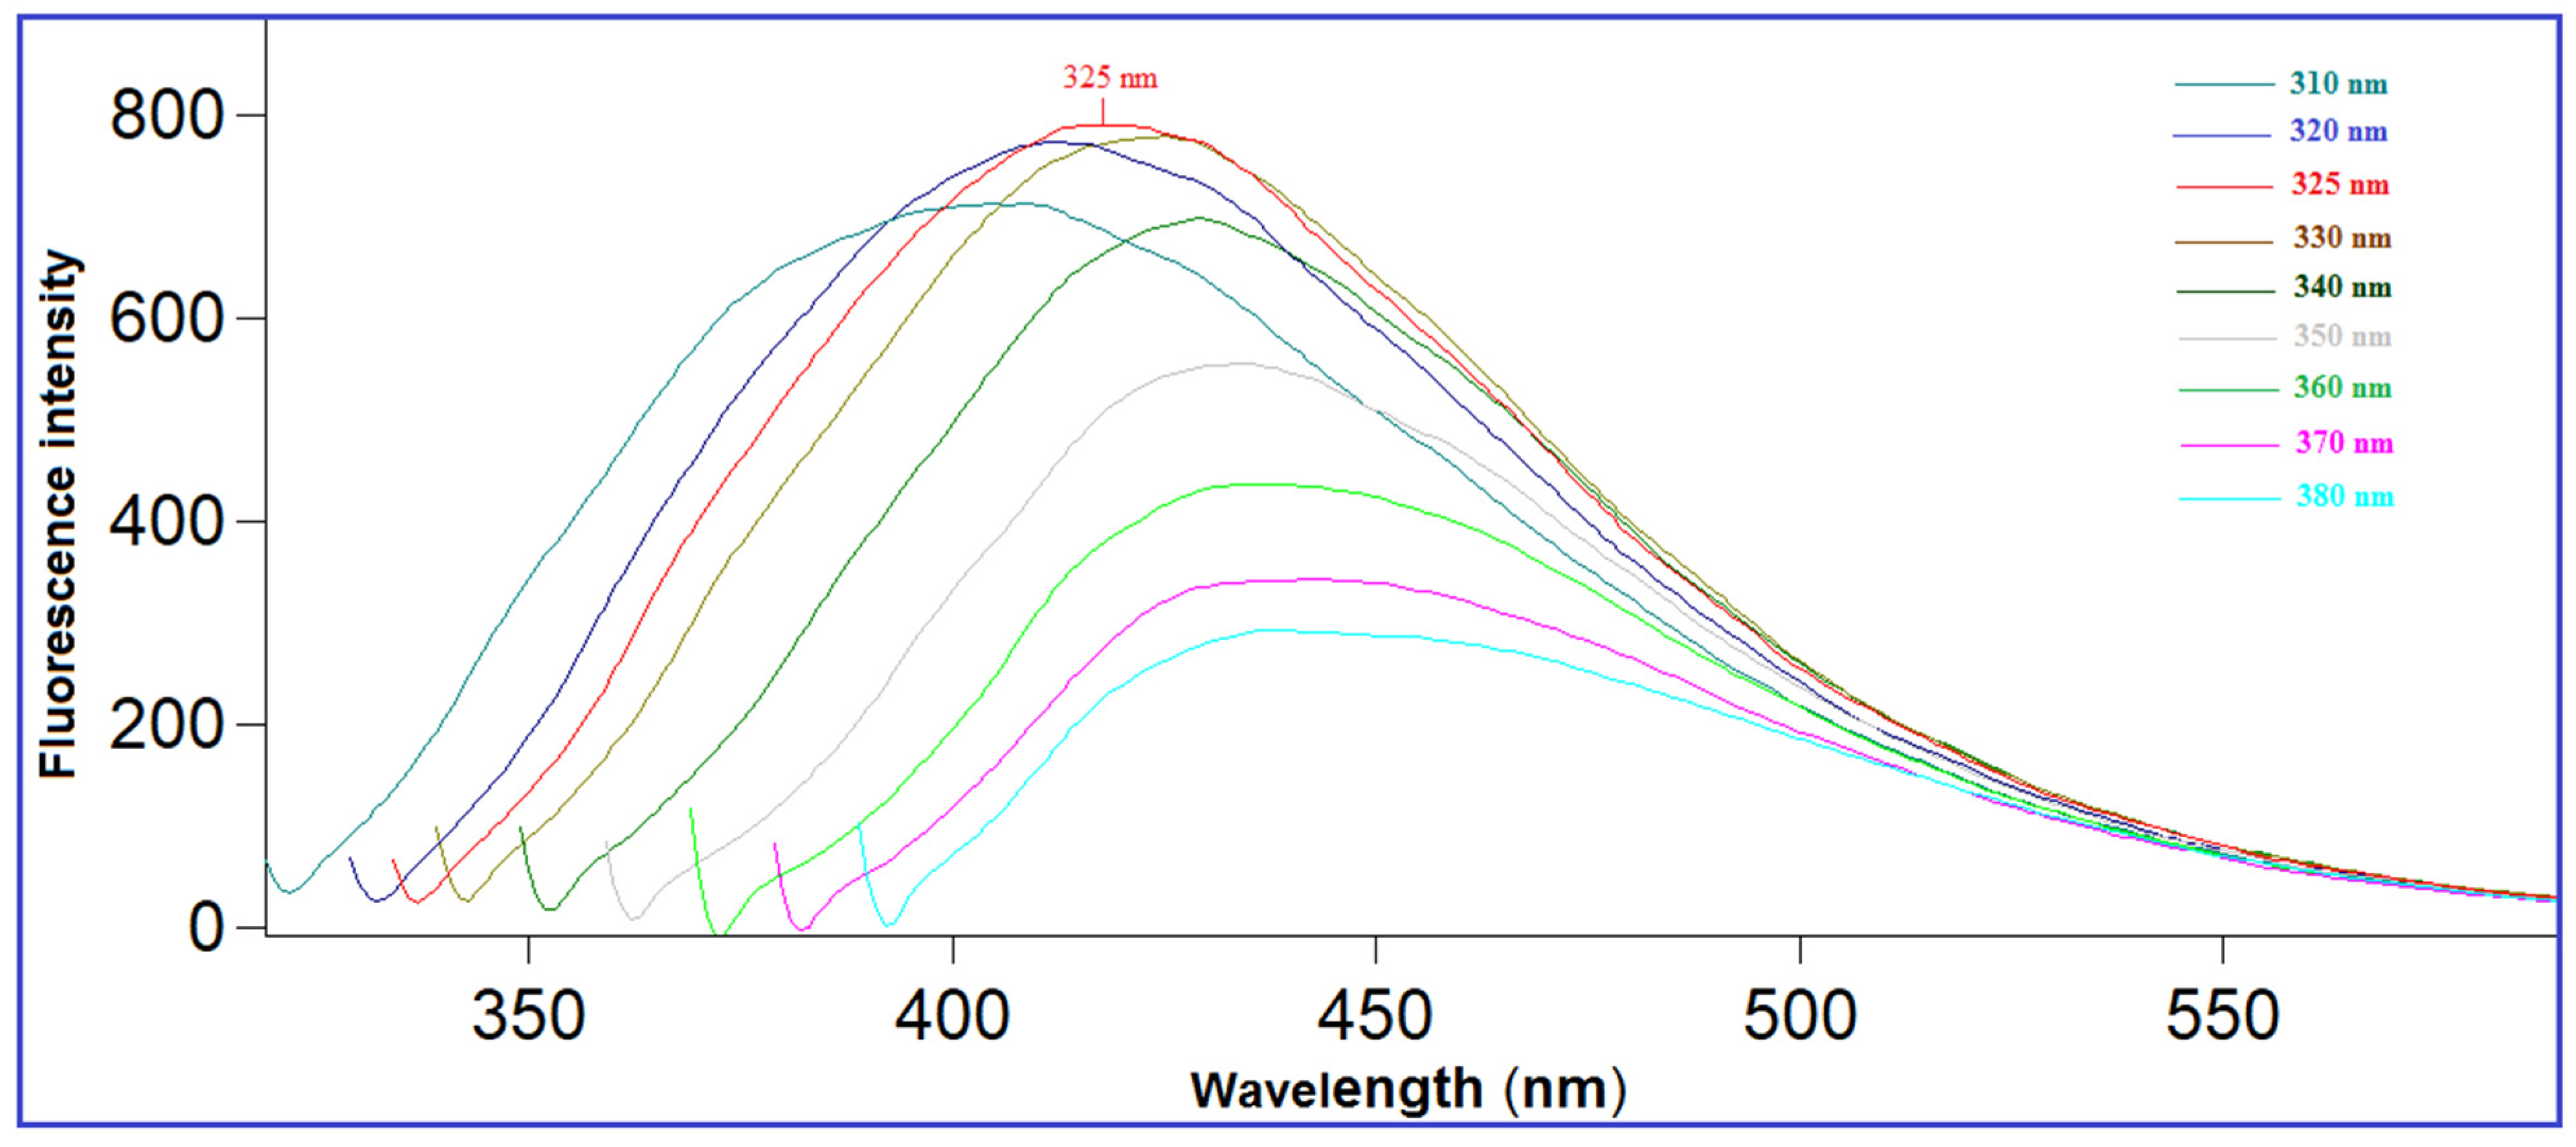
2.3. Optimization of the Experimental Parameters
2.4. Validation Studies
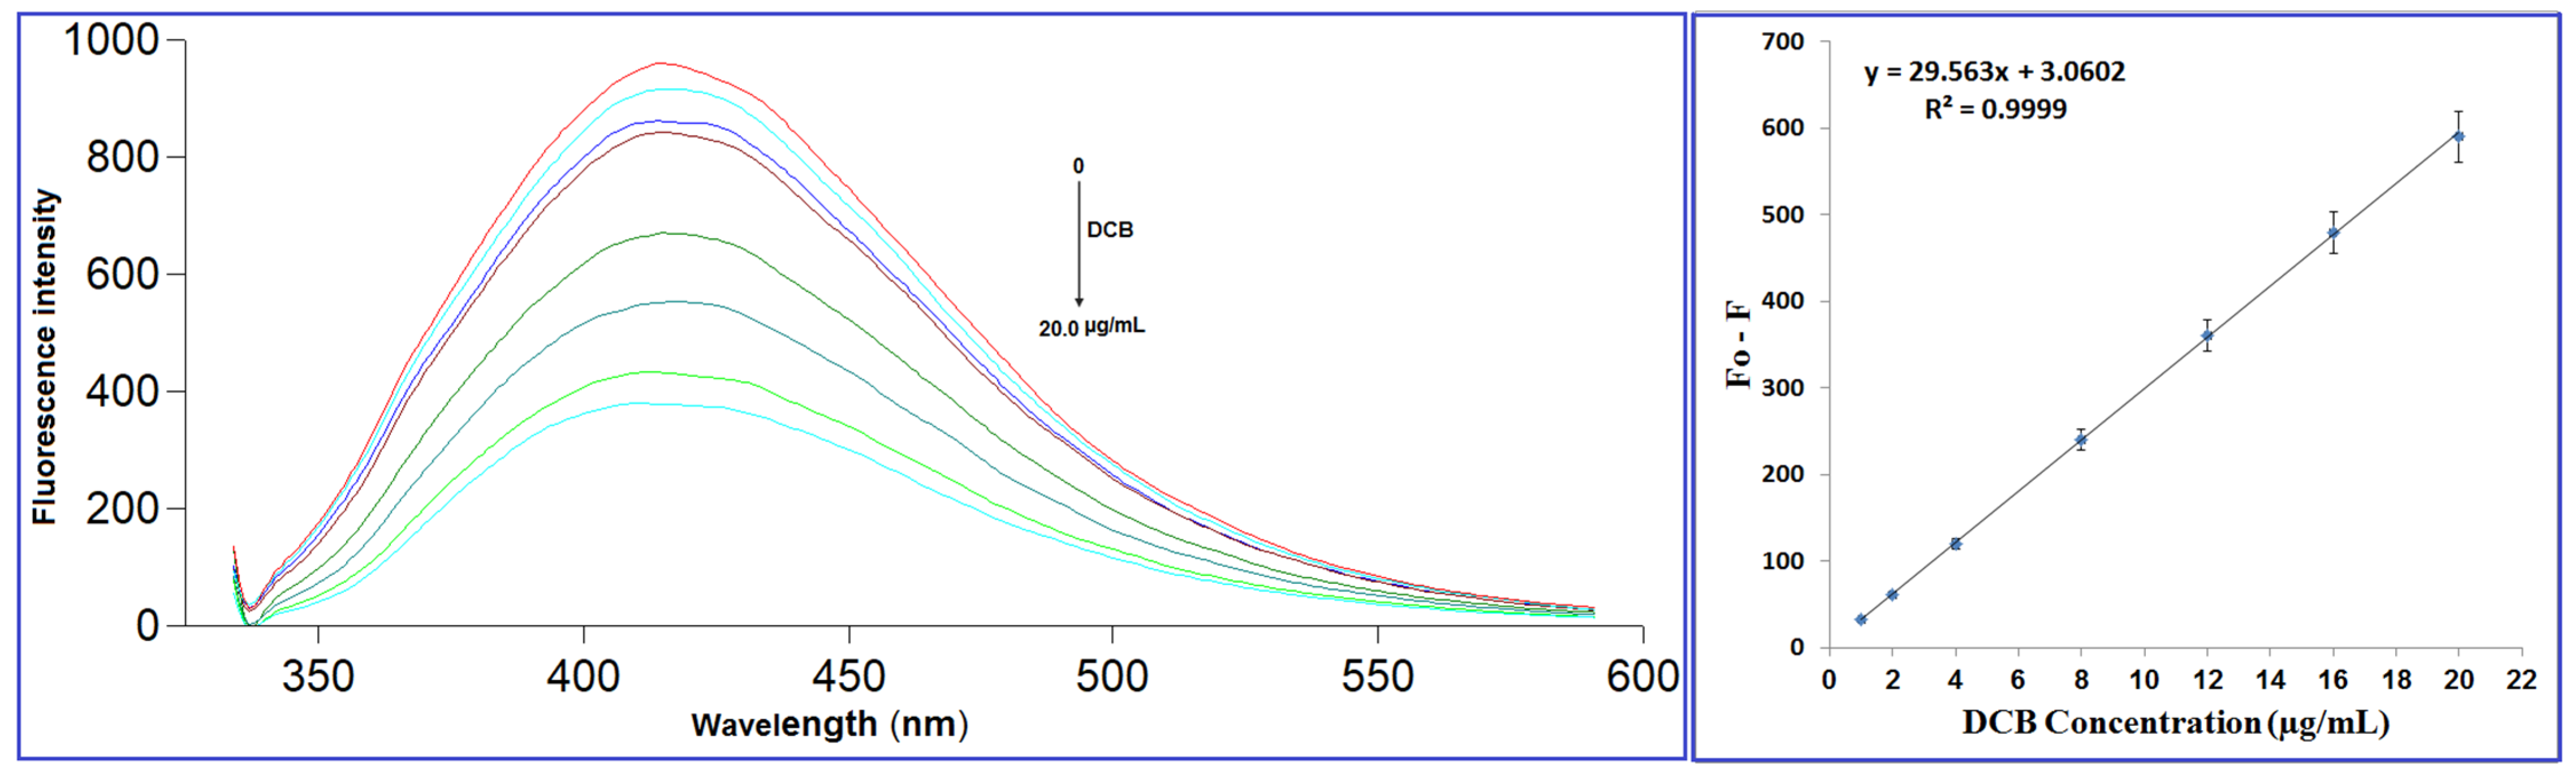
2.4.1. Linearity and Range
2.4.2. Limit of Detection (LOD) and Limit of Quantitation (LOQ)
2.4.3. Accuracy and Precision
2.4.4. Robustness
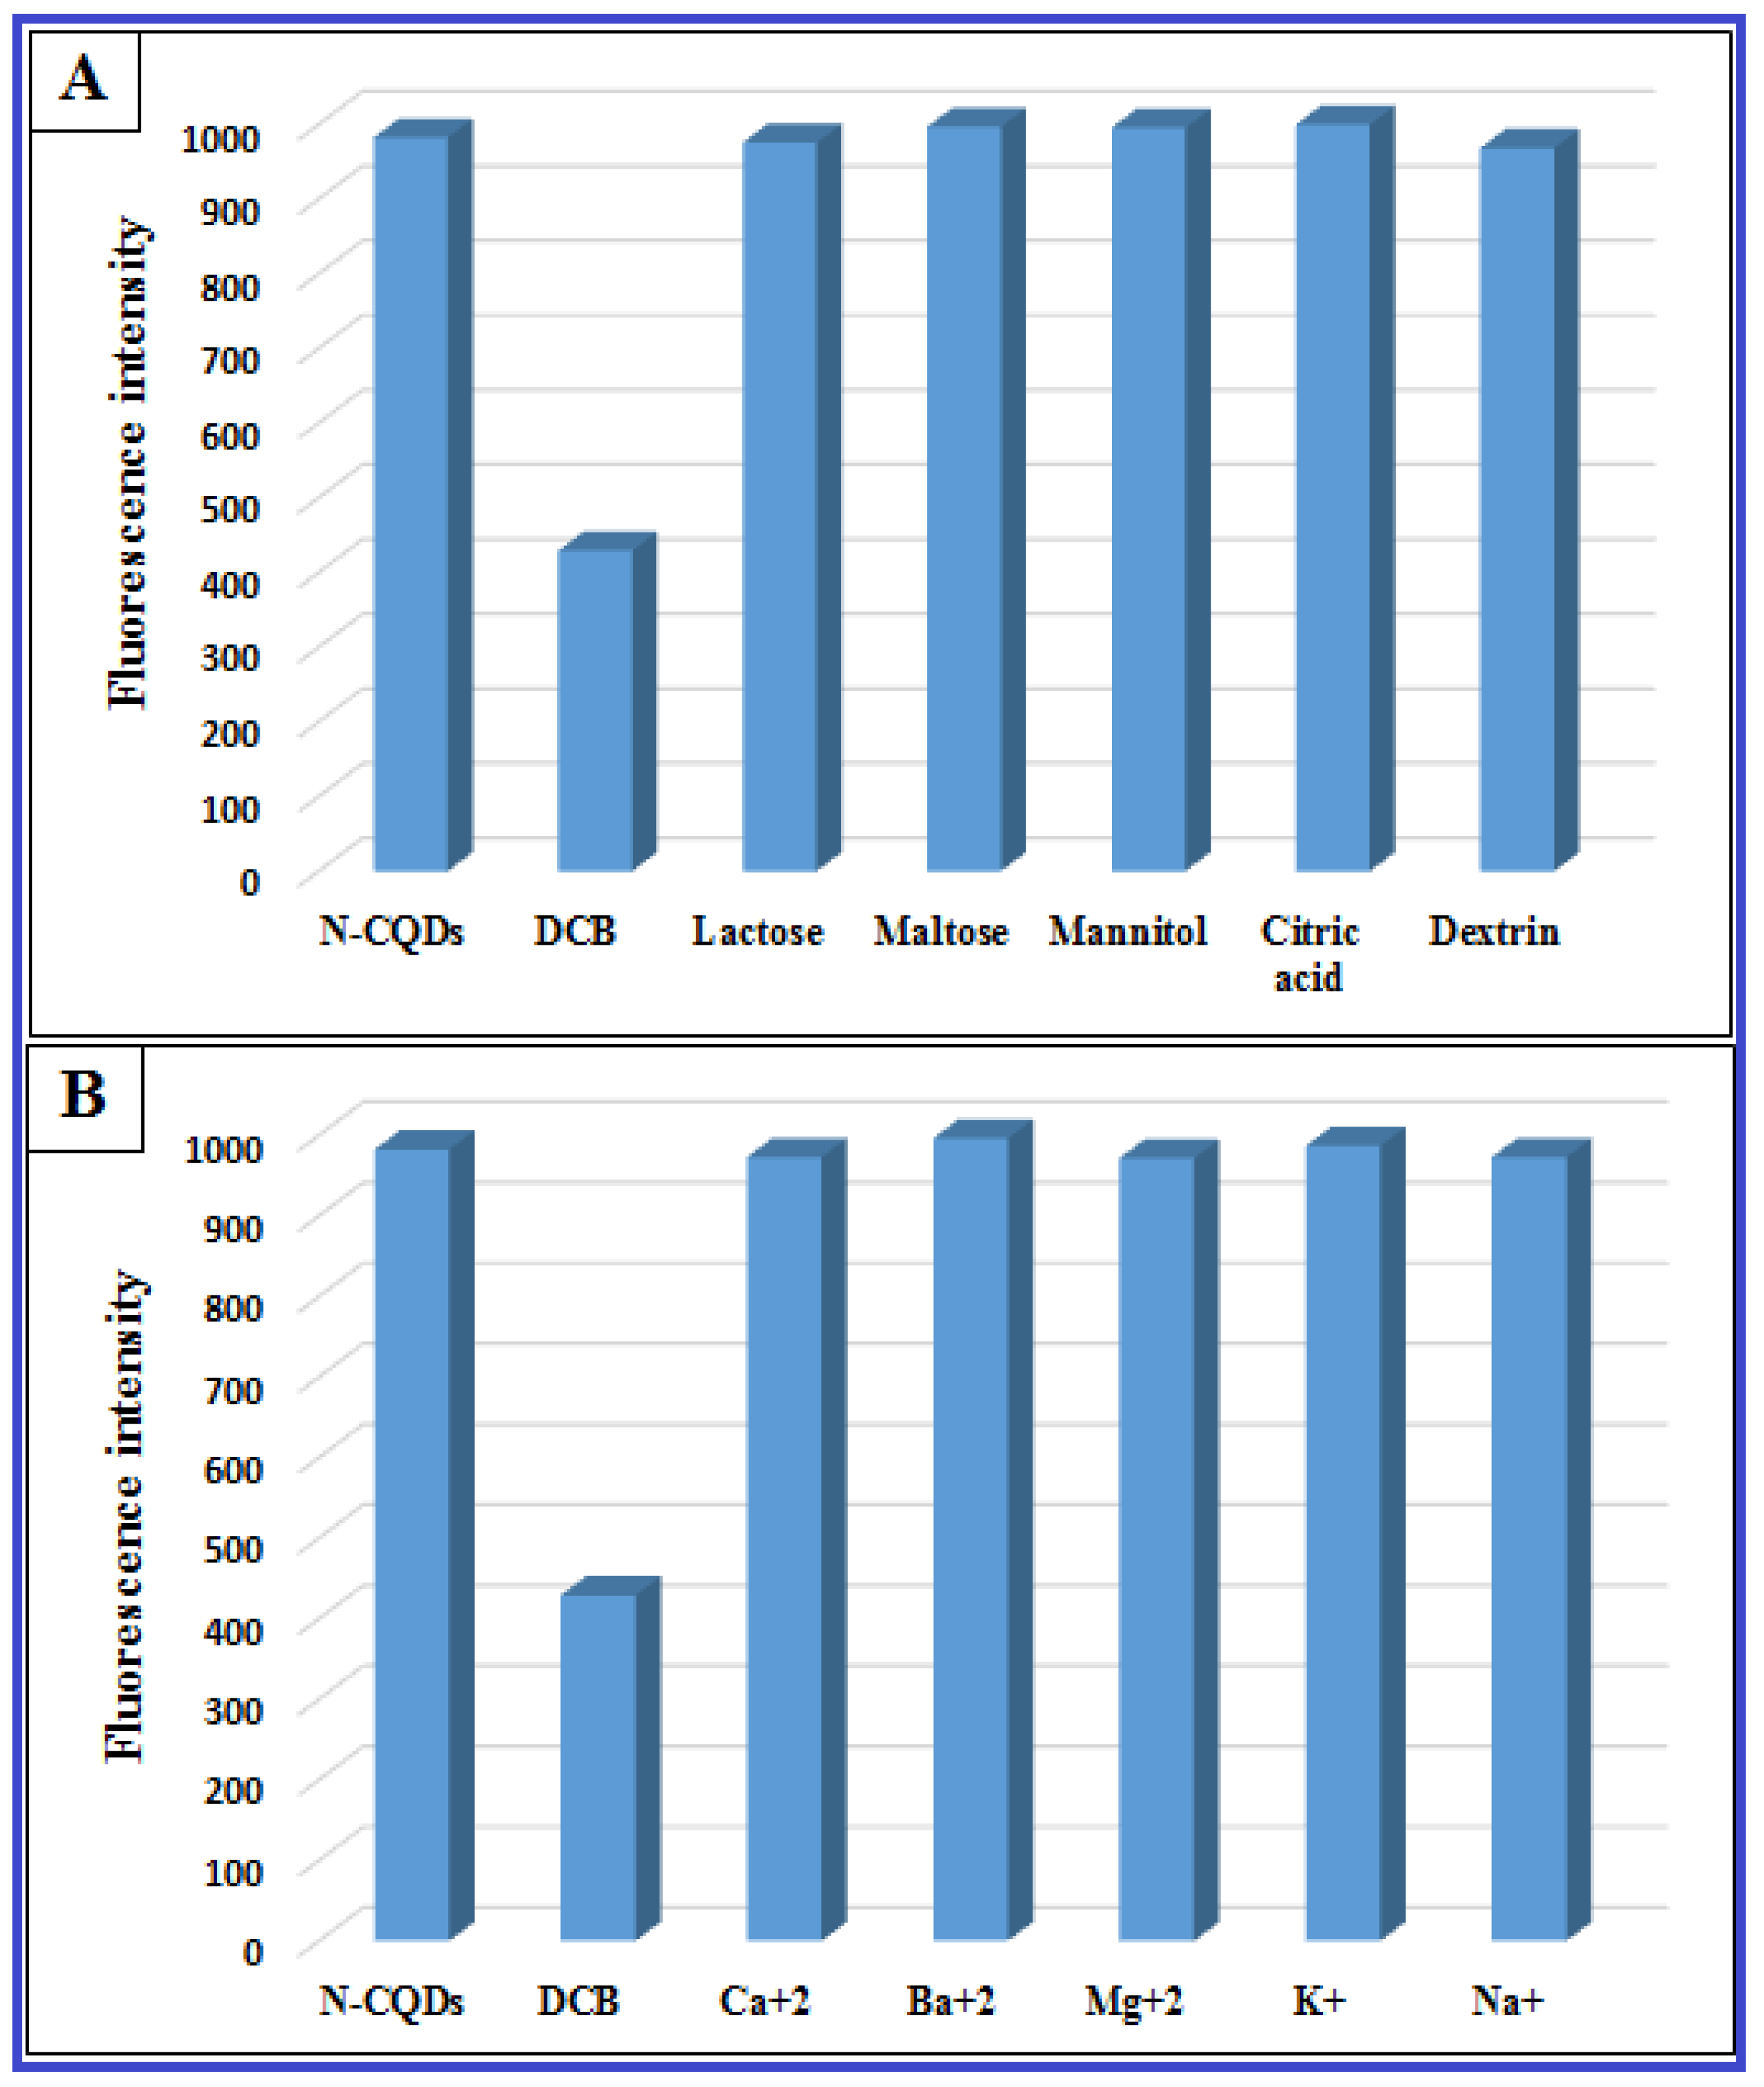
2.4.5. Selectivity
2.5. Application in Pharmaceutical Preparations
3. Experimental Procedure
3.1. Instrumentation and Tools
- Fluorescence measurements were obtained using the Cary Eclipse Fluorescence Spectrophotometer from Agilent Technologies (Santa Clara, CA, USA), which operated with a Xenon flash lamp at .
- The Jenway pH meter 3510 (Jenway, London, UK) was used to perform all the pH measurements.
- The Nicolet iS10 Fourier transform infrared (FTIR) spectrometer from ThermoFisher Scientific (Waltham, MA, USA) was used to obtain the required FTIR spectra. Measurements were taken for scans with a resolution of 4 cm−1. The device has a to DTGS detector, along with a Ge/KBr beam splitter.
- The light absorbance of the analytes was measured by a double-beam spectrophotometer (PG Instrument, Wibtoft, UK).
- Transmission electron microscopy (TEM) and energy dispersive X-ray spectroscopy (EDX) were performed using the JEM-2100 high-resolution transmission electron microscope (HRTEM) by JEOL (Tokyo, Japan), which operated at .
- Sigma 2-16P (Germany) benchtop cooling centrifuge.
- VM-300P vortex mixer from Gemmy Industrial Corp (Taiwan).
- Membrane filters with a pore size of purchased from Phenomenex (Torrance, CA, USA).
- S-101H ultrasonic bath from Sonicor Inc. (West Babylon, NY, USA).
- Domestic Microwave (GE614ST, 2800 W, 2450 MHz, Samsung, Kuala Lumpur, Malaysia).
3.2. Materials and Stock Solutions
- Dacomitinib (%purity 99.89) was obtained from the European division of Pfizer (Europe MA EEIG, Brussels, Belgium).
- Vizimpro® film-coated tablets (labeled to contain DCB at a concentration of 30 mg/tablet) were also obtained from Pfizer (Europe MA EEIG, Brussels, Belgium).
- Urea was purchased from Sigma-Aldrich (St. Louis, MO, USA).
- Methanol was acquired from Tedia (Fairfield, OH, USA).
- Navel orange (species Citrus sinensis) was obtained from a local Egyptian market.
- A stock solution of DCB was prepared in methanol. Subsequent dilutions were formed using double distilled water and the solution was found to be stable for at least days at .
- A Britton–Robinson buffer (BRB) with a concentration of was prepared in distilled water with different pH levels in the range of .
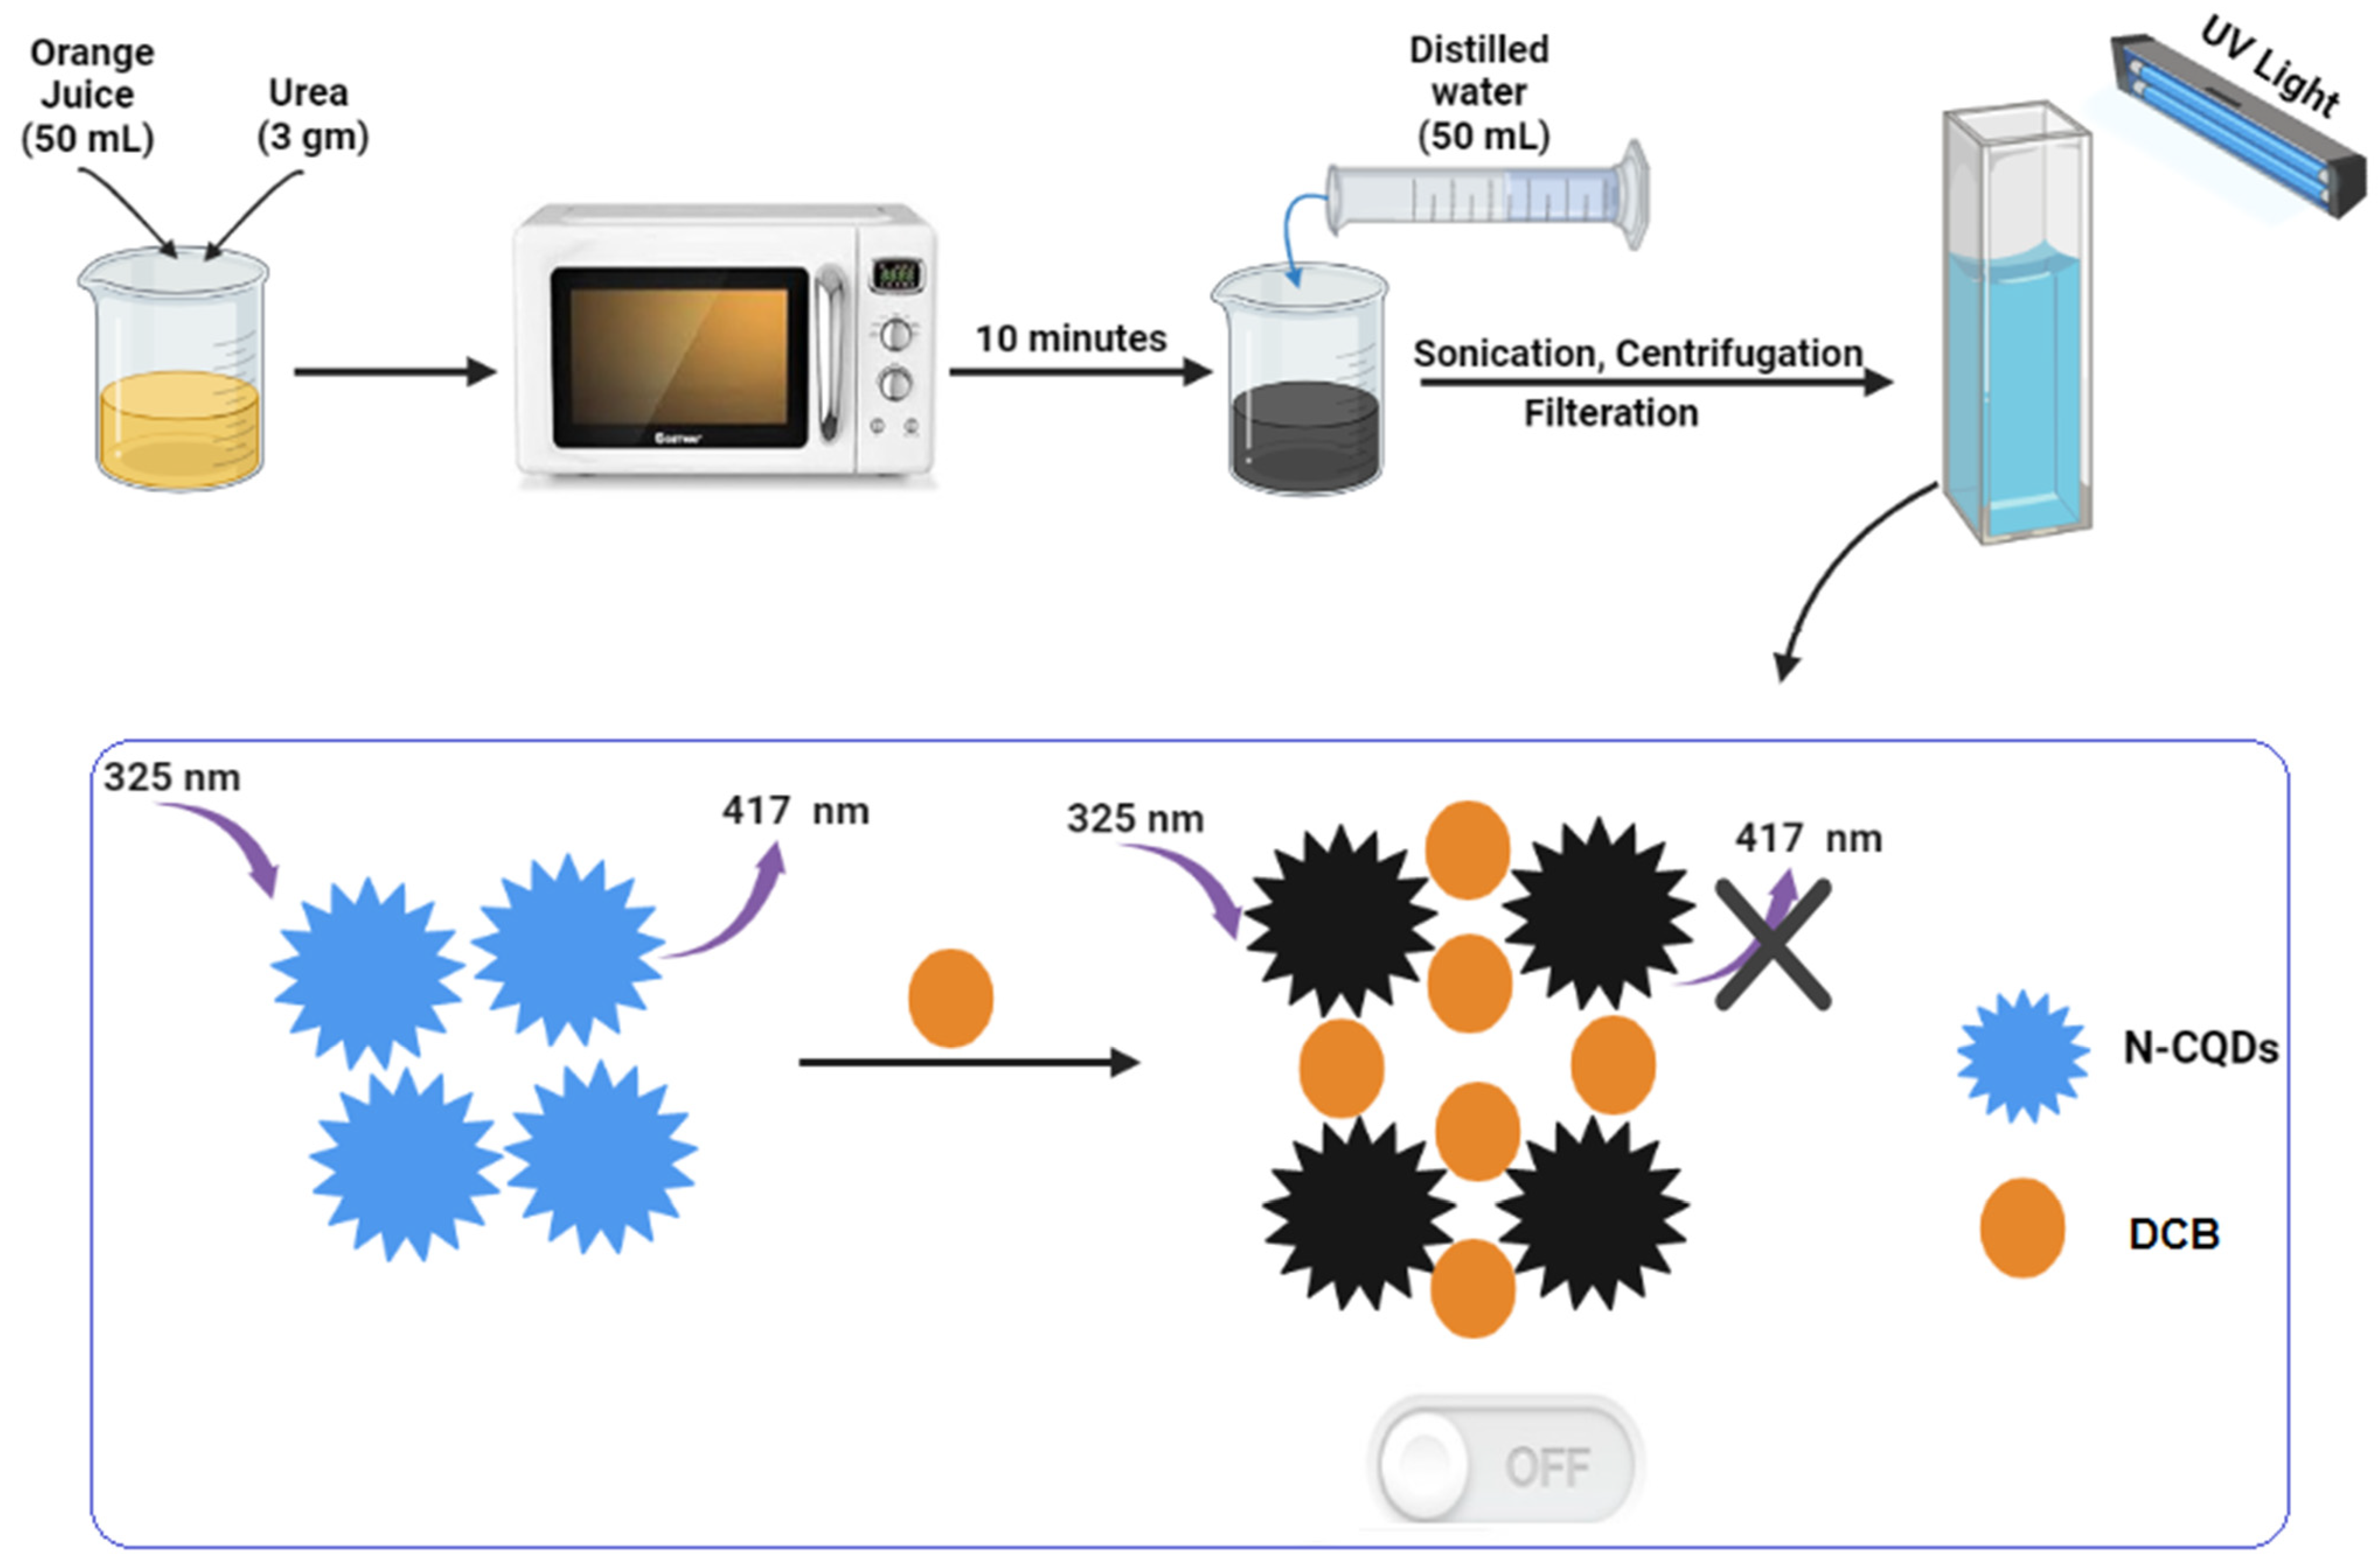
3.3. Procedure for the Synthesis of the Doped N-CQDs
3.4. Spectrofluorimetric Measurements
3.5. Quantum Yield Measurements
3.6. Application of the Proposed Method to Vizimpro® Tablets
4. Conclusions
Supplementary Materials
Author Contributions
Funding
Institutional Review Board Statement
Informed Consent Statement
Data Availability Statement
Acknowledgments
Conflicts of Interest
Sample Availability
References
- Abdelhameed, A.S.; Kadi, A.A.; Attwa, M.W.; AlRabiah, H. Validated LC-MS/MS assay for quantification of the newly approved tyrosine kinase inhibitor, dacomitinib, and application to investigating its metabolic stability. PLoS ONE 2019, 14, e0214598. [Google Scholar] [CrossRef] [Green Version]
- European Medicines Agency. Assessment Report Vizimpro; European Medicines Agency: Amsterdam, The Netherlands, 2019. [Google Scholar]
- Shirley, M. Dacomitinib: First Global Approval. Drugs 2018, 78, 1947–1953. [Google Scholar] [CrossRef] [PubMed]
- Feng, X.; Ding, Y.; Zhang, P.; Fu, Q.; Zhang, L.; Zheng, H. Simultaneous determination of dacomitinib and its major metabolite, O-desmethyl dacomitinib in human plasma by LC-MS/MS and its application to clinical testing in patients with non-small cell lung cancer. J. Chromatogr. B 2021, 1182, 122940. [Google Scholar] [CrossRef] [PubMed]
- Magdy, G.; Hakiem, A.F.A.; Belal, F.; Abdel-Megied, A.M. Green one-pot synthesis of nitrogen and sulfur co-doped carbon quantum dots as new fluorescent nanosensors for determination of salinomycin and maduramicin in food samples. Food Chem. 2021, 343, 128539. [Google Scholar] [CrossRef] [PubMed]
- Magdy, G.; Al-enna, A.A.; Belal, F.; El-Domany, R.A.; Abdel-Megied, A.M. Application of sulfur and nitrogen doped carbon quantum dots as sensitive fluorescent nanosensors for the determination of sax-agliptin and gliclazide. R. Soc. Open Sci. 2022, 9, 220285. [Google Scholar] [CrossRef]
- Magdy, G.; Said, N.; El-Domany, R.A.; Belal, F. Nitrogen and sulfur-doped carbon quantum dots as fluorescent nanoprobes for spectrofluorimetric determination of olanzapine and diazepam in biological fluids and dosage forms: Application to content uniformity testing. BMC Chem. 2022, 16, 98. [Google Scholar] [CrossRef]
- Gour, A.; Ramteke, S.; Jain, N.K. Pharmaceutical Applications of Quantum Dots. AAPS PharmSciTech 2021, 22, 233. [Google Scholar] [CrossRef] [PubMed]
- Elmansi, H.; Magdy, G.; Belal, F.; El-Deen, A.K. Doped Carbon Dots as Promising Fluorescent Nanosensors: Synthesis, Characterization, and Recent Applications. Curr. Pharm. Des. 2022. [CrossRef] [PubMed]
- Molaei, M.J. Principles, mechanisms, and application of carbon quantum dots in sensors: A review. Anal. Methods 2020, 12, 1266–1287. [Google Scholar] [CrossRef]
- Zhang, L.; Zhang, Z.-Y.; Liang, R.-P.; Li, Y.-H.; Qiu, J.-D. Boron-Doped Graphene Quantum Dots for Selective Glucose Sensing Based on the “Abnormal” Aggregation-Induced Photoluminescence Enhancement. Anal. Chem. 2014, 86, 4423–4430. [Google Scholar] [CrossRef]
- Kaur, M.; Kaur, M.; Sharma, V.K. Nitrogen-doped graphene and graphene quantum dots: A review onsynthesis and applications in energy, sensors and environment. Adv. Colloid Interface Sci. 2018, 259, 44–64. [Google Scholar] [CrossRef] [PubMed]
- Lim, S.Y.; Shen, W.; Gao, Z. Carbon quantum dots and their applications. Chem. Soc. Rev. 2015, 44, 362–381. [Google Scholar] [CrossRef]
- Kalaiyarasan, G.; Joseph, J. Determination of vitamin B12 via pH-dependent quenching of the fluorescence of nitrogen doped carbon quantum dots. Microchim. Acta 2017, 184, 3883–3891. [Google Scholar] [CrossRef]
- Zhang, Q.; Zhang, C.; Li, Z.; Ge, J.; Li, C.; Dong, C.; Shuang, S. Nitrogen-doped carbon dots as fluorescent probe for detection of curcumin based on the inner filter effect. RSC Adv. 2015, 5, 95054–95060. [Google Scholar] [CrossRef]
- Sun, D.; Ban, R.; Zhang, P.-H.; Wu, G.-H.; Zhang, J.-R.; Zhu, J.-J. Hair fiber as a precursor for synthesizing of sulfur- and nitrogen-co-doped carbon dots with tunable luminescence properties. Carbon 2013, 64, 424–434. [Google Scholar] [CrossRef]
- Amjadi, M.; Manzoori, J.L.; Hallaj, T.; Azizi, N. Sulfur and nitrogen co-doped carbon quantum dots as the chemiluminescence probe for detection of Cu2+ ions. J. Lumin. 2017, 182, 246–251. [Google Scholar] [CrossRef]
- Kundu, A.; Maity, B.; Basu, S. Rice Husk-Derived Carbon Quantum Dots-Based Dual-Mode Nanoprobe for Selective and Sensitive Detection of Fe3+ and Fluoroquinolones. ACS Biomater. Sci. Eng. 2022, 8, 4764–4776. [Google Scholar] [CrossRef] [PubMed]
- Kim, K.; Chokradjaroen, C.; Saito, N. Solution plasma: New synthesis method of N-doped carbon dots as ultra-sensitive fluorescence detector for 2,4,6-trinitrophenol. Nano Express 2020, 1, 020043. [Google Scholar] [CrossRef]
- Feng, X.; Ashley, J.; Zhou, T.; Sun, Y. Fluorometric determination of doxycycline based on the use of carbon quantum dots incorporated into a molecularly imprinted polymer. Microchim. Acta 2018, 185, 500. [Google Scholar] [CrossRef] [Green Version]
- Żamojć, K.; Bylińska, I.; Wiczk, W.; Chmurzyński, L. Fluorescence quenching studies on the interactions between chosen fluoroquinolones and selected stable TEMPO and PROXYL nitroxides. Int. J. Mol. Sci. 2021, 22, 885. [Google Scholar] [CrossRef]
- Magdy, G.; Aboelkassim, E.; El-Domany, R.A.; Belal, F. Green synthesis, characterization, and antimicrobial applications of silver nanoparticles as fluorescent nanoprobes for the spectrofluorimetric determination of ornidazole and miconazole. Sci. Rep. 2022, 12, 21395. [Google Scholar] [CrossRef] [PubMed]
- Magdy, G.; Belal, F.; Elmansi, H. Rapid microwave-assisted synthesis of nitrogen-doped carbon quantum dots as fluorescent nanosensors for the spectrofluorimetric determination of palbociclib: Application for cellular imaging and selective probing in living cancer cells. RSC Adv. 2023, 13, 4156–4167. [Google Scholar] [CrossRef] [PubMed]
- ICH, I. Validation of analytical procedures: Text and methodology: Q2 (R1). In Proceedings of the International Conference on Harmonization, Geneva, Switzerland, 2 June 2014. [Google Scholar]
- Rurack, K. Fluorescence quantum yields: Methods of determination and standards. In Standardization and Quality Assurance in Fluorescence Measurements I; Springer: Berlin/Heidelberg, Germany, 2008; pp. 101–145. [Google Scholar]


| Parameter | DCB |
|---|---|
| λex–λem | 325–417 nm |
| Concentration range (μg/mL) | 1.0–20.0 |
| Slope | 29.56 |
| Intercept | 3.06 |
| Correlation coefficient (r) | 0.9999 |
| S.D. of residuals (Sy/x) | 2.12 |
| S.D. of intercept (Sa) | 0.99 |
| S.D. of slope (Sb) | 0.11 |
| Percentage relative standard deviation, % RSD | 0.98 |
| Percentage relative error, % Error | 0.37 |
| Limit of detection, LOD a (μg/mL) | 0.11 |
| Limit of quantitation, LOQ b (μg/mL) | 0.33 |
| Parameter | DCB | ||
|---|---|---|---|
| Amount Taken (μg/mL) | Amount Found (μg/mL) | % Found * | |
| 1.0 | 0.99 | 98.50 | |
| 2.0 | 1.98 | 99.00 | |
| 4.0 | 3.96 | 98.98 | |
| 8.0 | 8.01 | 100.19 | |
| 12.0 | 12.07 | 100.62 | |
| 16.0 | 16.13 | 100.83 | |
| 20.0 | 19.85 | 99.27 | |
| Mean | 99.69 | ||
| ± S.D. | 0.98 | ||
| % RSD | 0.984 | ||
| % Error | 0.371 | ||
| DCB | Intra-Day a | Inter-Day b | |||||
| Conc. (μg/mL) | ± S.D | % RSD | % Error | ± S.D | % RSD | % Error | |
| 2.0 | 99.02 ± 0.73 | 0.737 | 0.42 | 98.71 ± 1.17 | 1.185 | 0.68 | |
| 8.0 | 99.85 ± 0.96 | 0.961 | 0.55 | 100.23 ± 0.79 | 0.788 | 0.46 | |
| 16.0 | 100.13 ± 0.88 | 0.878 | 0.51 | 99.84 ± 0.96 | 0.961 | 0.55 | |
| Factor Variation | DCB | |
|---|---|---|
| 1. Volume of N-CQDs (125.0 μL ± 1) | % Recovery * | % RSD |
| 124.0 µL | 98.87 | 0.94 |
| 125.0 µL | 99.42 | 0.86 |
| 126.0 µL | 100.21 | 1.16 |
| Parameter | DCB | ||
|---|---|---|---|
| Vizimpro® Tablets (30 mg DCB/Tablet) | Amount Taken (μg/mL) | Amount Found (μg/mL) | % Found * |
| 4.0 | 3.93 | 98.29 | |
| 8.0 | 7.99 | 99.95 | |
| 12.0 | 12.17 | 101.46 | |
| 16.0 | 15.94 | 99.60 | |
| 20.0 | 19.96 | 99.81 | |
| Mean | 99.82 | ||
| ± S.D. | 1.13 | ||
| % RSD | 1.131 | ||
| % Error | 0.505 | ||
Disclaimer/Publisher’s Note: The statements, opinions and data contained in all publications are solely those of the individual author(s) and contributor(s) and not of MDPI and/or the editor(s). MDPI and/or the editor(s) disclaim responsibility for any injury to people or property resulting from any ideas, methods, instructions or products referred to in the content. |
© 2023 by the authors. Licensee MDPI, Basel, Switzerland. This article is an open access article distributed under the terms and conditions of the Creative Commons Attribution (CC BY) license (https://creativecommons.org/licenses/by/4.0/).
Share and Cite
Alossaimi, M.A.; Elmansi, H.; Alajaji, M.; Altharawi, A.; Altamimi, A.S.A.; Magdy, G. A Novel Quantum Dots-Based Fluorescent Sensor for Determination of the Anticancer Dacomitinib: Application to Dosage Forms. Molecules 2023, 28, 2351. https://doi.org/10.3390/molecules28052351
Alossaimi MA, Elmansi H, Alajaji M, Altharawi A, Altamimi ASA, Magdy G. A Novel Quantum Dots-Based Fluorescent Sensor for Determination of the Anticancer Dacomitinib: Application to Dosage Forms. Molecules. 2023; 28(5):2351. https://doi.org/10.3390/molecules28052351
Chicago/Turabian StyleAlossaimi, Manal A., Heba Elmansi, Mai Alajaji, Ali Altharawi, Abdulmalik S. A. Altamimi, and Galal Magdy. 2023. "A Novel Quantum Dots-Based Fluorescent Sensor for Determination of the Anticancer Dacomitinib: Application to Dosage Forms" Molecules 28, no. 5: 2351. https://doi.org/10.3390/molecules28052351