Abstract
Mitochondria have a crucial role in regulating energy metabolism and their dysfunction has been linked to tumorigenesis. Cancer diagnosis and intervention have a great interest in the development of new agents that target biomolecules within mitochondria. However, monitoring and modulating mitochondria RNA (mtRNA), an essential component in mitochondria, in cells is challenging due to limited functional research and the absence of targeting agents. In this study, we designed and synthesized a fluorescent quinolinium derivative, QUCO-1, which actively lit up with mtRNA in both normal and cancer cells in vitro. Additionally, we evaluated the function of QUCO-1 as an mtRNA ligand and found that it effectively induced severe mitochondrial dysfunction and OXPHOS inhibition in RKO colorectal cancer cells. Treatment with QUCO-1 resulted in apoptosis, cell cycle blockage at the G2/M phase, and the effective inhibition of cell proliferation. Our findings suggest that QUCO-1 has great potential as a promising probe and therapeutic agent for mtRNA, with the potential for treating colorectal cancer.
1. Introduction
The Warburg effect is a metabolic adaptation observed in cancer cells where they rely more on glycolysis, even in the presence of oxygen, instead of oxidative phosphorylation (OXPHOS) as the primary source of energy [1,2]. This allows cancer cells to meet the high energy demands required for their rapid proliferation and growth. However, recent studies have shown that mitochondrial function, especially OXPHOS, is critical for cancer cell survival and growth [3,4]. OXPHOS not only is the powerhouse of cancer cells, but also plays a vital role in regulating various cellular processes such as apoptosis, autophagy, ferroptosis, and the cell cycle, which are closely linked to tumorigenesis.
Mitochondria play a central role in maintaining cellular homeostasis by regulating the production of reactive oxygen species (ROS), which can have both pro- and antitumorigenic effects. Due to the fatal effects of acute mitochondrial dysfunction on cancer cells, there is growing interest in discovering novel agents that target biomolecules within mitochondria and inhibit the OXPHOS functions of cancer cells [5]. A number of small molecules targeting the electron transport chain (ETC) and mitochondrial respiratory chain complexes have demonstrated success in cancerous models such as the biguanides metformin and phenformin as mitochondrial complex I inhibitors, and VLX600 and tigecycline as different ETC inhibitors [6,7,8,9,10]. To validate the effect in a high-throughput way, the mitochondrial membrane potential (MtMp), a mitochondrial health indicator, is a good parameter. MtMp dysfunction probes have several types such as off/on probes and ratiometric fluorescent probes. Numbers of target-switchable fluorescent probes have been reported [11,12,13,14,15,16,17].
Mitochondrial RNA (mtRNA) has recently gained attention from researchers [18]. Mitochondria form the bioenergetic and biosynthetic organelle, containing its own DNA genome (mtDNA) that transcripts mtRNA, including mitochondrial tRNA, rRNA, unknown functional RNA, and mitochondrial mRNA [19]. mtDNA mainly codes for the mitochondrial respiratory chain complexes responsible for OXPHOS [20]. Although previous studies have focused on the connection between tumorigenesis and mtDNA mutation [21,22,23], the regulation of cancer cells by mtRNA remains unclear.
The study of mtRNA has been limited due to the lack of available methods. Currently, the only ways to visualize mtRNA in fixed cells are through BrU-based immunofluorescence and FISH using oligonucleotide probes [24,25]. To gain an insight into the biological function of mtRNA, there is a need to develop small molecule probes that can monitor or modulate mtRNA in live cells.
Previously, we successfully developed selective RNA fluorescent probes, QUID-1 and QUID-2, to visualize RNA in live cells [26,27]. In the following evaluation of their analogs, we discovered a quinolinium-based coumarin hemocyanin probe, QUCO-1, that lit up with mtRNA, both in vitro and in live cells. Considering the connection between mitochondrial dysfunction and tumorigenesis, we further evaluated QUCO-1 as an mtRNA ligand. We found it could modulate mitochondrial dysfunction and cause proliferation inhibition and cell death in RKO cells. These results suggest that QUCO-1 could serve as a promising probe and therapeutic agent for mtRNA, and holds the potential for treating colorectal cancer.
2. Results
2.1. Synthetic Route of Lead Compound QUCO-1
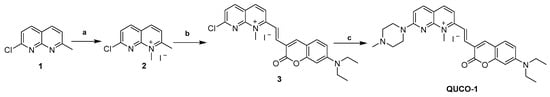
The synthetic routes of QUCO-1 are described in Scheme 1. Compound 1 was synthesized according to a previous report [28]. A solution of 1 (0.10 g, 0.56 mmol) in acetonitrile (0.16 mL) was treated with CH3I (0.1 mL, 1.61 mmol). The mixture was stirred at reflux for 12 h. After cooling, the mixture was filtered and the crude product was thoroughly washed with cold anhydrous ether and dried under a vacuum to afford 2 (0.13 g, yield 73%). A mixture of 2 (0.13 g, 0.41 mmol), 7-N,N-diethylaminocoumarin-3-aldehyde (0.15 g, 0.62 mmol), and EtOH (3.7 mL) was stirred at reflux for 24 h. After cooling to room temperature, the mixture was filtered and the crude product was thoroughly washed with cold anhydrous ethanal and dried under a vacuum to afford 3 (0.15 g, yield 67%). To a solution of 3 (0.15 g, 0.27 mmol) in acetonitrile (0.75 mL), N-methylpiperazine (0.06 mL, 0.54 mmol) and a catalytic amount of K2CO3 (0.07 g, 0.54 mmol) were added. The reaction mixture was stirred at room temperature for 24 h. After that, the mixture was filtered and the crude product was thoroughly washed with cold anhydrous ethanol and dried under a vacuum to afford a purple solid (QUCO-1, 0.11 g, yield 67%).
Scheme 1.
Synthesis of QUCO-1. Reagents and conditions: (a) CH3I, CH3CN, reflux, 12 h; (b) 7-N,N-diethylaminocoumarin-3-aldehyde, EtOH, reflux, 24 h; (c) N-methylpiperazine, K2CO3, CH3CN, r.t., 24 h.
2.2. QUCO-1 as a Fluorescent Probe for mtRNA
Upon screening our probe library, we discovered that QUCO-1 could image mitochondria (Figure 1 and Figure S3). The probe colocalized well with the mitochondria marker MitoTracker Green in both RKO cancer cells and NCM460 normal cells, with Pearson’s R-values of 0.90 and 0.88, respectively. Given the lipophilic quinolinium cation [29] of QUCO-1, it was unsurprising that this molecule was able to accumulate in mitochondria.
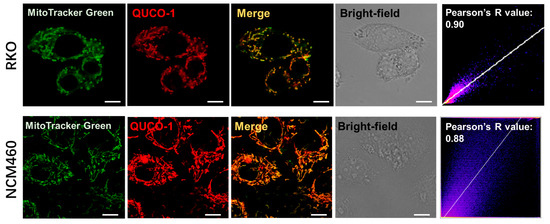
Figure 1.
Colocalization of QUCO-1 (1 µM) with mitochondria in RKO or NCM460 cells. Commercial mitochondrial dye (MitoTracker Green) was used to identify mitochondria. Scale bar: 5 μm. Pearson’s R scatterplot and value between QUCO-1 and MitoTracker Green signal are also shown. QUCO-1: Ex = 550 nm and Em = 650 nm.
QUCO-1 was derived from RNA fluorescent probes. To verify the ability of QUCO-1 to interact with RNA in mitochondria, we conducted a fluorescence titration assay. This assay assessed the binding potential between QUCO-1 and extracted mtRNA and mtDNA. The optical properties of QUCO-1 are summarized in Table S1. As depicted in Figure 2, the fluorescence of QUCO-1 strongly increased in the presence of mtRNA extracted from mitochondria, whereas a modest change was observed with mtDNA. The binding affinity was also calculated, and QUCO-1 demonstrated a good binding affinity with mtRNA. These findings suggest that QUCO-1 has the potential to interact with mtRNA in live cells and emit fluorescence.
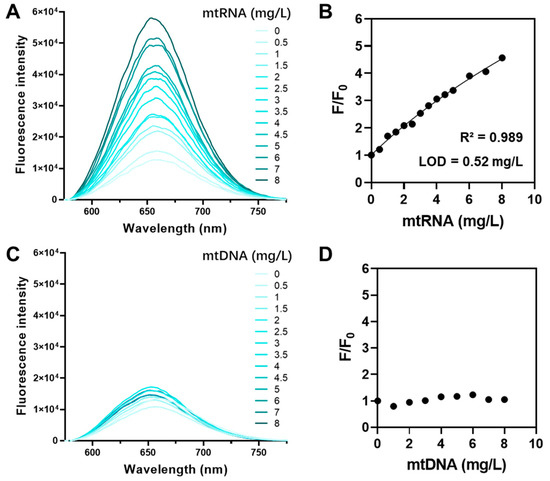
Figure 2.
Fluorescence titration assay of QUCO-1 with mtRNA and mtDNA. (A) The fluorescence emission spectrum of QUCO-1 with various concentrations of mtRNA extracted from RKO cells. (B) The fluorescence emission change (F/F0) vs. (mtRNA) at λex = 650 nm was shown in the regression figure. R-squared and LOD values were listed. (C) The fluorescence emission spectrum of QUCO-1 with various concentrations of mtDNA extracted from RKO cells. (D) The fluorescence emission change (F/F0) vs. (mtDNA) at λex = 650 nm was shown in the regression figure.
2.3. QUCO-1 Inhibits Cancer Cell Proliferation by Causing Mitochondrial Dysfunction and OXPHOS Inhibition
The presence of QUCO-1 may alter the function of mtRNA, leading to changes in the overall function of the mitochondria. These changes in mitochondrial function can have a significant impact on cell activity. To evaluate the effect of QUCO-1 on cancer and normal cells, we selected two cell lines: RKO, a colorectal cancer cell line; and NCM460, a normal human colon mucosal epithelial cell line. As depicted in Figure 3, QUCO-1 displayed cytotoxicity against RKO, with an IC50 value of 1.3 μM. In contrast, QUCO-1 had a weaker effect on NCM460, with an IC50 value 5 times weaker. These results suggest that QUCO-1 has a selective inhibitory effect on the viability of cancer cells. Interestingly, although QUCO-1 accumulated in mitochondria in both normal and tumor cells, the compound only exerted a relatively strong toxicity on normal cells. This suggests that there may be differences in the mtRNA status and the way the mitochondria function is regulated between normal and tumor cells.
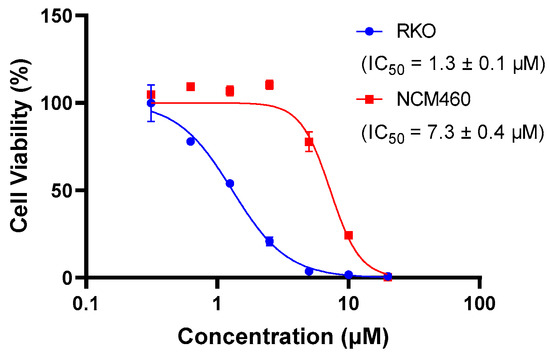
Figure 3.
The inhibition rate of QUCO-1 (treated for 48 h) on RKO and NCM460 cells was determined using HCS. The IC50 values were fitted based on the inhibition curves.
With the discovery that QUCO-1 could bind to mtRNA, we sought to evaluate its impact on mitochondrial functions in RKO cells as a potential anticancer agent. We measured two key indicators of the mitochondrial function: the mitochondrial transmembrane potential (MMP), and the reactive oxygen species (ROS) level (Figure 4A,B). MMP is crucial for maintaining the proper function of the mitochondrial respiratory chain whilst an increase in ROS production is a hallmark of mitochondrial dysfunction. After 24 h of treatment, the fluorescence levels of the MMP dyes significantly decreased in the presence of QUCO-1, indicating a substantial loss of depolarization in the mitochondrial transmembrane. Meanwhile, the ROS level increased in the presence of QUCO-1. These changes in both MMP and ROS levels suggest that QUCO-1 leads to severe mitochondrial damage.
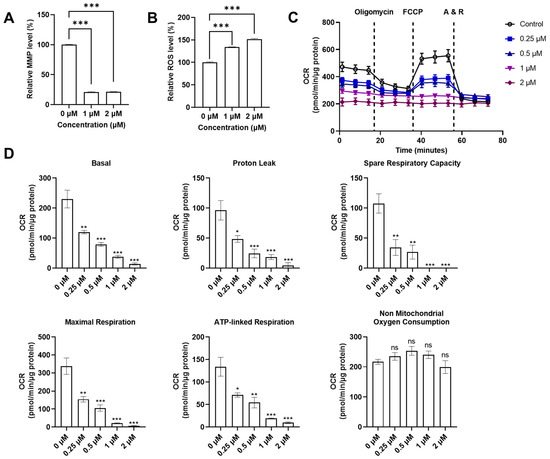
Figure 4.
Systematical evaluation of mitochondrial functions with QUCO-1 treatment after 24 h. (A) Relative MMP level after compounds were treated; the ratio was MFI/MFIctrl (%). (B) Relative ROS level after compounds were treated; the ratio was MFI/MFIctrl (%). (C) Extracellular flux was determined in RKO cells cultured in 10 mM glucose, 1 mM pyruvate, and 2 mM glutamine. Representative graphs demonstrate the effects of oligomycin, trifluoromethoxy carbonylcyanide phenylhydrazone (FCCP), and antimycin A/rotenone (A&R) mixture sequentially added for OCR. (D) The basal respiration, proton leak, spare respiration capacity, maximal respiration, ATP-linked respiration, and nonmitochondrial oxygen consumption were calculated by Seahorse XF Cell Mito Stress Test Reporter Generator. All the data were derived from three experiments and expressed as the mean ± SEM. Ns: not significant; * p < 0.05; ** p < 0.01; *** p < 0.001, significantly different from the control.
Given the impact that QUCO-1 had on mitochondrial dysfunction in cancer cells, we wanted to explore whether it also affected the mitochondrial respiration function in the OXPHOS system. An Agilent Seahorse XF Cell Mito Stress Test Kit was used to measure the oxygen consumption rate (OCR) and extracellular acidification rate (ECAR) of live RKO cells treated with QUCO-1 (Figure 4C and Figure S2A). After 24 h of incubation with QUCO-1, the OCR of the RKO cells decreased in a concentration-dependent manner for basal respiration, proton leak, maximal respiration, spare respiration capacity, and ATP-linked respiration. Nonmitochondrial oxygen consumption was not affected. Additionally, we observed particularly severe damage to basal and ATP-linked respiration. In contrast, the ECAR and all glycolysis indicators were not significantly affected (Figure S2A,B). These results, consistent with the trends observed in the MMP and ROS levels, confirmed that QUCO-1 could cause severe mitochondrial respiration dysfunction. Overall, QUCO-1 could induce mitochondrial dysfunction, possibly related to OXPHOS, and inhibit cancer cell proliferation.
2.4. QUCO-1 Induces OXPHOS Dysfunction and Apoptosis
The mtRNA probe QUCO-1 could bind mtRNA, induce mitochondrial dysfunction, and cause OXPHOS inhibition. To verify the mechanism, we then determined the changes in OXPHOS proteins by Western blots in the presence of this probe. As shown in Figure 5, the OXPHOS protein levels significantly changed with QUCO-1 treatment; we noticed that complex II decreased at 0.25 μM. However, complex II increased at 0.5 μM, possibly by unexpected feedback. Overall, it was reasonable that QUCO-1 could inhibit the expression of mitochondrial respiratory chain complexes and regulate OXPHOS by targeting mtRNA.
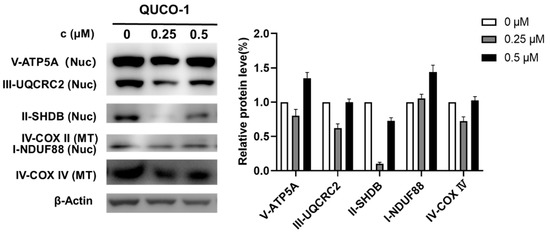
Figure 5.
Western blotting analysis of mitochondrial complex upon 48 h treatment of QUCO-1 in RKO cells.
Dysfunction of mitochondria usually induces apoptosis [30,31]. Thus, we then determined the hallmark of apoptosis, including BAX/BCL2 and CL-PARP/PARP, by Western blotting. As shown in Figure 6, the level of BAX and BCL2 decreased, and the level of cleavage PARP increased. The phenomenon indicated that QUCO-1 could induce apoptosis. In conclusion, QUCO-1 could suppress OXPHOS and severe mitochondrial respiration induced a deficient energy supplement, eventually causing apoptosis.
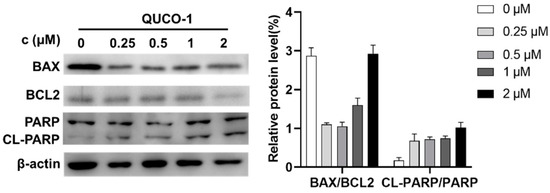
Figure 6.
Western blotting analysis of apoptosis-related protein upon 48 h treatment of QUCO-1 in RKO cells.
2.5. QUCO-1 Arrests the Cell Cycle and Inhibits Colony Formation
Inspired by the activity of QUCO-1, we then evaluated its impact on the cell cycle distribution and colony formation because OXPHOS could arrest the cell cycle and inhibit cell proliferation. After 48 h of being treated with QUCO-1, the cells in the G2/M ratio dependently increased with an increasing concentration, which showed that the cells were finally arrested in the G2/M phase (Figure 7A). Moreover, a colony formation assay demonstrated that QUCO-1 could significantly inhibit RKO colony formation at low concentrations (Figure 7B). In general, QUCO-1 effectively blocked the cell cycle and inhibited the proliferation of tumor cells, both of which indicate that this compound has a good anticancer activity.
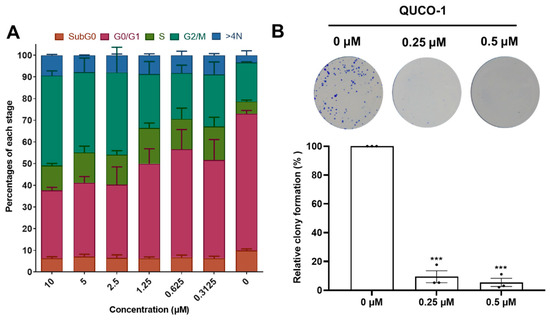
Figure 7.
Cell cycle distribution and colony formation after QUCO-1 treatment in RKO cells. (A) Cell cycle distribution after 48 h treatment of QUCO-1. Data are represented as mean ± SEM; n = 200. (B) Colony formation after 7 days of treatment of QUCO-1. All the data were derived from three experiments and expressed as individual points and the mean ± SEM. ns: not significant; * p < 0.05; ** p < 0.01; *** p < 0.001, significantly different from the control.
3. Discussion
mtRNA is a vital component of mitochondria, but few small molecules targeting mtRNA have been reported for its study. By screening our RNA fluorescent probe library, we discovered a fluorescent quinolinium derivative, QUCO-1, which targeted mtRNA. This compound could visualize mitochondria by lighting up with mtRNA, making it a promising mtRNA probe. QUCO-1 also inhibited cancer cell proliferation, suggesting a new strategy to modulate mitochondrial function. Interestingly, although QUCO-1 could accumulate in mitochondria in both normal and tumor cells, the compound only exerted a relatively strong toxicity on normal cells. This suggests that there may be differences in the mtRNA status and the way the mitochondria function is regulated between normal and tumor cells.
A further evaluation showed that QUCO-1 could induce severe mitochondrial dysfunction and interfere with OXPHOS whilst not affecting glycolysis. The compound suppressed the expression of mitochondrial respiratory chain complexes by targeting mtRNA, suggesting a relationship between mtRNA and OXPHOS. Although we found that QUCO-1 could target mtRNA and suppress the expression of mitochondrial respiratory complexes, it is still unclear how QUCO-1 affected mtRNA and caused changes in the protein expression. We desire to obtain more small molecules with a better specificity to mtRNA, and a structure–activity relationship based on further derivatization is needed in the future.
In this study, we discovered a novel lead mtRNA targeting agent, QUCO-1, which could act as a monitor and modulator of mtRNA. The anticancer activity of QUCO-1 offers a promising strategy for treating colorectal cancer by modulating mtRNA and suppressing the OXPHOS function. The discovery of QUCO-1 is a good start to a novel anticancer strategy targeting mtRNA.
4. Materials and Methods
4.1. Chemistry
All analytical grade chemicals purchased were utilized without further purification. 1H and 13C NMR spectra were recorded using tetramethylsilane (TMS) as the internal standard in DMSO-d6, Methanol-d4, or Chloroform-d with a Bruker Avance III spectrometer at 400 MHz or 500 MHz. High-resolution mass spectra (HRMS) were recorded on a Shimadzu LCMS-IT-TOF. All synthesized compounds were purified by using flash column chromatography with silica gel (200–300 mesh). The purities of all synthesized compounds were confirmed to be higher than 95% by using an analytical HPLC equipped with a Shimadzu LC-20AB system with an AnalaRic C18 column (4.6 × 250 mm, 5 μm), which was eluted with methanol and water containing 0.1% trifluoroacetic acid at a flow rate of 0.5 mL/min.
7-Chloro-1,2-dimethyl-1,8-naphthyridin-1-ium iodide (2). 1H NMR (400 MHz, DMSO-d6) δ 9.22–9.15 (m, 1H), 8.95 (dd, J = 8.5, 3.2 Hz, 1H), 8.26 (dd, J = 8.4, 2.9 Hz, 1H), 8.20 (dd, J = 8.0, 2.6 Hz, 1H), 4.46 (d, J = 2.7 Hz, 3H), 3.11 (d, J = 2.7 Hz, 3H). LRMS (ESI): found 193.05.
(E)-7-Chloro-2-(2-(7-(diethylamino)-2-oxo-2H-chromen-3-yl)vinyl)-1-methyl-1,8-naphthyridin-1-ium iodide (3). 1H NMR (400 MHz, DMSO-d6) δ 8.96 (d, J = 8.8 Hz, 1H), 8.80 (d, J = 8.4 Hz, 1H), 8.65 (d, J = 9.0 Hz, 1H), 8.50 (s, 1H), 8.30 (d, J = 15.4 Hz, 1H), 8.08 (t, J = 11.6 Hz, 2H), 7.62 (d, J = 9.0 Hz, 1H), 6.88 (d, J = 8.5 Hz, 1H), 6.69 (s, 1H), 4.45 (s, 3H), 3.55 (d, J = 6.8 Hz, 4H), 1.18 (t, J = 6.8 Hz, 6H). LRMS (ESI): found 420.15.
(E)-2-(2-(7-(Diethylamino)-2-oxo-2H-chromen-3-yl)vinyl)-1-methyl-7-(4-methylpiperazin-1-yl)-1,8-naphthyridin-1-ium iodide (QUCO-1). Following the mentioned method, the compound QUCO-1 was obtained as a purple solid (0.15 g, 45%). 1H NMR (400 MHz, DMSO-d6) δ 8.58 (d, J = 8.5 Hz, 1H), 8.38 (s, 1H), 8.29 (d, J = 9.1 Hz, 1H), 8.03 (d, J = 8.6 Hz, 1H), 7.97 (s, 1H), 7.84 (d, J = 15.7 Hz, 1H), 7.58 (d, J = 9.4 Hz, 2H), 6.83 (d, J = 9.2 Hz, 1H), 6.65 (s, 1H), 4.30 (s, 3H), 3.93 (s, 4H), 3.59–3.45 (m, 4H), 3.34 (s, 3H), 2.27 (s, 4H), 1.16 (t, J = 6.9 Hz, 6H). 13C NMR (126 MHz, DMSO-d6) δ 160.21 (s), 159.11 (s), 156.95 (s), 154.78 (s), 152.75 (s), 149.55 (s), 146.66 (s), 141.89 (s), 139.97 (s), 139.31 (s), 131.47 (s), 118.50 (s), 117.47 (s), 115.29 (s), 113.84 (s), 112.76 (s), 110.73 (s), 108.93 (s), 96.73 (s), 54.73 (s), 45.90 (s), 44.92 (s), 35.68 (s), 12.90 (s). Purity: 95.673% by HPLC. HRMS (ESI): calcd for (M − I)+ (C29H33N5O2+) 484.2707: found 484.2680.
4.2. Cell Culture
RKO cells (Procell, CL-0196, Wuhan, China) and NCM460 cells (Procell, CL-0196, Wuhan, China) were grown in a Roswell Park Memorial Institute 1640 medium (RPMI 1640 medium) (Cienry, CR31800, Huzhou, China) complemented with 10% fetal bovine serum (FBS) (ExCell Bio, FSP500, Taicang, China). A 1% penicillin–streptomycin solution (P/S) (Procell, PB180120, Wuhan, China) was added. All cells were cultured at 37 °C in a constant temperature incubator with 5% CO2.
4.3. Cytotoxicity Assay
The cytotoxicity was measured using the Cellomics ArrayScan Vti high-content imaging platform (Thermo Fisher Scientific, Waltham, MA, USA). RKO and NCM460 cells were seeded in a 96-well plate (5000 cells/well). After adhering overnight, they were then treated with various concentrations of QUCO-1 in a normal RPMI 1640 medium for 48 h. After treatment, the cells were fixed with 70% ethanol overnight, then stained with propidium iodide (PI) (BioFroxx, PI-1246MG010, Einhausen, Germany) at room temperature for over 2 h. A high-content imaging platform was set to automatically focus on the PI fluorescence channel, and determined the cell density by counting the nucleus number in each well. IC50 values were calculated from the curves of the cell density values of the triplicate tests plotted against the compound concentration.
4.4. Cell Cycle Analysis
For the cell cycle analysis, RKO cells were seeded in a 24-well plate (20,000 cells/well). After adhering overnight, they were then treated with different concentrations of QUCO-1 for 48 h. After treatment, the cells were fixed with 70% ethanol overnight, then stained with propidium iodide (PI) (BioFroxx, PI-1246MG010, Einhausen, Germany) at room temperature for over 2 h. The PI intensity representing the DNA amounts in the individual cells was automatically quantified, and the cell cycle distribution was analyzed by HCS Studio Cell Analysis software 2.0.
4.5. Colocalization
RKO cells were seeded in 96-well glass-bottom plates (cellvis, P96-1-N) (5000 cells/well) and allowed to adhere overnight. QUCO-1 (final concentration: 1 μM) and MitoTracker Green (Ex = 490 nm, Em = 523 nm, Yeasen, 40743ES50) (final concentration: 100 mM) were co-stained for 1 h and then observed using laser scanning confocal microscopy, followed by excitation wavelengths of 561 nm (QUCO-1) and 488 nm (MitoTracker Green) and detection wavelengths of 570–620 nm (QUCO-1) and 500–540 nm (MitoTracker Green). The colocalization analysis was performed using the Coloc 2 plugin of ImageJ version 1.53c.
4.6. Colony Formation Assay
RKO cells were seeded in 6-well plates (500 cells/well) and exposed to QUCO-1 with the RPMI 1640 medium at 37 °C in a 5% CO2 incubator for 7 days. The cells were fixed with 4% polyoxymethylene in PBS for 15 min and dyed with crystal violet.
4.7. OCR and ECAR Determination
RKO cells were seeded in XF 96-well cell culture microplates in quintuplicate at 5000 cells/well in 100 μL of the cell culture medium (RPMI 1640 with 10% FBS) and then incubated at 37 °C in 5% CO2 for 24 h. Every group experiment was carried out in 6 replicates. The cell culture medium was changed to a new medium with or without QUCO-1 for 24 h. First, the growth medium from each well was removed and replaced with 100 μL of a certain assay medium pre-warmed to 37 °C. The cells were incubated at 37 °C immediately for 30 min to reach the temperature and pH equilibrium before the first rate measurement. Before the measurement, the XF-96 Analyzer gently mixed the certain medium in each well for 10 min to reach an equilibrium state of oxygen partial pressure. Following mixing, the OCR and ECAR were simultaneously measured for 5 min to establish a baseline. The certain medium was then gently mixed again for 5 min between each rate measurement to restore the normal oxygen tension and pH equilibrium in the cell microenvironment. After the baseline measurement, 20 μL of a testing agent dissolved in an assay medium was injected into each well to reach the desired final working concentration, followed by mixing for 5 min to expedite the compound exposure to the targeting proteins, after which both OCR and ECAR measurements were then made. Three baseline data and three response data were measured after each compound addition (1 μM Oligomycin, 2 μM FCCP, Rotenone for OCR; 10 mM Glucose, 1 μM Oligomycin, 50 mM 2-DG for ECAR), and the average of all baseline data or test data was used for the data analysis. The data were normalized by the quantitation of the total protein of cells in each well.
4.8. Mitochondria Membrane Potential Determination
RKO cells were planted in 6-well plates (200,000 cells/well) for 24 h. The RKO cells were then treated with various concentrations of QUCO-1 for 24 h and harvested in RPMI 1640 without FBS. Cells treated with QUCO-1 were detected using Rhodamine 123 (final concentration: 2 μΜ). After incubation for 30 min at 37 °C, the cells were resuspended with RPMI 1640. Flow cytometry was used to analyze two indicators by using a CytoFLEX S flow cytometer (Beckman Coulter, Brea, CA, USA). For each analysis, 2 × 10⁴ events were collected. The cell cycle distribution was analyzed using FlowJo software v8.
4.9. Determination of Mitochondria and ROS Determination
RKO cells were planted in 6-well plates (200,000 cells per well) for 24 h. The RKO cells were then treated with various concentrations of QUCO-1 for 24 h and harvested in RPMI 1640 without FBS. Finally, the mitochondria ROS level was detected by using the guide of a BBoxiProbe® O08 probe.
4.10. Determination of Protein Extract and Western Blot Assay
After treatment with QUCO-1 for 48 h, the RKO cells were washed with cold PBS three times and lysed with a RIPA lysis buffer (50 mM Tris, 150 mM NaCl, 1% TritonX-100, 1% sodium deoxycholate, 0.1% SDS, and 1 mM EDTA; pH 7.4) at 4 °C for 30 min. The lysis of cells was centrifuged at 12,000 rpm at 4 °C for 15 min. The quantitation of the total protein of the supernatant was diluted for the BCA determination and denatured at 85 °C for 10 min with the addition of a loading buffer (50 mM Tris-HCl, 6 M urea, 6% 2-mercaptoethanol, 3% SDS, and 0.003% bromophenol blue; pH 6.8). A total of 20 μg of protein was loaded onto each lane, run on the 5%/12% SDS-PAGE, transferred to microporous polyvinylidene difluoride membranes, and then detected by Western blots. The primary antibody used in this experiment was Total OXPHOS Human WB Antibody Cocktail (ab110411, abcam). The secondary antibodies in this assay were horseradish peroxidase-conjugated anti-mouse (No. 7076S, Cell Signaling Technology) and anti-rabbit (No. 7074S, Cell Signaling Technology). The visualization of the protein bands replied on the chemiluminescence substrate.
4.11. Mitochondrial RNA Assay and DNA Extraction
After treatment with QUCO-1 for 24 h, the RKO cells were washed three times with cold PBS and the mitochondria were extracted using a cell mitochondrial isolation kit (beyotime, C3601). RNA and DNA extractions were performed according to the instructions of the RNAeasy™ animal RNA extraction kit (beyotime, R0027) and the genomic DNA small extraction kit (beyotime, D0063). Finally, their concentrations were determined using trace ultraviolet light after extraction.
4.12. Fluorescence Spectrometric Titrations
The fluorescence titration was performed using a fluorophotometer. The mtRNA and mtDNA from the extraction were adjusted to 200 ng/μL using enzyme-free ddH2O. The compound QUCO-1 (excitation wavelength of 540 nm) solution was configured using enzyme-free ddH2O with a concentration of 5 μM. mtRNA/mtDNA was successively added (50 ng each) into the compound solution and mixed before detection using fluorescence spectrometry. After using originlab for the baseline processing, the regression processing of the peak data and the Kd calculation were performed using GraphPad 7.0.
Supplementary Materials
The following supporting information can be downloaded at https://www.mdpi.com/article/10.3390/molecules28062690/s1, Figure S1. mtDNA copy numbers of RKO cells treated by QUCO-1. Figure S2. Systemic evaluation of glycolysis function with QUCO-1 treatment after 24 h. Figure S3. Co-localization of QUCO-1 and mitochondria in NCM460 with different time and concentration. Table S1. Summarize optical properties of the fluorescent probe. 1H NMR, 13C NMR, HRMS, and HPLC spectra of 2, 3, 4, and QUCO-1.
Author Contributions
Evaluation, visualization and writing—original draft preparation, B.-Z.W., Y.-C.Z., Y.-W.L. and Y.-H.X.; Synthesis, X.-C.C. and Z.-Y.Y.; Supervision, funding acquisition and writing—review and editing, J.-H.T., Z.-S.H. and S.-B.C. All authors have read and agreed to the published version of the manuscript.
Funding
This work was supported by the National Natural Science Foundation of China (81930098, 81872732, 81973184, and 81922063), the Guangdong Basic and Applied Basic Research Foundation (2019B151502015), the Fundamental Research Funds for the Central Universities (20ykzd16), Outstanding Talents of Guangdong Special Plan (2019JC05Y456), the 111 Project (B16047), the Local Innovative and Research Teams Project of Guangdong Pearl River Talents Program (2017BT01Y093), the Ministry of Education of China (IRT-17R111), Guangdong Provincial Key Laboratory of Construction Foundation (2020B1212060034), the Natural Science Foundation of Guangdong Province (2017A030308003), the Guangdong Basic and Applied Basic Research Foundation (2021A1515010079), and the China Postdoctoral Science Foundation (2022M723583).
Institutional Review Board Statement
Not applicable.
Informed Consent Statement
Not applicable.
Data Availability Statement
Data are contained within the article or Supplementary Materials.
Conflicts of Interest
The authors declare no conflict of interest.
Sample Availability
The samples of the compounds used and/or analyzed during the current study are available from the corresponding author upon reasonable request.
References
- DeBerardinis, R.J.; Chandel, N.S. We need to talk about the Warburg effect. Nat. Metab. 2020, 2, 127–129. [Google Scholar] [CrossRef]
- Liberti, M.V.; Locasale, J.W. The Warburg Effect: How Does it Benefit Cancer Cells? Trends Biochem. Sci. 2016, 41, 211–218. [Google Scholar] [CrossRef]
- Wallace, D.C. Mitochondria and cancer. Nat. Rev. Cancer 2012, 12, 685–698. [Google Scholar] [CrossRef]
- Zong, W.X.; Rabinowitz, J.D.; White, E. Mitochondria and Cancer. Mol. Cell 2016, 61, 667–676. [Google Scholar] [CrossRef]
- Bedi, M.; Ray, M.; Ghosh, A. Active mitochondrial respiration in cancer: A target for the drug. Mol. Cell. Biochem. 2022, 477, 345–361. [Google Scholar] [CrossRef]
- Birsoy, K.; Possemato, R.; Lorbeer, F.K.; Bayraktar, E.C.; Thiru, P.; Yucel, B.; Wang, T.; Chen, W.W.; Clish, C.B.; Sabatini, D.M. Metabolic determinants of cancer cell sensitivity to glucose limitation and biguanides. Nature 2014, 508, 108–112. [Google Scholar] [CrossRef]
- El-Mir, M.Y.; Nogueira, V.; Fontaine, E.; Avéret, N.; Rigoulet, M.; Leverve, X. Dimethylbiguanide inhibits cell respiration via an indirect effect targeted on the respiratory chain complex I. J. Biol. Chem. 2000, 275, 223–228. [Google Scholar] [CrossRef]
- Skrtić, M.; Sriskanthadevan, S.; Jhas, B.; Gebbia, M.; Wang, X.; Wang, Z.; Hurren, R.; Jitkova, Y.; Gronda, M.; Maclean, N.; et al. Inhibition of mitochondrial translation as a therapeutic strategy for human acute myeloid leukemia. Cancer Cell 2011, 20, 674–688. [Google Scholar] [CrossRef]
- Weinberg, S.E.; Chandel, N.S. Targeting mitochondria metabolism for cancer therapy. Nat. Chem. Biol. 2015, 11, 9–15. [Google Scholar] [CrossRef]
- Zhang, X.; Fryknäs, M.; Hernlund, E.; Fayad, W.; De Milito, A.; Olofsson, M.H.; Gogvadze, V.; Dang, L.; Påhlman, S.; Schughart, L.A.; et al. Induction of mitochondrial dysfunction as a strategy for targeting tumour cells in metabolically compromised microenvironments. Nat. Commun. 2014, 5, 3295. [Google Scholar] [CrossRef]
- Abeywickrama, C.S.; Bertman, K.A.; Pang, Y. From nucleus to mitochondria to lysosome selectivity switching in a cyanine probe: The phenolic to methoxy substituent conversion affects probe’s selectivity. Bioorganic Chem. 2020, 99, 103848. [Google Scholar] [CrossRef]
- Bazhin, A.A.; Sinisi, R.; De Marchi, U.; Hermant, A.; Sambiagio, N.; Maric, T.; Budin, G.; Goun, E.A. A bioluminescent probe for longitudinal monitoring of mitochondrial membrane potential. Nat. Chem. Biol. 2020, 16, 1385–1393. [Google Scholar] [CrossRef]
- Bertman, K.A.; Abeywickrama, C.S.; Pang, Y. A NIR Emitting Cyanine with Large Stokes’ Shift for Mitochondria and Identification of their Membrane Potential Disruption. Chembiochem 2022, 23, e202100516. [Google Scholar] [CrossRef]
- Fan, L.; Ge, J.; Zan, Q.; Wang, X.; Wang, S.; Zhang, Y.; Dong, W.; Shuang, S.; Dong, C. Real-time tracking the mitochondrial membrane potential by a mitochondria-lysosomes migration fluorescent probe with NIR-emissive AIE characteristics. Sens. Actuators B Chem. 2021, 327, 128929. [Google Scholar] [CrossRef]
- Li, X.; Zhao, Y.; Yin, J.; Lin, W. Organic fluorescent probes for detecting mitochondrial membrane potential. Coord. Chem. Rev. 2020, 420, 213419. [Google Scholar] [CrossRef]
- Tian, M.; Dong, B.; Zhang, Z.; Yin, J.; Lin, W. Permeability-Controlled Probe for Directly Visualizing the Opening of Mitochondrial Permeability Transition Pore in Native Status. Anal. Chem. 2022, 94, 5255–5264. [Google Scholar] [CrossRef]
- Tian, M.; Sun, J.; Dong, B.; Lin, W. Construction of mitochondria-nucleolus shuttling fluorescent probe for the reversible detection of mitochondrial membrane potential. Sens. Actuators B Chem. 2019, 292, 16–23. [Google Scholar] [CrossRef]
- Jedynak-Slyvka, M.; Jabczynska, A.; Szczesny, R.J. Human Mitochondrial RNA Processing and Modifications: Overview. Int. J. Mol. Sci. 2021, 22, 7999. [Google Scholar] [CrossRef]
- Mercer, T.R.; Neph, S.; Dinger, M.E.; Crawford, J.; Smith, M.A.; Shearwood, A.-M.J.; Haugen, E.; Bracken, C.P.; Rackham, O.; Stamatoyannopoulos, J.A.; et al. The Human Mitochondrial Transcriptome. Cell 2011, 146, 645–658. [Google Scholar] [CrossRef]
- Guha, M.; Avadhani, N.G. Mitochondrial retrograde signaling at the crossroads of tumor bioenergetics, genetics and epigenetics. Mitochondrion 2013, 13, 577–591. [Google Scholar] [CrossRef]
- Bussard, K.M.; Siracusa, L.D. Understanding Mitochondrial Polymorphisms in Cancer. Cancer Res. 2017, 77, 6051–6059. [Google Scholar] [CrossRef] [PubMed]
- Cruz-Bermúdez, A.; Vicente-Blanco, R.J.; Gonzalez-Vioque, E.; Provencio, M.; Fernández-Moreno, M.; Garesse, R. Spotlight on the relevance of mtDNA in cancer. Clin. Transl. Oncol. Off. Publ. Fed. Span. Oncol. Soc. Natl. Cancer Inst. Mex. 2017, 19, 409–418. [Google Scholar] [CrossRef] [PubMed]
- Weerts, M.J.A.; Sleijfer, S.; Martens, J.W.M. The role of mitochondrial DNA in breast tumors. Drug Discov. Today 2019, 24, 1202–1208. [Google Scholar] [CrossRef] [PubMed]
- Iborra, F.J.; Kimura, H.; Cook, P.R. The functional organization of mitochondrial genomes in human cells. BMC Biol. 2004, 2, 9. [Google Scholar] [CrossRef]
- Tomoike, F.; Abe, H. RNA imaging by chemical probes. Adv. Drug Deliv. Rev. 2019, 147, 44–58. [Google Scholar] [CrossRef]
- Chen, X.C.; Chen, S.B.; Dai, J.; Yuan, J.H.; Ou, T.M.; Huang, Z.S.; Tan, J.H. Tracking the Dynamic Folding and Unfolding of RNA G-Quadruplexes in Live Cells. Angew. Chem. Int. Ed. Engl. 2018, 57, 4702–4706. [Google Scholar] [CrossRef]
- Fang, L.; Shao, W.; Zeng, S.T.; Tang, G.X.; Yan, J.T.; Chen, S.B.; Huang, Z.S.; Tan, J.H.; Chen, X.C. Development of a Highly Selective and Sensitive Fluorescent Probe for Imaging RNA Dynamics in Live Cells. Molecules 2022, 27, 6927. [Google Scholar] [CrossRef]
- Meng, L.; Wu, Y.; Yi, T. A ratiometric fluorescent probe for the detection of hydroxyl radicals in living cells. Chem. Commun. 2014, 50, 4843–4845. [Google Scholar] [CrossRef]
- Song, G.; He, H.; Chen, W.; Lv, Y.; Chu, P.K.; Wang, H.; Li, P. Reversibly Migratable Fluorescent Probe for Precise and Dynamic Evaluation of Cell Mitochondrial Membrane Potentials. Biosensors 2022, 12, 798. [Google Scholar] [CrossRef]
- Li, R.L.; Wang, L.Y.; Duan, H.X.; Zhang, Q.; Guo, X.; Wu, C.; Peng, W. Regulation of mitochondrial dysfunction induced cell apoptosis is a potential therapeutic strategy for herbal medicine to treat neurodegenerative diseases. Front. Pharmacol. 2022, 13, 937289. [Google Scholar] [CrossRef]
- Wang, C.; Youle, R.J. The role of mitochondria in apoptosis*. Annu. Rev. Genet. 2009, 43, 95–118. [Google Scholar] [CrossRef] [PubMed]


Disclaimer/Publisher’s Note: The statements, opinions and data contained in all publications are solely those of the individual author(s) and contributor(s) and not of MDPI and/or the editor(s). MDPI and/or the editor(s) disclaim responsibility for any injury to people or property resulting from any ideas, methods, instructions or products referred to in the content. |
© 2023 by the authors. Licensee MDPI, Basel, Switzerland. This article is an open access article distributed under the terms and conditions of the Creative Commons Attribution (CC BY) license (https://creativecommons.org/licenses/by/4.0/).