Abstract
Zinc ions (Zn2+) play a key role in maintaining and regulating protein structures and functions. To better understand the intracellular Zn2+ homeostasis and signaling role, various fluorescent sensors have been developed that allow the monitoring of Zn2+ concentrations and bioimaging in live cells in real time. This review highlights the recent development of organic fluorescent probes for the detection and imaging of intracellular Zn2+, including the design and construction of the probes, fluorescent response mechanisms, and their applications to intracellular Zn2+ detection and imaging on-site. Finally, the current challenges and prospects are discussed.
1. Introduction
Zinc (Zn2+), proposed as a novel intracellular second messenger [1,2], plays three main roles in living cells: enzyme cofactor [3,4], signaling mediator [5,6,7], and protein structural modulator [8,9]. It is reported that more than three thousand proteins require Zn2+ to function properly [10,11]. Recently, a new Zn2+-associated signal transduction, zinc sparks, was observed [12,13], and a large body of evidence suggests that Zn2+ is pivotal to autophagy [14,15,16,17].
The concentration of labile Zn2+ varies in different environments. Labile Zn2+ in serum or plasma is, for example, approximately 1−10 μM [18,19], while in the cytosol, labile Zn2+ is controlled between 100 pM and 1 nM [20,21,22]. A deficiency or excess of Zn2+ can cause diseases, and some diseases such as compromised immunity, impaired cognition, and abnormal brain development are believed to be related to Zn2+ deficiency [23,24]. On the other hand, Zn2+ overabundance leads to cytotoxicity [25,26,27], gastrointestinal discomfort, and disrupted cholesterol metabolism. Moreover, the disruption of Zn2+ homeostasis can potentially disturb other transition metal ions’ homeostasis [28]. Therefore, quantitative clarification of Zn2+ dynamics at the organelle level can provide fundamental information to better understand the physiological roles of Zn2+ in individual organelles and assist in elucidating the networks of Zn2+ in cells [29,30].
Fluorescent probes are widely used to investigate biomolecules in living cells, tissues, and animals owing to their high sensitivity and non-invasiveness. Fluorescent Zn2+ probes reported mainly include small molecule-based organic chemosensors [31,32,33,34,35,36] and fluorescent protein-based biosensors [37,38,39,40,41]. Compared to fluorescent proteins, small molecule-based organic fluorescent probes have some merits, such as strong emission, tunable wavelength, and more building blocks for probe construction. This review focuses on small molecule-based organic fluorescent probes and summarizes recent progress in fluorescent probes for the detection and imaging of intracellular Zn2+.
2. Design Strategies for Probes and Their Response Mechanisms
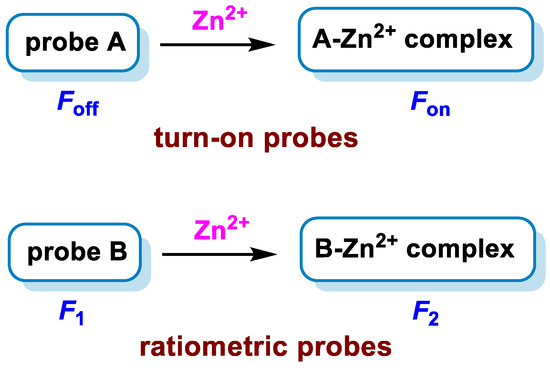
A candidate fluorescent probe for biological application has some merits, including high selectivity, high sensitivity, and high resolution. To obtain high sensitivity and high selectivity, small-molecule-based fluorescent probes are usually designed into two types: turn-on probes and ratiometric probes (Scheme 1). For the former, analyte-binding induces an increase in fluorescence intensity, and for the latter, analyte-binding shifts the emission wavelength.
Scheme 1.
Design strategies for turn-on probes (upper) and ratiometric probes (lower) for Zn2+ detection.
For turn-on probes [42,43,44], most operate on the principle of photo-induced electron transfer (PET) between the fluorophore and Zn2+. In the absence of Zn2+, the fluorophore is quenched by PET from the electron-rich chelating group. Upon binding Zn2+, the PET between the chelating moiety and the fluorophore is disrupted, leading to an increase in fluorescence emission. Manipulation of the fluorophore and binding motif platform can tune the efficiency of PET; therefore, the magnitude of fluorescence changes with Zn2+ binding.
For ratiometric probes [45,46,47], Zn2+ binding alters the emission wavelength. The design of ratiometric probes is usually based on intramolecular charge transfer (ICT) or metal–ligand charge transfer (MLCT). Before the addition of Zn2+, the probes display fluorescence at λ1; upon the addition of Zn2+, the ligand and Zn2+ form complexes that exhibit fluorescence at λ2 due to the ICT or MLCT. The fluorescence intensity at λ2 increases while at λ1 decreases with the increase in Zn2+ until titration saturation. With such probes, fluorescence changes are reported as a ratio of the fluorescence intensity at the two wavelengths. Since this approach minimizes artifacts from cellular movements, sample thickness, and probe concentration, these probes are preferred for accurate quantitative analysis because they provide built-in self-calibration for signal correction by measuring the ratio of the intensity profiles at different wavelengths, and thus more reliable quantitative determination can be achieved.
3. Fluorescent Probes for the Detection of Intracellular Zn2+
3.1. Turn-On Probes
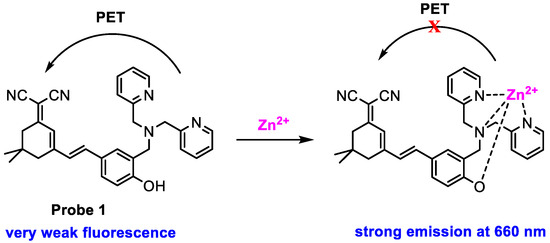
Feng and co-workers [48] developed a near-infrared (NIR) probe (1) (Scheme 2) for monitoring Zn2+ in live cells. Probe 1, synthesized from isophorone in a three-step reaction, displayed a very weak fluorescence at 660 nm (ϕf = 0.08, HEPES buffer with 50% DMSO, pH 7.4) upon excitation with 475 nm; the low quantum yield resulted from efficient PET from bis(pyridin-2-ylmethyl)amine (electron donator) to 2-(cyclohex-2-en-1-ylidene)malononitrile (electron acceptor). A significantly enhanced fluorescence (ϕf = 0.44) was obtained when probe 1 was treated with Zn2+ due to the block of PET via chelating with Zn2+. The changes in fluorescence intensity at 660 nm were proportional to the concentration of Zn2+ added over the range tested (Figure 1), and the detection limit was determined to be 0.1 µM. The control experiments demonstrated that probe 1 displayed high selectivity and good pH stability. Little fluorescence change was detected in the physiological pH range (pH = 4–10) and other bio-ions, as well as ROS, RNS, and RSS species.
Scheme 2.
Structure of probe 1 and its response to Zn2+.
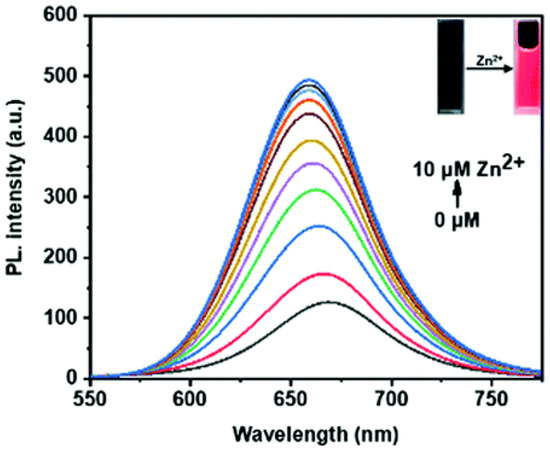
Figure 1.
Fluorescence changes in probe 1 response to Zn2+ (0–10 μM) in HEPES buffer solution (pH = 7.4) with DMSO (v/v = 1:1), λex = 475 nm, λem = 660 nm. Reproduced with permission from Ref. [48]. Copyright 2021, The Royal Society of Chemistry.
In vitro fluorescence imaging of probe 1 was performed in PC12 cells (a type of nerve cell derived from rat adrenal medullary pheochromocytoma) by treatment with exogenous Zn2+. Compared with the controls (Figure 2B,C), the images of PC12 cells showed a significant red fluorescence when they were treated with Zn2+ first, followed by incubation with probe 1 (Figure 2E,F). To verify that the red fluorescence resulted from the probe 1 response to Zn2+, N,N,N′,N′-tetrakis(2-pyridylmethyl) ethylenediamine (TPEN), a Zn2+ chelator, was used for the control. It was found that the red fluorescence completely faded when the TPEN was added to the PC12 cells (Figure 2H,I). The results suggest that probe 1 can detect an instantaneous change in Zn2+ in living cells.
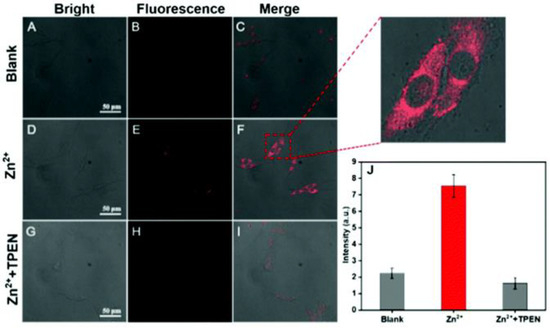
Figure 2.
Confocal imaging in PC12 cells. (A–C) PC12 cells incubated with probe 1 (10 μM) for 30 min. (D–F) PC12 cells incubated with Zn2+ (10 μM) for 10 min, followed by incubation with probe 1 (10 μM) for 30 min. (G–I) PC12 cells incubated with TPEN (10 μM) for 10 min and with Zn2+ (10 μM) for 10 min, followed by incubation with probe 1 (10 μM) for 30 min. λex = 561 nm and obtained at 600–700 nm. (J) Average intensity of PC12 cells. Error bars express the standard deviation (±S.D.) with n ≥ 3. Reproduced with permission from Ref. [48]. Copyright 2021, The Royal Society of Chemistry.
The detection of endogenous Zn2+ in PC12 cells with probe 1 was performed by the stimulation of glutamate. A high concentration of glutamate induces oxidative stress in the nervous system [49], followed by an increase in Zn2+ in nerve cells [50]. As shown in Figure 3, the glutamate-stimulated PC12 cells exhibited red fluorescence due to the increase in intracellular Zn2+. The red fluorescence was completely suppressed when TPEN was added. Further application of probe 1 to monitor Zn2+ in PC12 cells during depression was conducted by incubation of N-methyl-D-aspartic acid (NMDA) receptors, which are postsynaptic targets for releasing Zn2+. In comparison with the control group, the PC12 cells, preincubated with NMDA, a specific agonist for the NMDA receptor, exhibited apparent red fluorescence (D2 and D3). The red fluorescence was, however, decreased by the addition of ifenprodil tartrate, a specific NMDA receptor antagonist (E2 and E3). The results suggest that the generation of Zn2+ is correlated with the over-activation of the NMDA receptor, and probe 1 can monitor variations in Zn2+ in real time during depression.
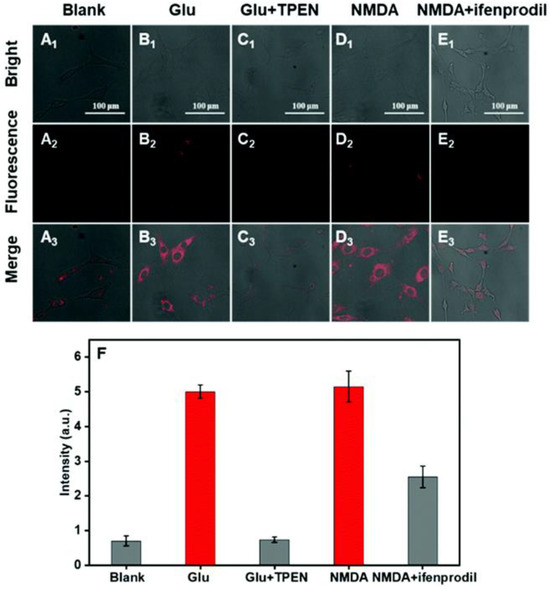
Figure 3.
Confocal imaging in PC12 cells. (A1–A3) PC12 cells incubated with probe 1 (10 μM) for 30 min. (B1–B3) PC12 cells preincubated with glutamate (10 mM) for 7 h, followed by incubation with probe 1 (10 μM) for 30 min. (C1–C3) PC12 cells preincubated with glutamate (10 mM) for 7 h and with TPEN (10 μM) for 10 min, followed by incubation with probe 1 (10 μM) for 30 min. (D1–D3) PC12 cells preincubated with NMDA (4 mM) for 7 h, followed by incubation with probe 1 (10 μM) for 30 min. (E1–E3) PC12 cells preincubated with NMDA (4 mM) and ifenprodil tartrate (4 mM) for 7 h, followed by incubation with probe 1 (10 μM) for 30 min. Excited with λex = 561 nm and collected at 600–700 nm. (F) Average intensity in PC12 cells. Error bars express the standard deviation (±S.D.) with n ≥ 3. Reproduced with permission from Ref. [48]. Copyright 2021, The Royal Society of Chemistry.
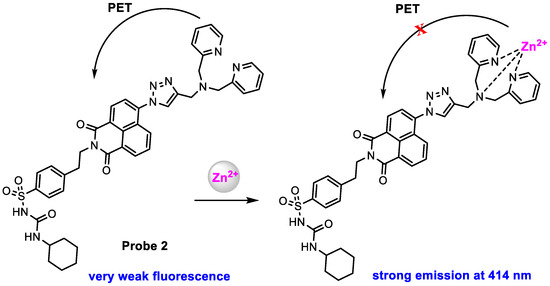
Zn2+ plays an important role in the function of the endoplasmic reticulum (ER), and its deficiency can cause ER stress [51,52] and result in many diseases [53,54,55]. Fang and co-workers [56] reported an ER-targeted fluorescent probe to image Zn2+ in live cells. Probe 2 (Scheme 3) was designed by employing a glibenclamide unit as the ER target and a bis(pyridin-2-ylmethyl)amine unit as the Zn2+ chelating agent, both conjugated to 1,8-naphthalic anhydride. Probe 2 exhibited a very weak fluorescence at 414 nm (ϕf = 0.04, HEPES buffer with 1% DMSO, pH 7.4) with 346 nm excitation. Upon the addition of Zn2+, a significantly enhanced fluorescence (ϕf = 0.25) was observed (Figure 4), and the detection limit was determined to be 47 pM.
Scheme 3.
Structure of probe 2 and its response to Zn2+.
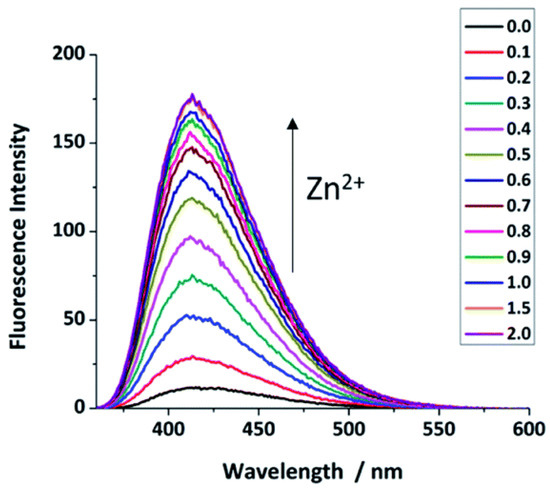
Figure 4.
Fluorescence changes in probe 2 response to Zn2+ (0–2.0 μM) in HEPES buffer solution (pH = 7.4) with 1% DMSO, λex = 346 nm, λem = 414 nm. Reproduced with permission from Ref. [56]. Copyright 2019, The Royal Society of Chemistry.
The in vitro imaging of Zn2+ in ER with probe 2 was confirmed by the addition of zinc pyrithione, a membrane-permeable zinc source in live cells. As shown in Figure 5, the fluorescence response of probe 2 could be clearly observed in the ER in HeLa cells. Upon the addition of zinc pyrithione, the fluorescence intensity increased significantly; the fluorescence was, however, almost completely quenched by the addition of TPEN.
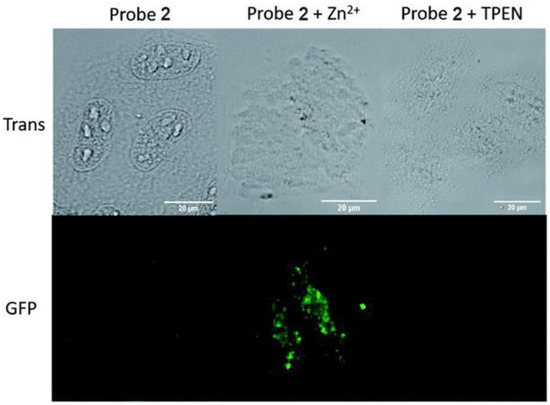
Figure 5.
Fluorescence microscopy images of HeLa cells treated with probe 2 (20 µM), probe 2 (20 µM) + zinc pyrithione (100 µM), and probe 2 (20 µM) + TPEN (100 µM). Scale bars: 20 µm. Reproduced with permission from Ref. [56]. Copyright 2019, The Royal Society of Chemistry.
The feasibility of probe 2 to monitor changes in Zn2+ levels in the ER was carried out with ER stress. ER stress can be induced by tunicamycin or thapsigargin. As shown in Figure 6, the fluorescence intensity of probe 2 in HepG2 cells decreased significantly after treatment with both ER stress inducers, indicating that the mobile Zn2+ level in the ER distinctly decreased under ER stress within 1 h. As a control, no fluorescence intensity change was observed in their absence.
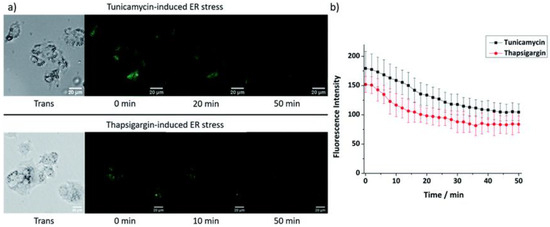
Figure 6.
(a) Fluorescence microscopy images and (b) fluorescence intensity changes in probe 2 (20 µM) in HepG2 cells at ER stress state induced by tunicamycin (5 µg/mL) or thapsigargin (1 µM). Scale bars: 20 µm. Reproduced with permission from Ref. [56]. Copyright 2019, The Royal Society of Chemistry.
Du and co-workers [57] synthesized a lysosome-targeted fluorescent probe for in vitro and in vivo imaging of intracellular Zn2+. Lysosomes are acidic organelles with a pH of 3.5–6.0, thus, the probe should have dual Zn2+ and H+ sensing functions. Probe 3 was constructed with three parts: a Zn2+ chelator (methoxy-based N,N-di-(2-picolyl)ethylenediamine), a lysosome-targeting moiety (morpholine group), and a fluorophore (3,6-diphenyl diketopyrrolopyrrole). The probe was developed for the detection of low pH and Zn2+ in an AND logic fashion (Scheme 4). Enhanced fluorescence was detected when probe 3 (ϕf = 0.008) was chelated with Zn2+ (ϕf = 0.328) or protonate in morpholine moiety (ϕf = 0.091), due to the suppression of one PET pathway. A larger increased fluorescence (ϕf = 0.372) was obtained when probe 3 was chelated with Zn2+ at pH = 5; in this case, both PET pathways were blocked.
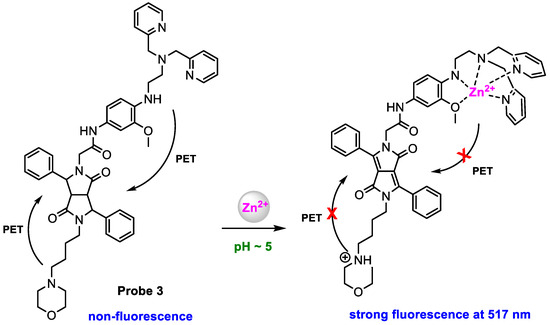
Scheme 4.
Structure of probe 3 and its response to pH and Zn2+.
In vitro imaging of probe 3 was performed by discriminating between cancerous and normal prostate cells. Two prostate cancerous cell lines PC3 and DU145 and one normal human prostate epithelial cell line RWPE1 were employed. No significant change in fluorescence was observed with both cancerous cells DU145 and PC3 with the addition of Zn2+ (15 µM). On the contrary, a distinctly enhanced fluorescence was observed with RWPE1 cells with the addition of Zn2+ (Figure 7). The difference is ascribed to the downregulation of zinc transporters in cancerous PC3 and DU145 cells, which reduces the uptake of extracellular Zn2+.
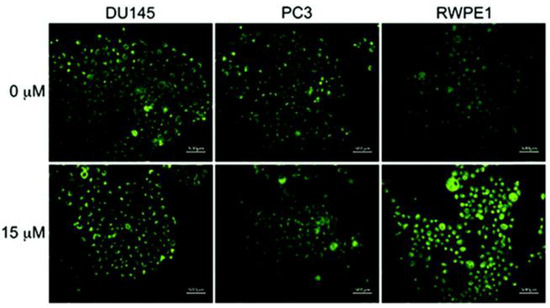
Figure 7.
Fluorescence microscope images of cancerous prostate cells (PC3 and DU145) and normal human prostate epithelial cells (RWPE1) incubated with probe 3 (1 µM, 24 h) in the absence and presence of an exogenous Zn2+ (15 µM). Reproduced with permission from Ref. [57]. Copyright 2019, The Royal Society of Chemistry.
In vivo imaging of Zn2+ with probe 3 was conducted using nude mice models. As shown in Figure 8, a bright fluorescence signal in the region of the prostate was observed (b) after injection of probe 3 (500 µg per mouse) into male BALB/c nude mice via the tail vein for 15 min. The mice were then sacrificed and dissected. Both white-light color images and fluorescent images were taken under the same settings (c,d). The prostate and seminal vesicle displayed a strong green fluorescence, indicating a high concentration of Zn2+ in these organs. Furthermore, the prostate and seminal vesicle exhibited a strong green fluorescence signal, whereas little fluorescence was observed in the samples of liver, kidney, brain, and muscle (e).
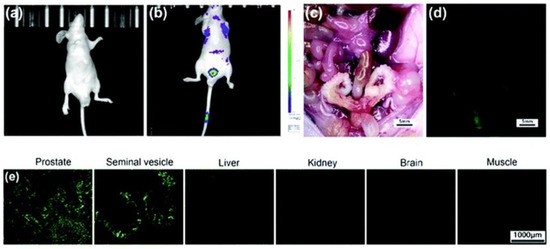
Figure 8.
Representative in vivo imaging of tumor-free male BALB/c nude mice before injection (a) and after tail-vein injection (b) of probe 3 (500 µg per mouse, 5 mice per set). The treated mouse was sacrificed and dissected. The excised prostate and seminal vesicles revealed bright green fluorescence, while other viscera and skeletal muscles remained dark (c,d). Ex vivo fluorescence imaging of the prostate, seminal vesicles, liver, kidney, brain, and adjacent muscle tissue obtained from the mouse injected with probe 3 (e). Reproduced with permission from Ref. [57]. Copyright 2019, The Royal Society of Chemistry.
The potential of probe 3 in prostate cancer biomedical imaging was carried out with a prostate nodule obtained from a 65-year-old male patient diagnosed with prostate cancer. H&E staining highlighted the cancerous region (area within the blue line in Figure 9a). Subsequent staining with probe 3 allowed a clear visualization of the cancerous regions as shown by regions of relatively weak fluorescence (Figure 9b). A significant difference in fluorescence intensity between healthy (strong fluorescence) and cancerous tissue (weak fluorescence) was observed. Authors propose that probe 3 may have a role to play in identifying cancerous prostate tissue in human samples.
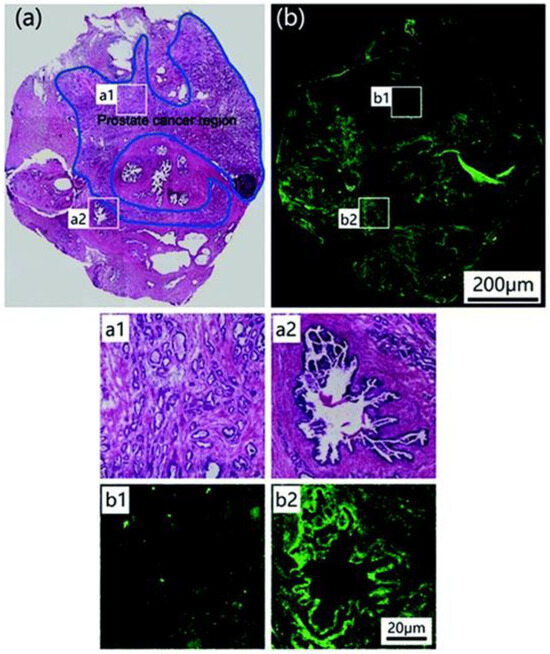
Figure 9.
Histological analysis. (a) Image of prostate nodule sections stained by H&E staining. The cancerous region is indicated by the blue line. (b) Fluorescent staining of the same nodule using probe 3. Regions of interest (a1) and (b1) reflect cross-sectional cancerous prostate nodules stained by H&E staining and probe 3, respectively. Regions of interest (a2) and (b2) are cross-sectional views of normal prostate nodules stained by H&E staining and probe 3, respectively. Reproduced with permission from Ref. [57]. Copyright 2019, The Royal Society of Chemistry.
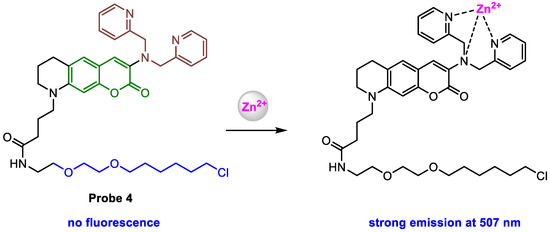
Kowada and co-workers [58] employed HaloTag technology [59], a protein-labeling technology, to localize fluorescent probes to a specific subcellular compartment [60,61,62], to target probe 4 (Scheme 5) into the Golgi apparatus. Probe 4 was constructed with four parts: a fluorophore (green color), a Zn2+ chelator (brown color), a HaloTag ligand (blue color), and a linker (black color). Probe 4 showed almost no fluorescence before the response to Zn2+, but a strong fluorescence (λem = 507 nm, ϕf = 0.52) was obtained upon the addition of the Zn2+. Fluorometry revealed that probe 4 exhibited Zn2+-dependent enhancement of fluorescence. The control experiments suggested that probe 4 displayed high selectivity to the detection of labile Zn2+ without interference from other metal ions. In addition, probe 4, together with its Zn2+-complex, exhibited almost constant fluorescence intensity in the pH range from 6 to 8.
Scheme 5.
Structure of probe 4 and its response to Zn2+.
Monitoring the concentration change in Zn2+ with probe 4 in the Golgi apparatus was conducted by using a co-localizable internal standard dye, HaloTag TMR ligand (HTL-TMR), for in situ standard quantification. Probe 4 and HTL-TMR were co-incubated with HeLa cells at a ratio of 50:1. As shown in Figure 10, significant fluorescence was detected when Zn2+/pyrithione (ZPT) was added to the cells, and the fluorescence then decreased when TPEN was subsequently added. The results suggest that probe 4 can be used to visualize the change in Zn2+ in the Golgi.
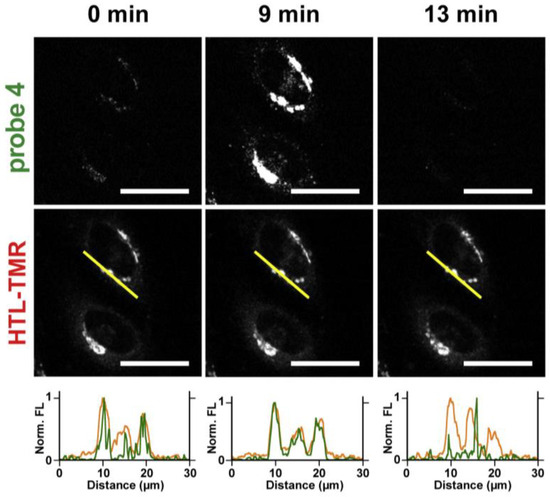
Figure 10.
Confocal microscopy images of probe 4 (0.25 µM) and HTL-TMR (5.0 nM) at 0 min (steady-state), 9 min (saturation), and 13 min (depletion). The line profiles indicate the fluorescence intensities of probe 4 (green) and HTL-TMR (orange), measured along the yellow lines in the HTL-TMR images. Scale bar: 30 mm. Zn2+/pyrithione (ZPT, 40 µM/2 µM, at 2 min) and TPEN (80 µM, at 10 min) were added to increase and decrease intracellular Zn2+. Reproduced with permission from Ref. [58]. Copyright 2020, Elsevier.
Quantitative analysis of Zn2+ in the Golgi was based on the ratio value of the fluorescence intensities of probe 4 and HTL-TMR. The concentration of Zn2+ in the Golgi was estimated in the range of 3.3–59 nM, and the average value was calculated to be 25 ± 1 nM (mean ± SEM). Further verification was carried out by using saponin (a membrane-permeabilizing agent) to facilitate the intracellular Zn2+/pyrithione influx as the control (Figure 11B), and the resulting concentration of Zn2+ was determined to be 23 ± 1 nM (Figure 11D).
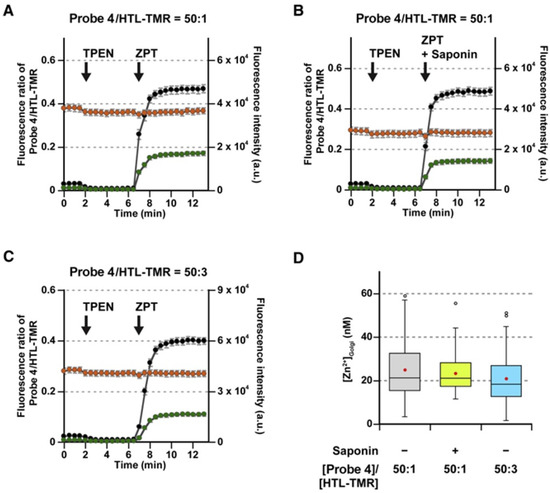
Figure 11.
Quantitative imaging of Zn2+ in the Golgi apparatus in live HeLa cells with a combination of probe 4 and HTL-TMR. (A–C) Time course of fluorescence ratios (black) and intensities of probe 4 (green) and HTL-TMR (orange). The HaloTag proteins were labeled with 0.25 µM probe 4 and HTL-TMR at a ratio of 50:1 (A,B) or 50:3 (C). For intracellular Zn2+ calibration in live cells, 10 µM TPEN was added at 2 min. ZPT (400 µM Zn2+/2 µM pyrithione) (A,C) or ZPT (400 µM Zn2+/2 µM pyrithione) with 0.002% saponin (B) was then added at 7 min. Error bars represent SEM ((A): n = 106, N = 9; (B): n = 49, N = 4; (C): n = 104, N = 9). n and N indicate the numbers of the examined cells and the independent experiments, respectively. (D) [Zn2+]Golgi at the steady state in HeLa cells. Plots were constructed from the datasets in Figure 12A–C. Red dots represent the mean values. Reproduced with permission from Ref. [58]. Copyright 2020, Elsevier.
To obtain the quantification of Zn2+ in various organelles, the same group [63] modified probe 4 with a higher-affinity Zn2+-binding motif to increase the Zn2+ affinity of the probe. Probe 5 (Scheme 6) was designed to increase the Zn2+ affinity by increasing the coordination number of the chelator moiety. Compared to probe 4 (dissociation constant: Kd = 240 nM), probe 5 exhibited a much higher affinity for Zn2+ (Kd = 0.16 nM) in HEPES buffer (pH = 7.4).
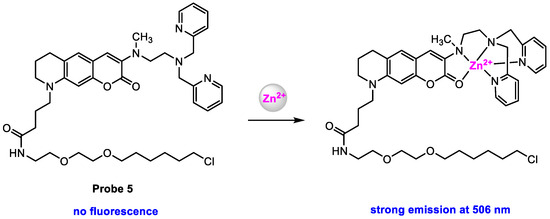
Scheme 6.
Structure of probe 5 and its response to Zn2+.
Probe 5 showed very weak fluorescence due to PET before the response to Zn2+, but strong fluorescence (λem = 506 nm, ϕf = 0.57) was obtained upon the addition of Zn2+, and fluorescence intensity at 506 nm increased with increasing the concentration of Zn2+. Probe 5 exhibited less change in fluorescence in the pH range from 5.5 to 8.0, which suggested that probe 5 could be applied for the detection of Zn2+ in various organelles such as the mitochondria, ER, nucleus, and cytosol. The control experiments demonstrated that probe 5 displayed high selectivity to monitor the intracellular Zn2+ without interference from other bio-ions.
To obtain the concentration of Zn2+ in various organelles, probe 5 was precisely localized to the target cellular compartments including the mitochondria, ER, nucleus, and cytosol using the HaloTag labeling technology. The quantification of Zn2+ in various organelles was performed based on the in situ standard quantification method via co-labeling with HTL-TMR. With Halo−probe 5 at pH 7.4, the concentrations of Zn2+ in various organelles were estimated to be 0.13 nM (cytosol), 0.11 nM (nucleus), 14 pM (ER), and 60 pM (mitochondria), respectively (Figure 12A). In all the tested organelles, the fractional saturation values of probe 5 were in the range of 10−90% (Figure 12B), indicating that probe 5 is appropriate for the quantification of Zn2+.
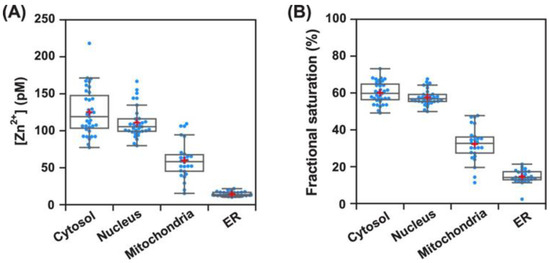
Figure 12.
Quantitative mapping of intracellular Zn2+ using probe 5 (A) and fractional saturation of probe 5 at the steady state (B) in various organelles. Red plus symbols represent the mean values. Reproduced with permission from Ref. [63]. Copyright 2022, American Chemical Society.
3.2. Ratiometric Probes
Two-photon (TP) microscopy is an important tool for biological imaging due to some merits, such as excitation at NIR wavelengths, refraining from light scattering, and providing high-resolution imaging. These promising features have motivated the search for two-photon fluorescent probes for the detection and imaging of biological analytes [64,65,66,67,68].
Bourassa and co-workers [69] synthesized a TP-induced ratiometric fluorescent probe for imaging of dynamic changes in labile Zn2+ in oligodendrocytes, an important cellular constituent of the brain, at different stages of development, in a cell culture. Probe 6 (Scheme 7) displayed fluorescence at 438 nm with a quantum yield of 0.26 in a neutral aqueous buffer (pH 7.0, 10 mM PIPES 0.1 M KCl). After binding with Zn2+, a Zn2+-complex with 1:1 metal−ligand stoichiometry was obtained, which showed fluorescence at 495 nm with a quantum yield of 0.56.
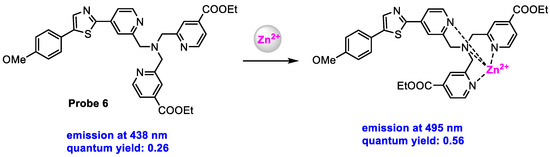
Scheme 7.
Structure of probe 6 and its response to Zn2+.
Ratiometric imaging of cellular Zn2+ was performed with NIH 3T3 mouse fibroblasts as a model system. Live cells were incubated with probe 6 (10 μM) and imaged by TP excitation at 720 nm. Fluorescence was measured between 425–462 (BP1) nm and 478–540 nm (PB2) (Figure 13A), respectively, and the corresponding ratio image was obtained with an average ratio R (PB2/PB1) of 0.60 ± 0.16. Upon exposure to a mixture of ZnSO4 and pyrithione, R was increased to 2.53 ± 0.56, indicating saturation of the probe with Zn2+. The addition of chelator TPEN decreased R to 0.54 ± 0.13 (Figure 13B, left). A plot of the intensity ratio vs. time revealed rapid dynamics for Zn2+-binding and release (Figure 13B, right). Dynamic fluctuations in endogenous Zn2+ were also imaged with probe 6. 2,2′-dithiodipyridine (DTDP), an oxidizing agent that induces dissociation of Zn2+ from cellular sulfhydryl binding sites [70], was employed to incubate with the cells. A low R (0.5) was obtained, which increased to 1.3 upon the addition of DTDP (100 μM). The increased R was then decreased back to basal conditions (R = 0.5) with the increase in time due to the lack of exogenous Zn2+ (Figure 13C).
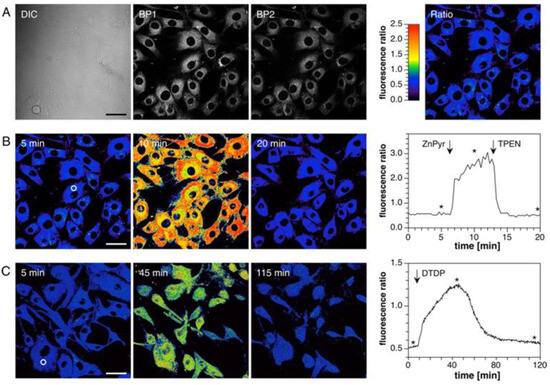
Figure 13.
Ratiometric imaging of Zn2+ in live NIH 3T3 mouse fibroblasts with probe 6 by TP excitation at 720 nm. (A) Left: DIC and fluorescence images acquired with 425−462 nm (BP1) and 478−540 nm (BP2) bandpass filters, respectively. Right: Intensity ratio image with R = BP2/BP1. (B) Left: Ratio images (BP2/BP1) at selected time points prior to and after addition of 50 μM ZnSO4 and 5 μM pyrithione (ZnPyr). Further addition of 100 μM TPEN at 13 min resulted in a reversal of the intensity ratio (shown at 20 min). Right: Time course of the average intensity ratio change for the ROI indicated with a white circle in the left panel. The asterisks indicate time points for the respective ratio images shown to the left. (C) Left: Ratio images prior (at 5 min) and after addition of 100 μM DTDP (at 45 min). This treatment resulted first in a ratio increase peaking around 40 min followed by a gradual decrease back to the initial level (shown at 115 min). Right: Time course of the average intensity ratio change for the ROI indicated with a white circle. The asterisks indicate time marks for the respective ratio images to the left. Scale bars: 40 μm. Reproduced with permission from Ref. [69]. Copyright 2018, American Chemical Society.
Probing labile Zn2+ in developing oligodendrocytes with probe 6 showed that the concentrations of intracellular Zn2+ in oligodendrocytes at different stages of development were different. O4 antigen (O4) and myelin basic protein (MBP) were employed as a marker of developing and mature oligodendrocytes, respectively, and both representative phase contrast images and fluorescence immunohistochemistry images were obtained (Figure 14A,B). As expected, there was no MBP expression in the developing oligodendrocytes but robust expression in mature oligodendrocytes. Similar to cultures with probe 6, as shown in Figure 14C,D, the intensity ratio of images was decreased in mature (0.59 ± 0.01, n = 54 cells from three different cultures) versus developing (0.70 ± 0.01, n = 103 cells from three different cultures) oligodendrocytes.
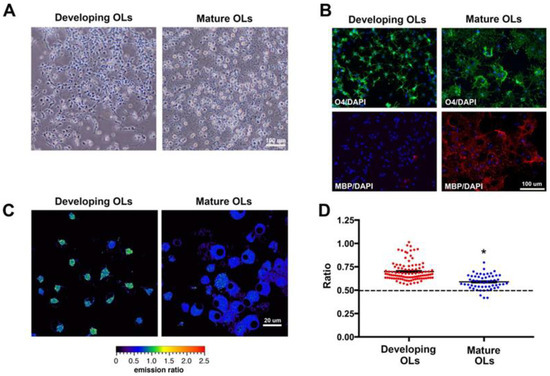
Figure 14.
(A) Phase contrast microscopy images of developing oligodendrocytes at DIV9 and mature oligodendrocytes at DIV16. (B) Immunocytochemistry for O4 antigen (O4, green), myelin basic protein (MBP, red), and DAPI (blue) in developing and mature oligodendrocytes. (C) Representative probe 6 ratio images for developing and mature oligodendrocytes at DIV9 and DIV16, respectively. (D) Scatter plot for probe 6 ratios of individual developing (red) and mature (blue) oligodendrocytes. Mean ± SEM, shown with black solid lines, indicated a decreased ratio in mature oligodendrocytes compared to developing oligodendrocytes. * p < 0.0001 (t-test developing vs. mature oligodendrocytes). The broken line indicates the average ratio after application of TPEN. Reproduced with permission from Ref. [69]. Copyright 2018, American Chemical Society.
Li and co-workers [71] reported a TP-induced ratiometric fluorescent probe for in vitro and in vivo imaging of Zn2+. Probe 7 (Scheme 8) displayed fluorescence at 455 nm with a moderate quantum yield of 0.16 in HEPES buffer containing 10% MeOH (pH 7.4). Upon addition of Zn2+ to the solution of the probe, a 1:1 stoichiometric Zn2+-complex was obtained, which showed fluorescence at 515 nm with a quantum yield of 0.22. The control experiment confirmed that the developed probe showed high selectivity for fluorescent responses to Zn2+. The limit of detection (LOD) was calculated at 25 ± 5 nM.
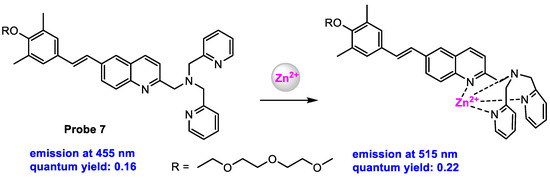
Scheme 8.
Structure of probe 7 and its response to Zn2+.
In vitro imaging with probe 7 was evaluated using mouse cortical neurons as a model system by TP excitation at 750 nm. Two emission channels, Fgreen (380–470 nm) and Fred (470–650 nm), were employed for recording, and endogenous Zn2+ was obtained by NO-inducing metallothioneins [72]. As shown in Figure 15A–D, the color of the images changed from orange to yellow after the cells were incubated with NO for 16 min, accompanied by the decrease in fluorescent intensity ratio Fred/Fgreen from 0.79 ± 0.06 to 0.68 ± 0.07, which resulted from the decrease in the concentration of Zn2+ released from the mouse cortical neurons due to the decrease in NO. The control experiments demonstrated that probe 7 exhibited significant reversibility and good photostability. The former was proven by subsequently treated with Zn2+/pyrithione followed with EDTA (chelator for Zn2+) (Figure 15E,F), the latter by irradiation of probe 7 in HBSS buffer for 16 min (Figure 15G,H).
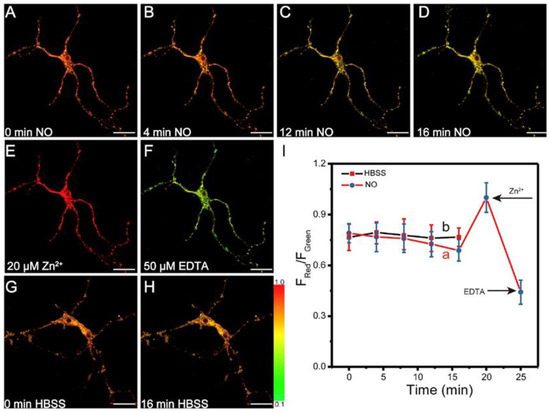
Figure 15.
TP fluorescent images of probe 7 (5 μM) with NO in neurons. Ratiometric imaging of Zn2+ in live NIH 3T3 mouse fibroblasts with probe 6 by TP excitation at 720 nm. (A–D) Fluorescence images of probe 7 incubated with NO for 0 min, 4 min, 12 min, and 16 min, (E) subsequently treated with Zn2+/pyrithione (10 μM, 1:2), and (F) followed by treatment with EDTA (20 μM). (G,H) Fluorescence images of neurons treated with HBSS for 0 and 16 min; scale bars: 15 μm. (I) Quantification of NO-induced (a) and HBSS-treated (b) probe 7 fluorescence changes in neurons over 16 min. After 16 min, the NO-induced sample was treated with 10 μM Zn2+/pyrithione (1:2) and followed with 20 μM EDTA (error bars: S.D., n = 10). Reproduced with permission from Ref. [71]. Copyright 2020, Elsevier.
In vivo TP imaging of probe 7 was evaluated using larval zebrafish as the model. With the increase in Zn2+, the color changed from yellow-green to orange, and then to red (Figure 16F–L), accompanied by an increase in fluorescent intensity ratio Fred/Fgreen from 0.17 ± 0.15 to 0.91 ± 0.21. After EDTA was added to the larval zebrafish, the color changed back to green (Figure 16O), and the fluorescent intensity ratio Fred/Fgreen decreased to 0.21 ± 0.10, due to Zn2+ chelation with EDTA.
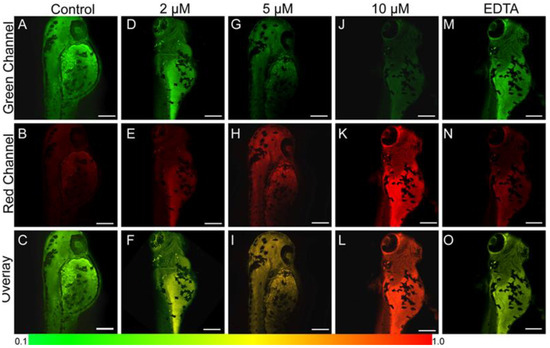
Figure 16.
TP fluorescence images of 1-day-old larval zebrafish treated with 5 μM probe 7 in different concentrations of Zn2+: (A–C) 0 μM, (D–F) 2 μM, (G–I) 5 μM, (J–L) 10 μM, and then incubated with 20 μM EDTA (M–O). Green channel (A,D,G,J,M) obtained from 380–470 nm, red channel (B,E,H,K,O) obtained from 470–650 nm, overlay channel (C,F,I,L,O) represented Fred/Fgreen; scale bars: 120 μm. Reproduced with permission from Ref. [71]. Copyright 2020, Elsevier.
4. Conclusions and Outlook
Since Zinquin was used for investigation of intracellular Zn2+ in 1993 [73], great efforts have been made to develop small-molecule fluorescent probes for the dynamic detection of intracellular Zn2+. Small-molecule probes are typically not suitable for the time-lapse monitoring of Zn2+ dynamics at the organelle level because they quickly diffuse in the cell and often leak from the cell to the medium [74]. To address this shortcoming, targeted small-molecule probes are designed by incorporation of the fluorophore with a targeting group, including triphenylphosphonium [75,76,77], glibenclamide [78,79], and morpholine [80,81]; the resulting probes can selectively localize to specific organelles such as the mitochondria, endoplasmic reticulum, and lysosome, respectively. Recently, naphthalimide-based probes have been reported to selectively localize to particular organelle membranes by adjusting their lipophilicity [82].
Although significant progress in small-molecule fluorescent probes for the detection of intracellular Zn2+ has been achieved, most probes are based on the PET mechanism or MLCT mechanism. It should be noticed that PET often exhibits incomplete fluorescence quenching that limits the performance of the probes. Additionally, metal ion binding typically induces a small spectral shift [83,84], which is not good for ratiometric detection since serious overlap between two emission wavelengths can lead to significant errors in results. Therefore, the development of probes with new mechanisms or integration of other mechanisms such as fluorescence resonance energy transfer (FRET) [85,86] and excited-state intramolecular proton transfer (ESIPT) [87,88] in the probe is desired [89,90,91,92,93], since both FRET-based probes and ESIPT-based probes can perform ratiometric detection with a large spectral shift in emission wavelength. For practical applications, several challenges remain. First, the quantitative analysis of Zn2+ in various organelles should be clarified. To achieve more accurate quantification of Zn2+ in organelles, the probes must fulfill several requirements, including pH insensitivity, good chemical stability, high Zn2+-binding affinity, and large dynamic range. Second, for in vivo detection and imaging, NIR or two-photon fluorescent probes have promising potential as a consequence of their low background fluorescent signal and deep penetration depth. Third, high selectivity and sensitivity, as well as fast response, are essential for detection and imaging since organelles exhibit different Zn2+ levels and dynamics. In addition, solubility, cell penetrability, and cytotoxicity are important parameters in practical applications, which must be considered in the design of probes.
Funding
This research received no external funding.
Data Availability Statement
Not applicable.
Acknowledgments
The author thanks the National Natural Science Foundation of China for the funding through project No. 21572241.
Conflicts of Interest
The author declares no conflicts of interest.
References
- Yamasaki, S.; Sakata-Sogawa, K.; Hasegawa, A.; Suzuki, T.; Kabu, K.; Sato, E.; Kurosaki, T.; Yamashita, S.; Tokunaga, M.; Nishida, K.; et al. Zinc is a novel intracellular second messenger. J. Cell Biol. 2007, 177, 637–645. [Google Scholar] [CrossRef] [PubMed]
- Haase, H.; Rink, L. Multiple impacts of zinc on immune function. Metallomics 2014, 6, 1175–1180. [Google Scholar] [CrossRef]
- Vallee, B.L.; Falchuk, K.H. The biochemical basis of zinc physiology. Physiol. Rev. 1993, 73, 79–118. [Google Scholar] [CrossRef] [PubMed]
- Maret, W. Zinc biochemistry: From a single zinc enzyme to a key element of life. Adv. Nutr. 2013, 4, 82–91. [Google Scholar] [CrossRef]
- Taylor, K.A.; Pugh, N. The contribution of zinc to platelet behaviour during haemostasis and thrombosis. Metallomics 2016, 8, 144–155. [Google Scholar] [CrossRef]
- Zaremba, A.; Helm, F.; Fricker, G. Impact of Zn2+ on ABC transporter function in intact isolated rat brain microvessels, human brain capillary endothelial cells, and in rat in vivo. Mol. Pharmaceutics 2019, 16, 305–317. [Google Scholar] [CrossRef] [PubMed]
- Taylor, K.M.; Hiscox, S.; Nicholson, R.I.; Hogstrand, C.; Kille, P. Protein kinase CK2 triggers cytosolic zinc signaling pathways by phosphorylation of zinc channel ZIP7. Sci. Signal. 2012, 5, ra11. [Google Scholar] [CrossRef]
- Wilson, M.; Hogstrand, C.; Maret, W. Picomolar concentrations of free zinc(II) ions regulate receptor protein-tyrosine phosphatase β activity. J. Biol. Chem. 2012, 287, 9322–9326. [Google Scholar] [CrossRef]
- Anson, K.J.; Corbet, G.A.; Palmer, A.E. Zn (2+) influx activates ERK and Akt signaling pathways. Proc. Natl. Acad. Sci. USA 2021, 118, e2015786118. [Google Scholar] [CrossRef]
- Andreini, C.; Banci, L.; Bertini, I.; Rosato, A. Counting the zinc-proteins encoded in the human genome. J. Proteome Res. 2006, 5, 196–201. [Google Scholar] [CrossRef]
- Sitsel, O.; Grønberg, C.; Elisabeth Autzen, H.; Wang, K.; Meloni, G.; Nissen, P.; Gourdon, P. Structure and function of Cu(I)- and Zn(II)-ATPases. Biochemistry 2015, 54, 5673–5683. [Google Scholar] [CrossRef]
- Que, E.L.; Duncan, F.E.; Bayer, A.R.; Philips, S.J.; Roth, E.W.; Bleher, R.; Gleber, S.C.; Vogt, S.; Woodruff, T.K.; O’Halloran, T.V. Zinc sparks induce physiochemical changes in the egg zona pellucida that prevent polyspermy. Integr. Biol. 2017, 9, 135–144. [Google Scholar] [CrossRef] [PubMed]
- Kim, A.M.; Bernhardt, M.L.; Kong, B.Y.; Ahn, R.W.; Vogt, S.; Woodruff, T.K.; O’Halloran, T.V. Zinc sparks are triggered by fertilization and facilitate cell cycle resumption in mammalian eggs. ACS Chem. Biol. 2011, 6, 716–723. [Google Scholar] [CrossRef] [PubMed]
- Liuzzi, J.P.; Guo, L.; Yoo, C.; Stewart, T.S. Zinc and autophagy. Biometals 2014, 27, 1087–1096. [Google Scholar] [CrossRef]
- Ding, B.; Zhong, Q. Zinc deficiency: An unexpected trigger for autophagy. J. Biol. Chem. 2017, 292, 8531–8532. [Google Scholar] [CrossRef]
- Lee, S.; Koh, J. Roles of zinc and metallothionein-3 in oxidative stress induced lysosomal dysfunction, cell death, and autophagy in neurons and astrocytes. Mol. Brain 2010, 3, 30. [Google Scholar] [CrossRef] [PubMed]
- Liuzzi, J.P.; Yoo, C. Role of zinc in the regulation of autophagy during ethanol exposure in human hepatoma cells. Biol. Trace Elem. Res. 2013, 156, 350–356. [Google Scholar] [CrossRef]
- Michielsen, C.M.S.; van Aalen, E.A.; Merkx, M. Ratiometric bioluminescent Zinc sensor proteins to quantify serum and intracellular free Zn2+. ACS Chem. Biol. 2022, 17, 1567–1576. [Google Scholar] [CrossRef] [PubMed]
- Que, E.L.; Bleher, R.; Duncan, F.E.; Kong, B.Y.; Gleber, S.C.; Vogt, S.; Chen, S.; Garwin, S.A.; Bayer, A.R.; Dravid, V.P.; et al. Quantitative mapping of zinc fluxes in the mammalian egg reveals the origin of fertilization-induced zinc sparks. Nat. Chem. 2015, 7, 130–139. [Google Scholar] [CrossRef]
- Vinkenborg, J.L.; Nicolson, T.J.; Bellomo, E.A.; Koay, M.S.; Rutter, G.A.; Merkx, M. Genetically encoded FRET sensors to monitor intracellular Zn2+ homeostasis. Nat. Methods 2009, 6, 737–740. [Google Scholar] [CrossRef]
- Qin, Y.; Dittmer, P.J.; Park, J.G.; Jansen, K.B.; Palmer, A.E. Measuring steady-state and dynamic endoplasmic reticulum and Golgi Zn2+ with genetically encoded sensors. Proc. Natl. Acad. Sci. USA 2011, 108, 7351–7356. [Google Scholar] [CrossRef]
- Chabosseau, P.; Tuncay, E.; Meur, G.; Bellomo, E.A.; Hessels, A.; Hughes, S.; Johnson, P.R.; Bugliani, M.; Marchetti, P.; Turan, B.; et al. Mitochondrial and ER-targeted eCALWY probes reveal high levels of free Zn2+. ACS Chem. Biol. 2014, 9, 2111–2120. [Google Scholar] [CrossRef]
- Sensi, S.L.; Paoletti, P.; Bush, A.I.; Sekler, I. Zinc in the physiology and pathology of the CNS. Nat. Rev. Neurosci. 2009, 10, 780–791. [Google Scholar] [CrossRef] [PubMed]
- Haase, H.; Rink, L. Functional significance of zinc-related signaling pathways in immune cells. Annu. Rev. Nutr. 2009, 29, 133–152. [Google Scholar] [CrossRef]
- Frederickson, C.J.; Koh, J.Y.; Bush, A.I. The eurobiology of zinc in health and disease. Nat. Rev. Neurosci. 2005, 6, 449–462. [Google Scholar] [CrossRef]
- Prasad, A.S. Discovery of human zinc deficiency: Impact on human health. Nutrition 2001, 17, 685–687. [Google Scholar] [CrossRef]
- Jiang, D.M.; Sullivan, P.G.; Sensi, S.L.; Steward, O.; Weiss, J.H. Zn2+ induces permeability transition pore opening and release of pro-apoptotic peptides from neuronal mitochondria. J. Biol. Chem. 2001, 276, 47524–47529. [Google Scholar] [CrossRef] [PubMed]
- Krężel, A.; Maret, W. The functions of metamorphic metallothioneins in zinc and copper metabolism. Int. J. Mol. Sci. 2017, 18, 1237. [Google Scholar] [CrossRef] [PubMed]
- Rakshit, A.; Holtzen, S.E.; Lo, M.N.; Conway, K.A.; Palmer, A.E. Human cells experience a Zn2+ pulse in early G1. Cell Rep. 2023, 42, 112656. [Google Scholar] [CrossRef]
- Levaot, N.; Hershfinkel, M. How cellular Zn2+ signaling drives physiological functions. Cell Calcium 2018, 75, 53–63. [Google Scholar] [CrossRef]
- Walkup, G.K.; Burdette, S.C.; Lippard, S.J.; Tsien, R.Y. A new cell-permeable fluorescent probe for Zn2+. J. Am. Chem. Soc. 2000, 122, 5644–5645. [Google Scholar] [CrossRef]
- Xue, L.; Li, G.; Zhu, D.; Liu, Q.; Jiang, H. Rational design of a ratiometric and targetable fluorescent probe for imaging lysosomal zinc ions. Inorg. Chem. 2012, 51, 10842–10849. [Google Scholar] [CrossRef] [PubMed]
- Smith, B.A.; Gammon, S.T.; Xiao, S.; Wang, W.; Chapman, S.; McDermott, R.; Suckow, M.A.; Johnson, J.R.; Piwnica-Worms, D.; Gokel, G.W.; et al. In vivo optical imaging of acute cell death using a near-infrared fluorescent zinc−dipicolylamine probe. Mol. Pharm. 2011, 8, 583–590. [Google Scholar] [CrossRef] [PubMed]
- Lu, Z.; Fan, W.; Lu, Y.; Fan, C.; Zhao, H.; Guo, K.; Chu, W.; Lu, Y. A highly sensitive fluorescent probe for bioimaging zinc ion in living cells and zedbrafish models. New J. Chem. 2018, 42, 12198–12204. [Google Scholar] [CrossRef]
- Yan, L.; Li, R.; Ma, F.; Qi, Z. A simple salicylaldehyde-based fluorescent “turn-on” probe for selective detection of Zn2+ in water solution and its application in live cell imaging. Anal. Methods 2017, 9, 1119–1124. [Google Scholar] [CrossRef]
- Yue, Y.; Dong, Q.; Zhang, Y.; Sun, Y.; Gong, Y. A highly selective “turn-on” fluorescent chemosensor based on 8-aminoquinoline for detection of Zn2+. Anal. Methods 2015, 7, 5661–5666. [Google Scholar] [CrossRef]
- Chen, Z.; Ai, H.-W. Single fluorescent protein-based indicators for zinc ion (Zn2+). Anal. Chem. 2016, 88, 9029–9036. [Google Scholar] [CrossRef] [PubMed]
- Qin, Y.; Sammond, D.W.; Braselmann, E.; Carpenter, M.C.; Palmer, A.E. Development of an optical Zn2+ probe based on a single fluorescent protein. ACS Chem. Biol. 2016, 11, 2744–2751. [Google Scholar] [CrossRef] [PubMed]
- Dischler, A.M.; Maslar, D.; Zhang, C.; Qin, Y. Development and characterization of a red fluorescent protein-based sensor RZnP1 for the detection of cytosolic Zn2+. ACS Sens. 2022, 7, 3838–3845. [Google Scholar] [CrossRef] [PubMed]
- Hessels, A.M.; Merkx, M. Genetically-encoded FRET-based sensors for monitoring Zn2+ in living cells. Metallomics 2015, 7, 258–266. [Google Scholar] [CrossRef]
- Wang, M.; Da, Y.; Tian, Y. Fluorescent proteins and genetically encoded biosensors. Chem. Soc. Rev. 2023, 52, 1189–1214. [Google Scholar] [CrossRef] [PubMed]
- Burdette, S.C.; Walkup, G.K.; Spingler, B.; Tsien, R.Y.; Lippard, S.J. Fluorescent sensors for Zn2+ based on a fluorescein platform: Synthesis, properties and intracellular distribution. J. Am. Chem. Soc. 2001, 123, 7831–7841. [Google Scholar] [CrossRef] [PubMed]
- Yang, X.-B.; Yang, B.-X.; Ge, J.-F.; Xu, Y.-J.; Xu, Q.-F.; Liang, J.; Lu, J.-M. Benzo[a]phenoxazinium-based red-emitting chemosensor for zinc ions in biological media. Org. Lett. 2011, 13, 2710–2713. [Google Scholar] [CrossRef]
- Hirano, T.; Kikuchi, K.; Urano, Y.; Nagano, T. Improvement and biological applications of fluorescent probes for zinc ZnAFs. J. Am. Chem. Soc. 2002, 124, 6555–6562. [Google Scholar] [CrossRef] [PubMed]
- Mizukami, S.; Okada, S.; Kimura, S.; Kikuchi, K. Design and synthesis of coumarin-based Zn2+ probes for ratiometric fluorescence imaging. Inorg. Chem. 2009, 48, 7630–7638. [Google Scholar] [CrossRef]
- Maruyama, S.; Kikuchi, K.; Hirano, T.; Urano, Y.; Nagano, T. A novel, cell-permeable, fluorescent probe for ratiometric imaging of zinc ion. J. Am. Chem. Soc. 2002, 124, 10650–10651. [Google Scholar] [CrossRef]
- Taki, M.; Wolford, J.L.; O'Halloran, T.V. Emission ratiometric imaging of intracellular zinc: Design of a benzoxazole fluorescent sensor and its application in two-photon microscopy. J. Am. Chem. Soc. 2004, 126, 712–713. [Google Scholar] [CrossRef] [PubMed]
- Feng, J.; Li, J.-Z.; Mao, X.-M.; Wang, Q.; Li, S.-P.; Wang, C.-Y. Real-time detection and imaging of exogenous and endogenous Zn2+ in the PC12 cell model of depression with a NIR fluorescent probe. Analyst 2021, 146, 3971–3976. [Google Scholar] [CrossRef]
- Salvamoser, J.D.; Avemary, J.; Luna-Munguia, H.; Pascher, B.; Getzinger, T.; Pieper, T.; Kudernatsch, M.; Kluger, G.; Potschka, H. Glutamate-mediated down-regulation of the multidrug-resistance protein BCRP/ABCG2 in porcine and human brain capillaries. Mol. Pharm. 2015, 12, 2049–2060. [Google Scholar] [CrossRef]
- Zhu, H.; Fan, J.L.; Zhang, S.L.; Cao, J.F.; Song, K.D.; Ge, D.; Dong, H.J.; Wang, J.Y.; Peng, X.J. Ratiometric fluorescence imaging of lysosomal Zn2+ release under oxidative stress in neural stem cells. Biomater. Sci. 2014, 2, 89–97. [Google Scholar] [CrossRef]
- Yoshida, H. ER stress and diseases. FEBS J. 2007, 274, 630–658. [Google Scholar] [CrossRef]
- Mori, K. Tripartite management of unfolded proteins in the endoplasmic reticulum. Cell 2000, 101, 451–454. [Google Scholar] [CrossRef] [PubMed]
- Ozcan, L.; Tabas, I. Role of endoplasmic reticulum stress in metabolic disease and other disorders. Annu. Rev. Med. 2012, 63, 317–328. [Google Scholar] [CrossRef] [PubMed]
- Hetz, C.; Saxena, S. ER stress and the unfolded protein response in neurodegeneration. Nat. Rev. Neurol. 2017, 13, 477–491. [Google Scholar] [CrossRef]
- Garg, A.D.; Kaczmarek, A.; Krysko, O.; Vandenabeele, P.; Krysko, D.V.; Agostinis, P. ER stress-induced inflammation: Does it aid or impede disease progression? Trends Mol. Med. 2012, 18, 589–598. [Google Scholar] [CrossRef]
- Fang, L.; Trigiante, G.; Crespo-Otero, R.; Hawes, C.S.; Philpott, M.P.; Jones, C.R.; Watkinson, M. Endoplasmic reticulum targeting fluorescent probes to image mobile Zn2+. Chem. Sci. 2019, 10, 10881–10887. [Google Scholar] [CrossRef]
- Du, C.; Fu, S.; Wang, X.; Sedgwick, A.C.; Zhen, W.; Li, M.; Li, X.; Zhou, J.; Wang, Z.; Wang, H.; et al. Diketopyrrolopyrrole-based fluorescence probes for the imaging of lysosomal Zn2+ and identification of prostate cancer in human tissue. Chem. Sci. 2019, 10, 5699–5704. [Google Scholar] [CrossRef]
- Kowada, T.; Watanabe, T.; Amagai, Y.; Liu, R.; Yamada, M.; Takahashi, H.; Matsui, T.; Inaba, K.; Mizukami, S. Quantitative imaging of labile Zn2+ in the Golgi apparatus using a localizable small-molecule fluorescent probe. Cell Chem. Biol. 2020, 27, 1521–1531. [Google Scholar] [CrossRef] [PubMed]
- Los, G.V.; Encell, L.P.; McDougall, M.G.; Hartzell, D.D.; Karassina, N.; Zimprich, C.; Wood, M.G.; Learish, R.; Friedman Ohana, R.; Urh, M.; et al. HaloTag: A novel protein labeling technology for cell imaging and protein analysis. ACS Chem. Biol. 2008, 3, 373–382. [Google Scholar] [CrossRef]
- Macias-Contreras, M.; He, H.; Zhu, L. Beyond O6-benzylguanine: O6-(5-pyridylmethyl)guanine as a substrate for the self-labeling enzyme SNAPtag. Bioconjug. Chem. 2018, 29, 4104–4109. [Google Scholar] [CrossRef]
- Matsui, Y.; Funato, Y.; Imamura, H.; Miki, H.; Mizukami, S.; Kikuchi, K. Visualization of long-term Mg2+ dynamics in apoptotic cells using a novel targetable fluorescent probe. Chem. Sci. 2017, 8, 8255–8264. [Google Scholar] [CrossRef] [PubMed]
- Hirata, T.; Terai, T.; Yamamura, H.; Shimonishi, M.; Komatsu, T.; Hanaoka, K.; Ueno, T.; Imaizumi, Y.; Nagano, T.; Urano, Y. Protein-coupled fluorescent probe to visualize potassium ion transition on cellular membranes. Anal. Chem. 2016, 88, 2693–2700. [Google Scholar] [CrossRef] [PubMed]
- Liu, R.; Kowada, T.; Du, Y.; Amagai, Y.; Matsui, T.; Inaba, Y.; Mizukami, S. Organelle-level labile Zn2+ mapping based on targetable fluorescent sensors. ACS Sens. 2022, 7, 748–757. [Google Scholar] [CrossRef] [PubMed]
- Lovell, T.C.; Bolton, S.G.; Kenison, J.P.; Shangguan, J.; Otteson, C.E.; Civitci, F.; Nan, X.; Pluth, M.D.; Jasti, R. Subcellular targeted nanohoop for one- and two-photon live cell imaging. ACS Nano 2021, 15, 15285–15293. [Google Scholar] [CrossRef] [PubMed]
- Zou, Y.; Li, M.; Xing, Y.; Duan, T.; Zhou, X.; Yu, F. Bioimaging of glutathione with a two-photon fluorescent probe and its potential application for surgery guide in laryngeal cancer. ACS Sens. 2020, 5, 242–249. [Google Scholar] [CrossRef] [PubMed]
- Wu, L.; Liu, J.; Li, P.; Tang, B.; James, T.D. Two-photon small-molecule fluorescence-based agents for sensing, imaging, and therapy within biological systems. Chem. Soc. Rev. 2021, 50, 702–734. [Google Scholar] [CrossRef] [PubMed]
- Kim, H.M.; Cho, B.R. Small-molecule two-photon probes for bioimaging applications. Chem. Rev. 2015, 115, 5014–5055. [Google Scholar] [CrossRef] [PubMed]
- Juvekar, V.; Lee, H.W.; Lee, D.J.; Kim, H.M. Two-photon fluorescent probes for quantitative bio-imaging analysis in live tissues. TrAC Trends Anal. Chem. 2022, 157, 116787. [Google Scholar] [CrossRef]
- Bourassa, D.; Elitt, C.M.; McCallum, A.M.; Sumalekshmy, S.; McRae, R.L.; Thomas Morgan, M.; Siegel, N.; Perry, J.W.; Rosenberg, P.A.; Fahrni, C.J. Chromis-1, a ratiometric fluorescent probe optimized for two-photon microscopy reveals dynamic changes in labile Zn(II) in differentiating oligodendrocytes. ACS Sens. 2018, 3, 458–467. [Google Scholar] [CrossRef]
- Aizenman, E.; Stout, A.E.; Hartnett, K.A.; Dineley, K.E.; McLaughlin, B.; Reynolds, I.J. Induction of neuronal apoptosis by thiol oxidation: Putative role of intracellular zinc release. J. Neurochem. 2000, 75, 1878–1888. [Google Scholar] [CrossRef]
- Li, W.; Liu, Z.; Fang, B.; Jin, M.; Tian, Y. Two-photon fluorescent Zn2+ probe for ratiometric imaging and biosensing of Zn2+ in living cells and larval zebrafish. Biosens. Bioelectron. 2020, 148, 111666. [Google Scholar] [CrossRef] [PubMed]
- Fox, S.; Wilkinson, T.S.; Wheatley, P.S.; Xiao, B.; Morris, R.E.; Sutherland, A.; Simpson, A.J.; Barlow, P.E.; Butler, A.R.; Megson, I.L.; et al. NO-loaded Zn2+-exchanged zeolite materials, A potential bifunctional anti-bacterial strategy. Acta Biomater. 2010, 6, 1515–1521. [Google Scholar] [CrossRef] [PubMed]
- Zalewski, P.D.; Forbes, I.J.; Betts, W.H. Correlation of apoptosis with change in intracellular labile Zn(II) using zinquin [(2-methyl-8-p-toluenesulphonamido-6-quinolyloxy) acetic acid], a new specific fluorescent probe for Zn(II). Biochem. J. 1993, 296, 403–408. [Google Scholar] [CrossRef] [PubMed]
- Hessels, A.M.; Taylor, K.M.; Merkx, M. Monitoring cytosolic and ER Zn2+ in stimulated breast cancer cells using genetically encoded FRET sensors. Metallomics 2016, 8, 211–217. [Google Scholar] [CrossRef] [PubMed]
- Masanta, G.; Lim, C.S.; Kim, H.J.; Han, J.H.; Kim, H.M.; Cho, B.R. A mitochondrial-targeted two-photon probe for zinc ion. J. Am. Chem. Soc. 2011, 133, 5698–5700. [Google Scholar] [CrossRef] [PubMed]
- Guo, Z.; Liu, Z.; He, W.; Zhang, C.; Chen, Y. An excitation ratiometric Zn2+ sensor with mitochondria-targetability for monitoring of mitochondrial Zn2+ release upon different stimulations. Chem. Commun. 2012, 48, 8365–8367. [Google Scholar]
- Xue, L.; Li, G.; Yu, C.; Jiang, H. A ratiometric and targetable fluorescent sensor for quantification of mitochondrial zinc ions. Chem. Eur. J. 2012, 18, 1050–1054. [Google Scholar] [CrossRef] [PubMed]
- Tian, X.; Liu, T.; Zhu, M.; Peng, J.; Cui, J.; Feng, L.; Huo, X.; Yuan, J.; Ma, X. Endoplasmic reticulum-targeting near-infrared fluorescent probe for CYP2J2 activity and its imaging application in endoplasmic reticulum stress and tumor. Anal. Chem. 2022, 94, 9572–9577. [Google Scholar] [CrossRef]
- Phaniraj, S.; Gao, Z.; Rane, D.; Peterson, B.R. Hydrophobic resorufamine derivatives: Potent and selective red fluorescent probes of the endoplasmic reticulum of mammalian cells. Dyes Pigm. 2016, 135, 127–133. [Google Scholar] [CrossRef] [PubMed]
- Wang, Y.; Li, J.; Feng, L.; Yu, J.; Zhang, Y.; Ye, D.; Chen, H.-Y. Lysosome-targeting fluorogenic probe for cathepsin B imaging in living cells. Anal. Chem. 2016, 88, 12403–12410. [Google Scholar] [CrossRef]
- Lee, H.J.; Cho, C.W.; Seo, H.; Singha, S.; Jun, Y.W.; Lee, K.H.; Jung, Y.; Kim, K.T.; Park, S.; Bae, S.C.; et al. A two-photon fluorescent probe for lysosomal zinc ions. Chem. Commun. 2016, 52, 124–127. [Google Scholar] [CrossRef] [PubMed]
- Fang, H.; Geng, S.; Hao, M.; Chen, Q.; Liu, M.; Liu, C.; Tian, Z.; Wang, C.; Takebe, T.; Guan, J.L.; et al. Simultaneous Zn2+ tracking in multiple organelles using super-resolution morphology-correlated organelle identification in living cells. Nat. Commun. 2021, 12, 109. [Google Scholar] [CrossRef] [PubMed]
- Carter, K.P.; Young, A.M.; Palmer, A.E. Fluorescent sensors for measuring metal ions in living systems. Chem. Rev. 2014, 114, 4564–4601. [Google Scholar] [CrossRef] [PubMed]
- Kiyose, K.; Kojima, H.; Urano, Y.; Nagano, T. Development of a ratiometric fluorescent zinc ion probe in near-infrared region, based on tricarbocyanine chromophore. J. Am. Chem. Soc. 2006, 128, 6548–6549. [Google Scholar] [CrossRef] [PubMed]
- Takakusa, H.; Kikuchi, K.; Urano, Y.; Sakamoto, S.; Yamaguchi, K.; Nagano, T. Design and synthesis of an enzyme-cleavable sensor molecule for phosphodiesterase activity based on fluorescence resonance energy transfer. J. Am. Chem. Soc. 2002, 124, 1653–1657. [Google Scholar] [CrossRef]
- Han, Z.-X.; Zhang, X.-B.; Li, Z.; Gong, Y.-J.; Wu, X.-Y.; Jin, Z.; He, C.-M.; Jian, L.-X.; Zhang, J.; Shen, G.-L.; et al. Efficient fluorescence resonance energy transfer-based ratiometric fluorescent cellular imaging probe for Zn2+ using a rhodamine spirolactam as a trigger. Anal. Chem. 2010, 82, 3108–3113. [Google Scholar] [CrossRef] [PubMed]
- Wang, Z.; Yan, M.; Yu, M.; Zhang, G.; Fang, W.; Yu, F. A fluorescent probe with zwitterionic ESIPT feature for ratiometric monitoring of peroxynitrite in vitro and in vivo. Anal. Chem. 2024, 96, 3600–3608. [Google Scholar] [CrossRef] [PubMed]
- Sedgwick, A.C.; Wu, L.; Han, H.-H.; Bull, S.D.; He, X.-P.; James, T.D.; Sessler, J.L.; Tang, B.Z.; Tian, H.; Yoon, J. Excited-state intramolecular proton-transfer (ESIPT) based fluorescence sensors and imaging agents. Chem. Soc. Rev. 2018, 47, 8842–8880. [Google Scholar] [CrossRef] [PubMed]
- Wang, D.; Li, S.-J.; Cao, W.; Wang, Z.; Ma, Y. ESIPT-active 8-hydroxyquinoline-based fluorescence sensor for Zn(II) detection and aggregation-induced emission of the Zn(II) complex. ACS Omega 2022, 7, 18017–18026. [Google Scholar] [CrossRef]
- Sinha, S.; Gaur, P.; Mukherjee, T.; Mukhopadhyay, S.; Ghosh, S. Exploring 1,4-dihydroxyanthraquinone as long-range emissive ratiometric fluorescent probe for signaling Zn2+/PO43−: Ensemble utilization for live cell imaging. J. Photochem. Photobiol. B 2015, 148, 181–187. [Google Scholar] [CrossRef]
- Wu, X.; Shi, W.; Yang, Y.; Zhao, D.; Li, Y. Multi-targeted fluorescent probes for detection of Zn(II) and Cu(II) ions based on ESIPT mechanism. Spectrochim. Acta A 2023, 87, 122051. [Google Scholar] [CrossRef]
- Wang, J.; Li, Y.; Pang, Y. A step toward an NIR-emitting ESIPT probe for smart Zn2+ sensing in different environments. Chem. Biomed. Imaging 2023, 1, 537–540. [Google Scholar] [CrossRef]
- Fu, P.-Y.; Yi, S.-Z.; Pan, M.; Su, C.-Y. Excited-state intramolecular proton transfer (ESIPT) based metal–organic supramolecular optical materials: Energy transfer mechanism and luminescence regulation strategy. Acc. Mater. Res. 2023, 4, 939–952. [Google Scholar] [CrossRef]
Disclaimer/Publisher’s Note: The statements, opinions and data contained in all publications are solely those of the individual author(s) and contributor(s) and not of MDPI and/or the editor(s). MDPI and/or the editor(s) disclaim responsibility for any injury to people or property resulting from any ideas, methods, instructions or products referred to in the content. |
© 2024 by the author. Licensee MDPI, Basel, Switzerland. This article is an open access article distributed under the terms and conditions of the Creative Commons Attribution (CC BY) license (https://creativecommons.org/licenses/by/4.0/).