
Fast Field-Cycling Nuclear Magnetic Resonance Relaxometry of Perfluorosulfonic Acid Ionomers and Their Perfluorosulfonyl Fluoride Precursors Membranes

Abstract
:1. Introduction
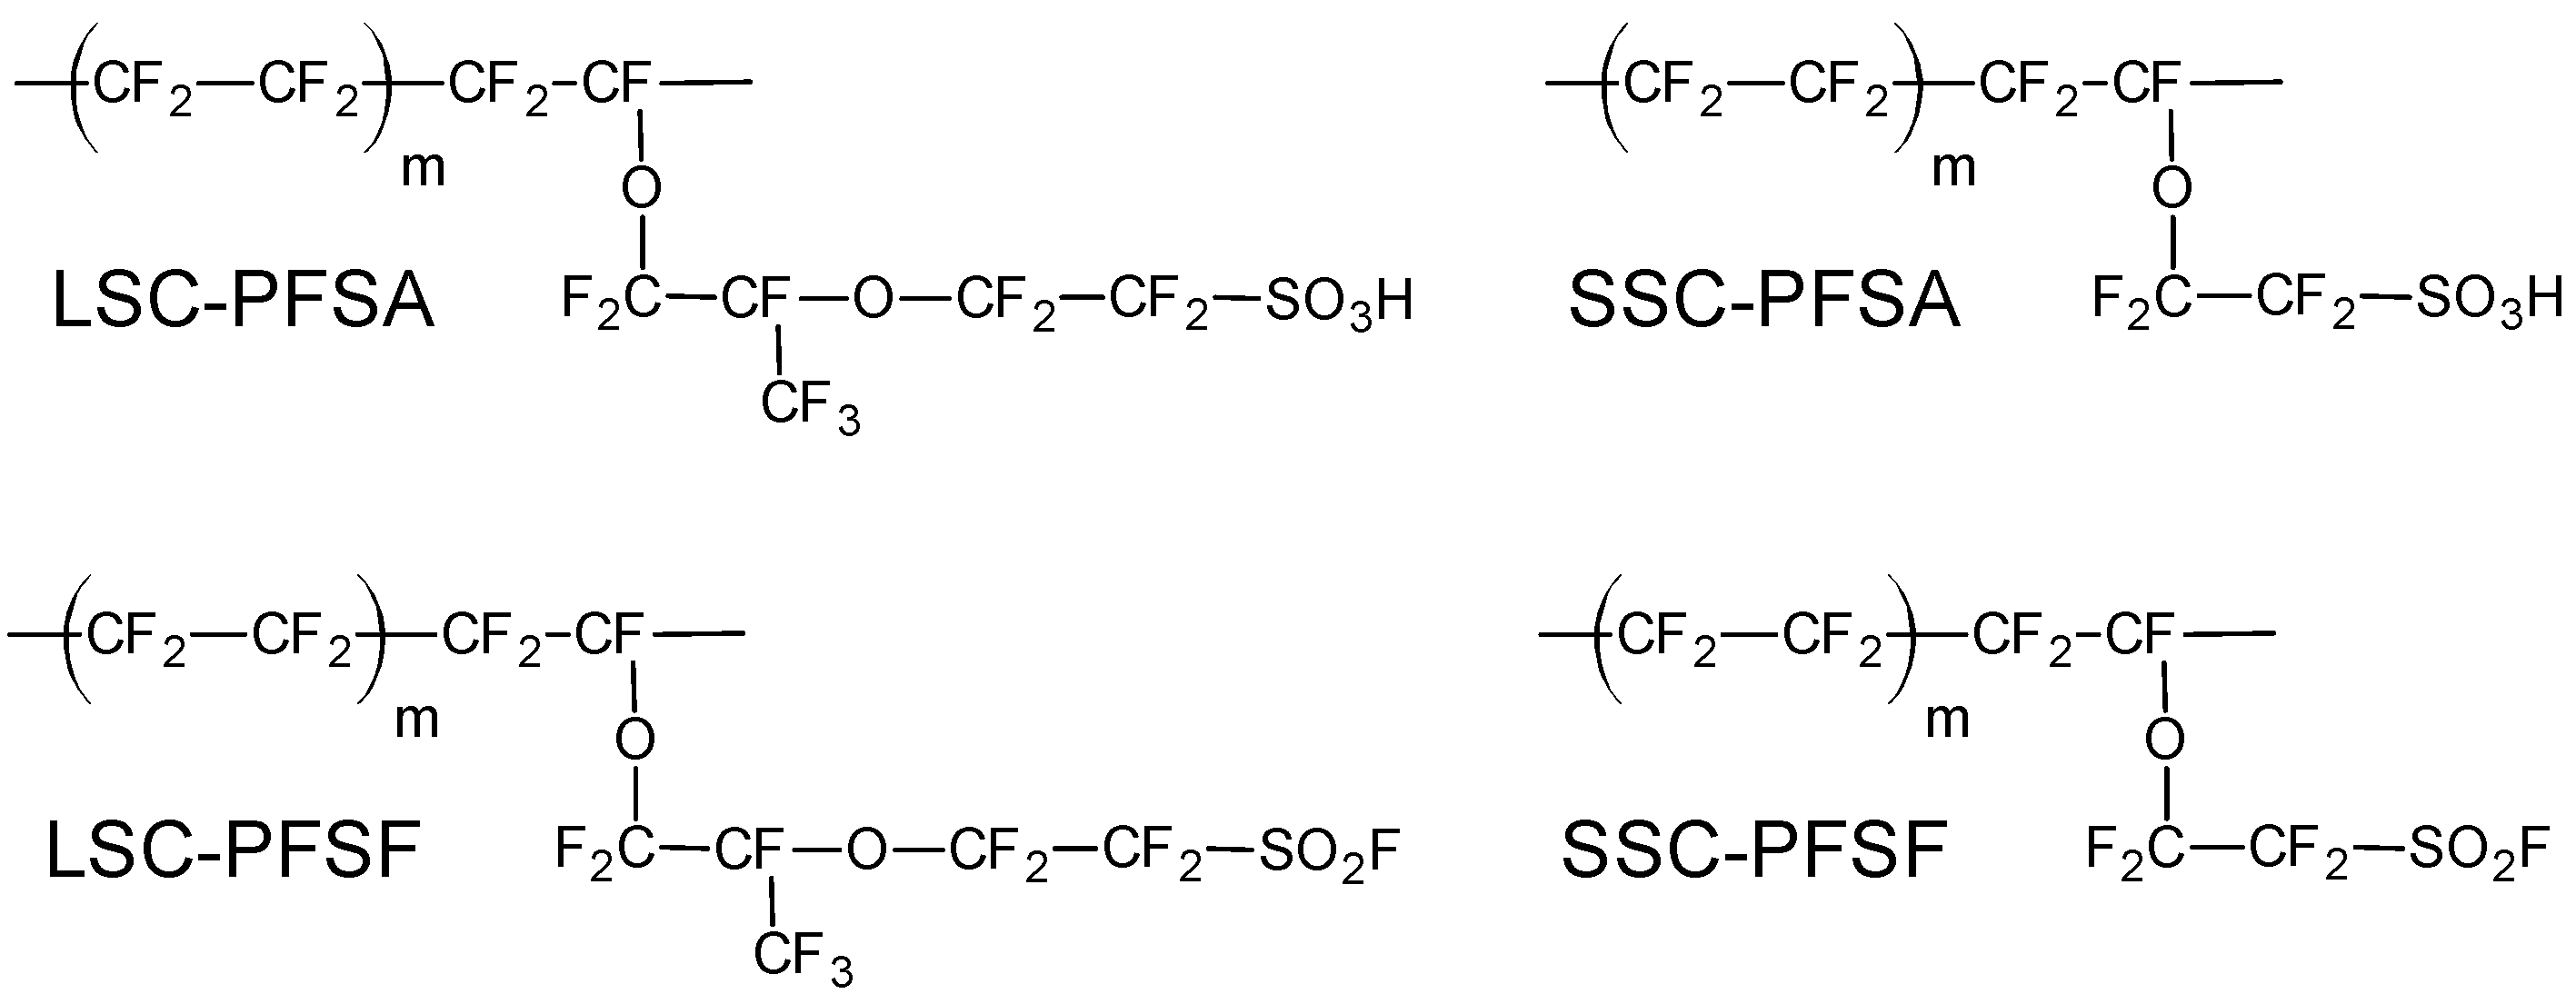
2. Materials and Methods
3. Results
3.1. XRD
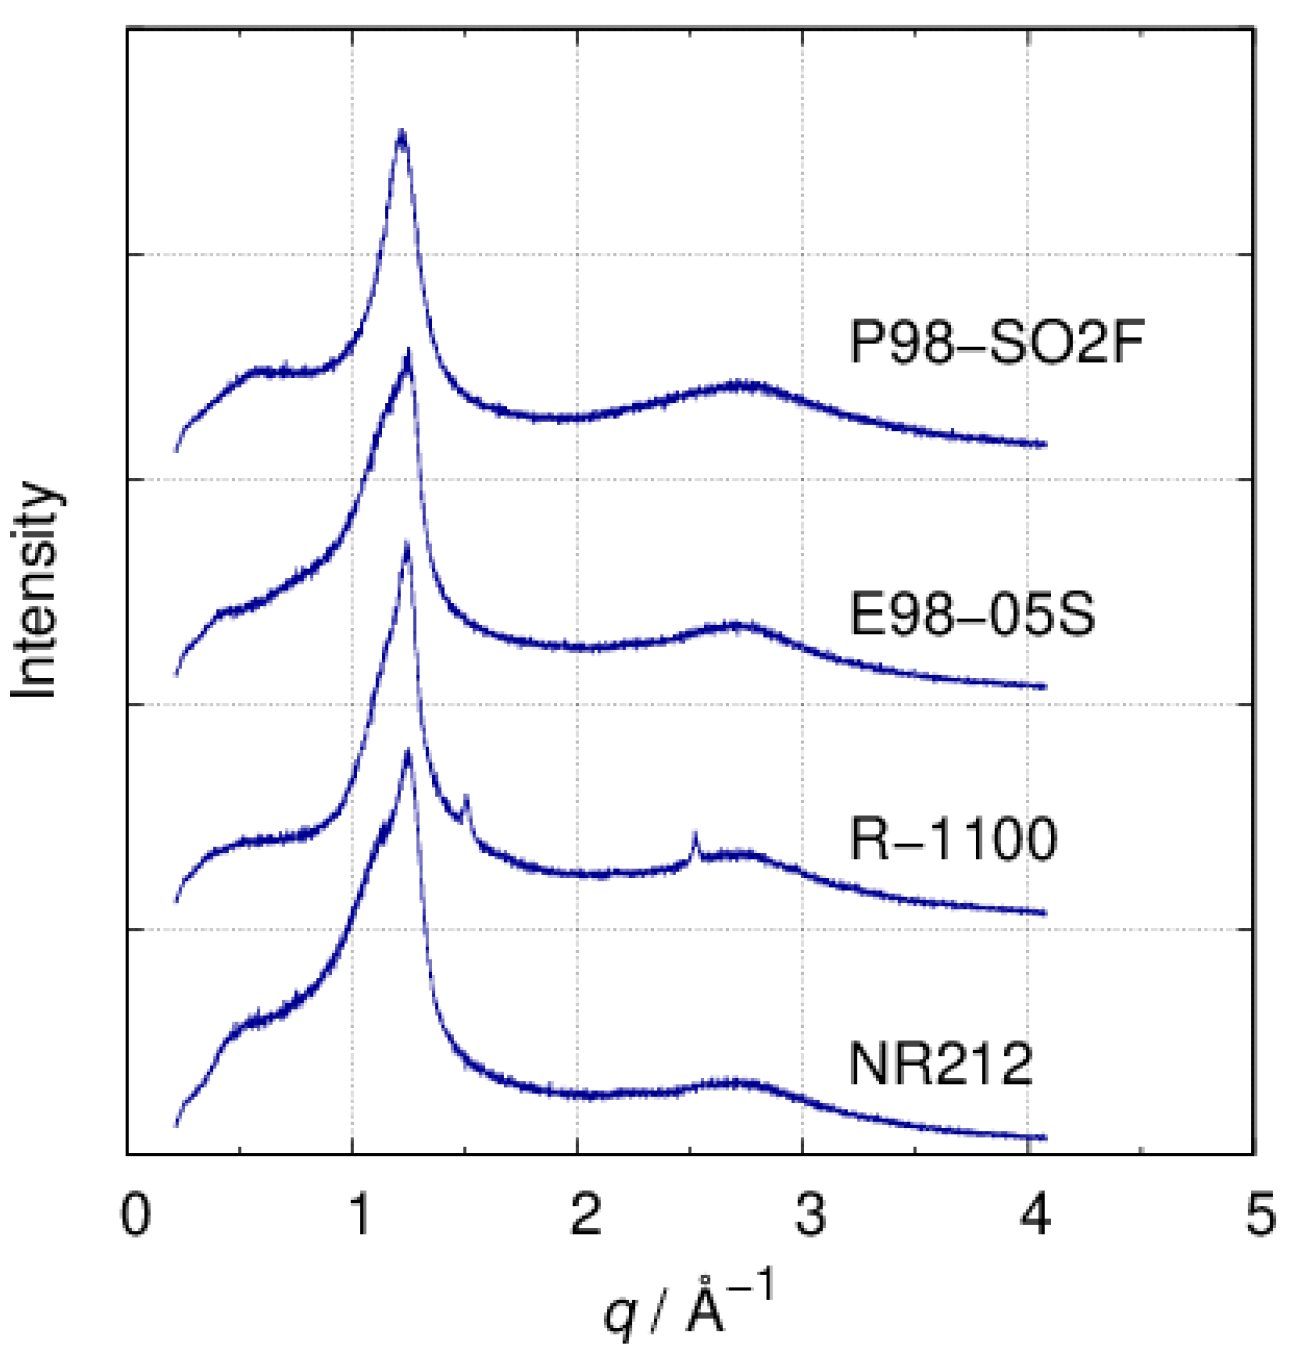
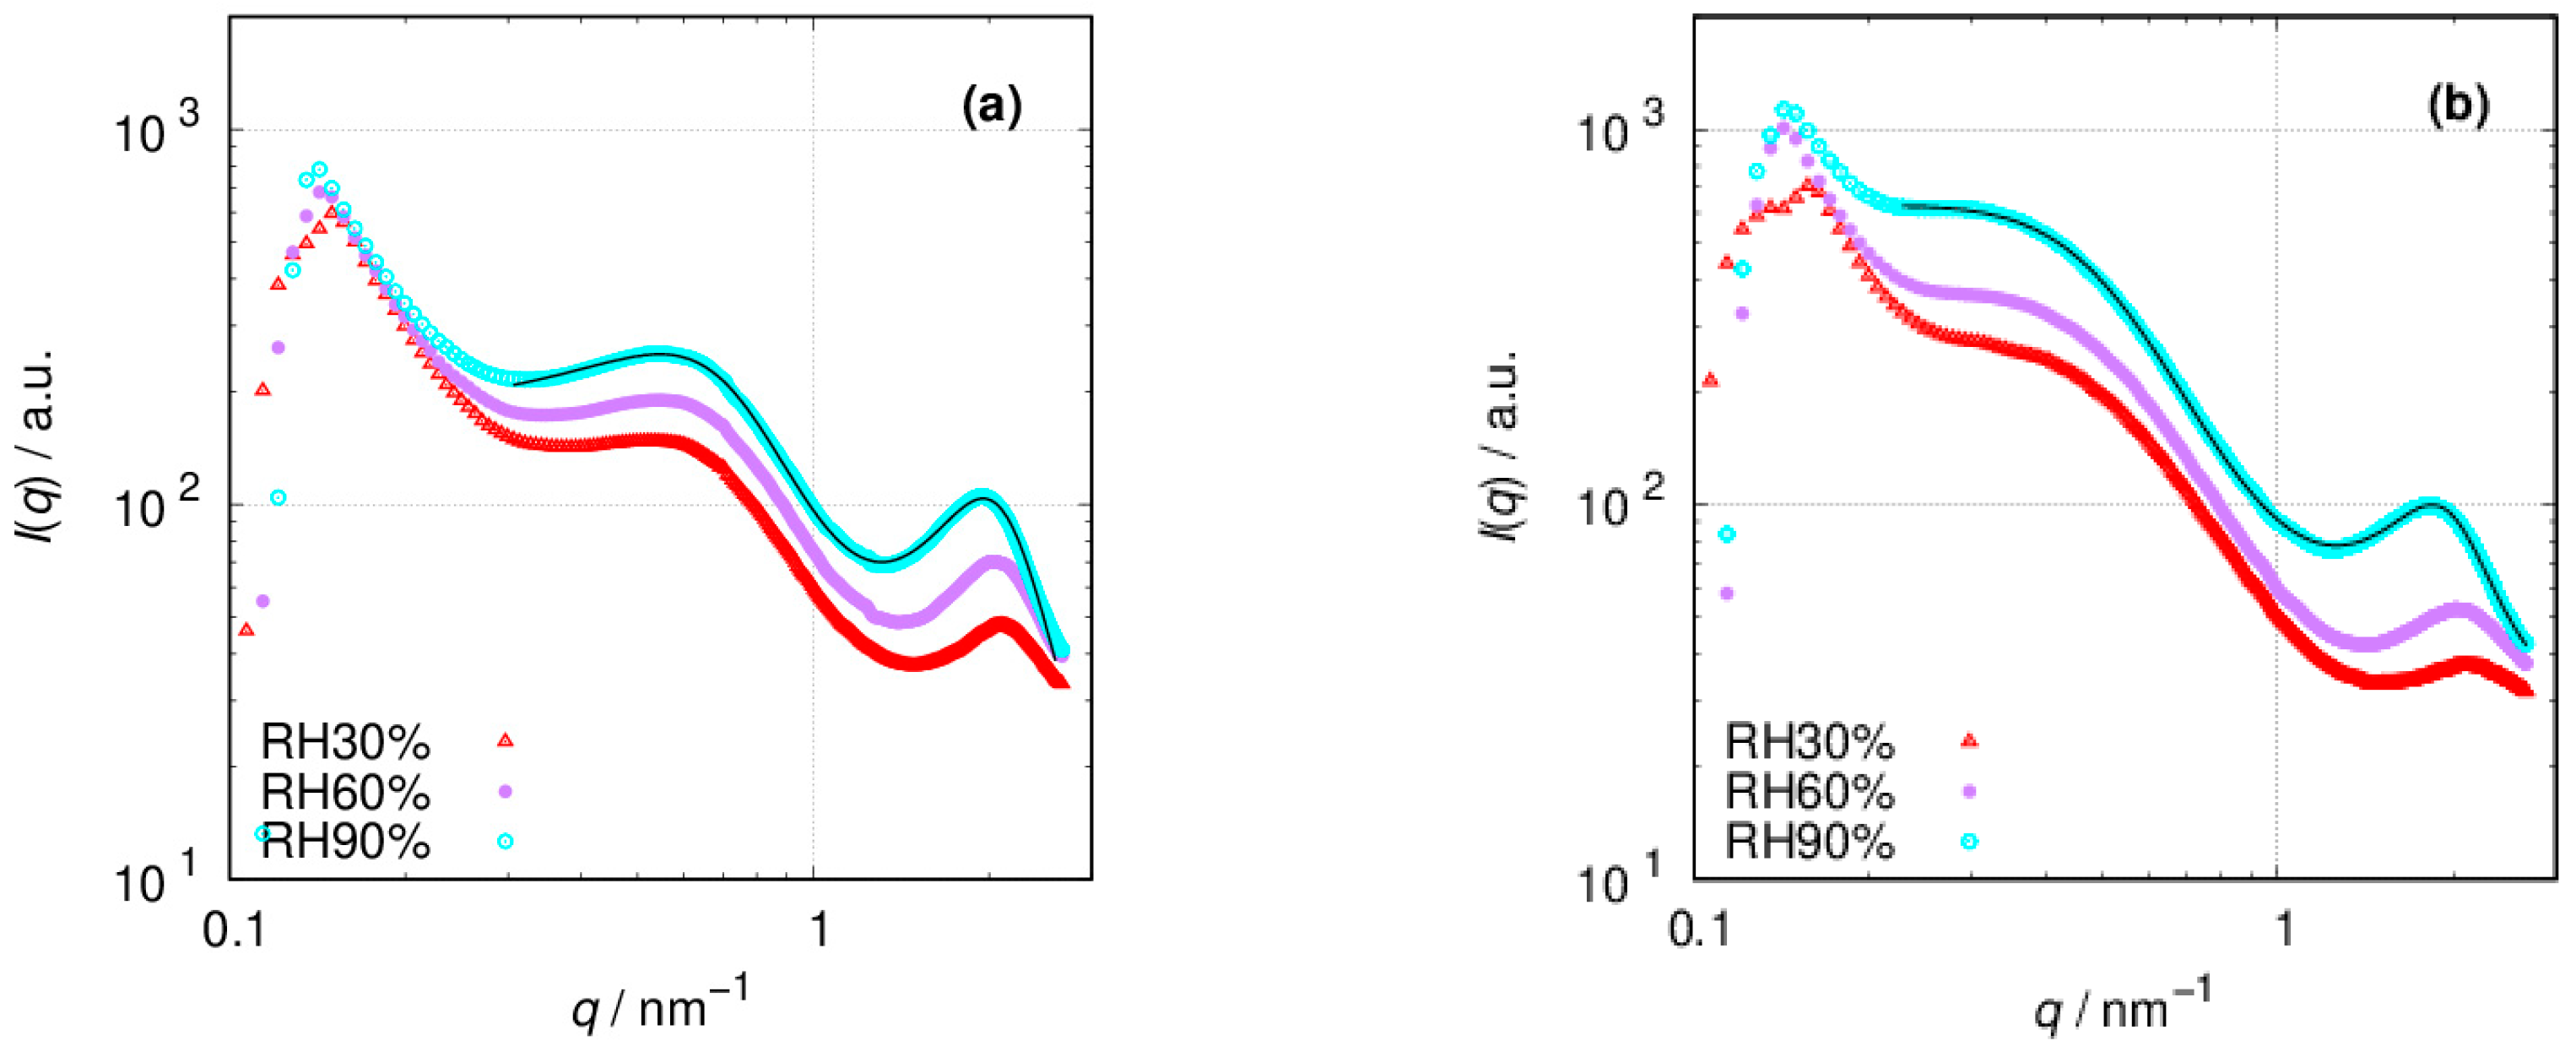
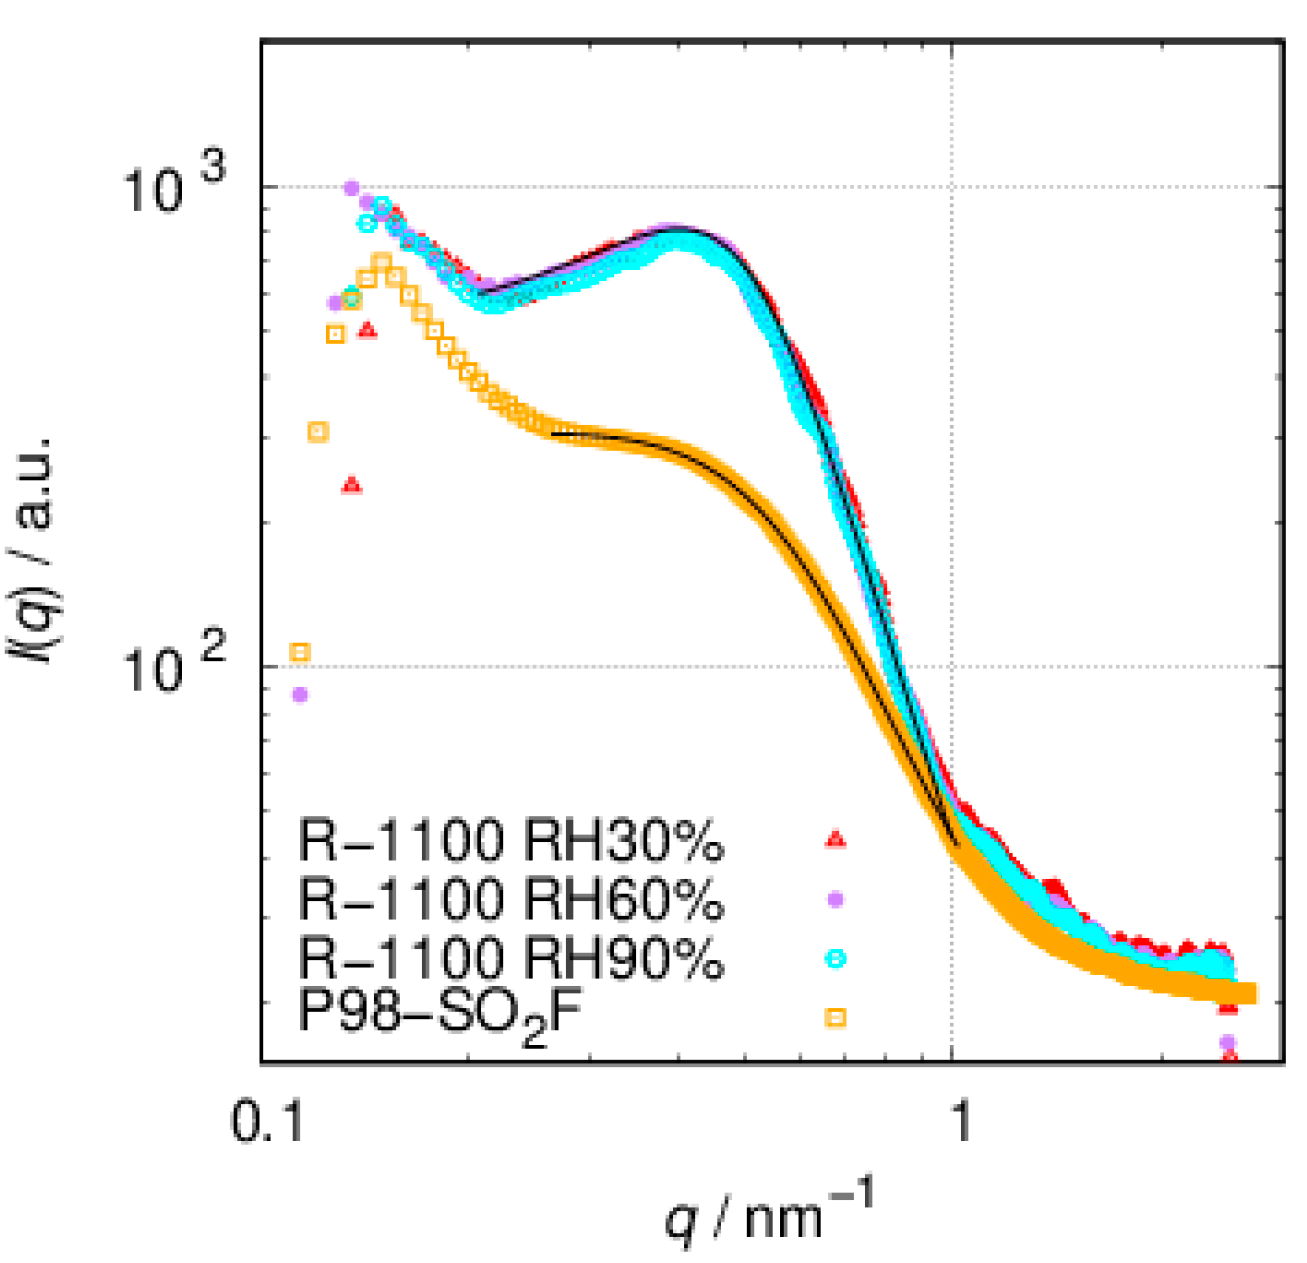
3.2. SAXS
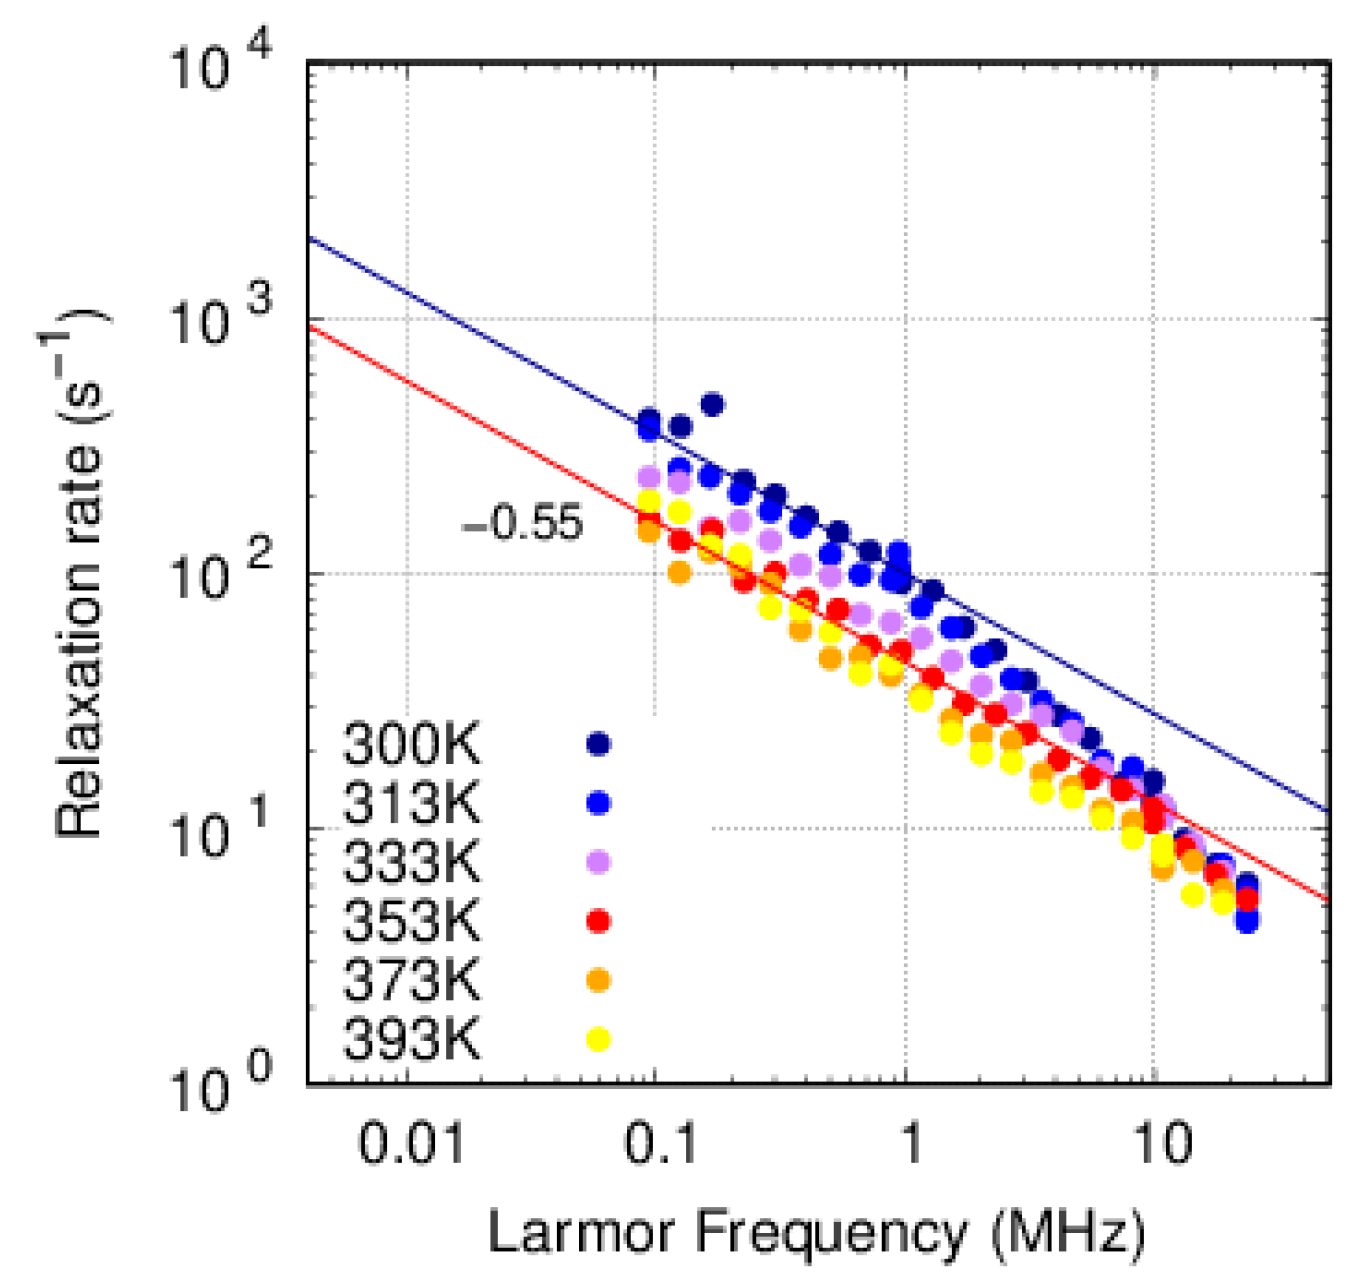
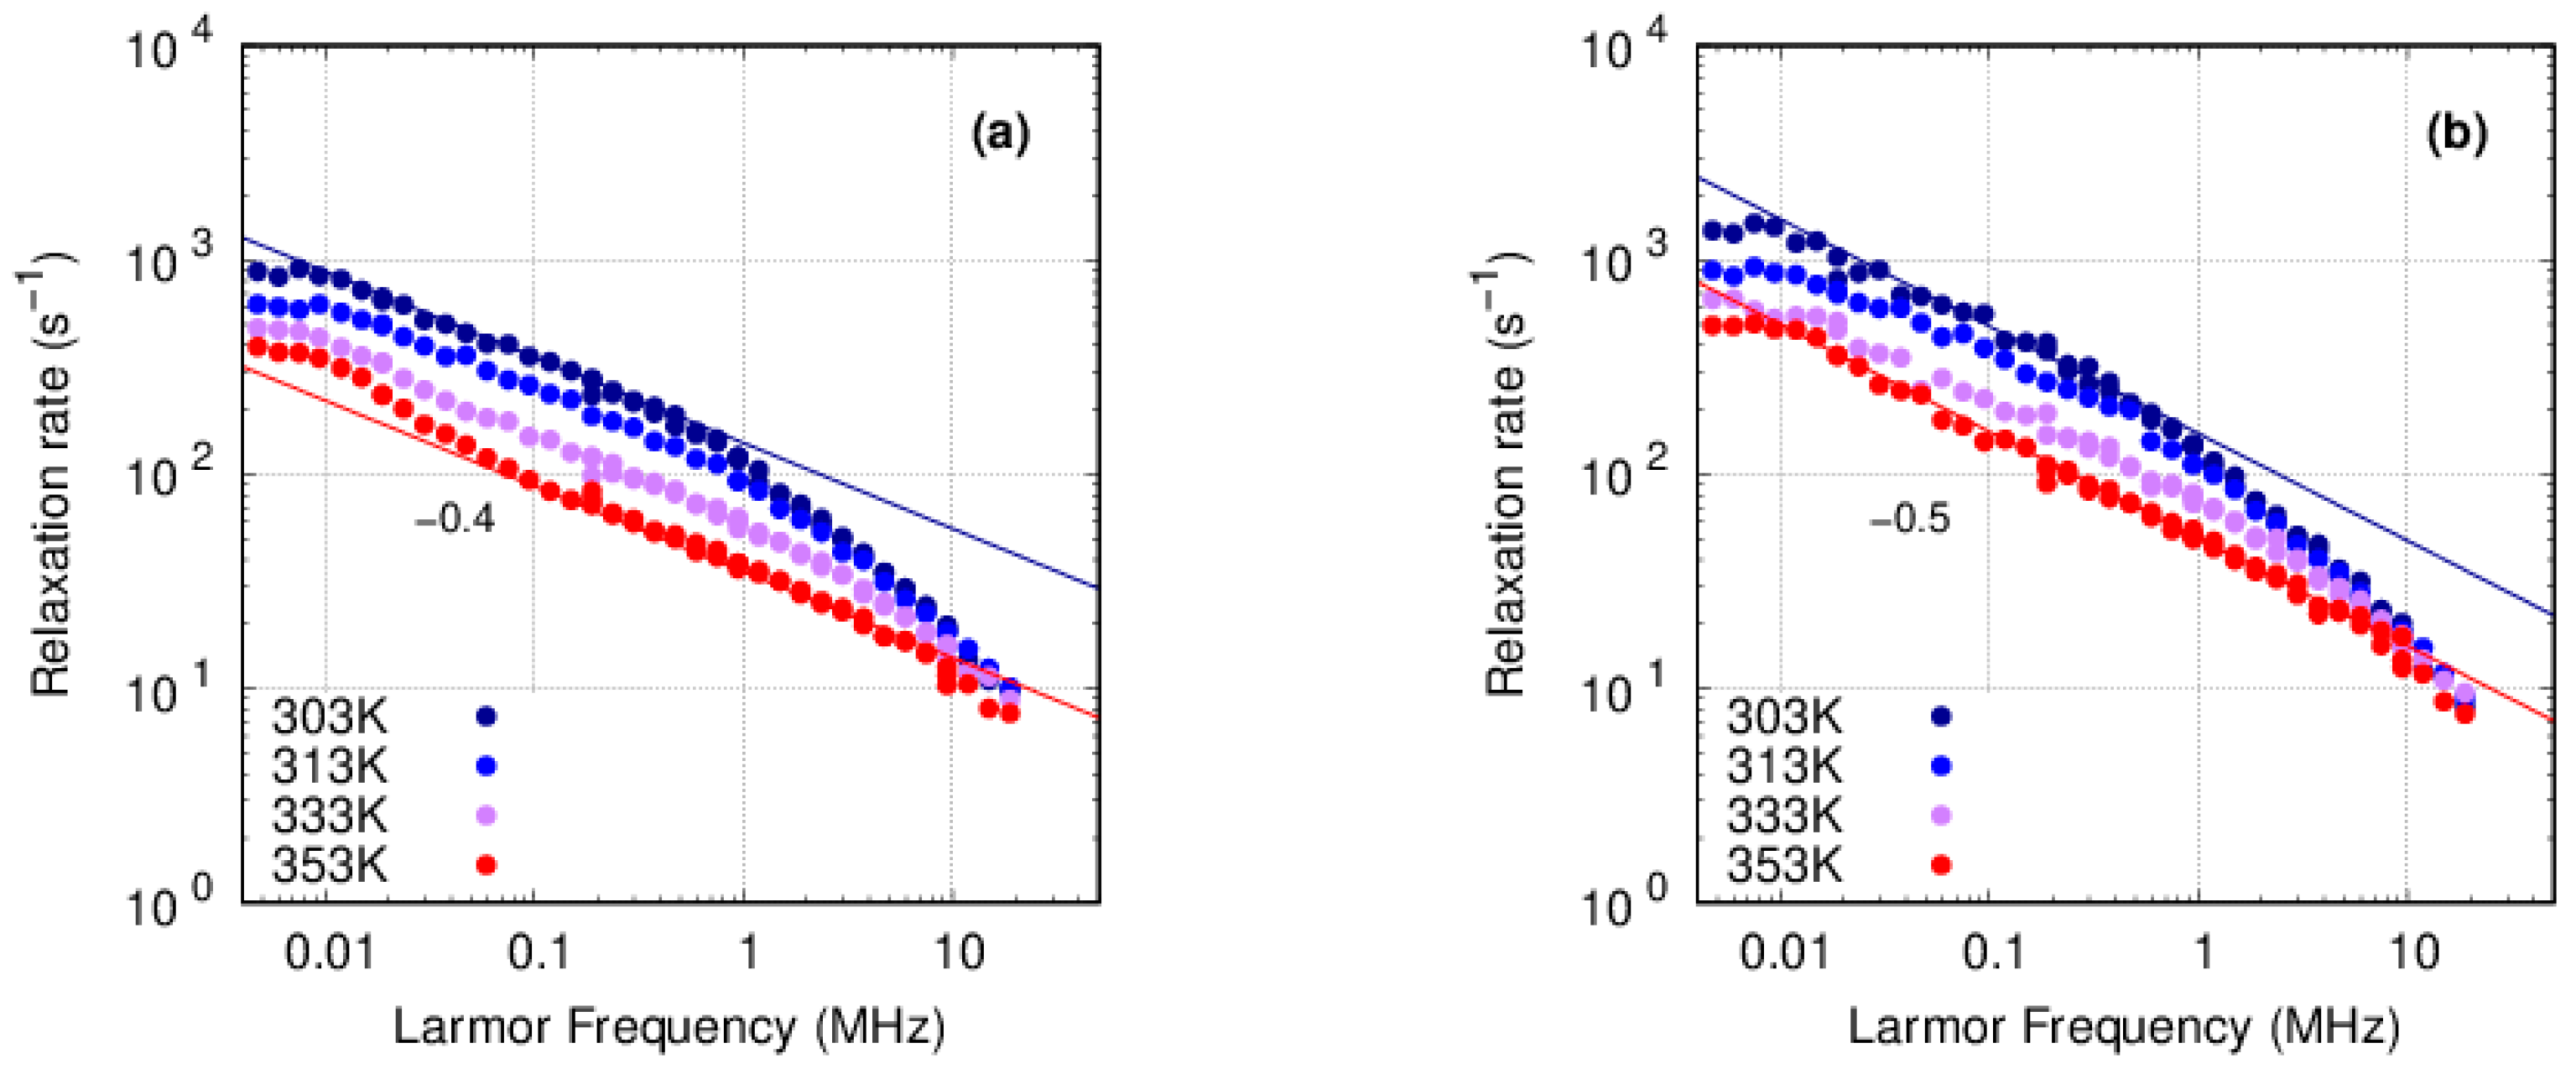
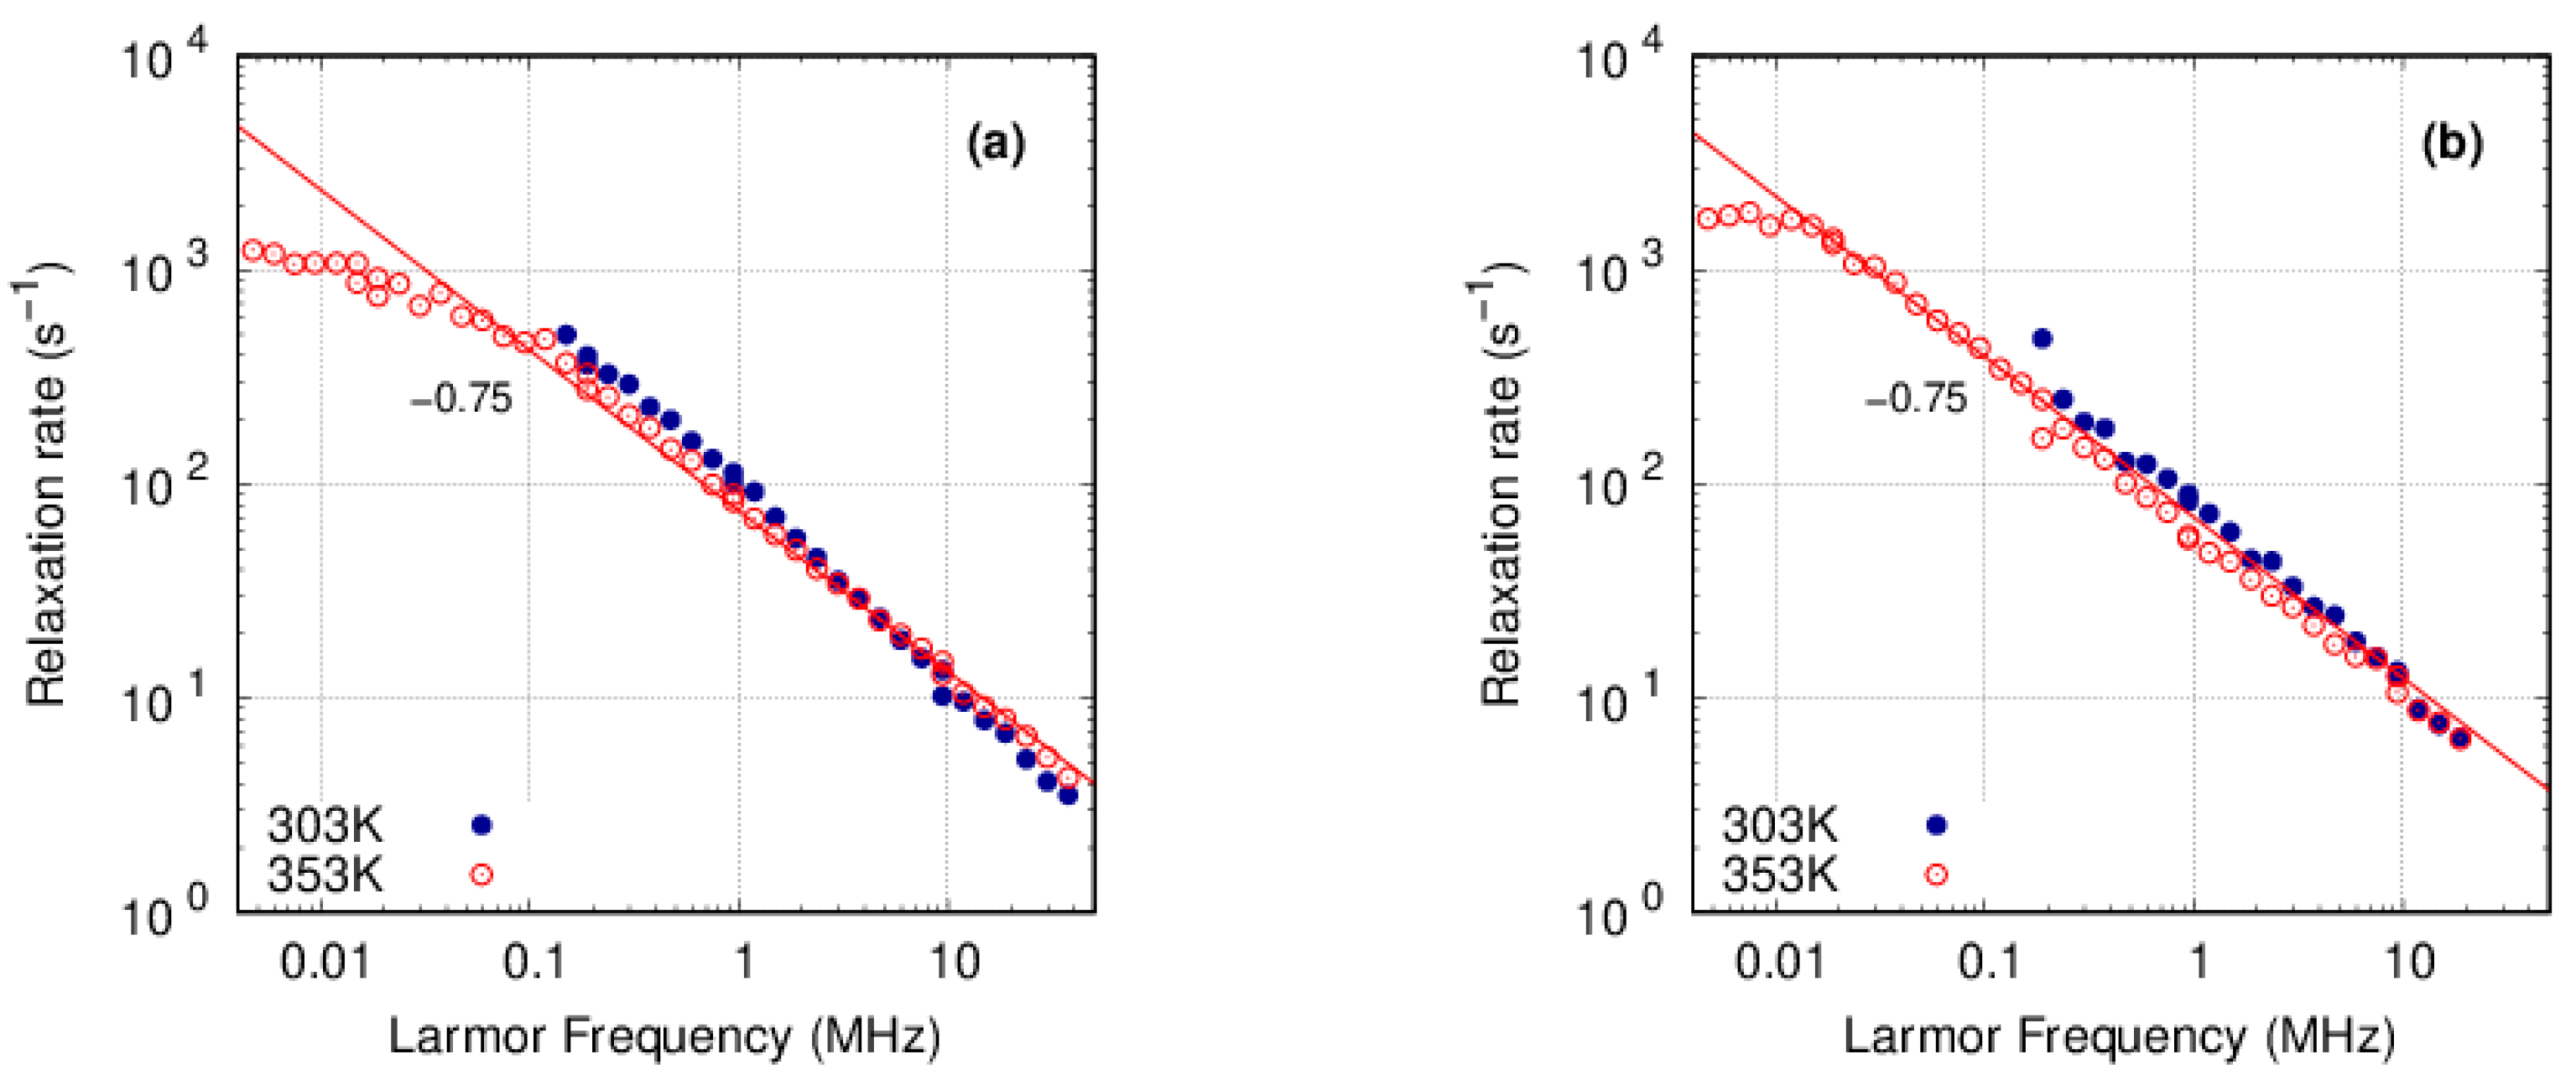
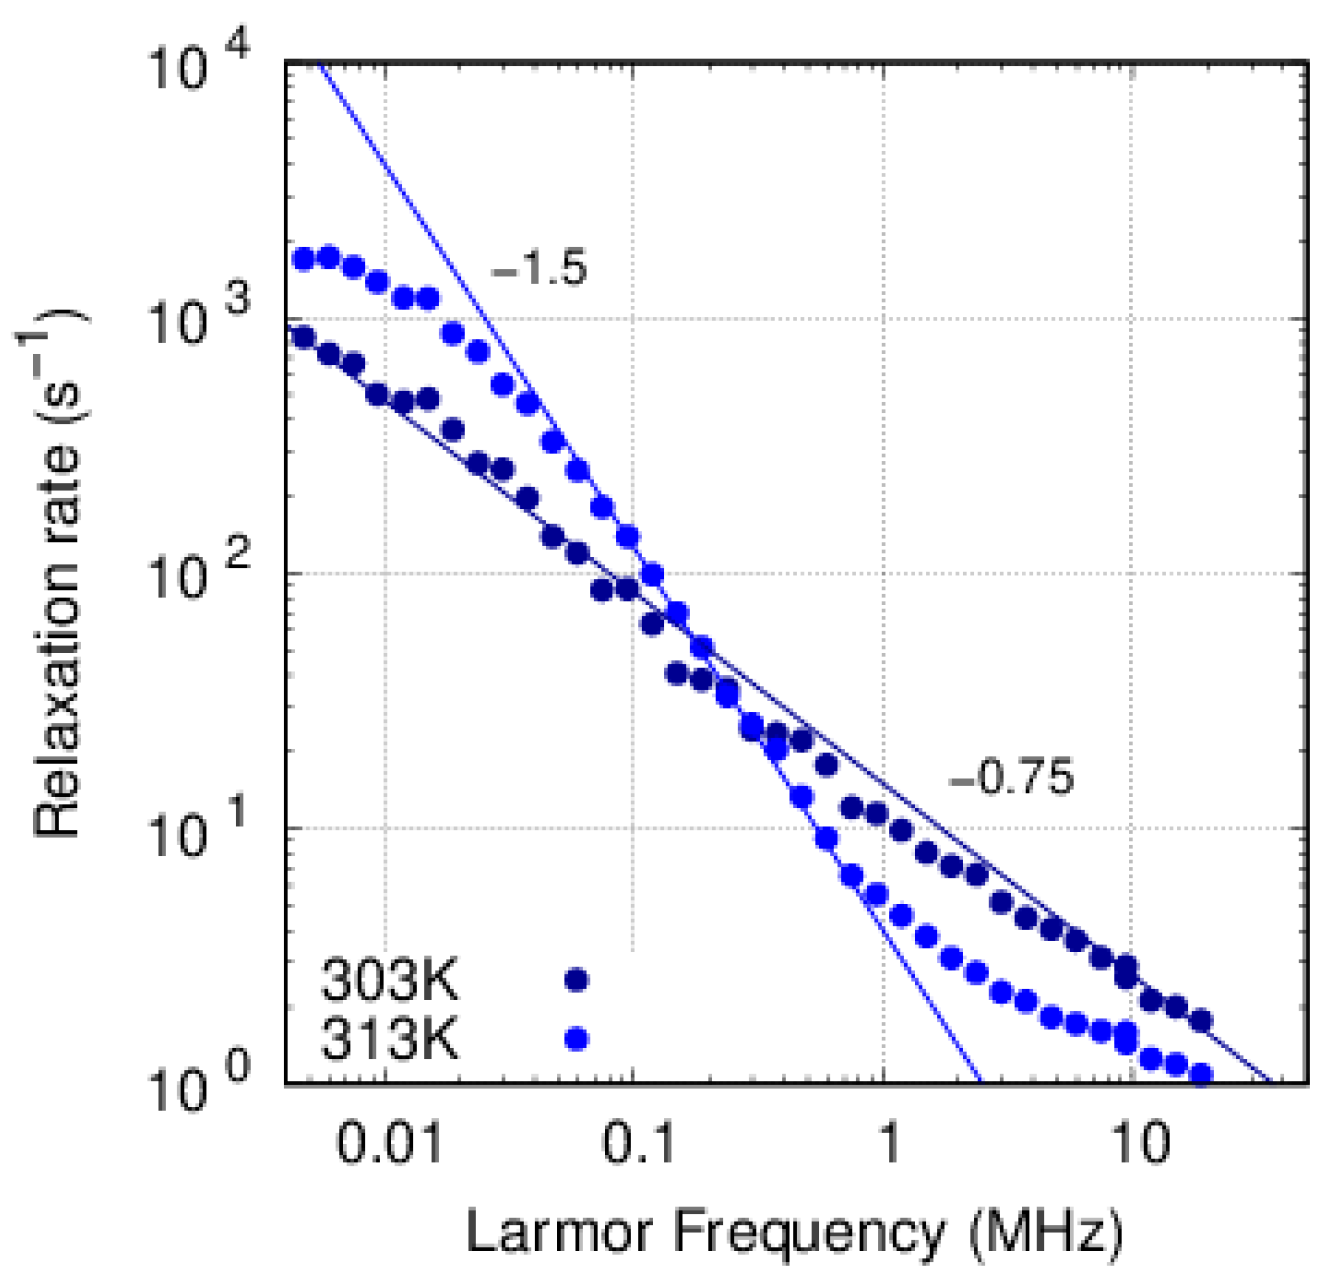
3.3. FFC-NMR
3.3.1. PFSA
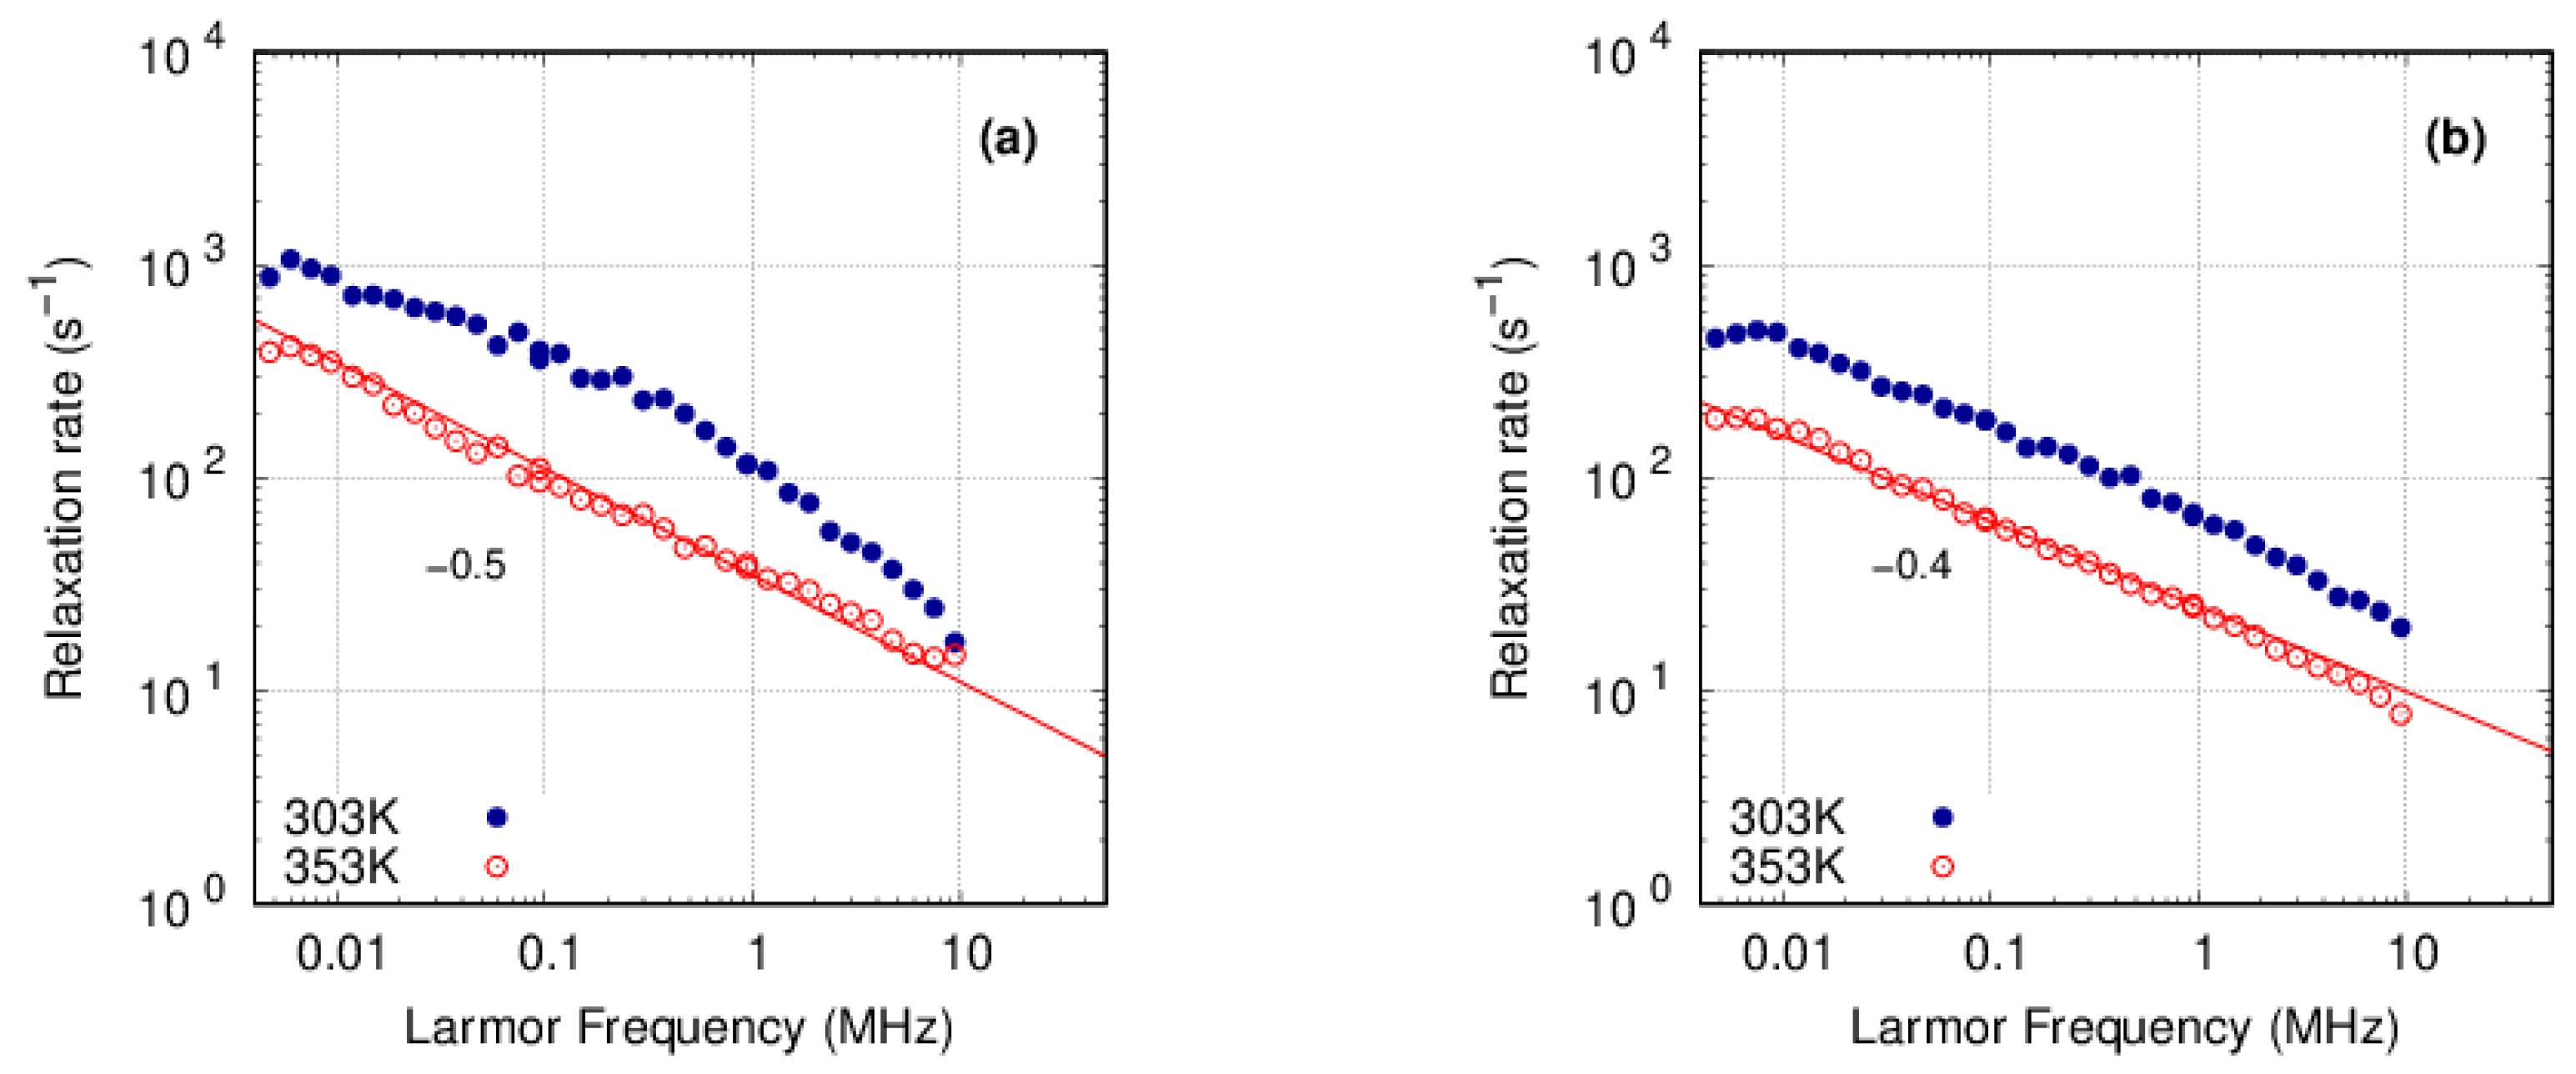
3.3.2. PFSF
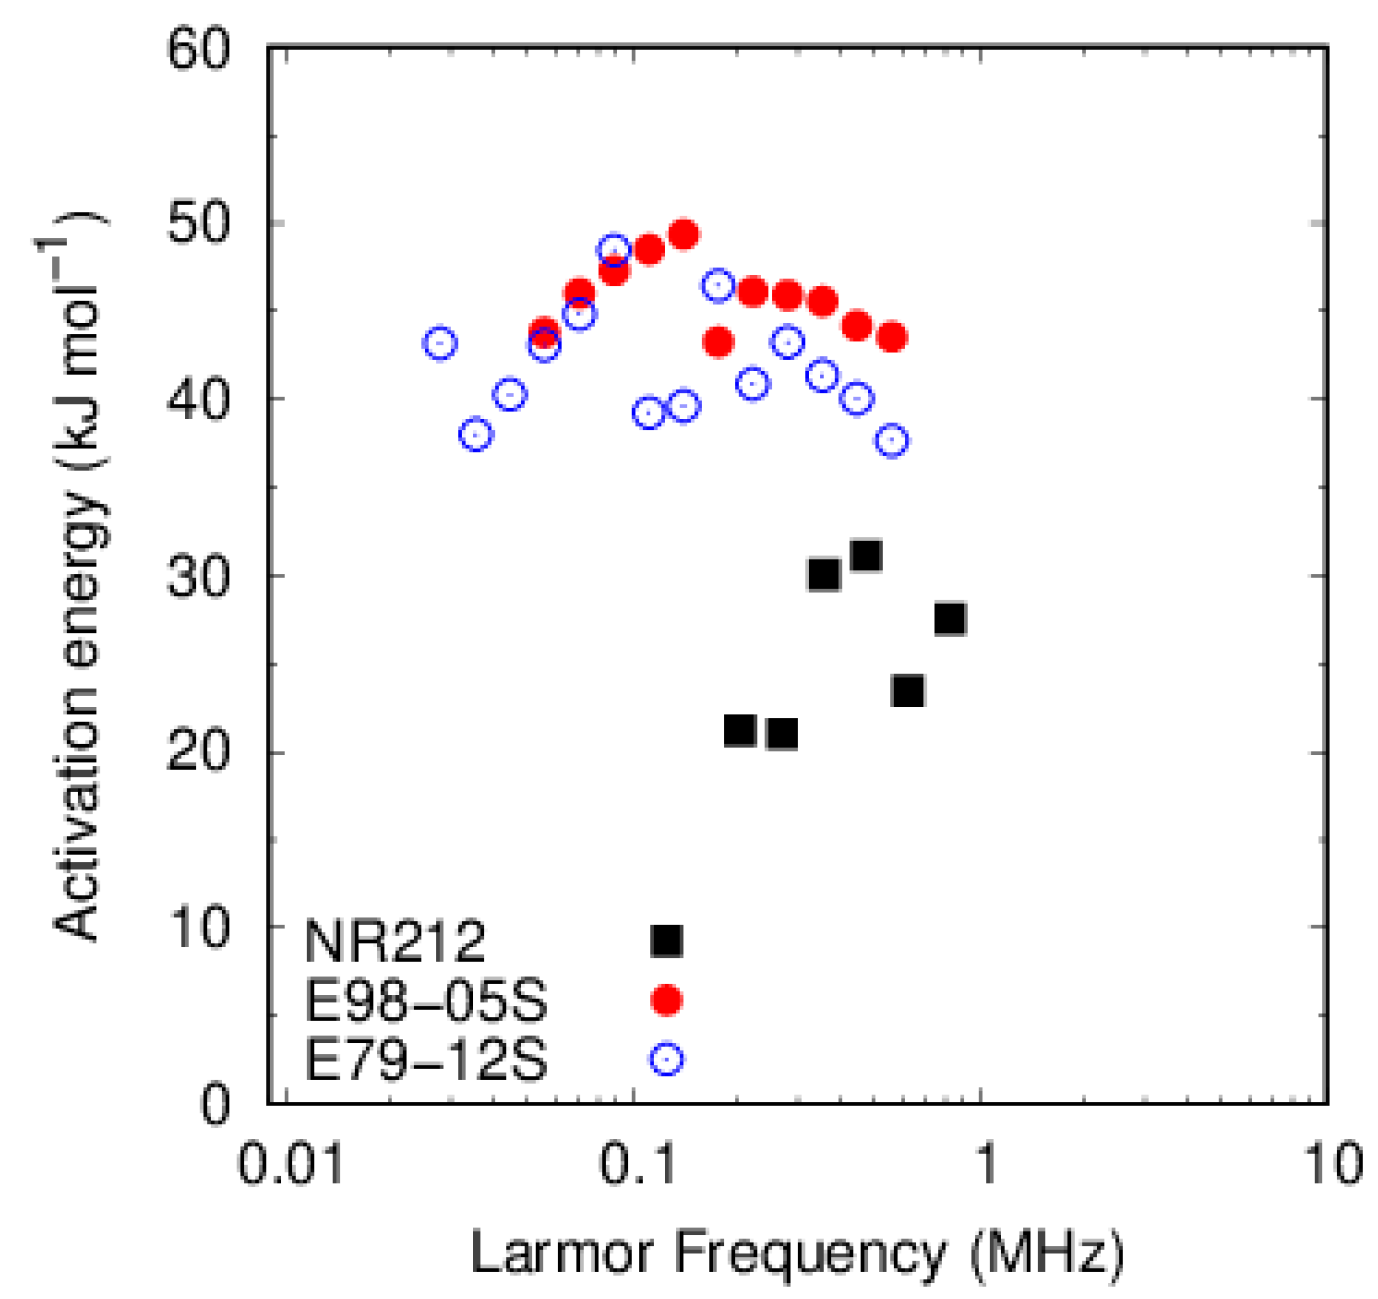
4. Discussion
5. Conclusions
Supplementary Materials
Author Contributions
Funding
Institutional Review Board Statement
Informed Consent Statement
Data Availability Statement
Acknowledgments
Conflicts of Interest
References
- Kusoglu, A.; Weber, A.Z. New Insights into Perfluorinated Sulfonic-Acid Ionomers. Chem. Rev. 2017, 117, 987–1104. [Google Scholar] [CrossRef] [PubMed]
- Lingwood, M.D.; Zhang, Z.; Kidd, B.E.; McCreary, K.B.; Hou, J.; Madsen, L.A. Unraveling the local energetics of transport in a polymer ion conductor. Chem. Commun. 2013, 49, 4283–4285. [Google Scholar] [CrossRef] [PubMed]
- Boyle, N.G.; McBrierty, V.G.; Eisenberg, A. NMR Investigation of Molecular Motion in Nafion Membranes. Macromolecules 1983, 16, 80–84. [Google Scholar] [CrossRef]
- Page, K.A.; Cable, K.M.; Moore, R.B. Molecular Origin of the Thermal Transitions and Dynamic Mechanical Relaxations in Perfluorosulfonate Ionomers. Macromolecules 2005, 38, 6472–6484. [Google Scholar] [CrossRef]
- Page, K.A.; Jarrett, W.; Moore, R.B. Variable Temperature 19F Solid-State NMR Study of the Effect of Electrostatic Interactions on Thermally-Stimulated Molecular Motions in Perfluorosulfonate Ionomers. J. Polym. Sci. Part B Polym. Phys. 2007, 45, 2177–2186. [Google Scholar] [CrossRef]
- Chen, Q.; Schmidt-Rohr, K. 19F and 13C NMR Signal Assignment and Analysis in a Perfluorinated Ionomer (Nafion) by Two-Dimensional Solid-State NMR. Macromolecules 2004, 37, 5995–6003. [Google Scholar] [CrossRef]
- Chen, Q.; Schmidt-Rohr, K. Backbone Dynamics of the Nafion Ionomer Studied by 19F-13C Solid-State NMR. Macromol. Chem. Phys. 2007, 208, 2189–2203. [Google Scholar] [CrossRef]
- Kimmich, R.; Anoardo, E. Field-cycling NMR relaxometry. Progr. Nucl. Magn. Reson. Spectrosc. 2004, 44, 257–320. [Google Scholar] [CrossRef]
- Perrin, J.C.; Lyonnard, S.; Guillermo, A.; Levitz, P. Water Dynamics in Ionomer Membranes by Field-Cycling NMR Relaxometry. J. Phys. Chem. B 2006, 110, 5439–5444. [Google Scholar] [CrossRef]
- Neves, L.; Sebastião, P.J.; Coelhoso, I.; Crespo, J. Proton NMR Relaxometry Study of Nafion Membranes Modified with Ionic Liquid Cations. J. Phys. Chem. B 2011, 115, 8713–8723. [Google Scholar] [CrossRef]
- Überrück, T.; Neudert, O.; Kreuer, K.-D.; Blümich, B.; Granwehr, J.; Stapf, S.; Han, S. Effect of nitroxide spin probes on the transport properties of Nafion membranes. Phys. Chem. Chem. Phys. 2018, 20, 26660–26674. [Google Scholar] [CrossRef] [PubMed]
- Hodge, I.M.; Eisenberg, A. Dielectric and Mechanical Relaxations in a Nafion Precursor. Macromolecules 1978, 11, 289–293. [Google Scholar] [CrossRef]
- Tant, M.R.; Darst, K.P.; Lee, K.D.; Martin, C.W. Structure and Properties of Short-Side-Chain Perfluorosulfonate Ionomers. In Multiphase Polymers: Blend and Ionomers; Utracki, L.A., Weiss, R.A., Eds.; ACS Symposium Series; American Chemical Society: Washington, DC, USA, 1989; Volume 395, pp. 370–400. [Google Scholar]
- Rachinger, W.A. A Correction for the α1α2 Doublet in the Measurement of Widths of X-ray Diffraction Lines. J. Sci. Instr. 1948, 25, 254–255. [Google Scholar] [CrossRef]
- SasView 5.0.6. Available online: https://www.sasview.org/ (accessed on 9 March 2024).
- Starkweather, H.W., Jr. Crystallinity in Perfluorosulfonic Acid Ionomers and Related Polymers. Macromolecules 1982, 15, 320–323. [Google Scholar] [CrossRef]
- Van der Heijden, P.C.; Rubatat, L.; Diat, O. Orientation of Drawn Nafion at Molecular and Mesoscopic Scales. Macromolecules 2004, 37, 5327–5336. [Google Scholar] [CrossRef]
- Fujimura, M.; Hashimoto, T.; Kawai, H. Small-Angle X-ray Scattering Study of Perfluorinated Ionomer Membranes. 1. Origin of Two Scattering Maxima. Macromolecules 1981, 14, 1309–1315. [Google Scholar] [CrossRef]
- Teubner, M.; Strey, R. Origin of the scattering peak in microemulsions. J. Chem. Phys. 1987, 87, 3195–3200. [Google Scholar] [CrossRef]
- Zhao, Y.; Yoshimura, K.; Motegi, T.; Hiroki, A.; Radulescu, A.; Maekawa, Y. Three-Component Domains in the Fully Hydrated Nafion Membrane Characterized by Partial Scattering Function Analysis. Macromolecules 2021, 54, 4128–4135. [Google Scholar] [CrossRef]
- Lenk, R. Diffusion and Spin Relaxation. Adv. Mol. Relax. Process. 1975, 6, 287–306. [Google Scholar] [CrossRef]
- Welch, C.; Labouiau, A.; Hjelm, R.; Orler, B.; Johnston, C.; Kim, Y.S. Nafion in Dilute Solvent Systems: Dispersion or Solution? ACS Macro Lett. 2012, 1, 1403–1407. [Google Scholar] [CrossRef]
- Tarokh, A.; Karan, K.; Ponnurangam, S. Atomistic MD Study of Nafion Dispersions: Role of Solvent and Counterion in the Aggregate Structure, Ionic Clustering, and Acid Dissociation. Macromolecules 2020, 53, 288–301. [Google Scholar] [CrossRef]
- Yamaguchi, M.; Matsunaga, T.; Amemiya, K.; Ohira, A.; Hasegawa, N.; Shinohara, K.; Ando, M.; Yoshida, T. Dispersion of Rod-like Particles of Nafion in Salt-Free Water/1-Propanol and Water/Ethanol Solutions. J. Phys. Chem. B 2014, 118, 14922–14928. [Google Scholar] [CrossRef]
- De Gennes, P.G. Reptation of a Polymer Chain in the Presence of Fixed Obstacles. J. Chem. Phys. 1971, 55, 572–579. [Google Scholar] [CrossRef]
- Denissov, A.; Kroutieva, M.; Fatkullin, N.; Kimmich, R. Segment diffusion and nuclear magnetic resonance spin-lattice relaxation of polymer chains confined in tubes: Analytical treatment and Monte Carlo simulation of the crossover from Rouse to reptation dynamics. J. Chem. Phys. 2003, 116, 5217–5730. [Google Scholar] [CrossRef]
- Clark, E.S. The Crystal Structure of Polytetrafluoroethylene, Forms I and IV. J. Macromol. Sci. Part B Phys. 2006, 45, 201–213. [Google Scholar] [CrossRef]
- Kimmich, R. Principles of Soft-Matter Dynamics; Chapter 5.4; Springer: Dordrecht, The Netherlands, 2012. [Google Scholar]
- Katzenberg, A.; Chowdhury, A.; Fang, M.; Weber, A.Z.; Okamoto, Y.; Kusoglu, A.; Modestino, M.A. Highly Permeable Perfluorinated Sulfonic Acid Ionomers for Improved Electrochemical Devices: Insights into Structure−Property Relationships. J. Am. Chem. Soc. 2020, 142, 3742–3752. [Google Scholar] [CrossRef]
- Jinnouchi, R.; Kudo, K.; Kodama, K.; Kitano, N.; Suzuki, T.; Minami, S.; Shinozaki, K.; Hasegawa, N.; Shinohara, A. The role of oxygen-permeable ionomer for polymer electrolyte fuel cells. Nat. Commun. 2021, 12, 4956. [Google Scholar] [CrossRef] [PubMed]
- Hirai, T.; Hommura, S.; Watakabe, A.; Miyajima, T.; Nakayama, S.; Tamoto, K.; Uchida, M. Effects of Humidity and Produced Water on Specific Adsorption of High Oxygen Permeability Ionomers Composed Entirely of Cyclic Monomers on Cathode Performance for Polymer Electrolyte Fuel Cells. ACS Appl. Energy Mater. 2024, 7, 3806–3823. [Google Scholar] [CrossRef]


| d/nm | ξ/nm | |
|---|---|---|
| NR212 a | 9.9, 3.1 | 3.0, 1.8 |
| E98-05S a | 16.2, 3.3 | 3.1, 2.0 |
| R-1100 a | 13.8 | 4.7 |
| P98-SO2F | 14.4 | 2.7 |
Disclaimer/Publisher’s Note: The statements, opinions and data contained in all publications are solely those of the individual author(s) and contributor(s) and not of MDPI and/or the editor(s). MDPI and/or the editor(s) disclaim responsibility for any injury to people or property resulting from any ideas, methods, instructions or products referred to in the content. |
© 2024 by the authors. Licensee MDPI, Basel, Switzerland. This article is an open access article distributed under the terms and conditions of the Creative Commons Attribution (CC BY) license (https://creativecommons.org/licenses/by/4.0/).
Share and Cite
Yamaguchi, M.; Kuroda, S.; Asaoka, T.; Shinohara, K. Fast Field-Cycling Nuclear Magnetic Resonance Relaxometry of Perfluorosulfonic Acid Ionomers and Their Perfluorosulfonyl Fluoride Precursors Membranes. Molecules 2024, 29, 2552. https://doi.org/10.3390/molecules29112552
Yamaguchi M, Kuroda S, Asaoka T, Shinohara K. Fast Field-Cycling Nuclear Magnetic Resonance Relaxometry of Perfluorosulfonic Acid Ionomers and Their Perfluorosulfonyl Fluoride Precursors Membranes. Molecules. 2024; 29(11):2552. https://doi.org/10.3390/molecules29112552
Chicago/Turabian StyleYamaguchi, Makoto, Seiichi Kuroda, Takahiko Asaoka, and Kazuhiko Shinohara. 2024. "Fast Field-Cycling Nuclear Magnetic Resonance Relaxometry of Perfluorosulfonic Acid Ionomers and Their Perfluorosulfonyl Fluoride Precursors Membranes" Molecules 29, no. 11: 2552. https://doi.org/10.3390/molecules29112552