The Discovery of Selective Protein Arginine Methyltransferase 5 Inhibitors in the Management of β-Thalassemia through Computational Methods

 , , ,
, , ,  ,
,
Abstract
:
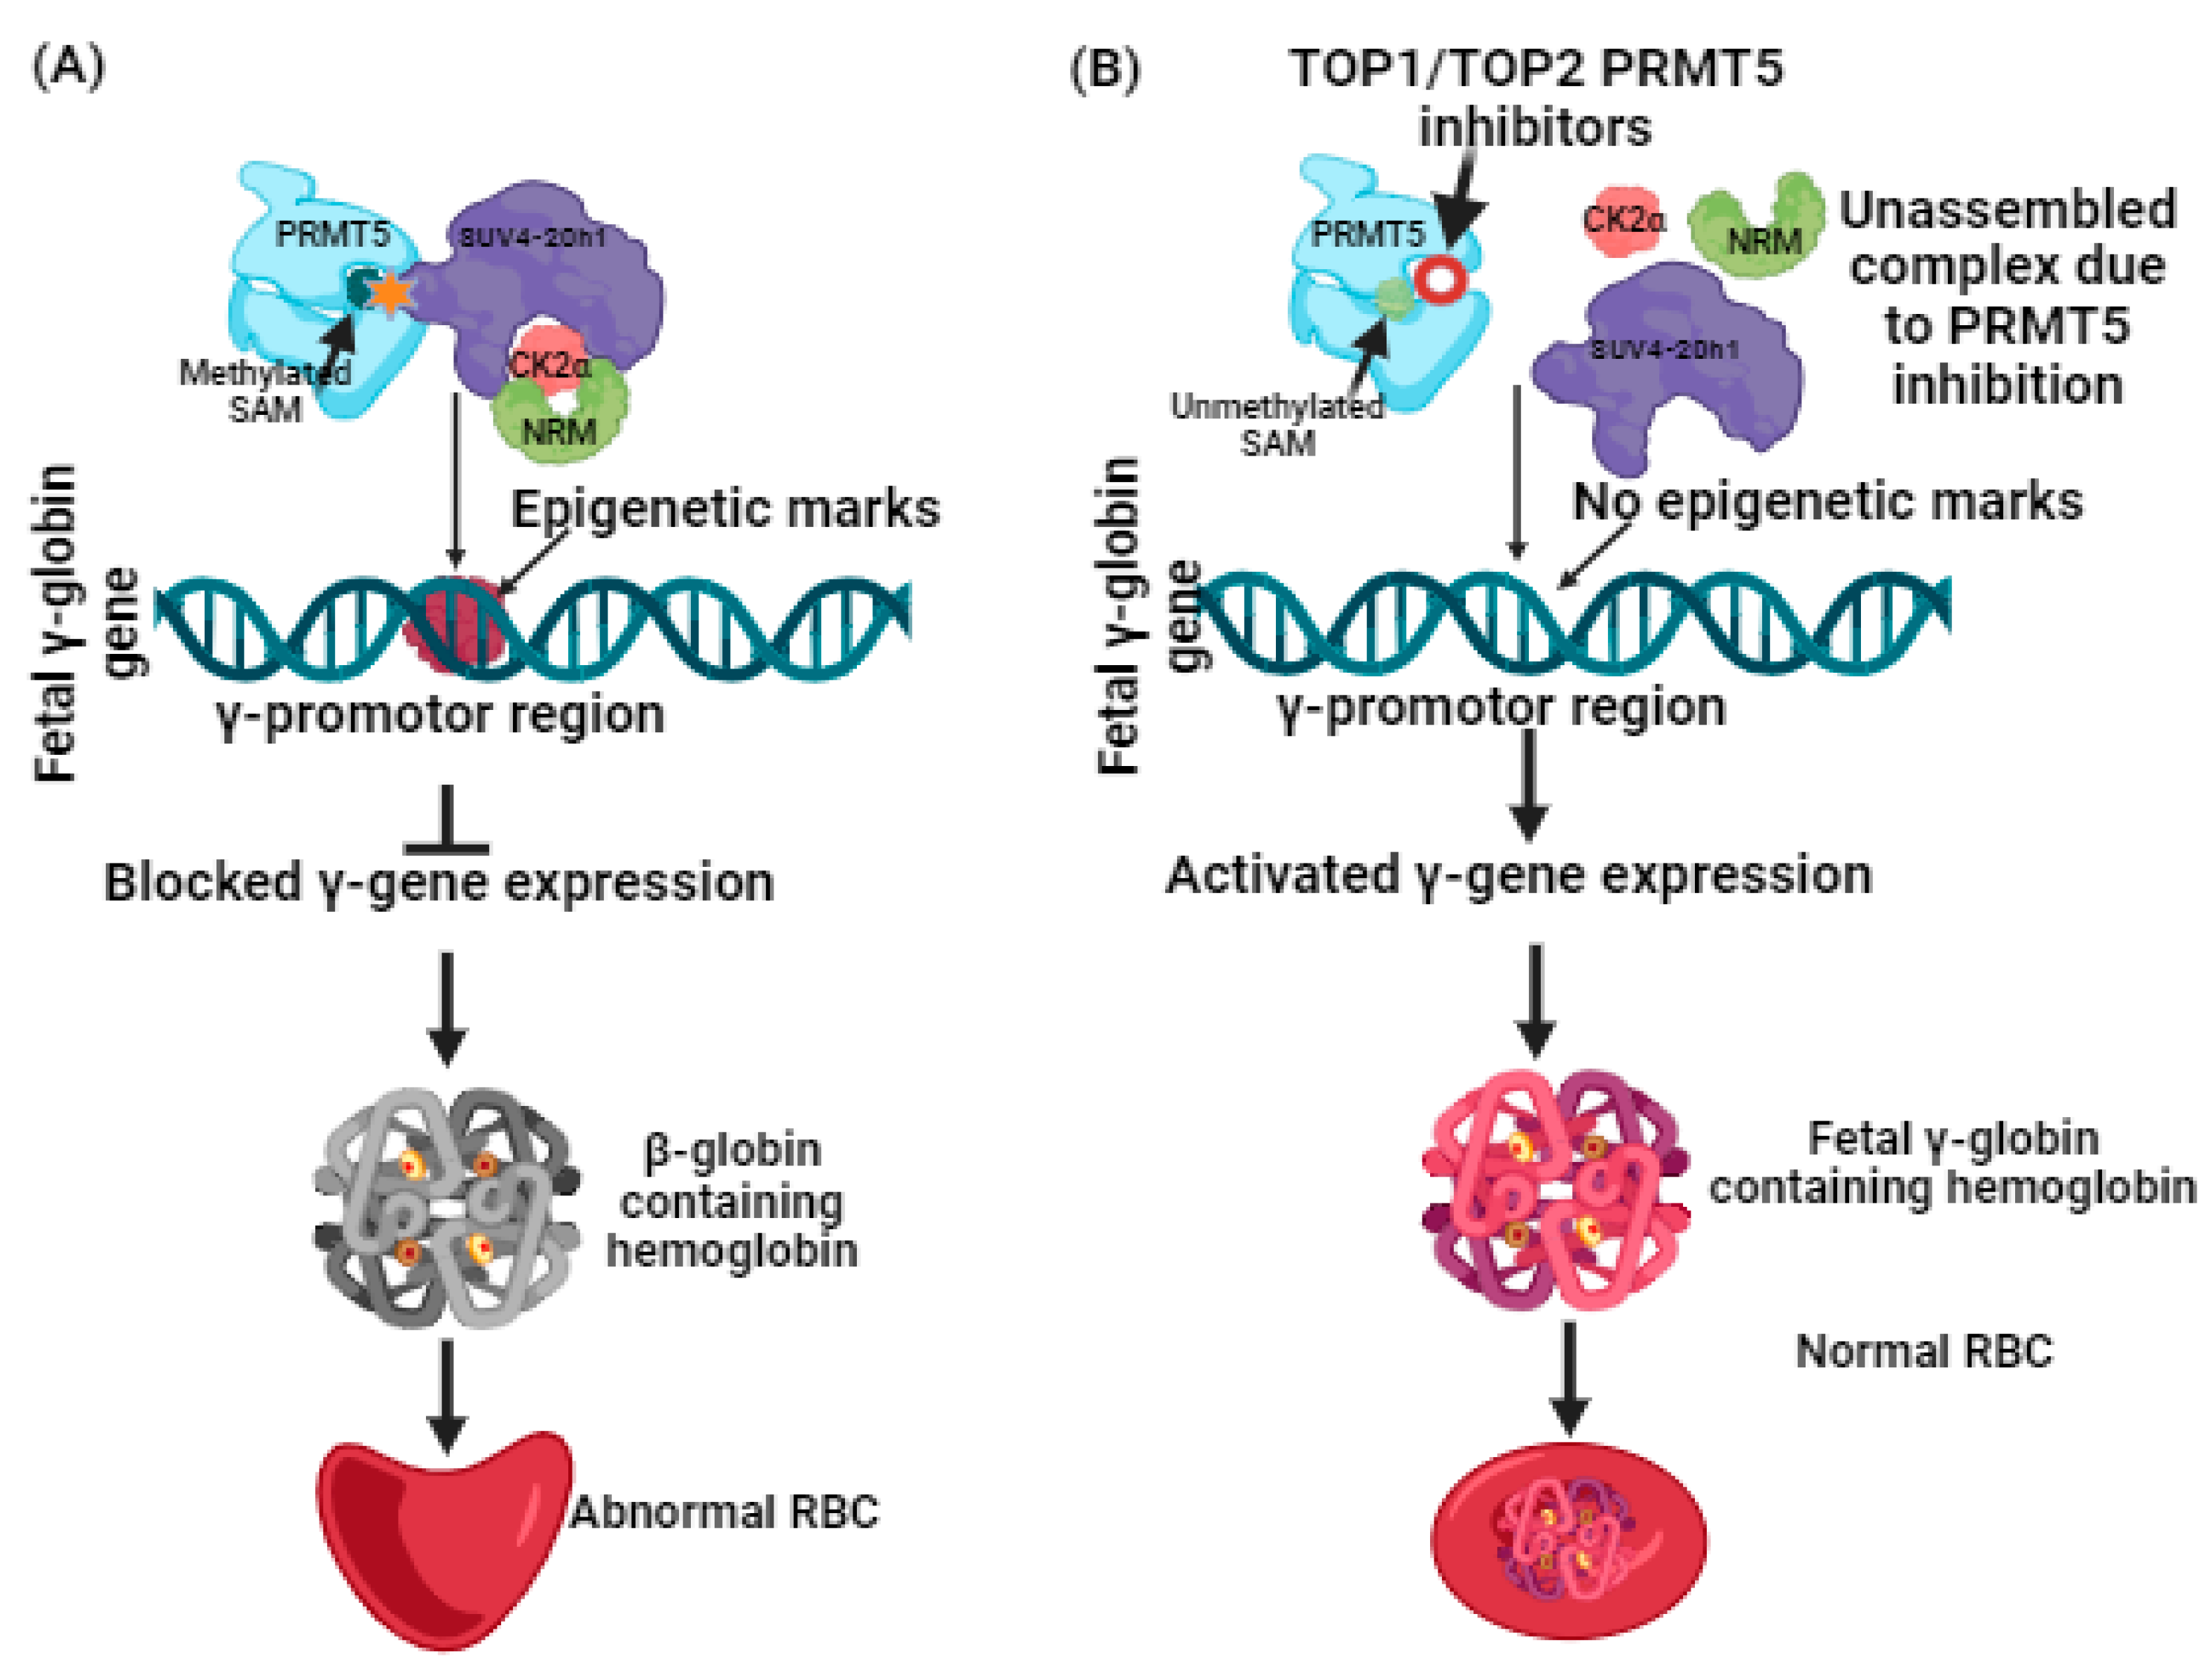
1. Introduction
2. Results
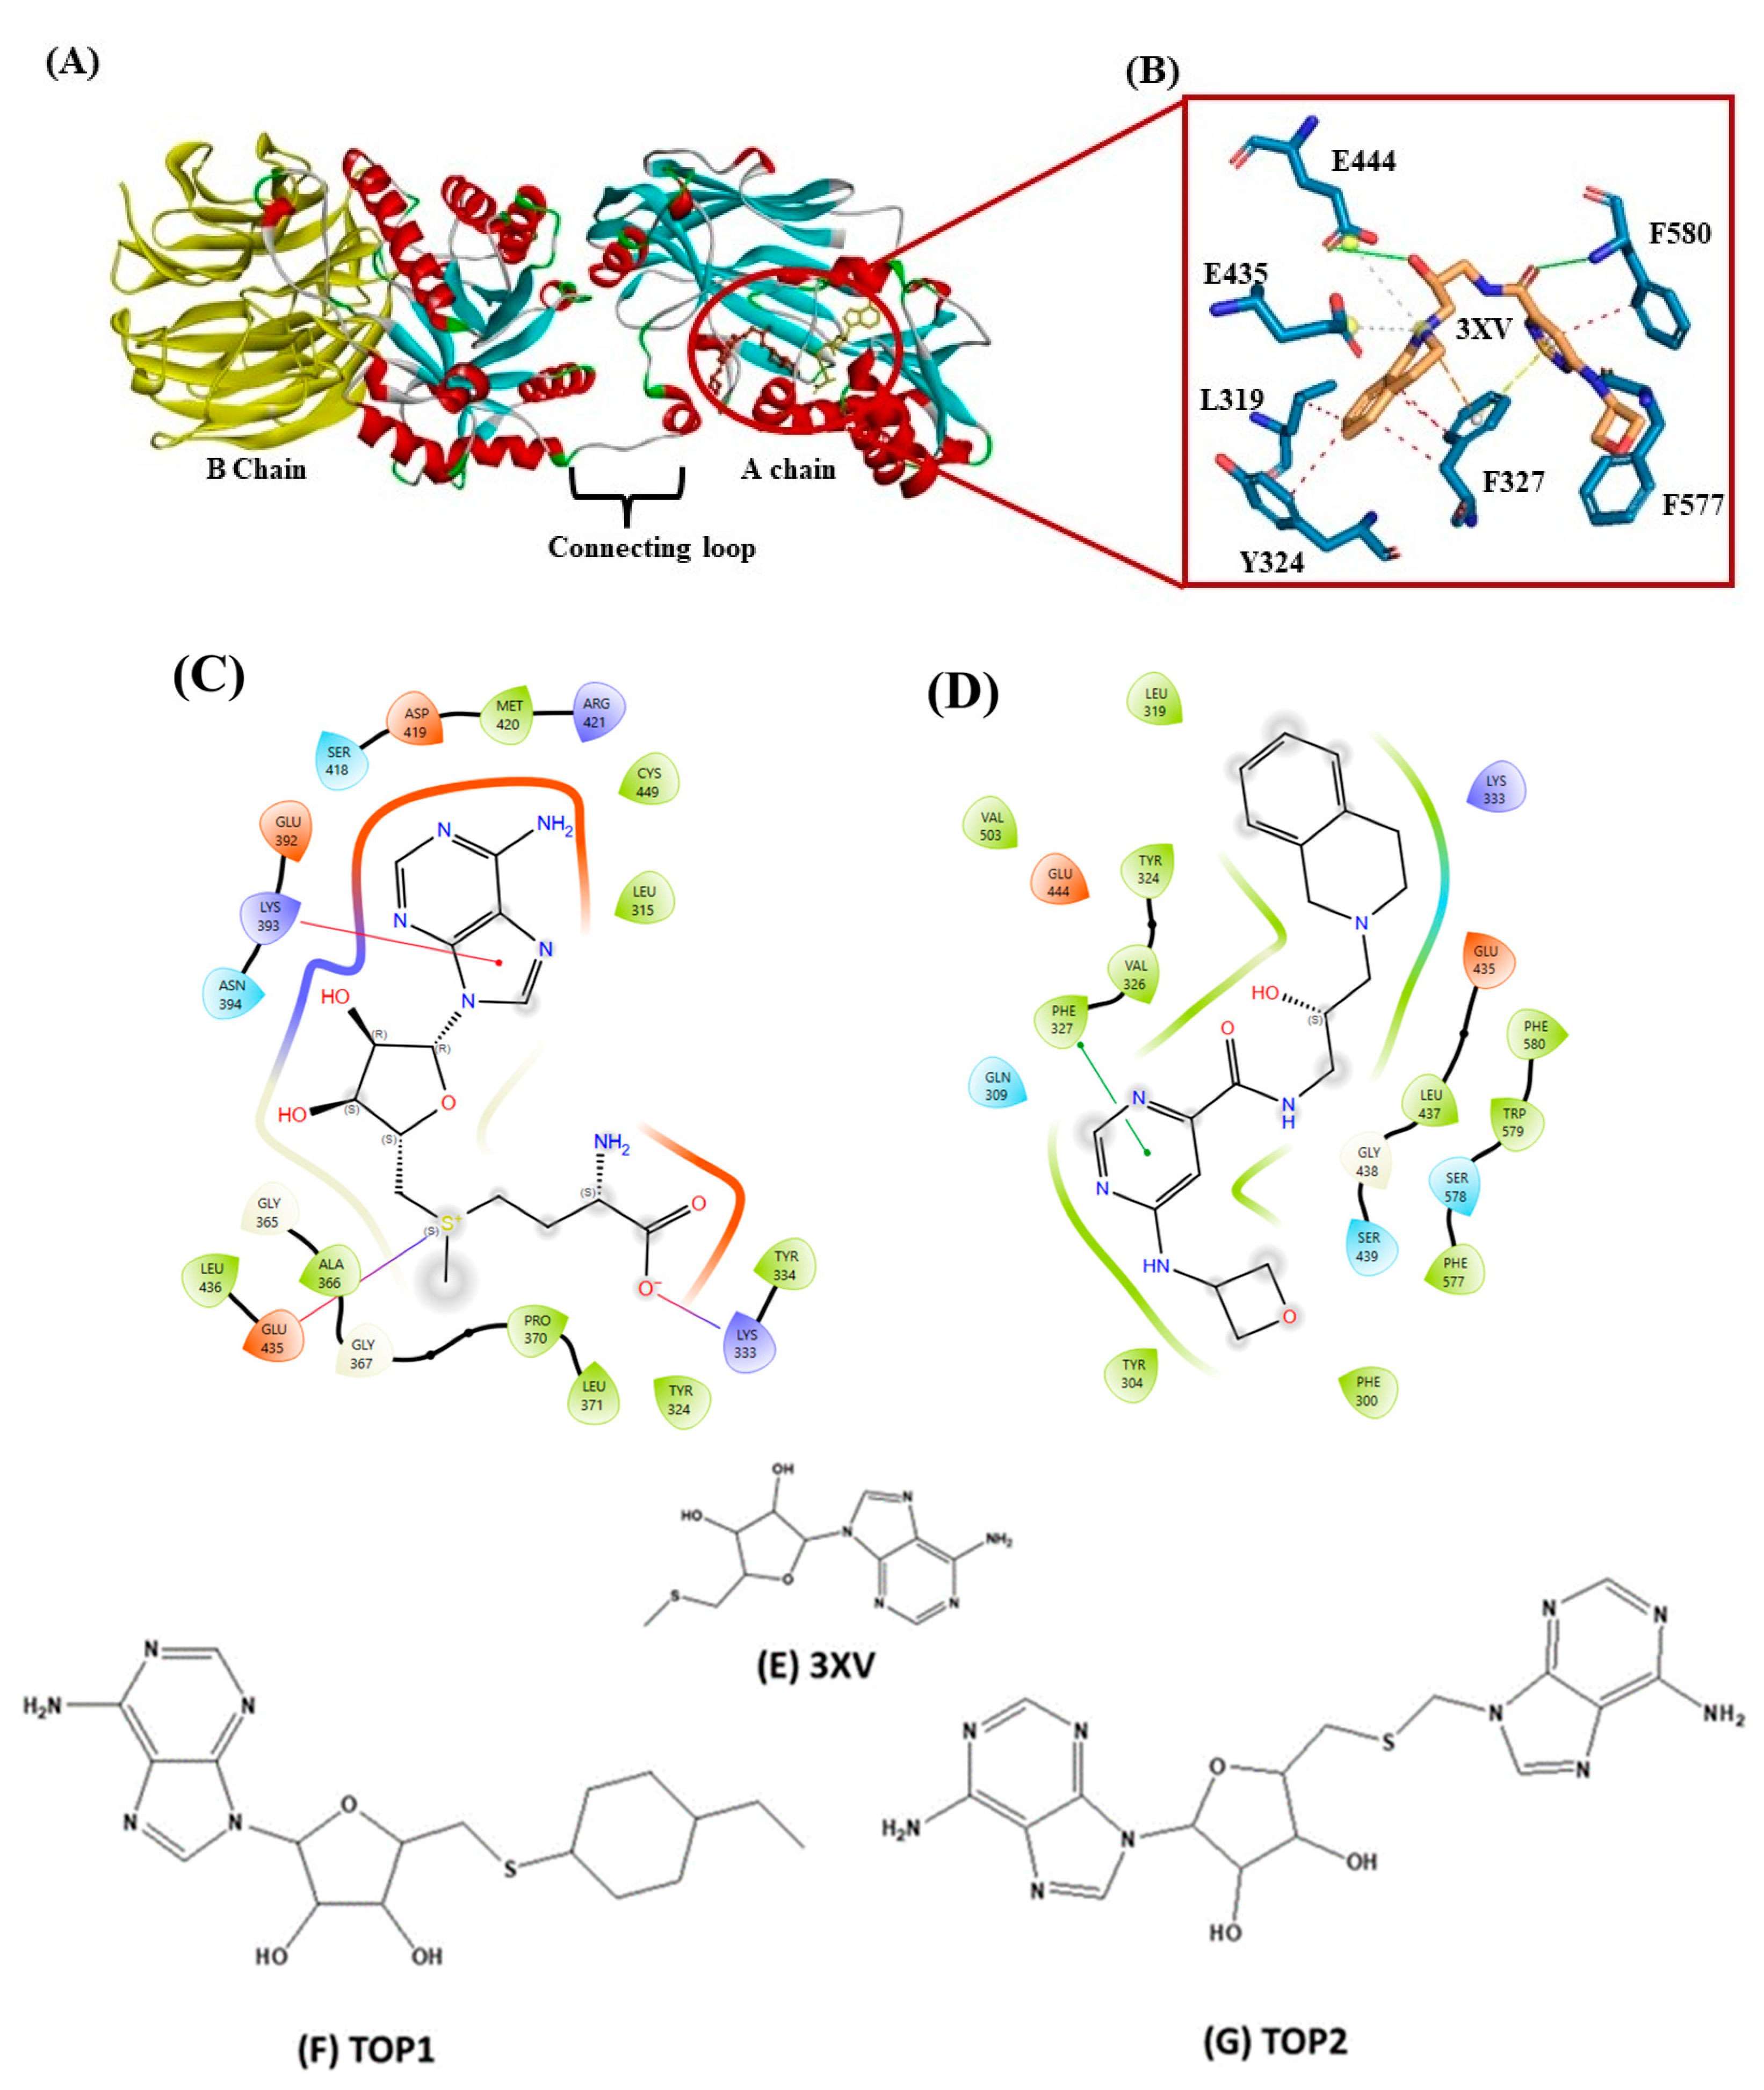
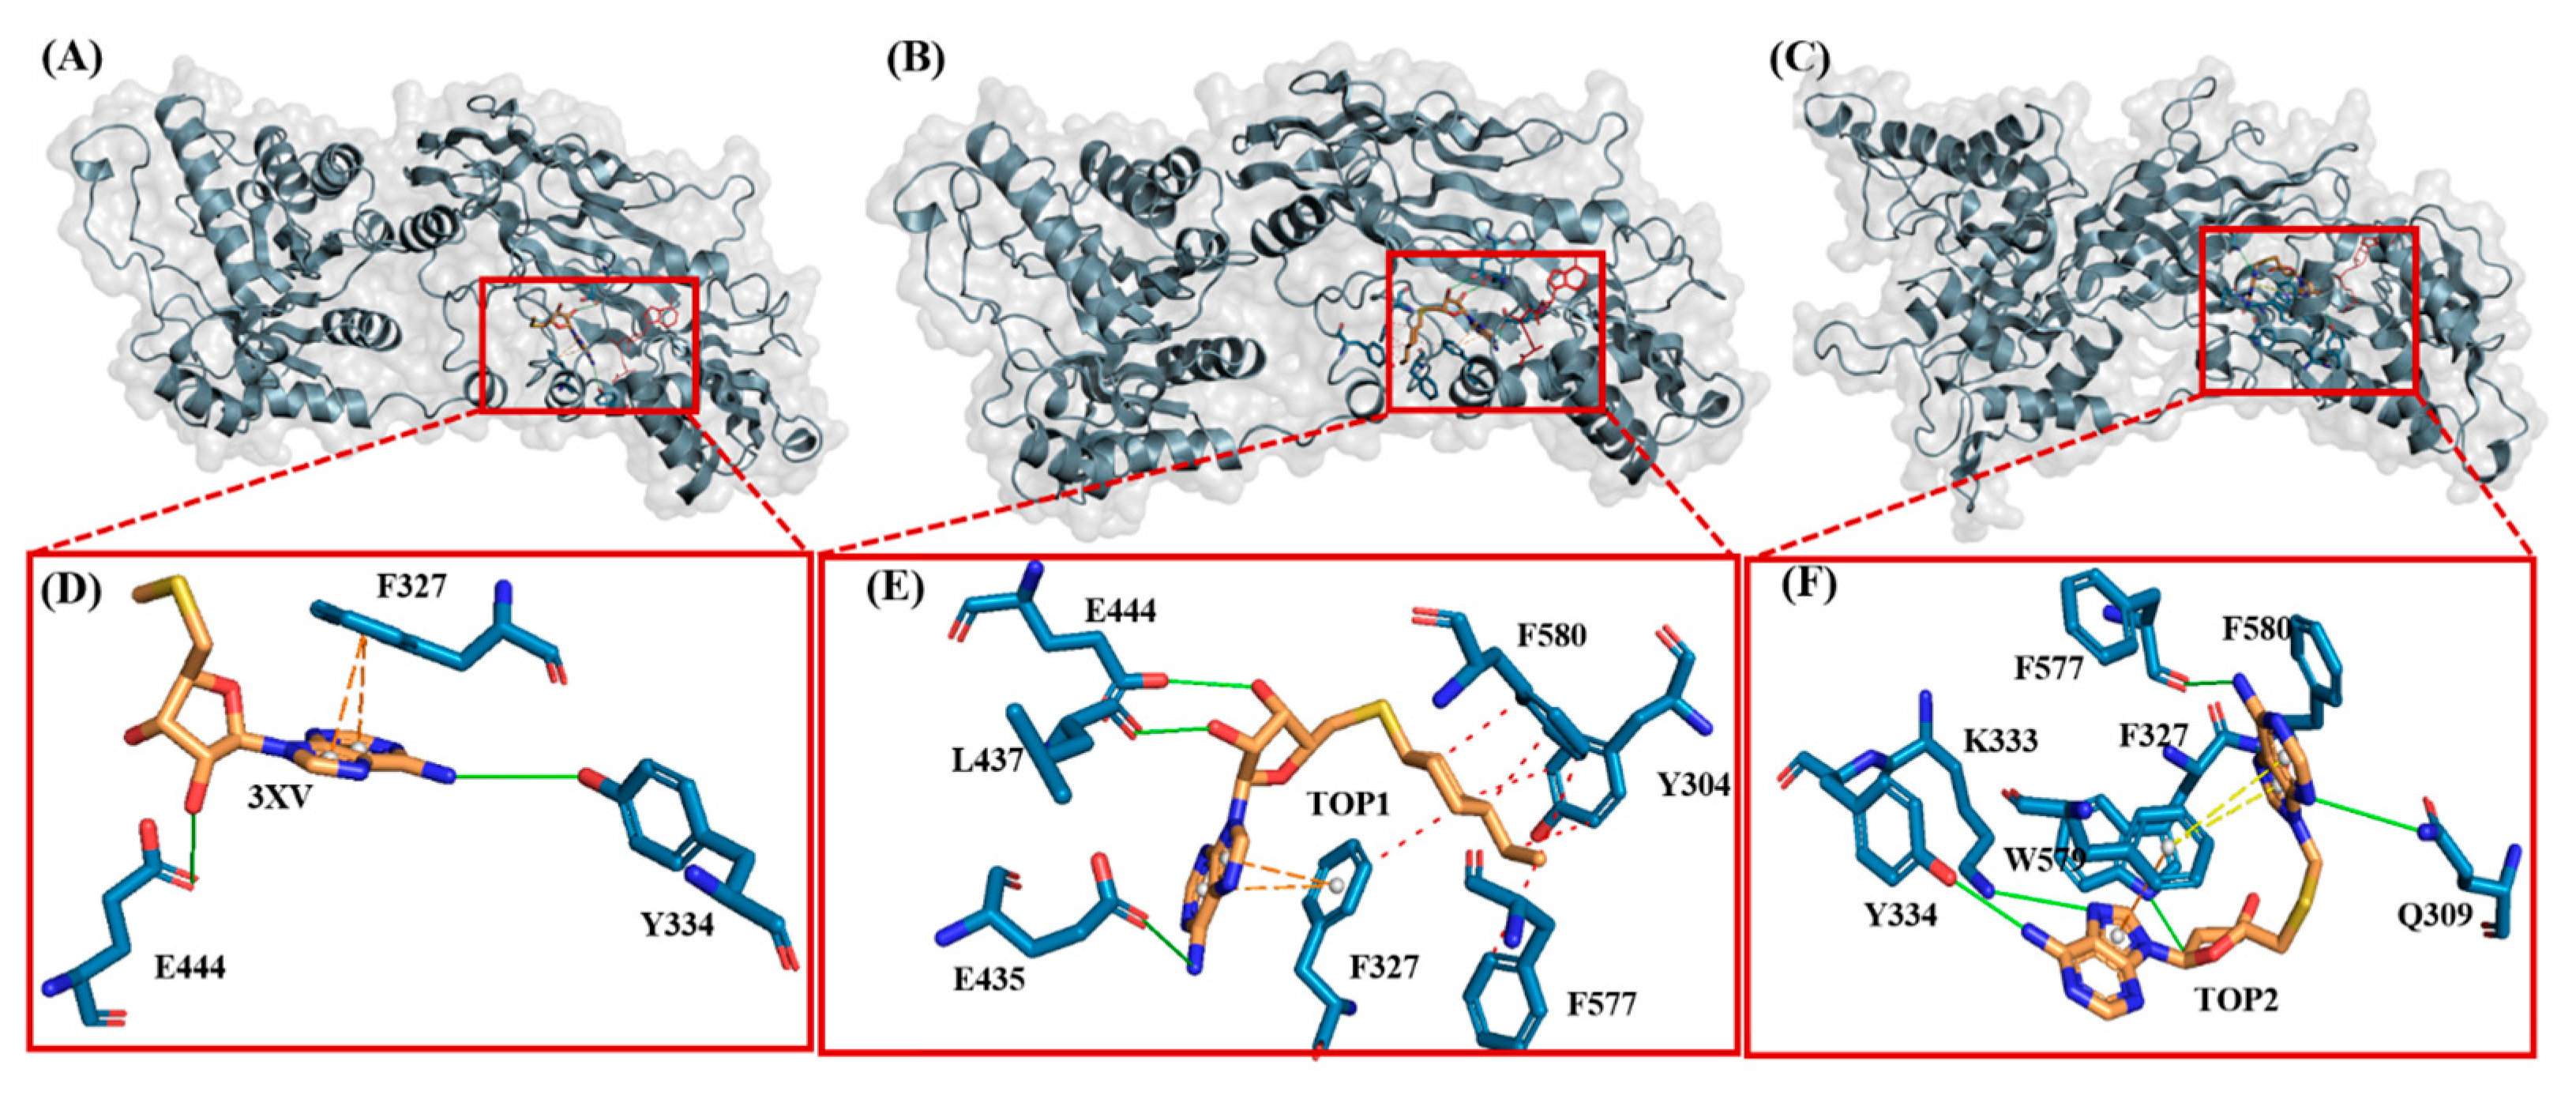
2.1. Virtual Screening and Molecular Docking Analysis
2.2. Pharmacokinetic and ADMET Analysis
2.3. Molecular Dynamics Simulations
2.3.1. Root Mean Square Deviation
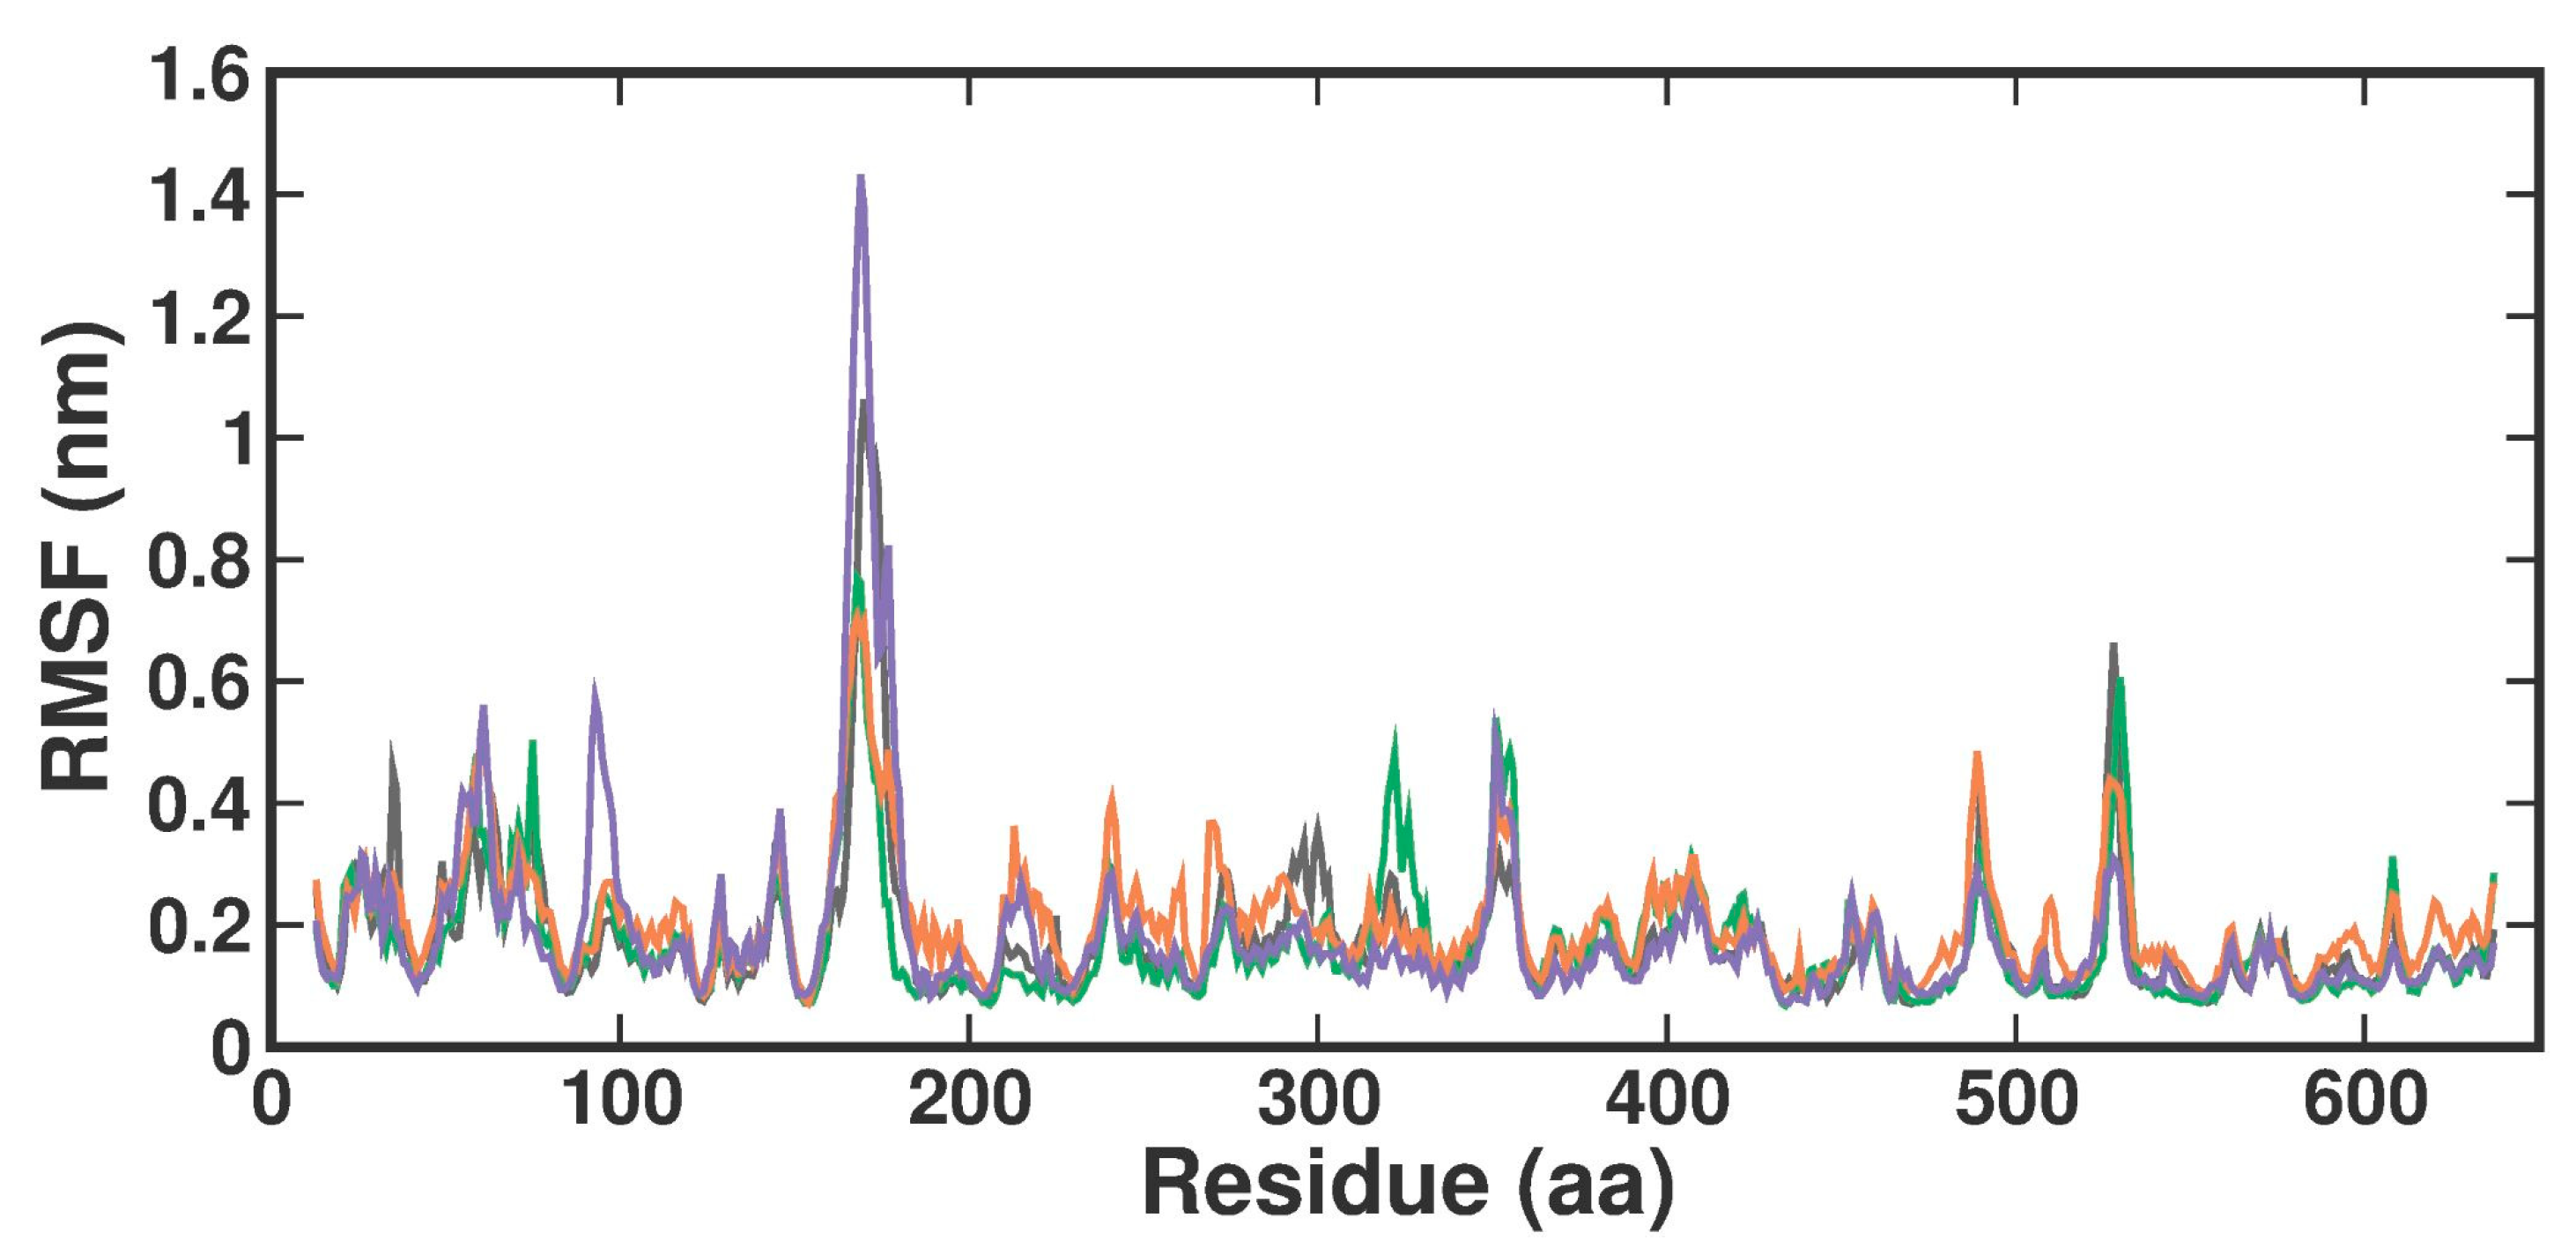
2.3.2. Root-Man-Square Fluctuation
2.3.3. Radius of Gyration and Solvent Accessible Surface Area
2.3.4. Molecular Interactions Analysis
2.3.5. Principal Component Analysis
2.3.6. MM-PBSA Analysis
3. Discussion
4. Materials and Methods
4.1. Virtual Screening
4.2. Protein Preparation and Molecular Docking
4.3. Physiochemical and Drug-Likeness Properties
4.4. Molecular Dynamics
4.5. Free Energy Landscape (FEL) and MM-PBSA Analysis
5. Conclusions
Supplementary Materials
Author Contributions
Funding
Institutional Review Board Statement
Informed Consent Statement
Data Availability Statement
Conflicts of Interest
References
- Sanchez-Villalobos, M.; Blanquer, M.; Moraleda, J.M.; Salido, E.J.; Perez-Oliva, A.B. New insights into pathophysiology of β-thalassemia. Front. Med. 2022, 9, 880752. [Google Scholar] [CrossRef] [PubMed]
- Jaing, T.H.; Chang, T.Y.; Chen, S.H.; Lin, C.W.; Wen, Y.C.; Chiu, C.C. Molecular genetics of β-thalassemia: A narrative review. Medicine 2021, 100, e27522. [Google Scholar] [CrossRef] [PubMed]
- Kattamis, A.; Forni, G.L.; Aydinok, Y.; Viprakasit, V. Changing patterns in the epidemiology of β-thalassemia. European J. Haematol. 2020, 105, 692–703. [Google Scholar] [CrossRef] [PubMed]
- Ali, S.; Mumtaz, S.; Shakir, H.A.; Khan, M.; Tahir, H.M.; Mumtaz, S.; Mughal, T.A.; Hassan, A.; Kazmi, S.A.R.; Sadia; et al. Current status of beta-thalassemia and its treatment strategies. Mol. Genet. Genomic Med. 2021, 9, e1788. [Google Scholar] [CrossRef] [PubMed]
- Farmakis, D.; Porter, J.; Taher, A.; Domenica Cappellini, M.; Angastiniotis, M.; Eleftheriou, A. 2021 Thalassaemia International Federation Guidelines for the management of transfusion-dependent thalassemia. Hemasphere 2022, 6, e732. [Google Scholar] [CrossRef] [PubMed]
- Centers for Disease Control and Prevention. Thalassemia: Complications and Treatment. Available online: https://www.cdc.gov/ncbddd/thalassemia/treatment.html (accessed on 22 February 2024).
- Nienhuis, A.W.; Nathan, D.G. Pathophysiology and clinical manifestations of the β-thalassemias. Cold Spring Harb. Perspect. Med. 2012, 2, a011726. [Google Scholar] [CrossRef]
- Lee, J.S.; Cho, S.I.; Park, S.S.; Seong, M.W. Molecular basis and diagnosis of thalassemia. Blood Res. 2021, 56, S39–S43. [Google Scholar] [CrossRef] [PubMed]
- Fraidenburg, D.R.; Machado, R.F. Pulmonary hypertension associated with thalassemia syndromes. Ann. N. Y Acad. Sci. 2016, 1368, 127–139. [Google Scholar] [CrossRef] [PubMed]
- Anthi, A.; Orfanos, S.E.; Armaganidis, A. Pulmonary hypertension in β thalassaemia. Lancet Respir. Med. 2013, 1, 488–496. [Google Scholar] [CrossRef]
- NHLBI National Heart, Lung, and Blood Institute THALASSEMIA: Treatment. Available online: https://www.nhlbi.nih.gov/health/thalassemia/treatment (accessed on 4 February 2024).
- Parisi, S.; Finelli, C. Prognostic factors and clinical considerations for iron chelation therapy in myelodysplastic syndrome patients. J. Blood Med. 2021, 12, 1019–1030. [Google Scholar] [CrossRef]
- Bao, X.; Zhang, X.; Wang, L.; Wang, Z.; Huang, J.; Zhang, Q.; Ye, Y.; Liu, Y.; Chen, D.; Zuo, Y.; et al. Epigenetic inactivation of ERF reactivates γ-globin expression in β-thalassemia. Am. J. Hum. Genet. 2021, 108, 709–721. [Google Scholar] [CrossRef] [PubMed]
- Vinjamur, D.S.; Bauer, D.E.; Orkin, S.H. Recent progress in understanding and manipulating haemoglobin switching for the haemoglobinopathies. Br. J. Haematol. 2018, 180, 630–643. [Google Scholar] [CrossRef] [PubMed]
- Adelvand, P.; Hamid, M.; Sardari, S. The intrinsic genetic and epigenetic regulator factors as therapeutic targets, and the effect on fetal globin gene expression. Expert. Rev. Hematol. 2018, 11, 71–81. [Google Scholar] [CrossRef] [PubMed]
- Venkatesan, V.; Srinivasan, S.; Babu, P.; Thangavel, S. Manipulation of developmental gamma-globin gene expression: An approach for healing hemoglobinopathies. Mol. Cell Biol. 2020, 41, e00253-20. [Google Scholar] [CrossRef] [PubMed]
- Ravikumar, Y.; Koonyosying, P.; Srichairatanakool, S.; Ponpandian, L.N.; Kumaravelu, J.; Srichairatanakool, S. In silico molecular docking and dynamics simulation analysis of potential histone lysine methyl transferase inhibitors for managing β-thalassemia. Molecules 2023, 28, 7266. [Google Scholar] [CrossRef] [PubMed]
- Taher, A.T.; Musallam, K.M.; Cappellini, M.D. β-Thalassemias. N. Engl. J. Med. 2021, 384, 727–743. [Google Scholar] [CrossRef] [PubMed]
- Bou-Fakhredin, R.; De Franceschi, L.; Motta, I.; Cappellini, M.D.; Taher, A.T. Pharmacological induction of fetal hemoglobin in β-thalassemia and sickle cell disease: An updated perspective. Pharmaceuticals 2022, 15, 753. [Google Scholar] [CrossRef] [PubMed]
- Husmann, D.; Gozani, O. Histone lysine methyltransferases in biology and disease. Nat. Struct. Mol. Biol. 2019, 26, 880–889. [Google Scholar] [CrossRef] [PubMed]
- Renneville, A.; Van Galen, P.; Canver, M.C.; McConkey, M.; Krill-Burger, J.M.; Dorfman, D.M.; Holson, E.B.; Bernstein, B.E.; Orkin, S.H.; Bauer, D.E.; et al. EHMT1 and EHMT2 inhibition induces fetal hemoglobin expression. Blood 2015, 126, 1930–1939. [Google Scholar] [CrossRef] [PubMed]
- Krivega, I.; Byrnes, C.; de Vasconcellos, J.F.; Lee, Y.T.; Kaushal, M.; Dean, A.; Miller, J.L. Inhibition of G9a methyltransferase stimulates fetal hemoglobin production by facilitating LCR/γ-globin looping. Blood 2015, 126, 665–672. [Google Scholar] [CrossRef]
- Cedillo-González, R.; Medina-Franco, J.L. Diversity and chemical space characterization of inhibitors of the epigenetic target G9a: A chemoinformatics approach. ACS Omega 2023, 8, 30694–30704. [Google Scholar] [CrossRef] [PubMed]
- Katayama, K.; Ishii, K.; Terashima, H.; Tsuda, E.; Suzuki, M.; Yotsumoto, K.; Hiramoto, K.; Yasumatsu, I.; Torihata, M.; Ishiyama, T.; et al. Discovery of DS79932728: A potent, orally available G9a/GLP inhibitor for treating β-thalassemia and sickle cell disease. ACS Med. Chem. Lett. 2021, 12, 121–128. [Google Scholar] [CrossRef]
- Katayama, K.; Ishii, K.; Tsuda, E.; Yotsumoto, K.; Hiramoto, K.; Suzuki, M.; Yasumatsu, I.; Igarashi, W.; Torihata, M.; Ishiyama, T.; et al. Discovery of novel histone lysine methyltransferase G9a/GLP (EHMT2/1) inhibitors: Design, synthesis, and structure-activity relationships of 2,4-diamino-6-methylpyrimidines. Bioorg. Med. Chem. Lett. 2020, 30, 127475. [Google Scholar] [CrossRef] [PubMed]
- Haebe, J.R.; Bergin, C.J.; Sandouka, T.; Benoit, Y.D. Emerging role of G9a in cancer stemness and promises as a therapeutic target. Oncogenesis 2021, 10, 76. [Google Scholar] [CrossRef] [PubMed]
- Wang, Y.; Li, X.; Ge, J.; Liu, M.; Pang, X.; Liu, J.; Luo, C.; Xu, Y.; Zhao, Q. The methyltransferase PRMT1 regulates γ-globin translation. J. Biol. Chem. 2021, 296, 100417. [Google Scholar] [CrossRef] [PubMed]
- Zhang, P.; Tao, H.; Yu, L.; Zhou, L.; Zhu, C. Developing protein arginine methyltransferase 1 (PRMT1) inhibitor TC-E-5003 as an antitumor drug using INEI drug delivery systems. Drug Deliv. 2020, 27, 491–501. [Google Scholar] [CrossRef] [PubMed]
- Yang, Y.; Bedford, M.T. Protein arginine methyltransferases and cancer. Nat. Rev. Cancer 2013, 13, 37–50. [Google Scholar] [CrossRef] [PubMed]
- Hwang, J.W.; Cho, Y.; Bae, G.-U.; Kim, S.-N.; Kim, Y.K. Protein arginine methyltransferases: Promising targets for cancer therapy. Exp. Mol. Med. 2021, 53, 788–808. [Google Scholar] [CrossRef] [PubMed]
- Roach, N.; Cannon, M.; El-Gamal, D.; Desai, P.C.; Kraut, E.H.; Bradner, J.E.; Lapalombella, R.; Baiocchi, R.A. Targeting the PRMT5 enzyme to induce γ-globin gene derepression in sickle cell anemia. Blood 2013, 122, 1007. [Google Scholar] [CrossRef]
- Nie, M.; Wang, Y.; Guo, C.; Li, X.; Wang, Y.; Deng, Y.; Yao, B.; Gui, T.; Ma, C.; Liu, M.; et al. CARM1-mediated methylation of protein arginine methyltransferase 5 represses human γ-globin gene expression in erythroleukemia cells. J. Biol. Chem. 2018, 293, 17454–17463. [Google Scholar] [CrossRef]
- Rank, G.; Cerruti, L.; Simpson, R.J.; Moritz, R.L.; Jane, S.M.; Zhao, Q. Identification of a PRMT5-dependent repressor complex linked to silencing of human fetal globin gene expression. Blood 2010, 116, 1585–1592. [Google Scholar] [CrossRef] [PubMed]
- He, Y.; Rank, G.; Zhang, M.; Ju, J.; Liu, R.; Xu, Z.; Brown, F.; Cerruti, L.; Ma, C.; Tan, R.; et al. Induction of human fetal hemoglobin expression by adenosine-2′,3′-dialdehyde. J. Transl. Med. 2013, 11, 14. [Google Scholar] [CrossRef] [PubMed]
- Chan-Penebre, E.; Kuplast, K.G.; Majer, C.R.; Boriack-Sjodin, P.A.; Wigle, T.J.; Johnston, L.D.; Rioux, N.; Munchhof, M.J.; Jin, L.; Jacques, S.L.; et al. A selective inhibitor of PRMT5 with in vivo and in vitro potency in MCL models. Nat. Chem. Biol. 2015, 11, 432–437. [Google Scholar] [CrossRef] [PubMed]
- Brehmer, D.; Beke, L.; Wu, T.; Millar, H.J.; Moy, C.; Sun, W.; Mannens, G.; Pande, V.; Boeckx, A.; van Heerde, E.; et al. Discovery and pharmacological characterization of JNJ-64619178, a novel small-molecule inhibitor of PRMT5 with potent antitumor activity. Mol. Cancer Ther. 2021, 20, 2317–2328. [Google Scholar] [CrossRef] [PubMed]
- Agu, P.C.; Afiukwa, C.A.; Orji, O.U.; Ezeh, E.M.; Ofoke, I.H.; Ogbu, C.O.; Ugwuja, E.I.; Aja, P.M. Molecular docking as a tool for the discovery of molecular targets of nutraceuticals in diseases management. Sci. Rep. 2023, 13, 13398. [Google Scholar] [CrossRef] [PubMed]
- Bai, G.; Pan, Y.; Zhang, Y.; Li, Y.; Wang, J.; Wang, Y.; Teng, W.; Jin, G.; Geng, F.; Cao, J. Research advances of molecular docking and molecular dynamic simulation in recognizing interaction between muscle proteins and exogenous additives. Food Chem. 2023, 429, 136836. [Google Scholar] [CrossRef] [PubMed]
- Ferreira, L.G.; Dos Santos, R.N.; Oliva, G.; Andricopulo, A.D. Molecular docking and structure-based drug design strategies. Molecules 2015, 20, 13384–13421. [Google Scholar] [CrossRef] [PubMed]
- Aungst, B.J. Optimizing oral bioavailability in drug discovery: An overview of design and testing strategies and formulation options. J. Pharm. Sci. 2017, 106, 921–929. [Google Scholar] [CrossRef] [PubMed]
- Lipinski, C.A. Lead- and drug-like compounds: The rule-of-five revolution. Drug Discov. Today Technol. 2004, 1, 337–341. [Google Scholar] [CrossRef]
- Lipinski, C.A.; Lombardo, F.; Dominy, B.W.; Feeney, P.J. Experimental and computational approaches to estimate solubility and permeability in drug discovery and development settings. Adv. Drug Deliv. Rev. 2001, 46, 3–26. [Google Scholar] [CrossRef]
- Ferenczy, G.G.; Kellermayer, M. Contribution of hydrophobic interactions to protein mechanical stability. Comput. Struct. Biotechnol. J. 2022, 20, 1946–1956. [Google Scholar] [CrossRef] [PubMed]
- Klebe, G. Protein–Ligand Interactions as the Basis for Drug Action. In Drug Design: Methodology, Concepts, and Mode-of-Action; Klebe, G., Ed.; Springer: Berlin/Heidelberg, Germany, 2013; pp. 61–88. [Google Scholar]
- Madushanka, A.; Moura, R.T., Jr.; Verma, N.; Kraka, E. Quantum mechanical assessment of protein-ligand hydrogen bond strength patterns: Insights from semiempirical tight-binding and local vibrational mode theory. Int. J. Mol. Sci. 2023, 24, 6311. [Google Scholar] [CrossRef] [PubMed]
- Pace, C.N.; Fu, H.; Fryar, K.L.; Landua, J.; Trevino, S.R.; Shirley, B.A.; Hendricks, M.M.; Iimura, S.; Gajiwala, K.; Scholtz, J.M.; et al. Contribution of hydrophobic interactions to protein stability. J. Mol. Biol. 2011, 408, 514–528. [Google Scholar] [CrossRef] [PubMed]
- Cheng, Y.; He, C.; Wang, M.; Ma, X.; Mo, F.; Yang, S.; Han, J.; Wei, X. Targeting epigenetic regulators for cancer therapy: Mechanisms and advances in clinical trials. Signal Transduct. Target. Ther. 2019, 4, 62. [Google Scholar] [CrossRef] [PubMed]
- Starlard-Davenport, A.; Fitzgerald, A.; Pace, B.S. Exploring epigenetic and microRNA approaches for γ-globin gene regulation. Exp. Biol. Med. 2021, 246, 2347–2357. [Google Scholar] [CrossRef] [PubMed]
- National Center for Biotechnology Information. PubChem Compound Summary for CID 154815704. Available online: https://pubchem.ncbi.nlm.nih.gov/compound/154815704 (accessed on 3 December 2023).
- BIOVIA. Dassault Systèmes, Discovery Studio Visualizer 2021. Available online: https://discover.3ds.com/discovery-studio-visualizer-download (accessed on 25 December 2023).
- Trott, O.; Olson, A.J. AutoDock Vina: Improving the speed and accuracy of docking with a new scoring function, efficient optimization, and multithreading. J. Comput. Chem. 2010, 31, 455–461. [Google Scholar] [CrossRef] [PubMed]
- Huang, J.; Rauscher, S.; Nawrocki, G.; Ran, T.; Feig, M.; de Groot, B.L.; Grubmüller, H.; MacKerell, A.D., Jr. CHARMM36m: An improved force field for folded and intrinsically disordered proteins. Nat. Methods 2017, 14, 71–73. [Google Scholar] [CrossRef]
- Kumari, R.; Kumar, R.; Lynn, A. g_mmpbsa—A GROMACS tool for high-throughput MM-PBSA calculations. J. Chem. Inf. Model. 2014, 54, 1951–1962. [Google Scholar] [CrossRef]


| Ligand | Code | PubChem ID | Autodock Score (Kcal/mol) |
|---|---|---|---|
| 5′-Deoxy-5′-methylthioadenosine | 3XV | 439176 | −6.6 |
| (3R,4S)-2-(6-aminopurin-9-yl)-5-[(4-ethylcyclohexyl)sulfanylmethyl]oxolane-3,4-diol | TOP1 | 142801950 | −9.3 |
| 2-(6-Aminopurin-9-yl)-5-[(6-aminopurin-9-yl)methylsulfanylmethyl]oxolane-3,4-diol | TOP2 | 134460148 | −9.1 |
| (2R,3R,4S,5S)-2-(6-aminopurin-9-yl)-5-(2-cyclohexylethylsulfanylmethyl)oxolane-3,4-diol | TOP3 | 68593553 | −9.0 |
| 4-[[(2S,3S,4R,5R)-5-(6-aminopurin-9-yl)-3,4-dihydroxyoxolan-2-yl]methylsulfanylmethyl]-5-hydroxy-1,3-dihydroimidazol-2-one | TOP4 | 90743419 | −8.8 |
| 2-[1-(2-Amino-ethyl)-piperidin-4-ylsulfanylmethyl]-5-(6-amino-purin-9-yl)-tetrahydro-furan-3,4-diol | TOP5 | 67994427 | −8.7 |
| (2R,3R,4S,5S)-2-(6-aminopurin-9-yl)-5-(cyclohexylsulfanylmethyl)oxolane-3,4-diol | TOP6 | 44401867 | −8.6 |
| 2-(6-Aminopurin-9-yl)-5-(heptylsulfanylmethyl)oxolane-3,4-diol | TOP7 | 360632 | −8.6 |
| (3R,4S,5S)-2-(6-aminopurin-9-yl)-5-[(3-chlorocyclohexyl)sulfanylmethyl]oxolane-3,4-diol | TOP8 | 142801994 | −8.6 |
| 2-(6-Aminopurin-9-yl)-5-(piperidin-4-ylsulfanylmethyl)oxolane-3,4-diol | TOP9 | 56671175 | −8.5 |
| (2R,3R,4S,5R)-2-(6-aminopurin-9-yl)-5-(2-cyclohexylsulfanylethyl)oxolane-3,4-diol | TOP10 | 163984180 | −8.5 |
| Ligand (PubChem ID) | cLogP | Solubility | Mol wt | TPSA | nHA | nHD | nROT | Drug Likeness | Drug-Score |
|---|---|---|---|---|---|---|---|---|---|
| 439176-3XV | −0.66 | −3.21 | 297.0 | 144.6 | 8 | 4 | 3 | −6.21 | 0.45 |
| 142801950-TOP1 | 1.69 | −4.96 | 393.0 | 144.6 | 8 | 4 | 5 | −5.21 | 0.33 |
| 134460148-TOP2 | −0.69 | −1.33 | 430.0 | 214.2 | 13 | 6 | 5 | −5.56 | 0.42 |
| Activity | 3XV | TOP1 | TOP2 | |
|---|---|---|---|---|
| A (Absorption) | Human intestinal absorption (HIA) | Positive | Positive | Positive |
| Human oral bioavailability (HOB) | Negative | Negative | Negative | |
| Caco-2 permeability | Negative | Negative | Negative | |
| D (Distribution) | Plasma protein binding (PPB) | 0.369297683 | 0.358286798 | 0.103410304 |
| P-glycoprotein substrate, inhibitor: | ||||
| Negative | Negative | Negative | |
| Negative | Negative | Negative | |
| Blood-brain barrier penetration (BBB) | Positive | Positive | Positive | |
| M (Metabolism) | Cytochrome P450 (CYP450) substrate, inhibitor: | |||
| ||||
| Negative | Negative | Negative | |
| Negative | Negative | Negative | |
| Negative | Positive | Negative | |
| ||||
| Negative | Negative | Negative | |
| Negative | Negative | Negative | |
| Negative | Negative | Negative | |
| Negative | Negative | Negative | |
| Negative | Negative | Negative | |
| Pharmacokinetics transporters: | ||||
| Negative | Negative | Negative | |
| Negative | Negative | Negative | |
| Negative | Negative | Negative | |
| Negative | Negative | Negative | |
| Negative | Negative | Negative | |
| Positive | Positive | Positive | |
| Positive | Positive | Positive | |
| Negative | Negative | Negative | |
| E (Excretion) | Renal clearance | −6.21 | −5.21 | −5.56 |
| T (Toxicity) | Organ toxicity: | |||
| Negative | Negative | Negative | |
| Negative | Negative | Negative | |
| 1.401126266 | 2.040514946 | 1.306819558 | |
| Negative | Negative | Negative | |
| Negative | Negative | Negative | |
| Genomic toxicity | ||||
| Negative | Negative | Negative | |
| Negative | Negative | Negative |
| Ligand (PubChem ID) | Van der Waal’s Energy (kJ/mol) | Electrostatic Energy (kJ/mol) | Polar Solvation Energy (kJ/mol) | SASA Energy (kJ/mol) | Binding Energy (kJ/mol) |
|---|---|---|---|---|---|
| 439176 (5′-Deoxy-5′-methylthioadenosine/3XV) | −157.100 ± 13.755 | −102.672 ± 11.317 | 151.090 ± 19.812 | −16.653 ± 1.103 | −125.335 ± 19.668 |
| 142801950 ((3R,4S)-2-(6-aminopurin-9-yl)-5-[(4-ethylcyclohexyl)sulfanylmethyl]oxolane-3,4-diol/TOP1) | −203.684 ± 6.001 | −55.851 ± 8.950 | 149.935 ± 19.952 | −20.494 ± 0.872 | −130.095 ± 16.505 |
| 134460148 (2-(6-Aminopurin-9-yl)-5-[(6-aminopurin-9-yl)methylsulfanylmethyl]oxolane-3,4-diol/TOP2) | −230.417 ± 11.119 | −35.603 ± 8.672 | 140.677 ± 19.708 | −23.157 ± 1.075 | −148.501 ± 13.847 |
Disclaimer/Publisher’s Note: The statements, opinions and data contained in all publications are solely those of the individual author(s) and contributor(s) and not of MDPI and/or the editor(s). MDPI and/or the editor(s) disclaim responsibility for any injury to people or property resulting from any ideas, methods, instructions or products referred to in the content. |
© 2024 by the authors. Licensee MDPI, Basel, Switzerland. This article is an open access article distributed under the terms and conditions of the Creative Commons Attribution (CC BY) license (https://creativecommons.org/licenses/by/4.0/).
Share and Cite
Pokharel, B.; Ravikumar, Y.; Rathinavel, L.; Chewonarin, T.; Pongpom, M.; Tipsuwan, W.; Koonyosying, P.; Srichairatanakool, S. The Discovery of Selective Protein Arginine Methyltransferase 5 Inhibitors in the Management of β-Thalassemia through Computational Methods. Molecules 2024, 29, 2662. https://doi.org/10.3390/molecules29112662
Pokharel B, Ravikumar Y, Rathinavel L, Chewonarin T, Pongpom M, Tipsuwan W, Koonyosying P, Srichairatanakool S. The Discovery of Selective Protein Arginine Methyltransferase 5 Inhibitors in the Management of β-Thalassemia through Computational Methods. Molecules. 2024; 29(11):2662. https://doi.org/10.3390/molecules29112662
Chicago/Turabian StylePokharel, Bishant, Yuvaraj Ravikumar, Lavanyasri Rathinavel, Teera Chewonarin, Monsicha Pongpom, Wachiraporn Tipsuwan, Pimpisid Koonyosying, and Somdet Srichairatanakool. 2024. "The Discovery of Selective Protein Arginine Methyltransferase 5 Inhibitors in the Management of β-Thalassemia through Computational Methods" Molecules 29, no. 11: 2662. https://doi.org/10.3390/molecules29112662